\ul
What is Interpretable? Using Machine Learning to Design Interpretable Decision-Support Systems
Abstract
Recent efforts in Machine Learning (ML) interpretability have focused on creating methods for explaining black-box ML models. However, these methods rely on the assumption that simple approximations, such as linear models or decision-trees, are inherently human-interpretable, which has not been empirically tested. Additionally, past efforts have focused exclusively on comprehension, neglecting to explore the trust component necessary to convince non-technical experts, such as clinicians, to utilize ML models in practice. In this paper, we posit that reinforcement learning (RL) can be used to learn what is interpretable to different users and, consequently, build their trust in ML models. To validate this idea, we first train a neural network to provide risk assessments for heart failure patients. We then design a RL-based clinical decision-support system (DSS) around the neural network model, which can learn from its interactions with users. We conduct an experiment involving a diverse set of clinicians from multiple institutions in three different countries. Our results demonstrate that ML experts cannot accurately predict which system outputs will maximize clinicians’ confidence in the underlying neural network model, and suggest additional findings that have broad implications to the future of research into ML interpretability and the use of ML in medicine.
1 Introduction
Motivation: Machine Learning (ML) models have been shown in many cases to achieve higher predictive power than simpler statistical methods [1]. It is therefore easy to envision sophisticated, carefully calibrated ML models being utilized to support critical decision-making as in, e.g., [2], [3]. However, despite their ability to provide accurate predictions, ML models have not been heavily utilized in fields such as medicine and prognostic research [4] [5] [6].
One reason for this is the inherent complexity of black-box ML models like neural networks. Such models are powerful because of their ability to detect complex patterns in data, achieving high predictive accuracy. However, this makes them difficult to explain to non-experts in less technical fields. Users wishing to leverage predictive models for critical decision-making, such as medical risk prognosis, must be professionally and ethically able to justify their medical actions, explicitly linking inputs like patient characteristics to predicted outcomes [7]. Existing neural networks and other ML models do not readily provide for this. As a result, the ML research community has been paying increased attention to interpretability.
We define ML model interpretability as the extent to which a ML model can be made understandable to relevant human users, with the goal of increasing users’ trust in, and willingness to utilize, the model in practice. We argue that this focus on trustworthiness has been neglected from past literature but is absolutely vital - a comprehensible model is not useful unless it is also trusted. A more extensive discussion can be found in Appendix A.
A recent survey compiled an overview of methods used to explain black-box ML models [8]. To date, most research on ML interpretability focuses on developing methods we term interpretability modules, which run alongside existing black-box models to produce statistical explanations that are generally accepted as being easily understandable to humans. These methods range from ranking input features’ contributions to generating entirely new models that closely approximate the original black-box while using a simpler, supposedly easier-to-understand methodology such as linear regression (e.g., LIME [9], SLIM [10]), decision-trees [11] or logic rules [12].
These studies rely on important assumptions. First, it is assumed that feature rankings, linear models, or decision-trees are indeed interpretable, and that they consistently increase the utility of ML models for clinical users. This assumption appears overly simplistic – it is likely that interpretability is subjective, requiring different approaches for different users and in different contexts. Secondly, it is assumed that simply presenting the modules is enough to achieve interpretability. We argue that this is not enough: instead, interpretable systems require a user-in-the-loop design approach based on an interactive process enabling designers to convince people to trust and utilize ML-driven systems.
Limited work has investigated these assumptions and how different types of ML model evidence actually affect users’ trust [13] [14]. Our work differs from these recent efforts as we propose to use Reinforcement Learning (RL) to present different methods of interpretability and thus learn what is effectively interpretable to different users and, consequently, build their trust in ML models.
Contributions: We first train a neural network to provide risk assessments for heart failure patients. We then design a RL-based clinical decision-support system (DSS) around the neural network model. The DSS presents a sequence of interpretability modules and other forms of evidence about the underlying ML model to the user (e.g., information about the data-set, training methodology, and model accuracy, in addition to interpretability modules including local linear and decision-tree approximations). As users interact with the DSS, it learns to present an information sequence that maximizes users’ expected trust in the ML model using RL. We asked 14 clinicians111The authors would like to thank the medical doctors who have provided crucial consultations and participated in our experimental study. A partial list including affiliations can be found in Appendix B. and 30 ML experts from multiple institutions and countries to interact with our DSS. Clinicians rated their trust in the ML model as they used the system, while ML experts indicated if they believe that the presented information would increase the average clinician’s trust in the ML model. Our results lead to new findings that may have broad implications for the future of ML interpretability.
2 Interpretable Decision-Support System Design
Data-set and Model: Given the prevalence of heart disease globally, we elected to focus on developing a DSS to predict 1-year mortality risk for heart failure patients. We utilize the Meta-analysis Global Group in Chronic Heart Failure data-set, or MAGGIC, first used in the meta-analysis study of Popock et al. [15]. Leveraging patient data from 30 cohort studies, the data-set includes 30,389 heart failure patients, of whom 18.8% died within 1 year. The data-set contains 31 features per patient including patient characteristics such as age and body mass index (BMI), physical symptoms such as shortness of breath, and prescribed medications including ACE Inhibitors and Beta-blockers. Missing values were imputed using Multivariate Imputation by Chained Equations (MICE) [16].
Using this data-set, we trained several ML models, summarized in Table 1. We selected a simple implementation of a deep neural network, comprising two fully-connected layers of 100 and 20 nodes, which achieves good predictive performance among the other tested methods, including the MAGGIC Risk Score [15] that is currently used by clinicians. Since deep learning is increasingly popular and gaining interest in the medical community, yet is clearly a black-box without clearly comprehensible parameters, it is a good fit for our study.
| \rowcolor[HTML]C0C0C0 \ulModel | \ulAUC-ROC | \ulAUC-PR |
|---|---|---|
| Linear Regression | ||
| Random Forest | ||
| Gradient Boosting Machine | ||
| XGBoost | ||
| Neural Network | ||
| MAGGIC Risk Score |
Model Evidence and Expert Consultations: We aimed to identify the sequence of evidence that maximizes expected clinician trust in our DSS and the underlying ML model. Evidence can include general model information such as accuracy and architecture, individual predictions, and interpretability modules. Since the set of possible evidence is quite large, we applied expert heuristics to reduce the size of our search space. We consulted with 3 doctors, presenting them with lists of possible model evidence and asking for professional opinions regarding their relevance. We used these expert heuristics to eliminate the evidence that was judged to be unlikely to increase clinicians’ trust in the ML model. Though critical for reducing our search space to a tractable size, expert consultations may have introduced unintentional bias. Future experiments may elect to consult additional clinicians or forgo the use of heuristics to reduce bias. Table 2 summarizes the set of model evidence we included in our DSS. These have been divided in two parts to further reduce sample complexity: Overall Model Evidence and Specific Prediction Evidence. More details can be found in Appendix C.
| Survey Part | Model Information | Details |
|---|---|---|
| Part 1: Overall Model Information | Data | Data-set size, features list, feature statistics |
| Model Methodoloy | Training and implementation: Cross-validation, neural network architecture | |
| Model Accuracy | % Accuracy, AUC-ROC, PR-ROC | |
| Stratified Linear Approximations | Significant features of linear approximation models for each risk quintile (0-20%, 20-40%, etc.) | |
| Decision Tree Approximations | Diagram of decision tree approximation models for each risk quintile (0-20%, 20-40%, etc.) | |
| Part 2: Specific Prediction Information (For Data points/ patients in test set) | Prediction | Individual patient characteristics and resulting risk score for an individual data point/patient |
| Local Feature Sensitivity (Interactive) | Summary of how different patient features affect predicted risk score - interactive DSS component | |
| Patient Outcome | Did patient survive 1 year after heart failure event? (Was prediction accurate?) | |
| Local Linear Approximation | Coefficients of a local linear approximation model | |
| Local Decision Tree Approximation | Diagram of local decision tree model |
Reinforcement Learning Approach: In order to identify the sequence of model evidence that results in maximal expected user confidence, we model the problem as a multi-armed bandit [17] and solve it using the well-known Upper Confidence Bound (UCB1) algorithm [18], which is easy to implement in an online survey environment and has better sample complexity than naive approaches. In this context, we view relevant subsequences of evidence from Table 2 as arms, and a user’s rating of their trust/confidence in the model on a scale of 1-5 as the reward. We note that other algorithms for solving such RL problems exist, and can be utilized for addressing the DSS design problem. Future work may do well to experiment with other methods.
3 Experimental Results
We collected responses from 14 medical doctors who used our DSS and indicated their confidence in the system and underlying neural network model. In addition, we sought to compare the doctors’ results with the current beliefs of ML experts, and thus we asked 30 computer scientists with ML backgrounds to indicate their expectations regarding an average doctor’s confidence score. All responses have been normalized to the range , with 1 representing maximum confidence. The DSSs presented to clinicians and ML experts are available online at [19] and [20], respectively.
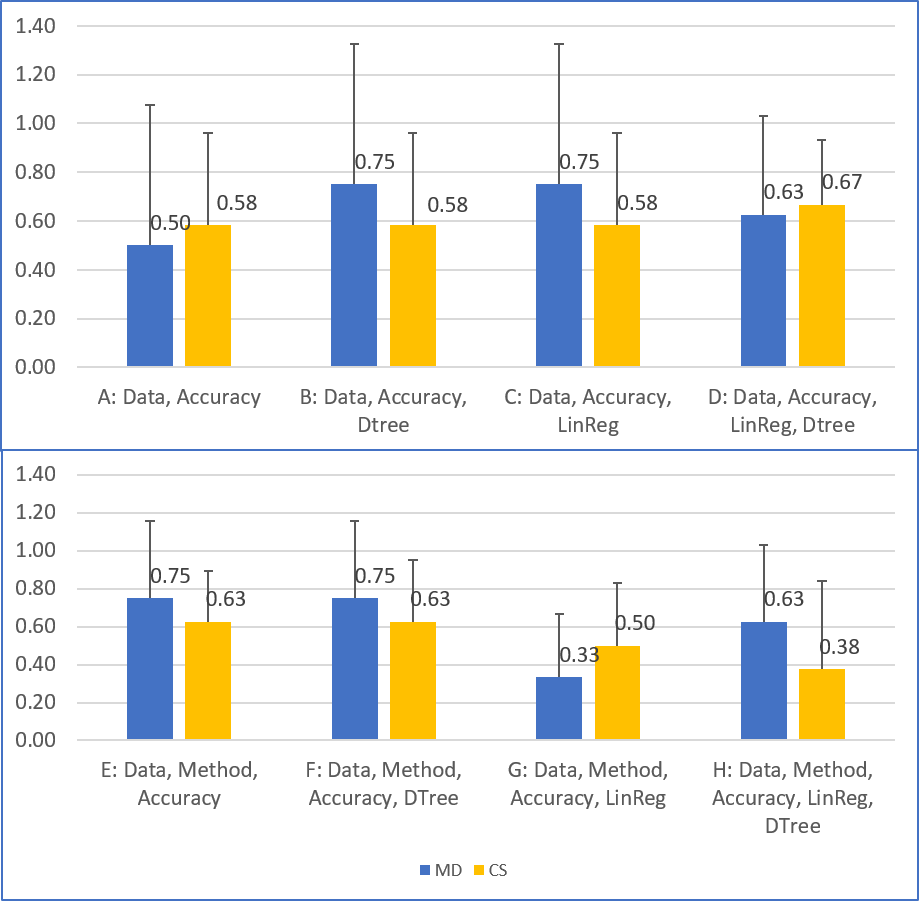
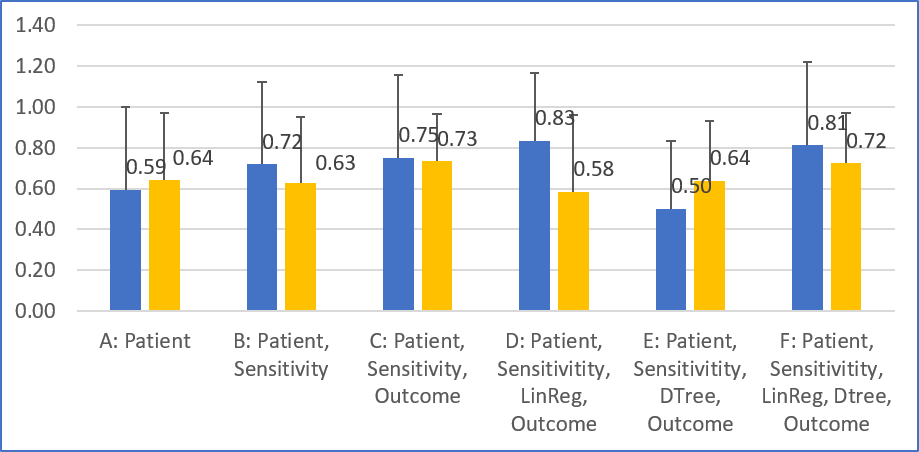
Fig. 1 presents the mean user confidence rating and upper confidence bound for each evidence sequence (“arm”) for both doctors and computer scientists. First, Fig. 1a reveals that ML experts are unable to accurately predict how different arms will affect doctors’ confidence. In particular, ML experts expect that sequence D, containing all evidence except methodology, will maximize doctors’ confidence; however, doctors show higher confidence based on four other arms. This supports our core hypothesis that interpretability requires an interactive process between users and system designers. Simply presenting an interpretability module does not suffice – users must be consulted to verify interpretations are acceptable, leading to utilization of the model in practice.
Fig. 1b reveals similar results. Focusing on arms A-C, the ability to interact with a DSS and examine how different features change a patient’s risk score, representing feature sensitivity, appears to have a high impact on doctors’ confidence. On the other hand, adding patient outcomes resulted in a smaller, marginal increase in confidence. This is in sharp contrast to ML experts, who predicted the opposite trend. This further supports the hypothesis that there is a divergence between what ML experts believe will lead to interpretability and results in practice.
Second, we find that more evidence does not always improve users’ trust, despite our initial hypothesis that information is super-additive. In fact, the longest sequence of evidence in Part 1 (H) results in lower average confidence than shorter arms. This suggests ‘information overload’ is possible, i.e., more evidence may cause confusion, reducing trust [21]. Thus, attempts at achieving interpretability should not simply provide more information, but rather more effective information.
In appendix D, we present further analysis based on the average confidence scores given to individual pieces of model evidence (rather than the entire sequences).
4 Conclusion
In this work we take a first step toward addressing a fundamental limitation of existing ML interpretability research. While important progress has been made towards developing interpretability modules to increase the comprehensibility of black-box ML models, these modules have not been empirically tested by end-users who must trust the underlying models in practice. We have proposed an approach to designing human-interpretable systems using RL to learn what is interpretable to users. To demonstrate our approach, we designed a ML-driven DSS providing medical risk assessment, and collected feedback about the system from both clinicians and ML experts.
Our results provide important insights into interpretability, revealing that system designers cannot predict what information will build the end-user’s trust in the system, creating a significant barrier to ML models being used in practice. Our next step is to recruit more clinicians and ML experts to interact with our DSS so we can obtain statistically significant results.
There are many opportunities for future research. Our proposed framework could be applied for different ML models (e.g., random forests or SVMs), different interpretability modules (e.g., associated classifiers [12] or DeepLIFT [22]), different applications (e.g., finance or autonomous vehicles), or even different user interfaces, all of which we believe may affect interpretability. We foresee this work as but a first step in the right direction – learning what is interpretable using sophisticated RL techniques to design trustworthy ML-driven DSSs that clinicians are willing to use in practice.
References
- [1] A. K. Waljee and P. D. R. Higgins, “Machine learning in medicine: A primer for physicians,” The American Journal of Gastroenterology, vol. 105, no. 6, p. 1224–1226, 2010.
- [2] A. Esteva, B. Kuprel, R. A. Novoa, J. Ko, S. M. Swetter, H. M. Blau, and S. Thrun, “Dermatologist-level classification of skin cancer with deep neural networks,” Nature, vol. 542, no. 7639, p. 115–118, 2017.
- [3] V. Gulshan, L. Peng, M. Coram, M. C. Stumpe, D. Wu, A. Narayanaswamy, S. Venugopalan, K. Widner, T. Madams, J. Cuadros, and et al., “Development and validation of a deep learning algorithm for detection of diabetic retinopathy in retinal fundus photographs,” Jama, vol. 316, no. 22, p. 2402, 2016.
- [4] T. J. Cleophas and A. H. Zwinderman, Machine Learning in Medicine - a Complete Overview. Springer International Publishing Switzerland, 2015.
- [5] I. Kononenko, “Machine learning for medical diagnosis: history, state of the art and perspective,” Artificial Intelligence in Medicine, vol. 23, no. 1, p. 89–109, 2001.
- [6] F. Cabitza, R. Rasoini, and G. F. Gensini, “Unintended consequences of machine learning in medicine,” Jama, vol. 318, p. 517, Aug 2017.
- [7] Z. Obermeyer and E. J. Emanuel, “Predicting the future — big data, machine learning, and clinical medicine,” New England Journal of Medicine, vol. 375, no. 13, p. 1216–1219, 2016.
- [8] R. Guidotti, A. Monreale, S. Ruggieri, F. Turini, D. Pedreschi, and F. Giannotti, “A survey of methods for explaining black box models,” CoRR, vol. abs/1802.01933, 2018.
- [9] M. T. Ribeiro, S. Singh, and C. Guestrin, “"why should i trust you?" explaining the predictions of any classifier,” Proceedings of the 22nd ACM SIGKDD International Conference on Knowledge Discovery and Data Mining - KDD 16, 2016.
- [10] W. R. Zame, J. Yoon, F. W. Asselbergs, and M. van der Schaar, “Interpretable machine learning identifies risk predictors in patients with heart failure,” American Heart Association (AHA) Scientific Sessions, 2018.
- [11] M. W. Craven and J. W. Shavlik, “Extracting tree-structured representations of trained networks,” in Proceedings of the 8th International Conference on Neural Information Processing Systems, NIPS’95, (Cambridge, MA, USA), pp. 24–30, MIT Press, 1995.
- [12] G. Luo, “Automatically explaining machine learning prediction results: a demonstration on type 2 diabetes risk prediction,” Health Information Science and Systems, vol. 4, Aug 2016.
- [13] M. Yin, J. W. Vaughan, and H. Wallach, “Does stated accuracy affect trust in machine learning algorithms?,” CoRR, vol. abs/1806.07004, 2018.
- [14] D. Collaris, L. Vink, and J. van Wijk, “Instance-level explanations for fraud detection: A case study,” CoRR, vol. abs/1806.07129, 2018.
- [15] S. J. Pocock, C. A. Ariti, J. J. Mcmurray, A. Maggioni, L. Køber, I. B. Squire, K. Swedberg, J. Dobson, K. K. Poppe, G. A. Whalley, and et al., “Predicting survival in heart failure: a risk score based on 39 372 patients from 30 studies,” European Heart Journal, vol. 34, no. 19, p. 1404–1413, 2012.
- [16] S. V. Buuren and K. Groothuis-Oudshoorn, “Mice: Multivariate imputation by chained equations in r,” Journal of Statistical Software, vol. 45, no. 3, 2011.
- [17] J.-Y. Audibert, S. Bubeck, and R. Munos, “Best arm identification in multi-armed bandits,” January 2010.
- [18] P. Auer, N. Cesa-Bianchi, and P. Fischer, “Finite-time analysis of the multiarmed bandit problem,” Machine Learning, vol. 47, no. 2, p. 235–256, 2002.
- [19] “Machine learning in prognostic decision-support systems study.” https://mlindecisionsupport.github.io/. Accessed: 2018-09-26.
- [20] “Machine learning in prognostic decision-support systems study - computer science perspective.” https://mlinterpretability.github.io/. Accessed: 2018-09-26.
- [21] G. A. Miller, “The magical number seven, plus or minus two: Some limits on our capacity for processing information.,” Psychological review, vol. 63, no. 2, p. 81, 1956.
- [22] A. Shrikumar, P. Greenside, and A. Kundaje, “Learning important features through propagating activation differences,” CoRR, vol. abs/1704.02685, 2017.
- [23] A. Karim, A. Mishra, M. H. Newton, and A. Sattar, “Machine learning interpretability: A science rather than a tool,” CoRR, vol. abs/1412.6980, Jul 2018.
Appendix A Appendix: Definitions of Interpretability
Currently, there is no universally accepted definition of interpretability [23]. A recent comprehensive survey of ML interpretability methods defines ML interpretability as the extent to which “the model and/or its predictions are human understandable,” and highlights two additional desiderata for interpretable models: accuracy and fidelity [8].
We believe there is an important factor missing from the discussion, which stems from the very goal of ML modeling: producing trustworthy predictions. A ML model that has high fidelity, high accuracy, and provides highly understandable predictions has limited value if its target users, such as clinicians, do not trust it and are thus unwilling to readily use the model and its predictions in practice.
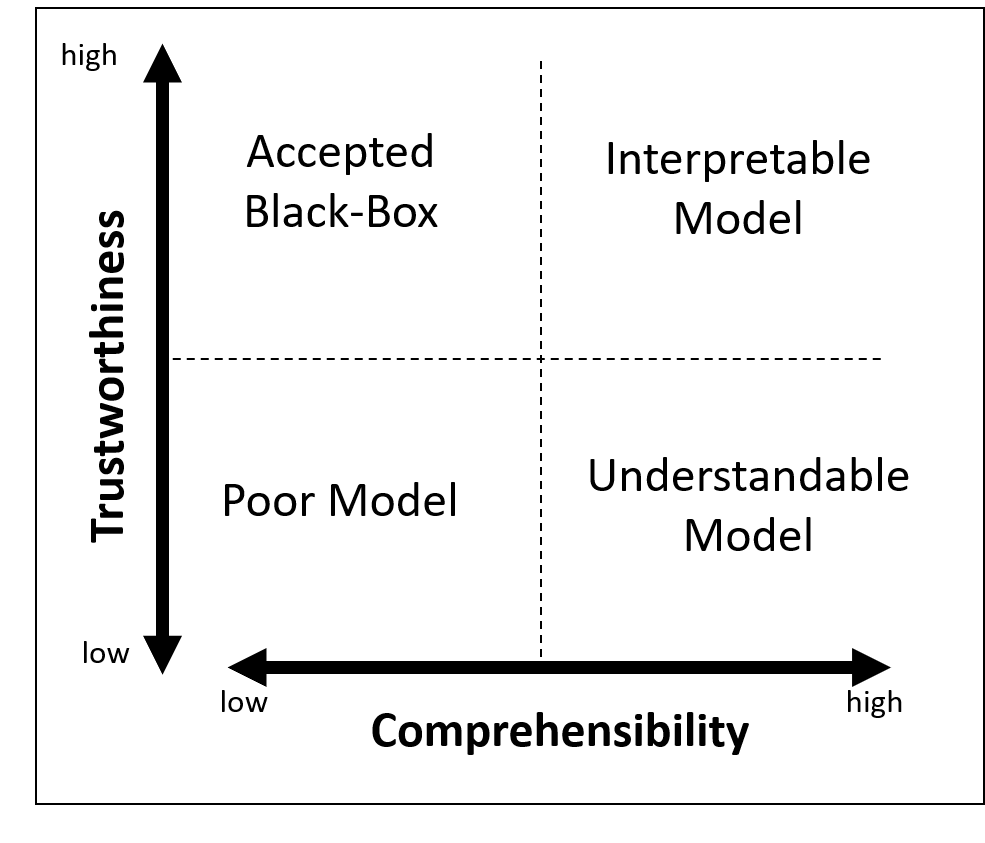
As seen in Fig. 2, our model of interpretability comprises two dimensions: comprehensibility and trustworthiness. Existing interpretability modules address the first dimension [8], but neglect to verify that the corresponding ML models will be trusted and utilized by their intended users.
Our approach to interpretability addresses this shortcoming. Having developed a deep neural network model (see Section 2) and corresponding interpretability modules, including local decision-trees and linear model approximations (see Appendix C), we explicitly measure user trust/confidence through our experiments. This allows us to attain a model that is both comprehensible and trustworthy, and therefore truly interpretable.
Appendix B Appendix: Study Participants
We recruited multiple experts from a variety of fields of expertise, institutions, and nations. Our efforts are a first-step towards an extensive and important collaboration between the ML and medical research communities globally.
Below we present details on some of the collaborators who have either participated as experts commenting on our experimental design and providing expert heuristics, or else contributed by completing our online survey tool and providing valuable data-points from which our algorithm could learn the optimal path to interpretability. Additional medical experts have participated anonymously.
| \rowcolor[HTML]C0C0C0 Profile and Expertise | Nation |
|---|---|
| MD, Cardiology | Europe |
| MD, Cardiology, Internal Medicine | USA |
| MD, Experimental, Diagnostic and Specialty Medicine | Europe |
| MD, Neonatal Medicine | Europe |
| MD, Immunology | Europe |
| MSc, Biomedical and Behavioral Research | Europe |
| MD, Gastroenterology | Europe |
| MD, Primary Care, Public Health | Europe |
| MD, Hospitalist, Internal Medicine | USA |
Appendix C Appendix: Model Evidence Details
The full list of model evidence included in our DSS and experiment is specified in Table 2. This evidence was arranged into arms as part of our multi-armed bandit approach to reduce sample complexity. Table 4 summarizes the various arms tested. Note that the tested arms were not exhaustive – some arms were removed based on consultations with 3 medical experts, and we did not test the effect of order on the sequence of evidence as this would increase the number of arms exponentially. Future experiments may do well to test this factor.
| \ulPart 1 | Evidence Sequence | |||||||
| \rowcolor[HTML]C0C0C0 Evidence Type | A | B | C | D | E | F | G | H |
| Data | X | X | X | X | X | X | X | X |
| Model Training and Implementation | X | X | X | X | ||||
| Model Accuracy | X | X | X | X | X | X | X | X |
| Linear Approximations Coefficients | X | X | X | X | ||||
| Decision-Tree Approximations | X | X | X | X | ||||
| \ulPart 2 | Evidence Sequence | |||||||
| \cellcolor[HTML]C0C0C0Evidence Type | \cellcolor[HTML]C0C0C0A | \cellcolor[HTML]C0C0C0B | \cellcolor[HTML]C0C0C0C | \cellcolor[HTML]C0C0C0D | \cellcolor[HTML]C0C0C0E | \cellcolor[HTML]C0C0C0F | ||
| Patient Information | X | X | X | X | X | X | ||
| Sensitivity/Interactive Component | X | X | X | X | X | |||
| Local Linear Model Coefficients | X | X | ||||||
| Local Decision-Tree Diagram | X | X | ||||||
| Patient Outcome | X | X | X | X | ||||
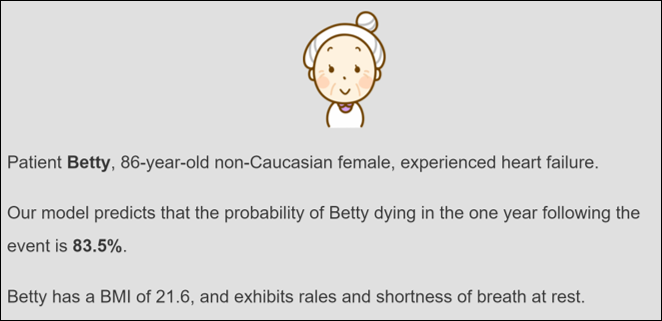
Some of the model evidence chosen to display to prospective users in order to increase their confidence in our neural network is presented in Fig. 3. This evidence includes individual patient scenarios and three interpretability modules, i.e., local linear model approximations, local decision-tree approximations, and a feature sensitivity component.
We presented four individual patient scenarios to every user. These patients were not part of the training data-set, and are shown with salient characteristics such as age, gender, medical conditions and prescribed medications. They have been embellished with fictional patient names and images, as seen in Fig. 3a, to make them more personally relevant to doctors. The patients’ predicted risk-scores range from 15% to 85%, and they are representative of the data-set and overall population. Each patient scenario was accompanied with up to three intepretability modules.
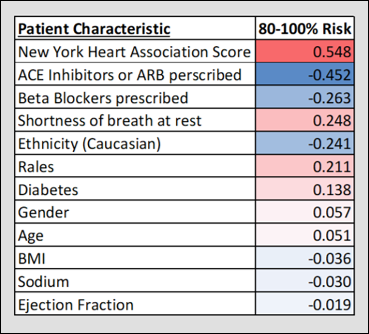
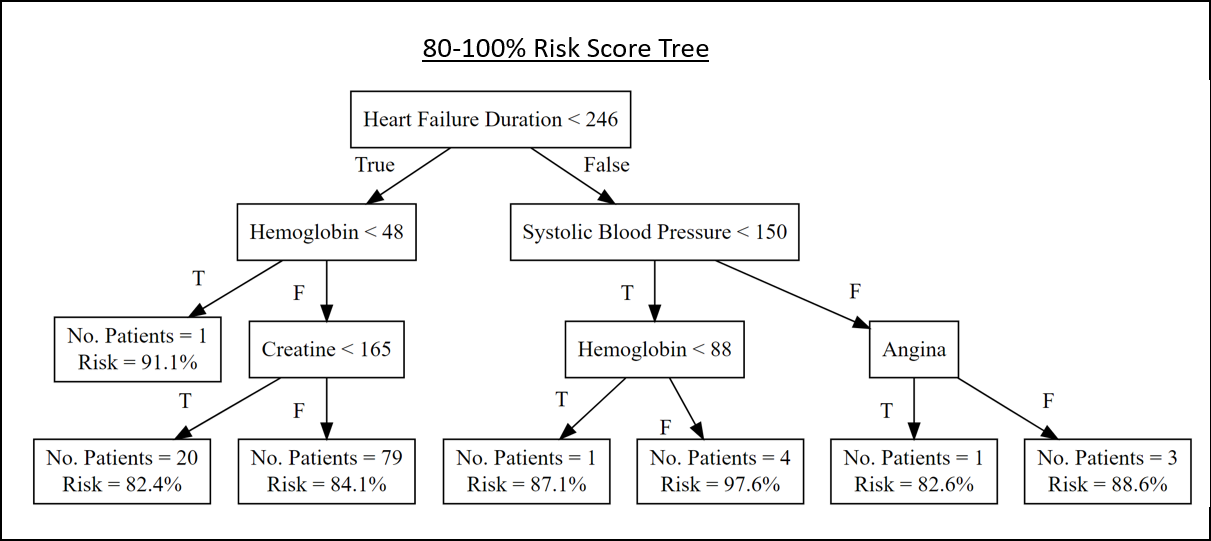
Linear model approximations were trained using the Stratified Linear Model (SLIM) methodology [10], which improves upon Local Interpretable Model-agnostic Explanations (LIME) [9]. We first used our neural network to partition the training set into risk strata, electing equal quintiles of 0-20%, 20-40%, etc. Then, a separate linear regression model was trained for each stratum, and the significant coefficients were presented. Fig. 3b represents the linear model coefficients for the 80-100% stratum. Decision-tree approximations were similarly trained on risk quintiles, and were capped at a depth of 3. Fig. 3c represents the local decision-tree for the 80-100% stratum.
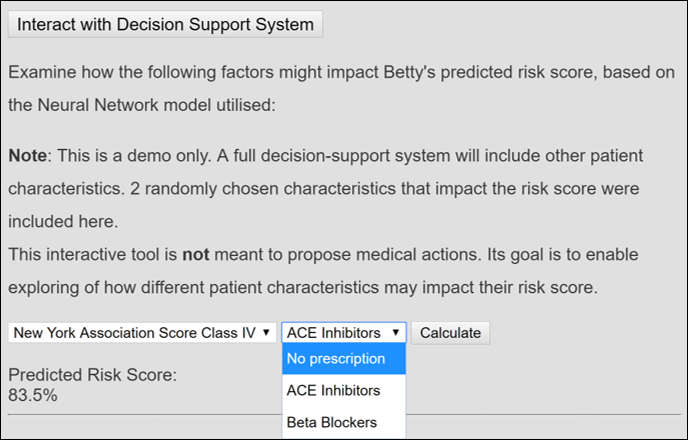
An interactive feature sensitivity module was implemented as a drop-box, as shown in Figure 3d, which allows doctors to interact with the DSS by observing how two randomly selected features can affect the patient’s predicted risk. The values were pre-selected and pre-calculated based on the neural network created in Section 2. We did not use the full list of features and possible values due to the computational complexity of re-generating a neural network prediction as part of a web survey, but this is not necessarily a limitation of our approach and future implementations may allow for more sophisticated user interactions with the DSS.
Appendix D Appendix: Individual Evidence Analysis
In addition to evaluating the full sequences of model evidence captured by each arm, as shown in Fig. 1, this appendix presents an examination of the effects of each individual type of model evidence on user confidence. In Part 1, we ask respondents to rate how useful they find each piece of model evidence that they encounter. Fig. 4a summarizes the average and confidence interval of the responses for clinicians and ML experts for Part 1 of our experiment, which focuses on general model evidence.
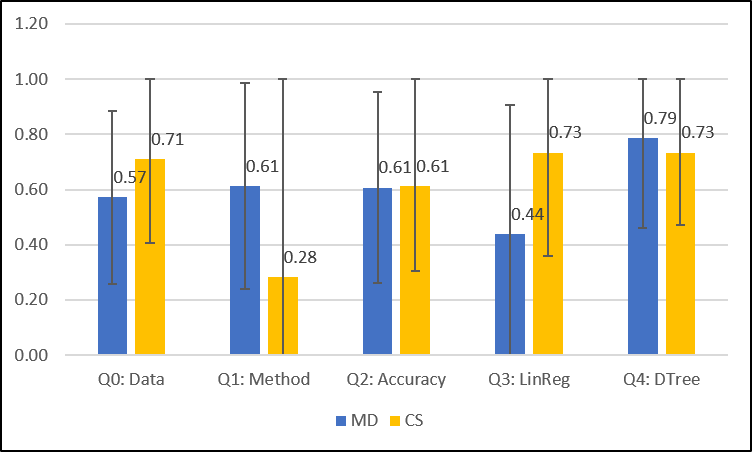
Doctors appear to find linear model approximations to our neural network the least useful type of evidence. This is in contrast to computer scientists, who believed linear model approximations will have a much higher impact on doctors’ confidence, comparable to decision-trees. This suggests that, although the ML research community has been putting significant effort into constructing linear models that represent close approximations to black-box models [9] [10] these solutions may only provide limited interpretability in practice.
In addition, computer scientists appear to be skeptical about the value of methodology, giving it a low rating. Conversely, doctors rate information about methodology nearly as high as data-set details, suggesting that doctors find information about model training and architecture useful even as the designers feel this information might be too complicated for non-experts, and thus unnecessary.
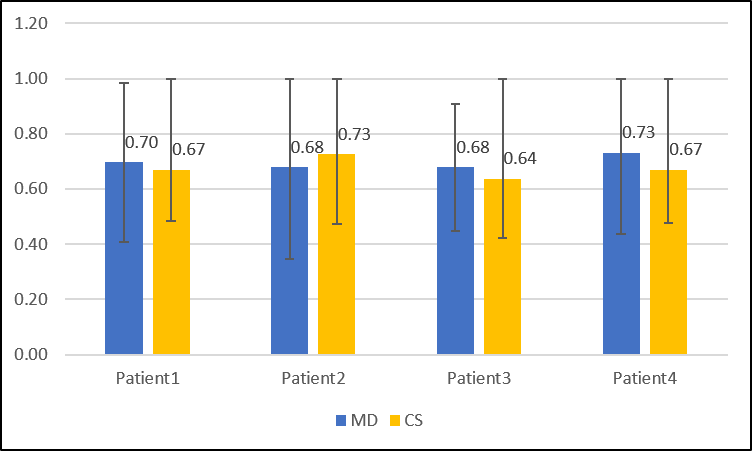
Similarly, we can analyze individual responses from Part 2, per patient. Fig. 4b shows these results. It is interesting to note that there are no clear patterns in this figure, and average confidence values are close both across user contexts and across different patients. The fact that there are no significant differences between the results of ML experts and doctors is particularly surprising, as doctors have much more expertise and understanding of patient characteristics.
Additionally, the lack of trend across patients suggests that showing four patients to each user does not necessary lead to an increase in confidence. This suggests that repeated exposure to multiple sample data-points may not be necessary in building model trust.
Though these findings require validation using additional data, we believe that they may have important implications for future developments in ML interpretability using our RL-based approach.