Highlight of top quark properties measurements at ATLAS/CMS
Abstract:
The top quark is the heaviest known elementary particle and plays a special role in the dynamics of fundamental interactions. Since its discovery at the Tevatron, several of its properties have been measured by the Tevatron experiments (CDF and DØ). However, thanks to its unprecedentedly large production rate at the LHC a new level of precision in these measurements has been achieved by the LHC experiments (ATLAS and CMS). The latest LHC measurements of the top quark mass, total decay width, top-antitop spin correlations, and charge asymmetry are presented in this contribution. In addition, the results from the W-boson helicity measurement are presented.
1 Introduction
Within the Standard Model (SM), the top quark is the weak-isospin partner of the bottom quark with charge and isospin quantum numbers Q = 2/3 and = +1/2 respectively. Being heavy, the top quark life-time is shorter than the hadronization time-scale and thus it provides a unique opportunity to study the bare quark. Furthermore, due to its large mass the top Yukawa coupling to the Higgs boson is of the order of unity and has direct implication on the Higgs boson mass. In addition, many beyond the Standard Model (BSM) particles are predicted to decay through top/antitop quarks. All these characteristics of the top quark make it special in the SM and in many extensions thereof. It was discovered jointly by the CDF and DØ experiments during Tevatron’s Run 1 (1992-95). Since then many of its properties (mass, couplings, production cross-section, decay widths, charge asymmetry, spin correlation, etc.) have been studied extensively during Tevatron’s Run 1 and Run 2 (2002-11).
At the LHC, the top quarks are predominantly produced in pairs of top and antitop quarks () through strong interactions. In addition, they can be produced through electroweak interactions at a relatively lower production rate. Within the Standard Model, the top quark decays into a W-boson and a bottom quark with almost 100% branching fraction and thus the final state signature gets driven by the decay modes of the W-boson. In the subsequent sections, the latest LHC results on top quark properties by the ATLAS [1] and CMS [2] collaborations are presented using the top quark sample from LHC Run 1 and Run 2 (at center of mass energies, = 7, 8, and 13 TeV). The LHC Top Working Group [3] has combined some of these results and the combined sensitivity is also presented here whenever it is available.
2 Top Charge Asymmetry
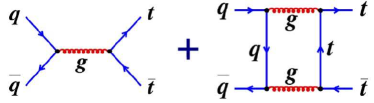
Leading Order (LO) Quantum Chromodynamics (QCD) predicts a completely symmetric pair production at hadron collider, i.e., the top (antitop) quarks do not have any preferential direction with respect to the initial quarks (anti-quarks). The contributions from gluon-gluon fusion processes, i.e., are also completely symmetric and thus dilute the overall charge asymmetry. However, at next-to-leading order (NLO) QCD [4], an asymmetry originates from the interference of different Feynman diagrams as shown in Fig. 1. The charge asymmetry can further get enhanced through contributions from the BSM physics, e.g., exchange of axigluons, heavy Z particles, or colored Kaluza-Klein gluon excitations [5].
 |
 |
| (a) | (b) |
In recent times, the legacy measurements by the Tevatron experiments (using semileptonic and dileptonic events) show some deviations [6] from the SM QCD predictions in terms of forward-backward asymmetry (). However, at the LHC, being a proton-proton collider with much higher center-of-mass energy, the becomes undefined and a related charge asymmetry () is considered using the absolute rapidity differences between the top and antitop quarks,
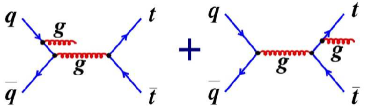
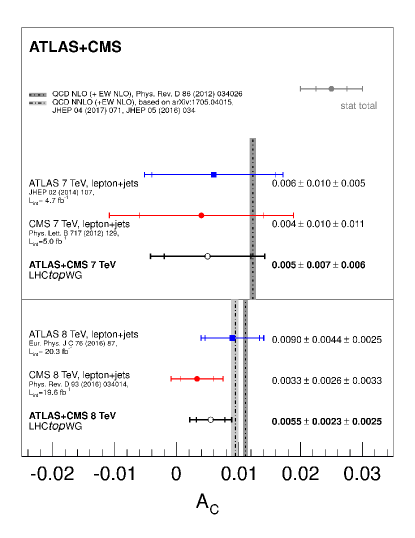
where with being the rapidities of top and antitop quarks. ATLAS has performed the measurements [7] in the dilepton channel using the Run 1 dataset ( = 8 TeV), where inclusive and leptonic asymmetries respectively result in and . In addition, the differential measurements are performed as functions of the invariant mass of the system (), the transverse momentum of the system (), and the absolute boost of the system along the beam axis (). Using the 2012 dataset, CMS observes [8] the values of and , respectively for the and leptonic inclusive charge asymmetries. In the lepton+jets channel, the ATLAS measurements [9] in a fiducial region with and lead to a value of . With the template techniques, the CMS measurements [10] in the lepton+jets channel using the of the Run 1 dataset (at = 8 TeV) lead to the most accurate value of . The LHC Top Working Group has recently combined all the Run 1 legacy results from the ATLAS and CMS experiments using the Best Linear Unbiased Estimator (BLUE) and has reported [11] the inclusive and differential measurements on as shown in Fig. 2. In summary, all the charge asymmetry results (at inclusive and differential levels) from the ATLAS and CMS experiments using the Run 1 legacy datasets are consistent with the SM predictions.
 |
 |
| (a) | (b) |
3 Top Spin Correlation
In the QCD-dominated production process, the SM predicts only a small net polarization for the top quarks originating from the electroweak corrections, but the spins of the top and antitop quarks are expected to be correlated. However, the BSM couplings [12] of the top quark to new particles can significantly alter both the top quark polarization and the strength of the spin correlation. Therefore, a precise measurement of the spin correlation can probe the top quark couplings to the BSM particles.
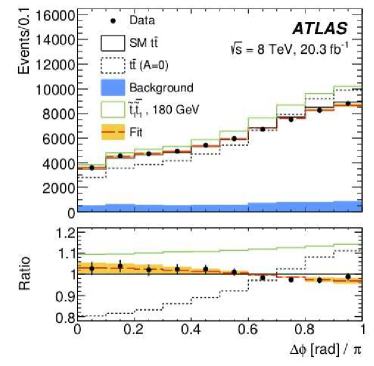
In pair produced events, the spin orientations of the top and antitop quarks are manifested through the decay products and thus the spin correlation can be measured directly through their angular distributions. In dileptonic signatures of the events, the difference in azimuthal angle between the charged leptons in the laboratory frame, is sensitive to the spin correlation and can be measured precisely without the full reconstruction of event kinematics. The reconstructed distributions can then be utilized to extract a coefficient, , to measure the degree of spin correlation relative to the SM prediction. Here, the and respectively represent the numbers of events with the SM-predicted spin correlation and without any spin correlation. A negative value of would indicate an anti-correlation between top and antitop quark spins, while would indicate the SM-predicted spin correlation.
 |
 |
| (a) | (b) |
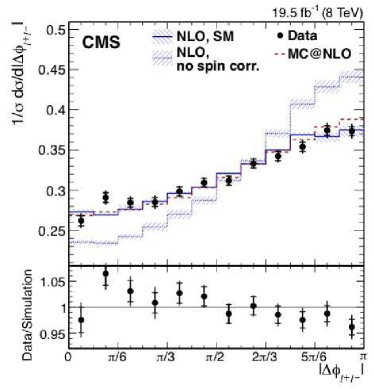
Both ATLAS [13] and CMS [14] have measured the spin correlation in the dilepton channels, and the corresponding distributions are shown in Fig. 3. ATLAS uses a binned likelihood method to extract a combined (, , ) fit value of , which agrees with the SM prediction within two standard deviations. The observed distribution is utilized to look for the top squark pair production () signature with decays. However, no evidence for production has been found and the range of GeV has been excluded at 95% Confidence Level (CL) assuming BR()=100% and =1 GeV.
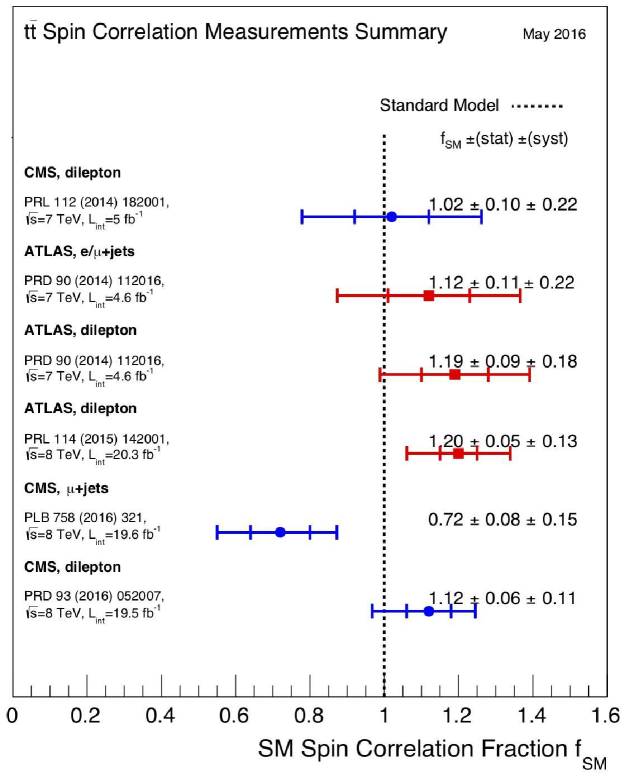
CMS on the other hand performs differential measurements in bins of to reduce the systematic uncertainty associated to top quark modeling, while exploring two other observables, i.e., (the cosine of the opening angle between two lepton momenta measured in the rest frames of their respective parent quarks, top or antitop), and (the product of the cosines of the helicity angles of the leptons). Overall, CMS observes a value of , which is in good agreement with the SM prediction. CMS translates the spin correlation measurement to set exclusion limits on the chromo-magnetic dipole moment. Here, the values outside the intervals 0.0530.026 and 0.0680.067 are excluded at 95% CL. All the spin correlation measurements so far performed by the LHC experiments are summarized in Fig. 4.
4 Top Decay Width
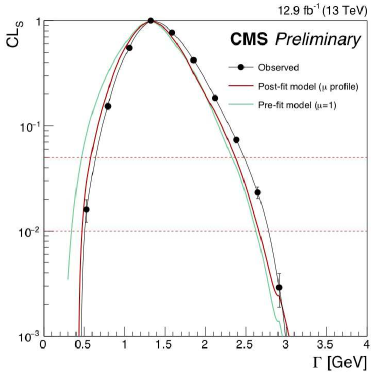
Being quite heavy the top quark has a large decay width (). Within the SM, the Next-to-next-to-leading-order (NNLO) calculations predict of 1.322 GeV for a top quark mass () of 172.5 GeV and =0.1189 [15]. CMS has recently utilized the dilepton events from of the Run 2 dataset (at = 13 TeV) to constrain the total decay width of the top quark through direct measurement. The analysis is based on a reconstructed observable, , i.e., the invariant mass of the lepton-jet (b-tagged) system. The constraint on has been drawn through a two dimensional likelihood fit where the signal strength () and the sample fraction for an alternative width hypothesis (denoted x) are varied. As shown in Fig. 5(a), the likelihood fit provides an observed (expected) bound of GeV at 95% confidence level [16].
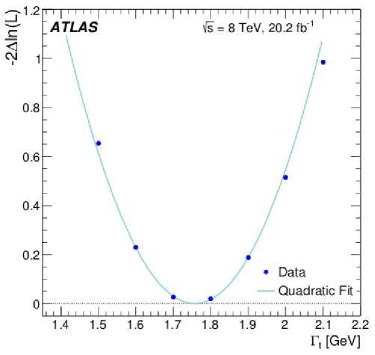
ATLAS performed a more refined measurement of top quark decay width using the lepton+jets events from of the Run 1 dataset at = 8 TeV. Here, the template fitting method uses various kinematic observables associated with the hadronically and semileptonically decaying top quarks. As shown in Fig. 5(b), the measurement yields a value of (syst) GeV (for =172.5 GeV) [17], in good agreement with the SM predicted value. However, the measurement is limited by the systematic uncertainties from jet energy scale/resolution and signal modeling.
5 W-boson Helicity
Within the SM the top quarks decays exclusively into a W-boson and a b-quark and the weak Wtb vertex has a (V-A) structure, where V and A respectively refer to the vector and axial vector components of the weak coupling. As the W-boson appears as a real particle in the top quark decays, its polarization can be measured using the events. Here, the W-boson helicity fractions (left-handed, right-handed and longitudinal) are defined as , where are the partial decay widths in left-handed, right-handed, and longitudinal helicity states respectively, with being the total decay width. The SM next-to-next-to-leading order (NNLO) calculations [18] including the electroweak effects predict the values of , and , for a top quark mass of GeV. Experimentally, the helicity angle can be defined as the angle between the direction of either the down-type quark or the charged lepton arising from the W-boson decay and the reversed direction of the top quark, both in the rest frame of the W-boson. The differential cross-sections as a function of can then be written as
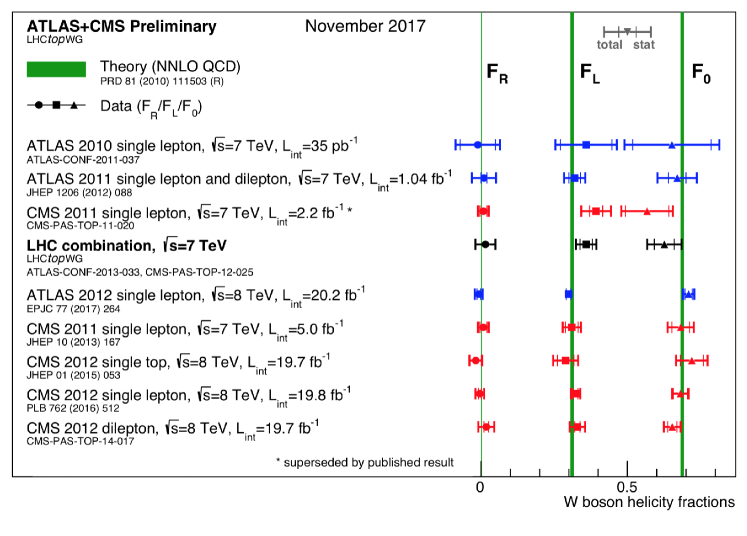
Both ATLAS and CMS have performed the measurements using lepton+jets events based on and datasets respectively from 2012 LHC operations. The observable related to the W-boson helicity fractions, , is reconstructed considering the leptonic () and hadronic () decay branches of the top quark. The CMS measurements [19] result in , and , while the ATLAS observes [20] the values of , and . Fig. 6 shows all the measurements from ATLAS and CMS during the LHC Run 1, along with the combined measurements (at = 7 TeV).
6 Top Quark Mass
The top quark mass, is a key parameter in the SM and is the major contributor to the Higgs boson mass () through radiative corrections. Therefore, the accuracy on both and measurements is quite crucial for the consistency tests of the SM. Starting from the Tevatron experiments, the top quark mass has so far been measured with increasing precision using multiple final states, as well as with different analysis techniques. Two of the most recent measurements from CMS and ATLAS experiments are presented here.
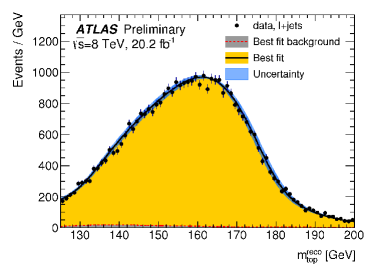
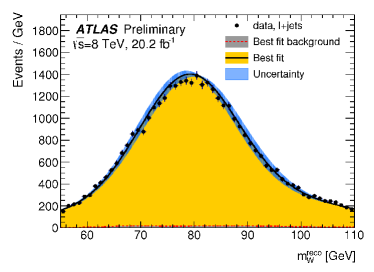
ATLAS has recently performed a top quark mass measurement [21] in lepton+jets final states using a dataset at = 8 TeV. The full event reconstruction is performed using a likelihood based kinematic fitter, KLFITTER [22]. The lepton+jets event selection is further optimized through the usage of a boosted decision tree [23]. The top quark mass () together with the jet energy scale factor (JSF) and b-jet energy scale factor (bJSF) is then simultaneously extracted using the template fit technique. The template fit results in terms of and are shown in Fig. 7. The measurement yields a top quark mass of GeV, where the dominant uncertainties are driven by theoretical modeling and systematics.
 |
 |
| (a) | (b) |
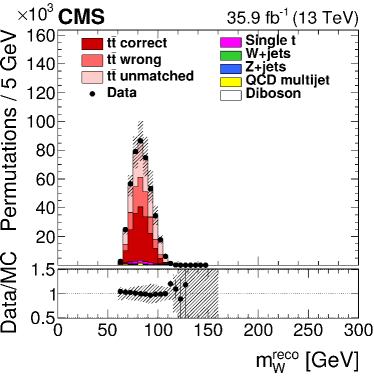
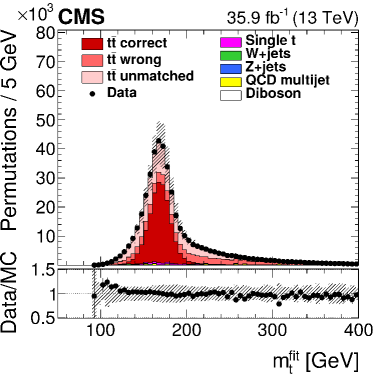
The latest measurement [25] from CMS is based on a dataset at = 13 TeV. The full lepton+jets event reconstruction is performed using a kinematic fit of the decay products. A 2-D ideogram fitting technique [24] is then applied to the data to measure the top quark mass simultaneously with an overall jet energy scale factor (JSF), constrained by (through decays); the fit results in terms of and are shown in Fig. 8. The ideogram method measures an value of GeV, in consistency with the Run 1 CMS measurements at = 7 and 8 TeV. The measurement results in a precision of 0.36% where the leading uncertainties originate from MC modeling, color reconnection, parton showering, JES, etc.
 |
 |
| (a) | (b) |
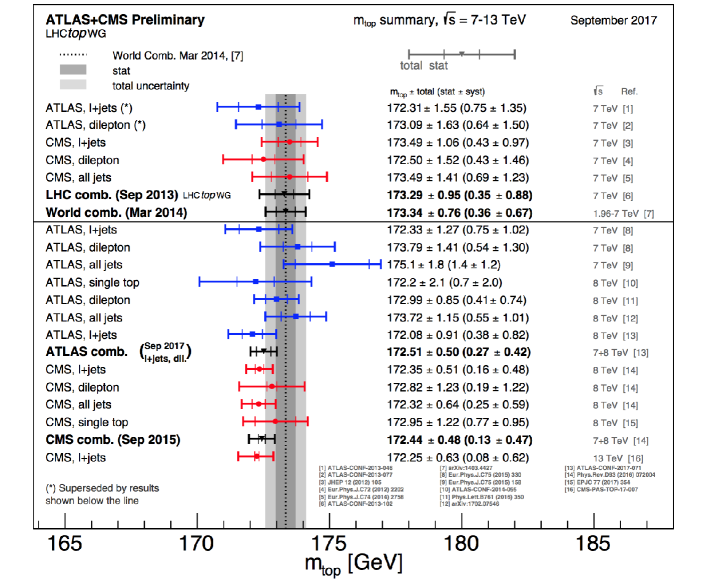
The most recent individual measurements from the LHC experiments, along with the world average value for are summarized in Fig. 9.
7 Conclusions
Some of the key measurements related to top quark properties from the ATLAS and CMS experiments have been presented here using pair production. The measurements are at large consistent with SM predictions and with enhanced statistical precision. The systematic uncertainties of these measurements are limited by the theoretical modeling (top mass, scale, matching scale, etc.). In addition, experimental uncertainties related to the jets (Jet Energy Scale, Jet Energy Resolution) affect the measurement precision. Further details about these measurements can be found in ATLAS and CMS web pages [26][27] collecting public results.
References
- [1] ATLAS Collaboration, JINST 3 S08003 (2008).
- [2] CMS Collaboration, JINST 3, S08004 (2008).
- [3] LHC Top Working Group:https://twiki.cern.ch/twiki/bin/view/LHCPhysics/LHCTopWG.
- [4] J. O. Antunano and G. Rodrigo, Phys. Rev. D 77 (2008) 014003.
- [5] J. L. Rosner, Phys. Lett. B 387 (1996) 113-117; P. Ferrario and G. Rodrigo, Phys. Rev. D 78 (2008) 094018; J. A. Aguilar-Saavedra et al., Rev. Mod. Phys. 87 (2015) 421-455.
- [6] CDF Collaboration, Phys. Rev. Lett. 101 (2008) 202001; CDF Collaboration, Phys. Rev. D 83 (2011) 112003; CDF Collaboration, Phys. Rev. D 87 (2013) 092002; DØ Collaboration, Phys. Rev. Lett. 100 (2008) 142002; DØ Collaboration, Phys. Rev. D 90 (2014) 072011; DØ Collaboration, Phys. Rev. D 92 (2015) 052007.
- [7] ATLAS Collaboration, Phys. Rev. D 94 (2016) 032006.
- [8] CMS Collaboration, Phys. Lett. B 760 (2016) 365.
- [9] ATLAS Collaboration, Phys. Lett. B 756 (2016) 52.
- [10] CMS Collaboration, Phys. Rev. D 93 (2016) 034014.
- [11] ATLAS and CMS Collaborations, JHEP 04 (2018) 033.
- [12] W. Bernreuther and Z.-G. Si, Phys. Lett. B 725 (2013) 115; D. Krohn, T. Liu, J. Shelton, and L. T. Wang, Phys. Rev. D 84 (2011) 074034; S. Fajfer, J. F. Kamenik, and B. Melic, JHEP 08 (2012) 114; J. A. Aguilar-Saavedra and M. Perez-Victoria, J. Phys.: Conf. Ser. 447 (2013) 012015.
- [13] ATLAS Collaboration, Phys. Rev. Lett. 114 (2015), 0142001.
- [14] CMS Collaboration, Phys. Rev. D 93 (2016), 052007.
- [15] J. Gao, C. S. Li and H. X. Zhu, Phys. Rev. Lett. 110 (2013) 042001.
- [16] CMS Collaboration, CMS PAS TOP-16-019 https://cds.cern.ch/record/2218019.
- [17] ATLAS Collaboration, Eur. Phys. J. C 78 (2018) 129.
- [18] A. Czarnecki, J. G. Korner and J. H. Piclum, Phys. Rev. D 81 (2010) 111503.
- [19] CMS Collaboration, Phys. Lett. B 762 (2016) 512.
- [20] ATLAS Collaboration, Eur. Phys. J. C 77 (2017) 264.
- [21] ATLAS Collaboration, arXiv:1810.01772 [hep-ex]; submitted to Eur. Phys. J. C.
- [22] J. Erdmann et al., Nucl. Instrum. Meth. A 748 (2014) 18; ATLAS Collaboration, Eur. Phys. J. C 72 (2012) 2046.
- [23] A. Hocker et al, TMVA - Toolkit for Multivariate Data Analysis, (2007), arXiv: physics/0703039.
- [24] DELPHI Collaboration, Eur. Phys. J. C 55 (2008) 1; CMS Collaboration, JHEP 12 (2012) 105.
- [25] CMS Collaboration, Eur. Phys. J. C 78 (2018) 891.
- [26] ATLAS Top Quark Public Results:https://twiki.cern.ch/twiki/bin/view/AtlasPublic/TopPublicResults.
- [27] CMS Top Quark Public Results: https://twiki.cern.ch/twiki/bin/view/CMSPublic/PhysicsResultsTOP.