Stochastic Evolution of Coagulation-Fragmentation processes using the Accurate Chemical Master Equation approach
Abstract
Coagulation and fragmentation (CF) is a fundamental process by which particles attach to each other to form clusters while existing clusters break up into smaller ones. It is a ubiquitous process that plays a key role in many physical and biological phenomena. CF is typically a stochastic process that often occurs in confined spaces with a limited number of available particles. In this study, we use the discrete Chemical Master Equation (dCME) to describe the CF process. Using the newly developed Accurate Chemical Master Equation (ACME) method, we calculate the time-dependent behavior of the CF system. We investigate the effects of a number important factors that influence the overall behavior of the system, including the dimensionality, the ratio of attachment to detachment rates among clusters, and the initial conditions. By comparing CF in one and three dimensions we conclude that systems in higher dimensions are more likely to form large clusters. We also demonstrate how the ratio of the attachment to detachment rates affect the dynamics and the steady-state of the system. Finally, we demonstrate the relationship between the formation of large clusters and the initial condition.
1 Introduction
Coagulation and fragmentation (CF) is a fundamental process in which particles attach to each other to form larger clusters which can also break down into smaller ones. The general mechanism presents itself in physical processes such as spray and aerosol [1, 2, 3], biological processes such as filament formation and capsid protein nucleation [4, 5], and biomedical phenomena such as blood clotting [6, 7, 8, 9, 10].
The CF problem has been the focus of numerous theoretical and experimental studies [12, 13, 7, 11]. Smolukowski’s equation and the mass-action based Becker-Döring (BD) equation have been the basis of many studies [19, 20, 21, 13]. Solving these equations usually requires an assumption of infinite system size. However, CF often occurs in confined spaces with limited numbers of molecules [13]. The behavior of CF in such small systems is also intrinsically stochastic and the effects of the discreteness in particle and cluster numbers is significant.
In addition, the CF process lies at the heart of the blood clotting phenomenon [14]. The full coagulation cascade involves many molecular species and numerous reactions, often requiring complex models such as the ordinary differential equation (ODE) model of Hockin et al. (with 34 species and 42 rates) [15], or an even more complex platlet-plasma model of [16]. However, key steps involving the formation cluster of fibrin particles can be regarded as a CF process [17], similar to the subject of this study.
Hockin-Mann reaction network model and classic Becker-Döring-type models do not incorporate discreteness and stochasticity of the CF process, when it happens in confined space [22, 13]. However, the Chemical Master Equation (CME) approach is widely used to address discreteness and stochasticity [23, 24, 25]. Solving the CME provides an evolving landscape in state space while the discrete form of the CME (dCME) can account for finite size effects [26, 27, 28].
Monte Carlo (MC) simulation is commonly used to solve the discrete CME [29, 30, 31, 32]. Studies based on MC simulations can incorporate both attachment and detachment reactions, discreteness, and stochasticity of the processes. However, they are limited by the efficiency of sampling and only provide trajectories obeying the dCME. To the best of our knowledge, there is no MC-based approach that can easily simulate the CF across all ranges of the attachment and detachment rates, in various dimensions, and with different initial conditions.
An alternative approach is to obtain an exact solution to the dCME. This is made possible only by using the newly developed Accurate Chemical Master Equation (ACME) algorithm [33]. Using ACME, we first enumerate all the microstates reachable by the CF process given a specific initial condition [34]. We then find the transition matrix connecting these microstates which will be used to determine the time-evolution and steady state of the probability distribution of the system. Using this approach, we will analyze how dimensionality of the system, the ratio of attachment to detachment rates among clusters, and initial conditions affect on the CF process.
2 Method
We describe the CF process using the discrete Chemical Master Equation (dCME) [35]. In our CF problem, there exists molecular species and reactions with reaction rate constants . The -th reaction is represented as
| (1) |
We assume the fixed-volume system is well-mixed.
The microstate of the system at time can be represented with a vector of the copy number of each species: . The union of all possible microstates of the system across all times forms the state space of the system .
The rate of the -th reaction which causes the transition of the system from microstate to microstate is defined as
| (2) |
Using the definitions above, the discrete Chemical Master Equation can be written as
| (3) |
Here, is the probability of the microstate , and is the transition rate from microstate to microstate . We can compute the probability from Eq. (3) using the Accurate Chemical Master Equation (ACME) method [33].
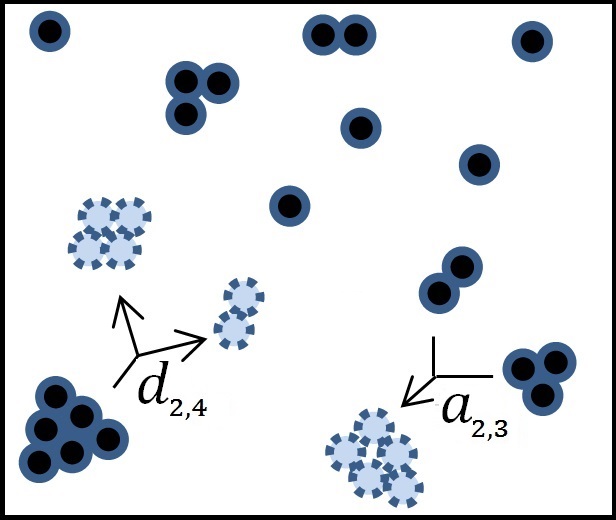
In our finite-sized system, we assume there is a source reservoir of particles with a maximum capacity of . Individual particles in the system can be generated through a reaction that produces clusters of size 1. Clusters of size can also be removed through a degradation reaction, which deposits one particle back into the source. Furthermore, a cluster of size and a cluster of size can attach to each other and form a new cluster of size (), while () cannot exceed a maximum cluster size of . Clusters of size () can also degrade into two clusters of size and via detachment reaction (see Fig. 1). Thus, we have four reactions of attachment, detachment, synthesis, and degradation (Eq. (4-7)) in our CF system
| (4) | |||||
| (5) | |||||
| (6) | |||||
| (7) |
Here, represents a cluster of size , the source of the system, the copy number of clusters of size , and and the attachment and detachment rate constants, respectively. For one-dimensional (1D) systems, the clusters are linear chains of particles and the attachment and detachment of particles occur only at the ends of the cluster. Thus, the attachment and detachment rates are independent of the length of the cluster and will be taken to be constants. However, in two or three dimensions, both the attachment and detachment rates depend on the size of the clusters involved in the reaction. A simple model may be that these rates depend on the perimeter and surface area of the clusters: for 2D systems, and for 3D systems [20].
To illustrate, we give a simple example in which we have the maximum cluster size and the maximum total mass of the system . We assume that the system starts from the initial condition where there are 4 particles in the source and there is no cluster present in the system. In this simple system, we can have three different types of clusters, those of size 1, 2, and 3, respectively. Thus, each microstate of the system can be indexed with four integers, the first indicating the number of particles in the source; the second, third, and forth integers indicating the number of clusters with size 1, 2, and 3, respectively. Eq. (8-10) are the reactions in this simple system and the state space of the system is illustrated in Fig. 2.
| (8) | ||||
| (9) | ||||
| (10) |
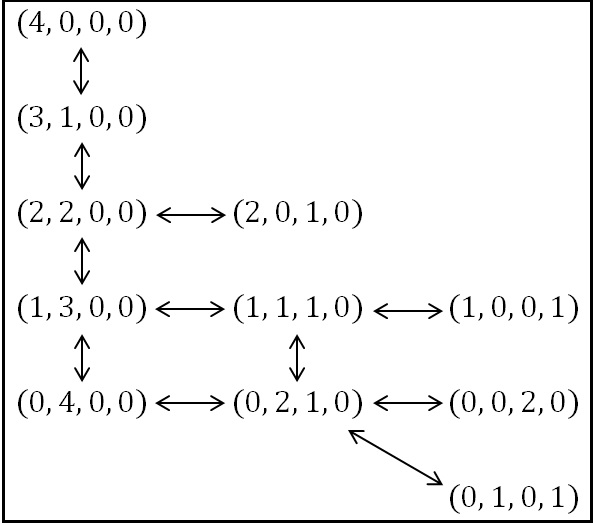
We can then find the rate matrix and compute the probability of each microstate (Table 1). From the probability of each microstate, we can then find the expected number and the probability of each cluster (Eq. (23) and (24), respectively)
| State index (i) | Prob. (ACME Results) | State (Source, , , ) |
|---|---|---|
| 1 | (4,0,0,0) | |
| 2 | (3,1,0,0) | |
| 3 | (2,2,0,0) | |
| 4 | (2,0,1,0) | |
| 5 | (1,3,0,0) | |
| 6 | (1,1,1,0) | |
| 7 | (1,0,0,1) | |
| 8 | (0,4,0,0) | |
| 9 | (0,2,1,0) | |
| 10 | (0,0,2,0) | |
| 11 | (0,1,0,1) |
.
| (23) | ||||
| (24) |
where is the microstate index (Table 1), the expected number, and the probability of observing a cluster of size .
In our study, we shall restrict ourselves to a system with total mass and a maximum possible cluster size , which are much larger than the parameters in previous studies (, ) [30]. To describe the CF system, our state space includes microstates. For our calculations, we use a machine with a 20-core Xeon E5-2670 CPU of 2.5GHz, with a cache size of 20MB and 128GB Ram. Computing the steady state distribution at a specific ratio of the attachment to detachment rates () takes about 38 minutes. Computing the time-evolving probability distribution takes between 2,729 min and 3,292 min. Table 2 provides details on the computational cost.
| Steady state cost (min) | Time-evolving cost (min) | |
.
3 Results
Our results are organized as follows. We first examine the effect of dimensionality on the formation of the largest cluster in the system. We then study the effect of different attachment/detachment rate ratios on the formation of clusters and their steady-state distributions. Finally, we examine the effect of different initial conditions on CF dynamics.
3.1 Effects of Dimensionality
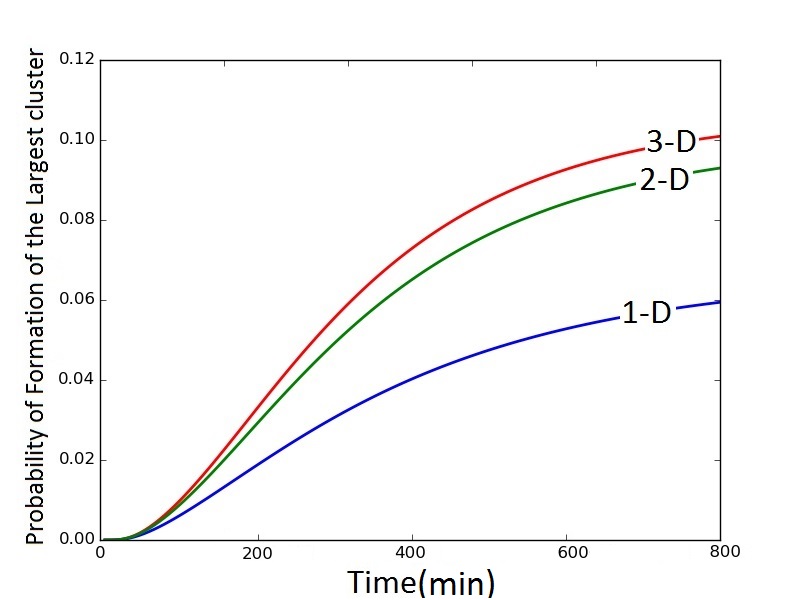
For 1D systems, the attachment rate and the detachment rate are independent of the size of clusters. For 2D and 3D systems, we will assume and , respectively [20]. Fig. 3 compares probability of the largest clusters at different time when in systems with different dimensionality. There is significant difference between the 1D system and 2D/3D systems. At long times, the probability of forming largest clusters in 3D is approximately twice of that in 1D. Since the difference in the large-cluster formation probabilities is negligible between 2D and 3D systems, we will use the 3D results for the rest of this paper.
3.2 Steady State Distributions
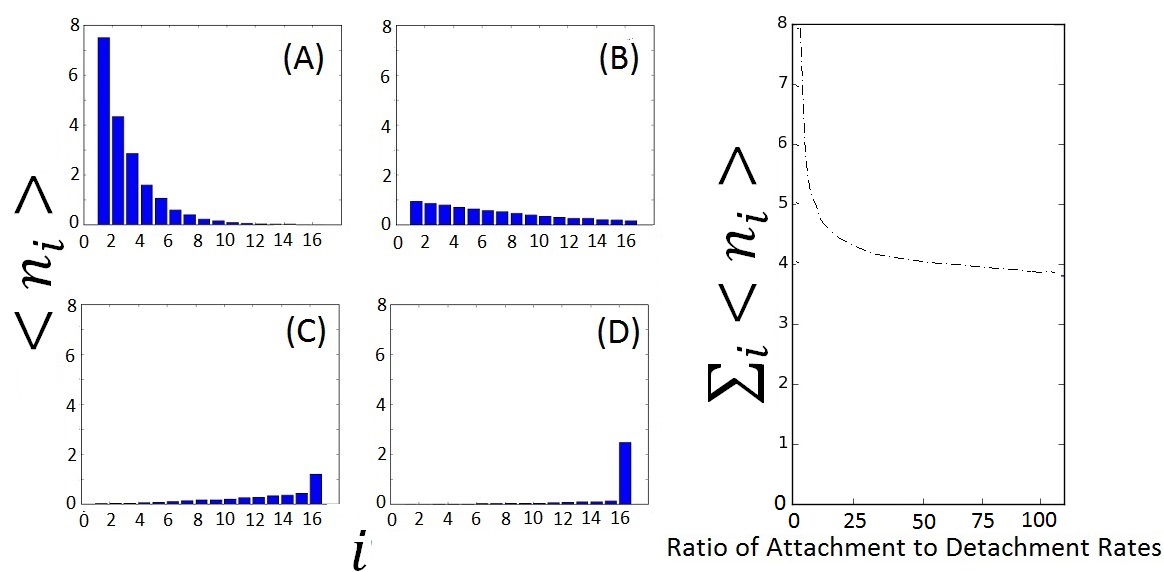
Expected number of clusters. Fig. 4A-D shows the expected number of clusters of different sizes for four different values of : , , , and . The inset shows the distribution of clusters of different sizes at the steady state. When , all clusters are singletons. When increases, larger clusters form. When , all clusters are at their maximum allowed size. The expected number of all clusters at different ratios of attachment to detachment rates is shown in Fig. 4E.
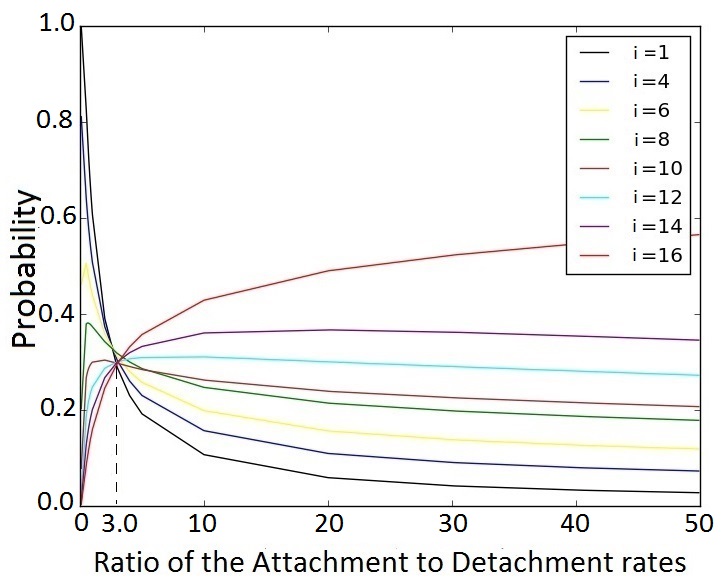
Probability of forming clusters of different sizes. The formation of large clusters is an important issue in CF processes. Without loss of generality, we set a critical probability of having the largest cluster () to be . Fig. 5 shows the steady state probabilities of different clusters with different . When , is less than the probability of other clusters ()(Fig. 5A). When this ratio is around , the probabilities for all clusters are almost equal. Thus, for the assumed threshold, is the critical ratio of attachment to detachment rate. Below this value, forming the largest cluster is unlikely.
3.3 Dynamical Behavior of the CF System
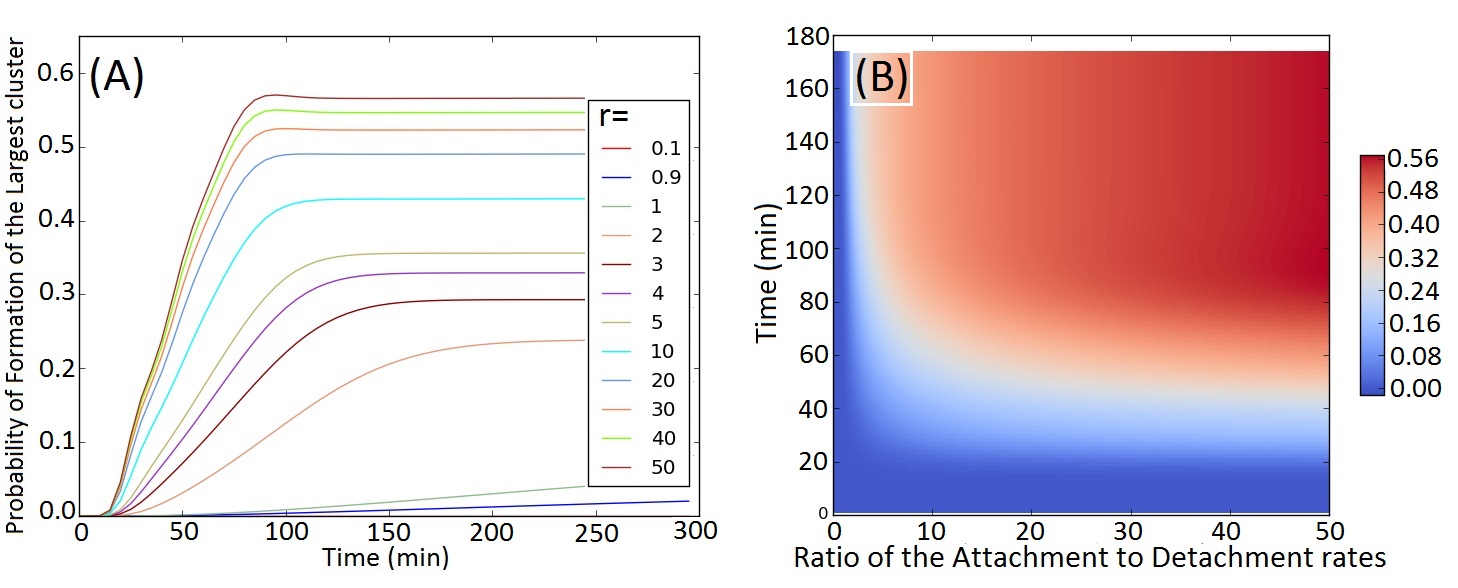
The time a CF system needs to reach the critical probability of is a quantity of interest. We therefore examine the dynamics of the system to understand the time-dependence of forming large clusters. Fig. 6A shows how grows for different ratios of attachment to detachment rates. When , the probability of forming the largest cluster is less than 0.3, regardless of how much time has past. Fig. 6B shows the critical time at which the probability of forming the largest cluster reaches 0.3 (white region). Before this critical time, formation of large clusters is unlikely to occur (blue region). A system containing large clusters are more likely after this critical time (red region). In extreme cases when , it is highly probable that large clusters will form in the system within minutes. In contrast, when , it takes about 150 minutes for the system to form, with appreciable probability , a maximum-size cluster (Fig. 6B).
We examined the convergence behavior in reaching the steady state distribution. Table. 3 lists the distance to the steady state measured as at different time and with different . Larger leads to faster convergence.
| t=20 | t=40 | t=60 | t=80 | t=100 | t=120 | t=140 | ||
| 2.0 | 0.244 | 0.229 | 0.196 | 0.160 | 0.121 | 0.084 | 0.050 | 0.248 |
| 3.0 | 0.292 | 0.254 | 0.196 | 0.135 | 0.075 | 0.035 | 0.012 | 0.298 |
| 4.0 | 0.321 | 0.262 | 0.185 | 0.110 | 0.047 | 0.014 | 0.000 | 0.331 |
| 5.0 | 0.343 | 0.266 | 0.183 | 0.095 | 0.035 | 0.010 | 0.000 | 0.358 |
| 10.0 | 0.402 | 0.277 | 0.158 | 0.056 | 0.008 | 0.000 | 0.000 | 0.429 |
| 20.0 | 0.453 | 0.296 | 0.140 | 0.034 | 0.000 | 0.000 | 0.000 | 0.492 |
| 30.0 | 0.115 | 0.306 | 0.135 | 0.023 | 0.000 | 0.000 | 0.000 | 0.525 |
| 40.0 | 0.125 | 0.318 | 0.130 | 0.019 | 0.000 | 0.000 | 0.000 | 0.550 |
| 50.0 | 0.136 | 0.327 | 0.140 | 0.019 | 0.000 | 0.000 | 0.000 | 0.571 |
.
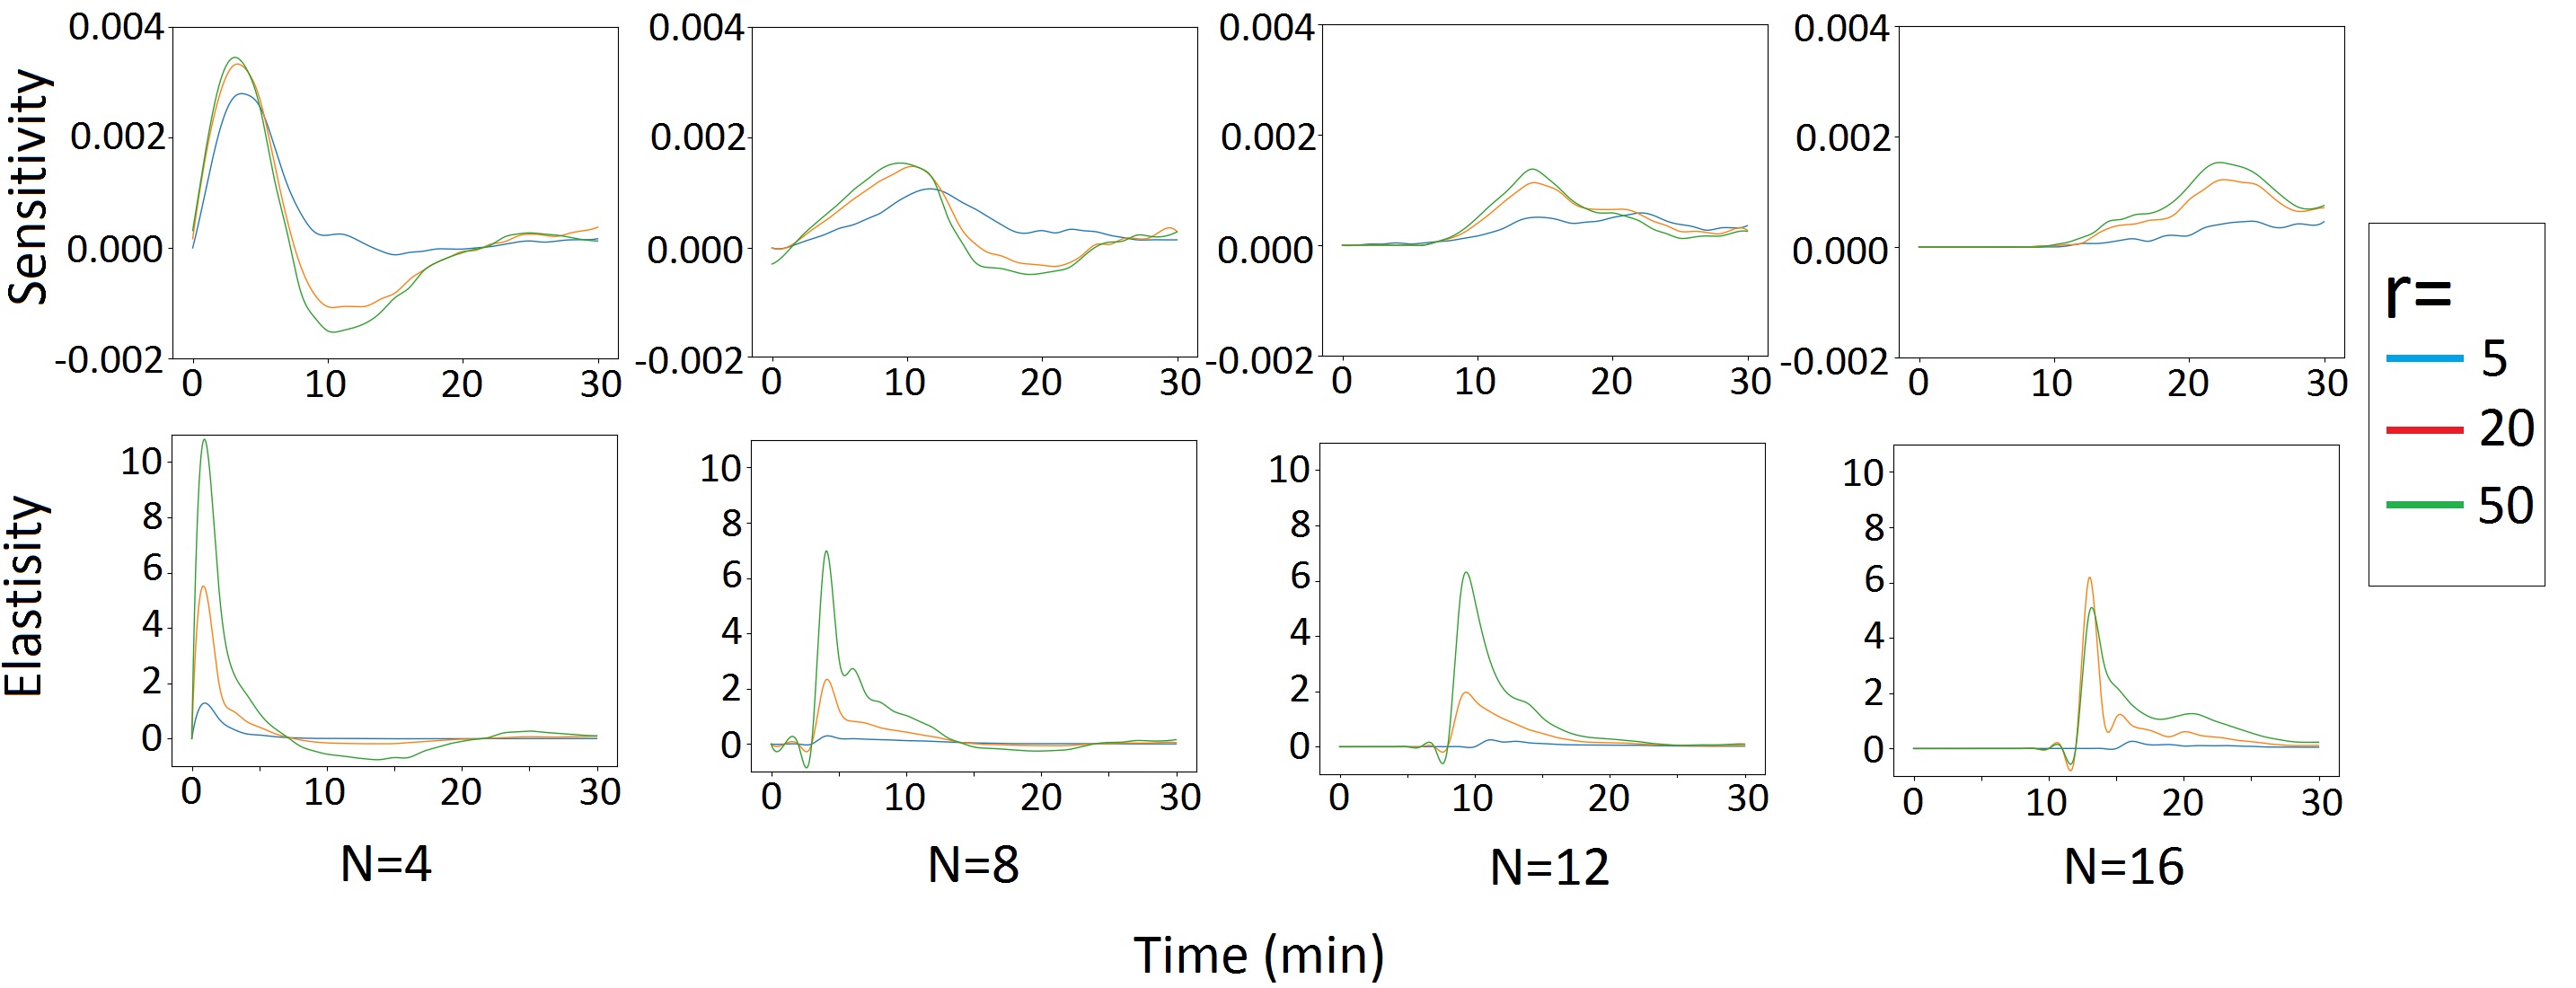
Following [5], we analyzed the elasticity and sensitivity of parameters of the CF system for a subset of clusters present at different ratio of . Here, we use sensitivity to examine the response of the expected number of different clusters to changes in . We use elasticity to examine the relative changes in the expected number of different clusters with respect to the relative changes in . Following [5], the sensitivity and the elasticity of forming a cluster of size are calculated as
| (45) |
| (46) |
Fig. 7 shows and for formation of 4 clusters of sizes and at 3 different of and . When increases, and decreases for forming clusters of different sizes. In addition, we found that smaller clusters have higher and .
3.4 Dependence on Initial Conditions
In the examples above, we assumed 48 particles are initially in the source which can be transported into the system through synthesis reactions. We now examine the effect of different initial conditions on the formation of the maximum-sized clusters and the time it takes for the system to approach steady state.
We start with different initial conditions constrained to having the same initial mean size (IMS) of clusters. Fig. 8 shows the evolutions of the probability of formation of the largest cluster for four different initial conditions: clusters of size (), clusters of size and clusters of size (), clusters of size and clusters of size (), monomers and clusters of size (). All these initial conditions have the same mean cluster size of . When the IMSs are the same, systems with different initial conditions show very similar dynamics.
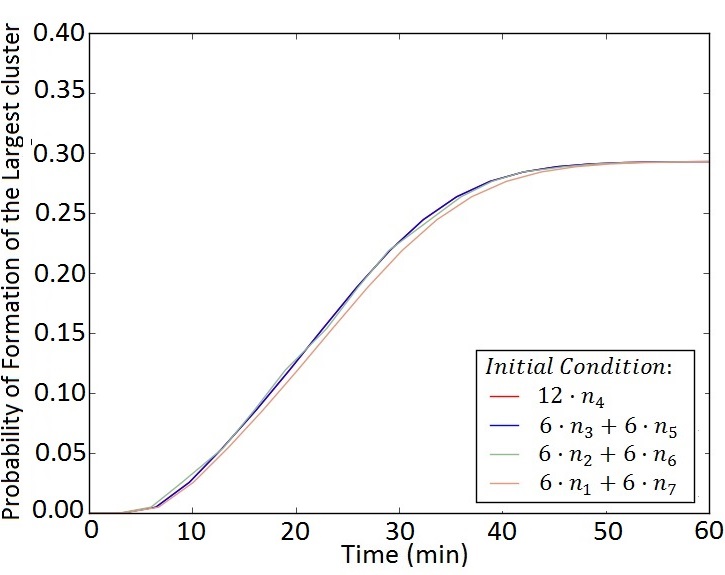
Fig. 8 shows the behavior of the system in formation of local clusters when the initial conditions have same mean size of clusters.
For systems with different IMSs, the dynamics on the “distance” of the IMS from the steady state mean cluster size distribution (shown in Fig. 4E). Figs. 9A-B show the time-dependent behavior of the probability of forming the largest cluster under initial conditions with different IMSs and and , respectively. When and , the mean size of clusters at the steady state is about and , respectively (Fig. 4E). Figs. 9A-B show the time required for the system to approach steady state for different IMSs. Not surprisingly, the time to approach the steady-state distribution for values of IMS that are closer to the steady-state mean cluster sizes is less.
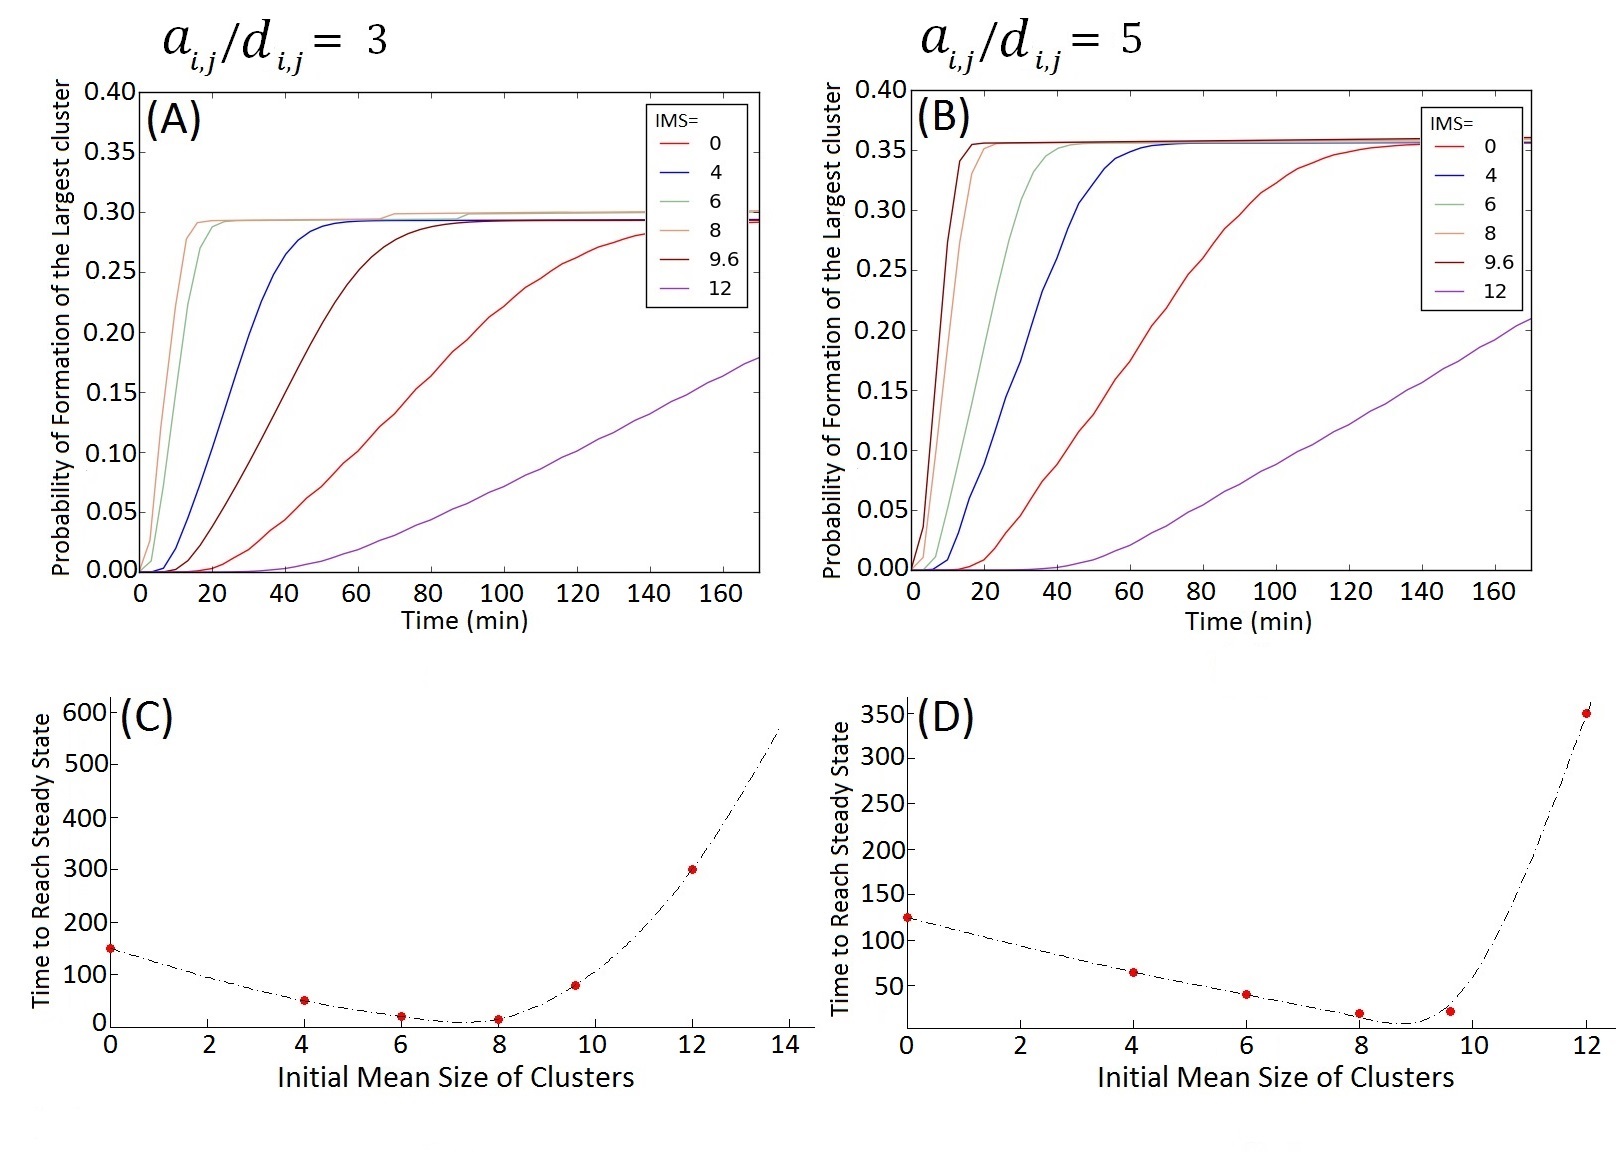
Figs. 9C-D show the time required for the system to reach the steady state for and , respectively. Our results show that the closer the mean size of clusters at the initial condition is to that of the steady state, the less time it takes for the system to approach the stationary distribution. However, we observe that, qualitatively, systems started at IMSs greater than the mean sizes at steady state take longer to relax than those started at IMSs smaller than that at steady state.
When the IMS is larger than the steady state mean size of clusters, larger detachment rates are required for the system to reach the steady state rapidly. However, we have . Thus, we observe asymmetry on different side of the steady state (Fig. 9 C and D). The asymmetry becomes even larger when increases. As a result, the time required for reaching the steady state increases dramatically when IMS become more than the steady state mean size of clusters.
4 Summary and Conclusions
The coagulation and fragmentation is a fundamental mechanism that plays a critical role in many physical and biological processes. Here we studied the general properties of the CF process using the Accurate Chemical Master Equation (ACME) method [33], which can provide accurate solutions to the discrete Chemical Master Equation (dCME) and can account for the stochasticity and the discreteness of the CF process.
We examined how the dimensionality of the clusters affects its behaviors given the same intrinsic attachment and detachment rates. Three-dimensional systems exhibit faster dynamics compared to systems in 1D or 2D. The dimensionality of the clusters affects the effective rates of attachment and detachment, which will determine the speed of particle attachmment and detachment in a cluster.
Steady-state probability distributions of cluster sizes were also studied under varying attachment/detachment rate ratios. For a given critical probability of emergence of maximum-sized clusters, we are able to determine the critical ratio between the attachment and detachment rates. Below this critical ratio, the large cluster of interest is unlikely to form regardless of time. For systems with ratio larger than the critical one, we are able to calculate the time required for the system to form maximum-sized cluster with high probability [36, 37].
We further studied how different initial conditions affect the behavior of the system and find the initial mean size of the clusters is one of the most important factors that govern CF dynamics. We find that the dynamics of systems started with different initial configurations with the same initial mean cluster sizes are similar. Further investigation shows that the dynamics towards steady state are controlled by the deviation of the mean initial cluster size from the mean cluster size at steady state.
Future studies include analysis of various processes of self-assemblies of different molecular and mesoscopic-particles that occur in small closed systems, with supply of limited number of particles. Systems with different binding mode and binding geometry can be explored in details. An example is the HIV-1 viral capsid nucleation process [5]. In addition, critical steps of the blood-clotting processes involving fibrin and other molecules in the blood-clotting process [17] can also be studied.
5 Acknowledgments
JL acknowledges support from the National Institute of Health (R35GM127084, R01CA204962-01A1, and R21 AI126308). TC acknowledges support from the Army Research Office (W911NF-18-1-0345) and the National Science Foundation (DMS-1516675 and DMS-1814364).
References
- [1] Tsantilis S. and Pratsinis E. Evolution of Primary and Aggregate Particle-Size Distributions by Coagulation and Sintering. Aiche Journal, 46(2):407-415, 2000.
- [2] Goudeli Erini, Eggersdoref Maximilian L. and Pratsinis Sotiris E. Coagulation–Agglomeration of Fractal-like Particles: Structure and Self-Preserving Size Distribution. Langmuir, 31(4):1320-1327, 2015.
- [3] Keramati Hadi, Mohammad Hassan Saidi and Zabetian Mohammad Stabilization of the Suspension of Zirconia Microparticle Using the Nanoparticle Halos Mechanism: Zeta Potential Effect. Journal of Dispersion Science and Technology, 37(1):6-13, 2016.
- [4] David Sept and McCammon J. A. Thermodynamics and kinetics of actin filament nucleation. Biophysical Journal, 81(2):667-674, 2001.
- [5] Farrah Sadre-Marandi, Yuewu Liu, Jiangguo Liu, Simon Tavener, Xiufen Zou Modeling HIV-1 viral capsid nucleation by dynamic systems. Mathematical Biosciences, 270:95-105, 2015.
- [6] Powers E. T. and Powers D. L. The Kinetics of Nucleated Polymerizations at High Concentration: Amyloid Fibril Formation Near and Above the Super Critical Concentration. Biophysical Journal, 91:122-132, 2006.
- [7] Edelstein-Keshet Leah and Ermentrout G. Bard Models for the length distributions of actin filaments: I. Simple polymerization and fragmentation. Bulletin of Methematical Biology, 60, 1998.
- [8] Nurden Alan T. The biology of the platelet with special reference to inflammation, wound healing and immunity. Frontiers in Bioscience, 23:726-751, 2018.
- [9] Michiel Bertsch, Bruno Franchi, Norina Marcello, Maria Carla Tesi, Andrea Tosin Alzheimer’s Disease: a Mathematical Model for Onset and Progression, Mathematical Medicine and Biology. Italian Ministary of Health, 34(2):193-214, 2017.
- [10] Tarbox Abigail K. and Swaroop Mamta Pulmonary embolism. International Journal of Critical Illness and Injury Science, 3(1):69-72, 2013.
- [11] Pavel L. Krapivsky and Sidney Redner and Eli Ben-Naim A Kinetic View of Statistical Physics. Cambridge University Press, Cambridge, UK, 2010.
- [12] Ziff R. M. and Stell G. Kinetics of Polymer Gelation. The Journal of Chemical Physics, 73(7):3792, 1980.
- [13] Wattis Jonathan A. D. and King John R. Asymptotic solutions of the Becker-Döring. Journal of Physics A: Mathematical General, 31:7169-9189, 1998.
- [14] Bernd Englemann Initiation of coagulation by tissue factor carriers in blood. Blood Cells, Molecules, and Diseases , 36:188-190, 2006.
- [15] Matthew F. Hockin, Keneth C. Jones, Stephen J. Everse, Kenneth G. Mann A model for the stoichiometric regulation of blood coagulation. The Journal of Biological Chemistry, 227(21):18322-18333, 2002.
- [16] Manash S. Chatterjee, William S. Denney, Huiyan Jing, Scott L. Diamond System biology of coagulation initialtion: Kinetics of thrombin generation in resting and activated human blood. PLOS Computational Biology, 6(9):e1000950, 2010.
- [17] Robert D. Guy, Aaron L. Fogelson, James P. Keener Fibrin gel formation in a shear flow. Mathematical Medicine and Biology, 0:1-20, 2005.
- [18] William M. Mounts, Michael N. Liebman Qualitative modeling of normal blood coagulation and its pathological states using stochastic activity networks. International Journal of Biological Macromolecules, 20:265-281, 1997.
- [19] Hoze Nathanael and Holcman David Stochastic coagulation-fragmentation processes with a finite number of particles and applications. Annals of Applied Probability, 28(3):1449-1490, 2016.
- [20] Niethammer B. On the Evolution of Large Clusters in the Becker-Döring Model. Journal of Nonlinear Science, 13(1):115-155, 2003.
- [21] Penrose O.. The Becker-Döring equations at large times and their connection with the LSW theory of coarsening. Journal of Statistical Physics, 89(1-2):305-320, 1997.
- [22] Davis J. K. and Sindi S. S. Initial condition of stochastic self-assembly. Physical Review E, 93(2):022109, 2016.
- [23] Gupta Ankit, Mikelson Jan and Khammash Mustafa A Finite State Projection Algorithm for the Stationary Solution of the Chemical Master Equation. The Journal of Chemical Physics, 147:154101, 2017.
- [24] Vítor Sudbrack, Leonardo G.Brunnet, Rita M.C de Almeida, Ricardo M. Ferreira, Daniel Gamermann Master Equation for Degree Distribution of a Duplication and Divergence Network. Physica A, 509:588-298, 2015.
- [25] Smadbeck Patrick and Kaznessis Tiannis N. Solution of Chemical Master Equations for Nonlinear Stochastic Reaction Networks. Current Opinion in Chemical Engineering., 5:90-95, 2014.
- [26] Cao Youfang and Liang Jie Adaptively Biased Sequential Importance Sampling for Rare Events in Reaction Networks with Comparison to Exact Solution from Finit Buffer dCME Method. The Journal of Chemical Physics, 139(2):025101, 2013.
- [27] Terebus Anna, Cao Youfang and Liang Jie Exact Computation of Probability LAndscape of Stochastic Networks of Single Input and Coupled Toggle Switch Modules. IEEE Engineering in Medicine and Biology Society (EMBS), 20145228-5231, 2014.
- [28] Cao Youfang, Terebus Anna and Liang Jie State Space Truncation with Quantified Errors for Accurate Solution to Discrete Chemical Master Equation. Bulletin of Mathematical Biology, 78(4): 617-661, 2016.
- [29] D’Orsogna Maria R., Lakatos G. and Chou Tom Stochastic Self-Assembly of Incommensurate Clusters. The Journal of Chemical Physics, 136:0884110, 2012.
- [30] D’Orsogna Maria R., Lei Qi and Chou Tom First Assembly Times and Equilibrium in Stochastic Coagulation-Fragmentation. The Journal of Chemical Physics, 143:014112, 2015.
- [31] Kotalczyk G. and Kruis F. E. A Monte Carlo Method for the Simulation of Coagulation and Nucleation Based on Weighted Particles and the Concepts of Stochastic Resolution and Merging. Journal of Computational Physics, 340:276-296, 2017.
- [32] Smith Alastair J., Wells Clive G. and Kraft Markus A New Iterative Scheme for Solving the Discrete Smoluchowski Equation. Journal of Computational Physics, 352:373-387, 2018.
- [33] Cao Youfang, Terebus Anna and Liang Jie Accurate Chemical Master Equation Solution Using Multi- Finite Buffers. SIAM Multiscale Modeling and Simulation, 14(2): 923-963, 2016.
- [34] Cao Youfang and Liang Jie Optimal Enumeration of State Space of Finitely Buffered Stochastic Molecular Networks and Exact Computation of Steady State Landscape Probability. BMC Systems Biology, 2(30):1-13, 2008.
- [35] Cao Youfang, Terebus Anna and Liang Jie Chapter 3. Modeling Dtochastic Gene Regulatory Networks Using Direct Solutions of Chemical Master Equation and Rare Event Sampling, Book title: Research in Analysis and Modeling of Gene Regulatory Networks, Ivanov Ivan V., Qian Xiaoning and Pal Ranadip. Advance in Medical Technologies and Clinical Practice (AMTCP), Book Series 2016.
- [36] Tom Chou and Maria R. D’Orsogna First passage Problems in Biology in Chapter 13: First-Passage Phenomena and Their Applications, editors Ralf Metzler, Gleb Oshanin, and Sidney Redner, World Scientific, 2014
- [37] R. Yvinec and Maria R. D’Orsogna and Tom Chou. First passage times in homogeneous nucleation and self-assembly. The Journal of Chemical Physics, 137: 244107, 2012.