Isochronal age-mass discrepancy of young stars: SCExAO/CHARIS integral field spectroscopy of the HIP 79124 triple system
We present SCExAO/CHARIS 1.1–2.4 m integral field direct spectroscopy of the young HIP 79124 triple system. HIP 79124 is a member of the Scorpius-Centaurus association, consisting of an A0V primary with two low-mass companions at a projected separation of 1 . Thanks to the high quality wavefront corrections provided by SCExAO, both companions are decisively detected without the employment of any PSF-subtraction algorithm to eliminate quasi-static noise. The spectrum of the outer C object is very well matched by Upper Scorpius M4 0.5 standard spectra, with a Teff = 2945 100 K and a mass of 350 MJup. HIP 79124 B is detected at a separation of only 180 mas in a highly-correlated noise regime, and it falls in the spectral range M6 0.5 with Teff = 2840 190 K and 100 MJup. Previous studies of stellar populations in Sco-Cen have highlighted a discrepancy in isochronal ages between the lower-mass and higher-mass populations. This could be explained either by an age spread in the region, or by conventional isochronal models failing to reproduce the evolution of low-mass stars. The HIP 79124 system should be coeval, and therefore it provides an ideal laboratory to test these scenarios. We place the three components in a color-magnitude diagram and find that the models predict a younger age for the two low-mass companions ( 3 Myr) than for the primary star ( 6 Myr). These results imply that the omission of magnetic effects in conventional isochronal models inhibit them from reproducing early low-mass stellar evolution, which is further supported by the fact that new models that include such effects provide more consistent ages in the HIP 79124 system.
Key Words.:
Stars: pre-main sequence; Stars: low-mass; Techniques: imaging spectroscopy; Planets and satellites: detection1 Introduction
A large number of direct imaging surveys searching for substellar companions have been performed in recent years, yielding the first directly-imaged exoplanets (Bowler, 2016). The efforts have been put into looking for these objects around young and nearby stars, where contrast ratios are more favorable. These discoveries reveal colors and spectral features that can indicate the composition of their atmospheres and their underlying physical properties (e.g., Barman et al., 2011; Currie et al., 2011; Faherty et al., 2016; Biller Bonnefoy, 2018).
The Scorpius Centaurus (Sco-Cen) region is the nearest OB association ( 100–200 pc, de Zeeuw et al., 1999), and contains young stars ranging from hot and very massive O-type stars to free-floating substellar objects (Cook et al., 2017). It is thus an ideal place in which to search for young and low-mass objects, allowing a detailed study of stellar evolution and planet formation mechanisms (e.g. Preibisch et al., 2002; Preibisch Mamajek, 2008; Luhman Mamajek, 2012; Currie et al., 2015; Pecaut Mamajek, 2016).
The large number of stars present in this association has been used to statistically constrain the age of each subregion by comparing stars of different masses to theoretical isochrones, which has shown an intricate star formation history (e.g., Pecaut Mamajek, 2016). One of the most alluring results is the existence of a mass-dependent age trend, i.e., models yield younger ages for cooler low-mass stars compared to the corresponding massive population in the same subregion. For instance, the Upper Sco (USco) subregion would have a median age of about 5 Myr if we consider only the pre-main sequence (PMS) K- and early M-type population, which is half of the usually adopted USco age of 10 3 Myr from PMS G- and F-type stars. This discrepancy has also been similarly observed in other regions (e.g., Hillenbrand, 1997; Bell et al., 2015; Herczeg Hillenbrand, 2015). Two main explanations have been proposed to explain this fact; the effect of magnetic fields, which might inhibiting convection and slow down the contraction rate in low-mass PMS stars (Feiden, 2016; Somers Stassun, 2017), or an age spread within young clusters (Fang et al., 2017).
Here we present a SCExAO/CHARIS spectroscopic study of the USco HIP 79124 system encompassing the near-IR bands (1.1–2.4 m). This young A-type star forms a triple system with two resolved low-mass companions at a very close projected separation. The outer companion, HIP 79124 C, was discovered at about 1 ″( 137 AU) by AO-assisted direct imaging surveys, first by Kouwenhoven et al. (2005, 2007) with ADONIS, which flagged it as a companion, and later by Lafreniere et al. (2014) with NIRI at the Gemini North telescope. Recently, an even more interesting discovery was the presence of an additional 135 companion, HIP 79124 B, interior to the C component, using aperture masking interferometry in band (Hinkley et al., 2015). This companion has also been imaged for the first time at a separation of only 0.18 ″( 25 AU) by Serabyn et al. (2017), using the new optical vortex coronagraph working alongside the AO-assisted NIRC2/Keck camera.
In this work we will make use of our new low-resolution SCExAO/CHARIS observations together with archival Keck/NIRC2 photometry to analyze, for the first time, the spectral nature of the B and C companions. This study will improve the knowledge on the parameters of two low-mass stars in USco. Moreover, star-formation models favors a scenario where the HIP 79124 triple system is coeval, as the time difference of massive A-type formation compared to low-mass M-type objects seems to be securely below 1 Myr, even after including the accretion phase (Bate, 2012). Binary systems in the Taurus association have also been shown to be more coeval than the region as a whole (Kraus Hillenbrand, 2009). The likely coevality makes of this system a perfect laboratory to test whether the conventional isochronal models predict the same age for both the two low-mass companions and the massive and hot primary A-type star, or otherwise fail at reproducing the PMS evolution of low-mass stars.
| Date | Telescope/Instrument | Wavelength | Coronagraph | Collected PA | Mode | ||
|---|---|---|---|---|---|---|---|
| (UT) | (Filter) | (sec) | (deg) | ||||
| 2017-07-15 | Subaru/CHARIS | 1.1–2.4 | Lyot | 31 1.475 | 15 | 4.3 | IFS |
| 2017-07-15 | Subaru/CHARIS | 1.1–2.4 m + ND filter | – | 100 0.2 | 3 | 2.0 | IFS |
| Archival Data | |||||||
| 2016-04-13 | Keck/NIRC2 | (3.8 m) | Vortex | 30 | 26 | 18.8 | Imaging |
2 Observations and data reduction
2.1 SCExAO/CHARIS Data
We observed the HIP 79124 system with the newly-established Coronagraphic High Angular Resolution Imaging Spectrograph (CHARIS) on 2017-07-15, located on the Nasmyth platform at the Subaru Telescope in Hawaii (Peters et al., 2012; Groff et al., 2013) coupled to the extreme adaptive optics system SCExAO (Jovanovic et al., 2015). We used the low-resolution (R 20) configuration of CHARIS, which covers the + + bands within a field of view (FoV) of 2.2 2.2 , and collected all data in pupil tracking/angular differential imaging mode (ADI, Marois et al., 2006). Both seeing conditions (e.g., 0.8 ) and AO performance were slightly below average but sufficient to reveal both HIP 79124 companions without post-processing.
The observations consisted of two sequences. First, we acquired a first set of images using the Lyot coronagraph with a 217 mas diameter occulting spot to block the star, each of which consisting of 31 coadded 1.475 sec exposures. After frame selection, our total integration time was 11 minutes, covering a parallactic angle motion of 4.3 . As HIP 79124 C was easily visible but possibly in the non-linear regime of the detector in a few spectral channels in the coronagraphic data, we acquired a second set of non-coronagraphic data using a neutral density filter to keep both A and C in the linear count regime totalling 60 sec of integration time and covering a smaller parallactic angle motion of 2 . Table 1 shows the observation log of the CHARIS data and the archival NIRC2/Keck data that we retrieve to complement our analysis (see Section 2.2).
For data cube extraction, we used the ’least squares’ method presented in the CHARIS Data Reduction Pipeline (CHARIS DRP; Brandt et al., 2017), yielding 22 images at wavelengths between 1.1–2.4 m. An IDL-based CHARIS data reduction pipeline was used to perform the basic reduction processes, such as background subtraction, flat fielding and image registration (Currie et al., 2018b) following previous methods applied for broadband imaging data (e.g., Currie et al., 2011). To spectrophotometrically calibrate each data cube, we used an A0V spectral type from the Pickles (1998) stellar library, which is shown to be accurate despite issues with the library at other spectral types (Currie et al., 2018b) and is also adopted in the GPI Data Reduction Pipeline (Perrin et al., 2014). For the unsaturated data, the star’s photometry is used directly for flux-calibration. For the coronagraphic data, satellite spots provided absolute spectrophotometic calibration (e.g., Currie et al., 2018a). We verified and fine-tuned our spectrophotometric calibration by 1) comparing the brightness of HIP 79124 C in the saturated and unsaturated data and 2) correcting for signal loss due to the Lyot occulting spot ( 92.5 % throughput at 0.18 ).
2.2 Keck/NIRC2 Archival Data
The magnitude of the B component was already presented in Hinkley et al. (2015) and Serabyn et al. (2017); however, neither paper reported photometry for HIP 79124 C. To obtain it, we reduced the archival Keck/NIRC2 vortex data from June 2015 and April 2016 published in Serabyn et al. (2017), focusing on acquisition frames where the primary and C are both unsaturated. Basic processing followed previous steps employed for reducing NIRC2 archival data (Currie et al., 2011, 2018b), including a linearity correction, sky subtraction and distortion correction. The results from both epochs were consistent within error bars, and we adopted the smaller photometric uncertainty.
2.3 SCExAO/CHARIS Detections
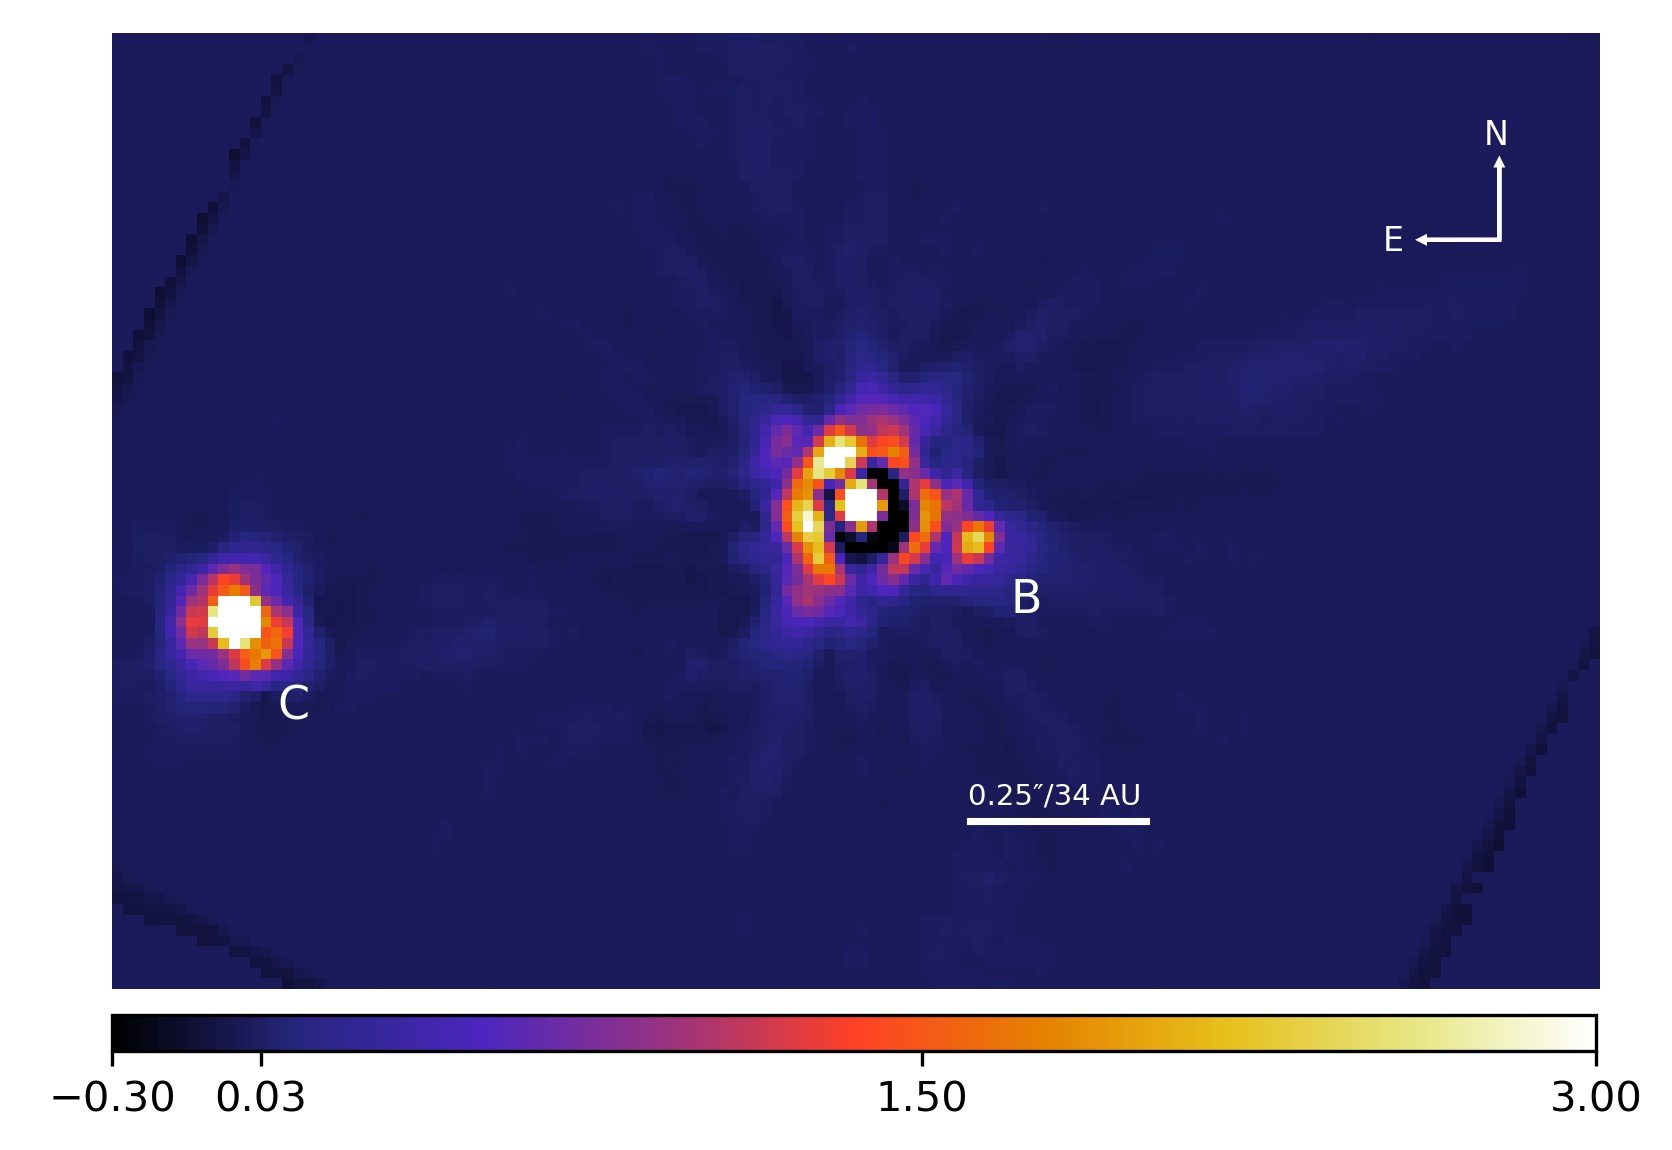
In Figure 1 we show the wavelength-collapsed image of HIP 79124 obtained from combining our coronagraphic exposures. Given that little field rotation was collected, we refrain from applying a PSF-subtraction algorithm that benefits from the ADI observing technique. Instead, we simply subtract a radial profile, which is sufficient to recover the B companion at a decent signal-to-noise ratio (S/N).
To compute the S/N for both the B and C objects, we divide the convolved flux, measured at each companion’s position, by the standard deviation of the convolved residual noise in concentric annuli at their same separation after excluding the signal from the companion (e.g., Thalmann et al., 2009; Currie et al., 2011), and corrected for finite sample sizes (Mawet et al., 2014). Our simple wavelength-collapsed radial profile-subtracted image yields S/N 9 and 120, respectively for B and C. As expected, the brightness and separation of the C companion provides a very strong detection in all individual channels. Although the situation is more complicated for the very close B object, SCExAO/CHARIS is able to identify it with a S/N of 6–8 for the shortest wavelengths in the data cube, peaking at 2–2.2 m with a S/N of 11.
From Figure 1 we also obtain the astrometric position of the unsaturated companions with respect to the primary. We perform a Gaussian fit to extract the centroid of the point sources, whose error is estimated by dividing the FWHM of the candidate’s PSF by its S/N (Thalmann et al., 2014). To this uncertainty, we add those from the plate scale of 16.2 0.1 mas/spaxel and true north orientation of -2.20 0.27 (Currie et al., 2018b). The inner companion is detected at a projected separation of = 180 5 mas ( 25 AU) and a position angle of 252.9 1.6 . Within error bars, the angular separation is consistent with those obtained by Hinkley et al. (2015) in April 2010 and Serabyn et al. (2017) in April 2016. The position angle increases in time over these previous measurements, supporting evidence for counterclockwise orbital motion first found by Serabyn et al. (2017). We find C at 0.967 0.006 ″( 132 AU) and 100.39 0.04 . Using the archival astrometric data from Lafreniere et al. (2014), we confirm that the C companion shares common proper motion with the primary star.
3 Extracted CHARIS spectra and photometry
3.1 Spectrophotometry and reddening
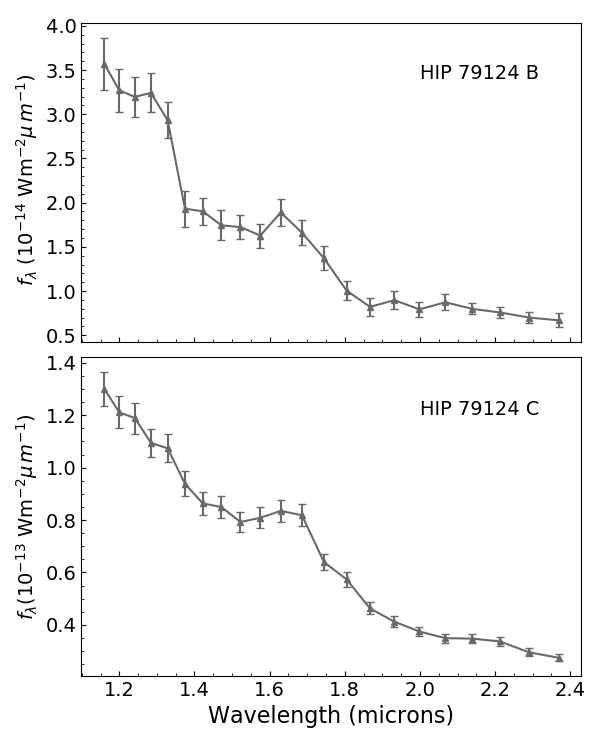
Figure 2 shows the CHARIS low-resolution extracted spectra for the HIP 79124 B and C companions in units of Wm-2m-1. We carried out the extraction by defining an aperture of 0.5 /D around the position of each companion in the wavelength-collapsed image.
The B and C spectra present very similar features. They show a downward trend in flux toward redder wavelengths, except for a peak or plateau in the band region ( 1.65 m). The C companion is brighter and detected with a very high S/N, which generate very small error bars during the extraction. In this case, the error bars are dominated by the absolute calibration uncertainty.
The photometry of the triple system is presented in Tables 2 and 3. We convolved each spectrum with the Mauna Kea Observatory (MKO) passbands functions, previously binned down to CHARIS’ low-resolution mode. We note that the photometric values for the C companion are very close to the ones given by Kouwenhoven et al. (2007), although the band photometry is slightly brighter.
The 2MASS magnitudes of the primary were converted to the MKO system by means of the transformation equations in Carpenter (2001). We checked that the C companion does not affect the 2MASS photometry significantly, as the difference between including or not including the flux of the companion in the magnitude of the primary is within 2 of the primary error bar in the Ks and bands.
We also estimated the extinction for our target using the intrinsic color of nearby dwarf A0-type stars with negligible extinction (Pecaut Mamajek, 2013). We computed , , and s. Taking RV = 3.1 as extinction law, and the extinction coefficients from Fiorucci Munari (2003), we obtain a median mag, mag, mag and mag from the four different colors and adopt the scatter as uncertainties. This value is in agreement within errorbars with the values previously obtained by Pecaut et al. (2012) and Hinkley et al. (2015). No extinction is assumed in , and we use these values to derive dereddened absolute magnitudes for a GAIA-DR2 distance of 137.0 1.2 pc (Lindegren et al., 2018). We dereddened the spectra of the B and C companions by fitting a second-order polynomial to the extinction coefficients, obtaining a coefficient for each of the CHARIS wavelength channels, which we used to correct for the reddening in our spectra.
| UT Date | Telescope/Camera | Filter | Primary | Companion | Apparent mag | Absolute mag | Ref. |
|---|---|---|---|---|---|---|---|
| (mag) | (mag) | (mag) | (dereddened) | ||||
| 2016-04-13 | Keck/NIRC2 | W1/ | 6.96 0.04a𝑎aa𝑎aPhotometry for MF13, LS 1267 and HD 80077 from Dupont et al. | 4.25 0.14c𝑐cc𝑐cPhotometry for MO2-119 from Mathieu et al. | 11.16 0.11 | 5.48 0.11 | 2,3 |
| 2017-07-15 | SCExAO/CHARIS | 7.17 0.03b𝑏bb𝑏bPhotometry for LS 1262, LS 1269 from Durand et al. | 5.48 0.13 | 12.65 0.13 | 6.73 0.13 | 1 | |
| 2017-07-15 | SCExAO/CHARIS | 7.00 0.05b𝑏bb𝑏bFrom the 2MASS catalog (Cutri et al., 2003) converted to the MKO passbands via Carpenter (2001) | 5.26 0.15 | 12.26 0.15 | 6.44 0.15 | 1 | |
| 2017-07-15 | SCExAO/CHARIS | 7.003 0.018b𝑏bb𝑏bFrom the 2MASS catalog (Cutri et al., 2003) converted to the MKO passbands via Carpenter (2001) | 4.92 0.15 | 11.93 0.15 | 6.15 0.15 | 1 |
| UT Date | Telescope/Camera | Filter | Primary | Companion | Apparent mag | Absolute mag | Ref. |
|---|---|---|---|---|---|---|---|
| (mag) | (mag) | (mag) | (dereddened) | ||||
| 2016-04-13 | Keck/NIRC2 | W1/ | 6.96 0.04a𝑎aa𝑎aFrom the WISE W1 channel (Cutri et al., 2012) | 2.98 0.03 | 9.94 0.05 | 4.26 0.05 | 1,2 |
| 2017-07-15 | SCExAO/CHARIS | 7.17 0.03b𝑏bb𝑏bFrom the 2MASS catalog (Cutri et al., 2003) converted to the MKO passbands via Carpenter (2001). | 4.08 0.01 | 11.27 0.05 | 5.36 0.05 | 1 | |
| 2017-07-15 | SCExAO/CHARIS | 7.00 0.05b𝑏bb𝑏bFrom the 2MASS catalog (Cutri et al., 2003) converted to the MKO passbands via Carpenter (2001). | 3.54 0.01 | 10.57 0.05 | 4.75 0.05 | 1 | |
| 2017-07-15 | SCExAO/CHARIS | 7.003 0.018b𝑏bb𝑏bFrom the 2MASS catalog (Cutri et al., 2003) converted to the MKO passbands via Carpenter (2001). | 3.344 0.01 | 10.35 0.03 | 4.58 0.05 | 1 |
(1) This paper; (2) Serabyn et al. 2017. 333;
3.2 Correlated noise
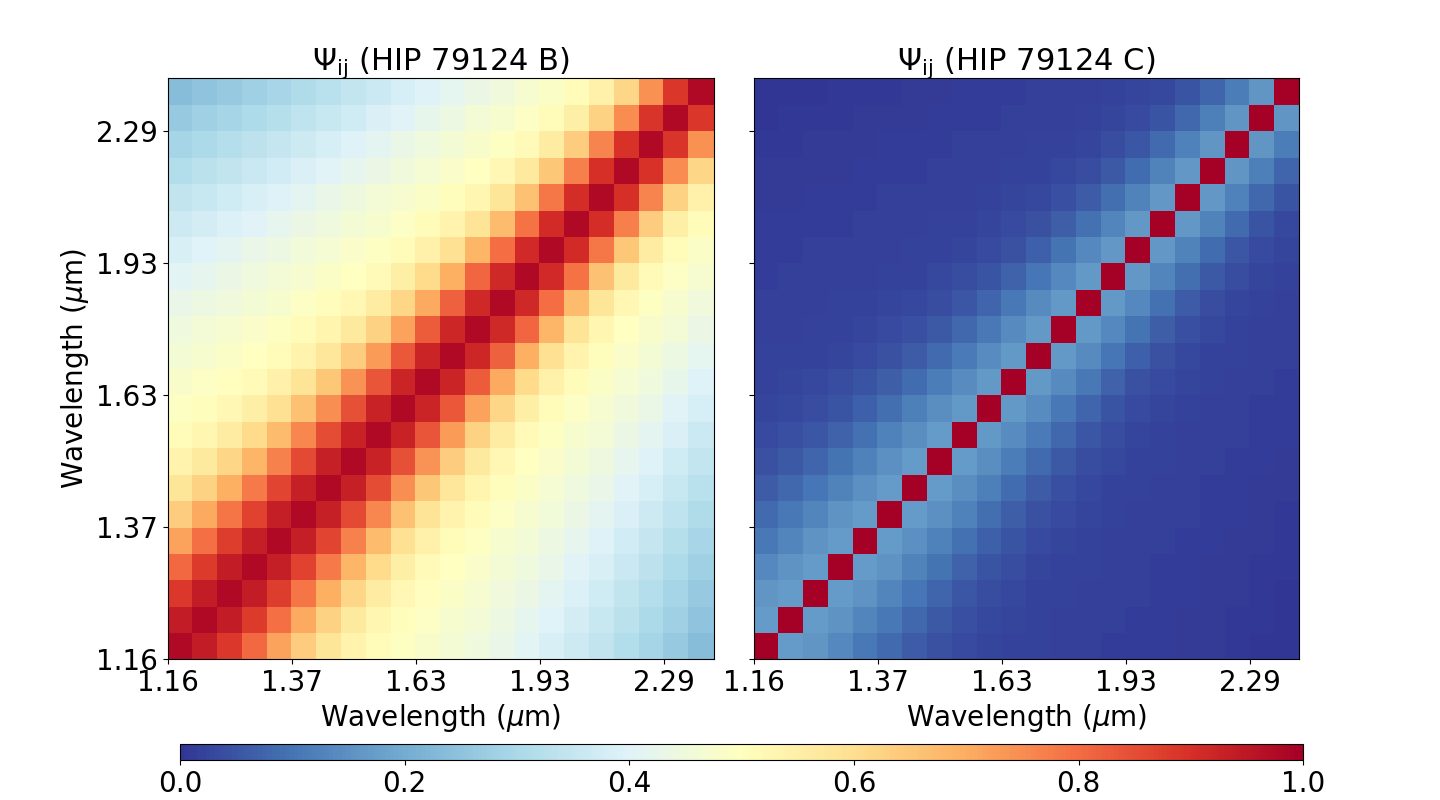
When fitting integral field spectrograph (IFS) data to model spectra, it is of vital importance to consider the effect of covariances to properly retrieve atmospheric parameters. As shown by Greco Brandt (2016), in high-contrast imaging it is not easy to understand the impact that the data analysis techniques have on the extracted spectrum. Following their work, we first compute the spectral correlation at HIP 79124 B’s and C’s positions in the collapsed image. To this aim, we normalize each channel by its standard deviation profile and, for each pair of CHARIS wavelengths and , compute its correlation in a 2 /D-wide ring centered on the companion:
| (1) |
where and are the intensities at wavelengths and , respectively, averaged over all the spatial locations within the annulus, and masking the 2 /D region around the companion.
The correlation matrices for both companions are shown in Figure 3. The noise is very much uncorrelated at the position of HIP 79124 C ( 1 ), with a nearly constant value of 0.2 except for . This might be due to the fact that we used the unsaturated raw image for spectral extraction of this outer companion. For the inner companion at 0.18 , HIP 79124 B, the noise is highly correlated and the correlation varies between channels.
The populated vs distribution can be fit using a Levenberg-Marquardt minimization to the functional form described in Greco Brandt (2016):
| (2) |
where the spatially and spectrally correlated noise have amplitudes Aρ and Aλ, and characteristic lengths and , respectively. Aδ is the amplitude of the uncorrelated term.
We redo this minimization several times at separations bracketing the companions, masking them and any residual satellite spot light. In the case of the B companion, it appears that the spectral covariance is not optimally described by this functional form, as there are two secondary peaks in that flank the main peak at . Comparing plots for different separations, these peaks move out from 1.5 to 2.5, as we go from separations of = 4 to 6 in units of /D. The peaks disappear at = 3 and 7. In any case, our best fit for the B companion at its separation of = 4.25, is Aρ = 0.42, Aλ = 0.54, Aδ = 0.02, = 0.34 and = 0.57. This shows that at the location of the B object, the uncorrelated component Aδ is very much negligible compared to the correlated noise, which is dominant at small separations where speckle noise is not well eliminated. In the case of the C companion the uncorrelated amplitude dominates at = 4.25, with Aρ = 0.12, Aλ = 0.21, Aδ = 0.65, = 2.15 and = 1.69. As we extracted the C spectrum from the unsaturated dataset, the resulting correlation length is large perhaps because the background has not been well flattened from a least-squares PSF subtraction.
4 HIP 79124 empirical constraints
4.1 Spectral Types of HIP 79124 B and C
Although we have adopted an A0V spectral type for the primary star from Houk Smith-Moore (1988), the spectral type of the companions has never been assessed. To get a good estimation, we first compare the CHARIS near-IR spectrum of HIP 79124 B and C to libraries of ML empirical objects in young moving groups. Then, we adopt a second approach, refining the classification by comparing the observed HIP 79124 spectra to a set of 10 Myr-old M-type standard spectra.
4.1.1 Comparison to empirical ML spectra
As HIP 79124 is a member of the USco young star-forming region with an age of only 10 3 Myr (Pecaut Mamajek, 2016), we decide to use libraries of young objects, which are warmer than their field counterpart (and have earlier spectral type) for a given mass, and are still contracting, presenting inflated radii and thus low surface gravities that affect their spectra. An indication of youth in low-resolution near-IR spectra is the triangular -band continuum shape, which becomes less pronounced as one moves from very low () to low () and intermediate-gravity () late - and -type dwarfs. In comparison, field objects tend to show a plateau (e.g., Allers Liu, 2013). Other indicators exist also in the and bands, such as FeH absorption (McLean et al., 2003) or the -band slope (see the H2() index, Canty et al., 2013; Currie et al., 2014a).
We mainly adopt the young population of the Montreal Spectral library 444https://jgagneastro.wordpress.com/the-montreal-spectral-library/ as the source for comparison spectra. These objects are members of nearby young moving groups ( 120 Myr), with spectral types in the range and , and gravities. We consider only high S/N objects, leaving out those with median uncertainties larger than 5 of the median flux value. These spectra come mainly from Gagne et al. (2015) and were obtained with several instruments, such as (Eikenberry et al., 2004) and SpeX (Rayner et al., 2003). Also, we include the near-IR Bonnefoy et al. (2014) VLT/SINFONI library of young dwarfs in the transition (M8.5–L4).
In the chi-square goodness of fit statistic we incorporate the correlated errors via the covariance matrix :
| (3) |
where is the set of observed spectral values by CHARIS. To create a similar set of these flux values for each of the comparison spectra, we first smooth the empirical model to the CHARIS low resolution. Then, for each of the 22 CHARIS channels spanning the 1.1 – 2.4 m range, we estimate a flux value via interpolation. In this way we create a vector for each empirical object that will be compared to . The comparison object is multiplied by a constant , which was introduced in Cushing et al. (2008), that minimizes and accounts for the distance difference between the observed CHARIS spectrum and the empirical object. We focus on regions covering the major passbands, avoiding strong telluric absorption, leaving us with 15 out of the 22 channels that will be used for the comparison.
To construct the 22 22 covariance matrix , we use the correlation matrix presented in Figure 3 for the B and C companions. The off-diagonal elements of are multiplied by the uncertainty in the flux of the corresponding channels. For the outer companion, the error bars from the extracted spectrum are on the order of 0.1 , and the absolute calibration uncertainty dominates, with values 2–4 of the observed flux. The on-diagonal are also affected by the uncertainties on the uncorrelated comparison spectrum, which we add in quadrature to the correlated errors.
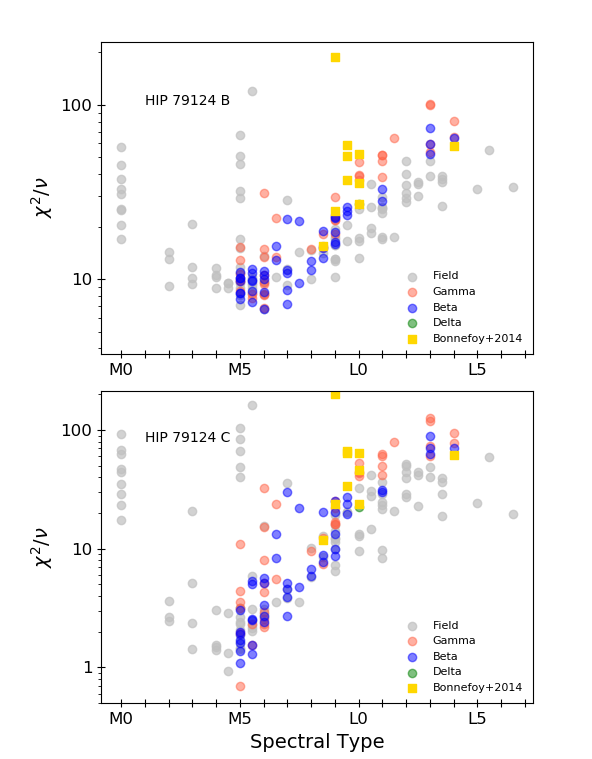
Figure 4 shows the resulting per degree of freedom for the Montreal and Bonnefoy libraries, filtered out for objects with a signal to noise lower than 5 %. For the outer C companion, M3–M5.5 objects fall within the 95 confidence level for 15 degrees of freedom. Low-gravity comparison objects with spectral types earlier than M5 are unavailable. In any case, the best-fit empirical spectrum is the low-gravity M5 2MASS J0259-4232 object in the 20–40 Myr-old Columba association (Rodriguez et al., 2013).
The situation for the inner companion is however more complicated, as the large correlation among the channels yield results that are higher than in the non-correlated scenario. It also broadens the space of good-fit models (see Greco Brandt (2016)), which we clearly see in the bow-shape distribution for HIP 79124 B. In this case none of the empirical spectra fall within the 95 confidence region. For this reason, we adopt a confidence interval of (e.g., Thalmann et al., 2013), which encompasses spectral types in the range M5–M7.
4.1.2 Comparison to M-type composite standard spectra
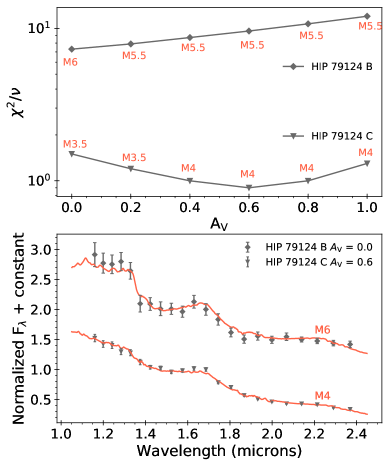
Here, we adopt the dereddened near-IR standard spectra constructed by Luhman et al. (2017), where they combine several optical spectra for each subtype in the M spectral region. These resulting templates are representative of young associations and can be used for classifying the spectral type of young stars. We take the set of templates produced from a population of objects members of both USco and the TW Hya association (TWA). TWA is located at 50 pc and, like USco, it has an estimated age of 10 Myr (Webb et al., 1999; Mamajek, 2005; Donaldson et al., 2016). Following the same procedure as for the library of empirical spectra, we compare the spectrum of HIP 79124 B and C with this set of M-type standard spectra. The results are shown in Figure 5. The outer companion is well reproduced in the bands by the M3–M5 spectral standards. The best-fit falls in the M4 type, which is particularly successful at duplicating the -band part of the spectrum. The B companion finds a clear minimum in the M5.5–M6 spectral type regime, where both the are very well matched.
The passband of the CHARIS spectrum of B is slightly brighter than the standard spectra, and it is so consistently for all the spectral types fitting well the bands. This might be due to speckle contamination at the shortest wavelengths by the primary star, given the small projected distance at which HIP 79124 B is located. The Strehl ratio (for a given residual wavefront error) and S/N are also lower at these wavelengths, which ultimately may lead to a suboptimal spectral extraction. Another possibility is that we overestimated the extinction of HIP 79124 B, as in some cases components of young multiple systems have different reddening factors (Kevin Luhman, priv. comm.). We thus adopt a series of different AV and compute their corresponding AJ, AH and A extinction factors using the relations from Fiorucci Munari (2003). In the upper panel of Figure 6 we show the best-fit standard spectrum for each AV value for both HIP 79124 B and C. In the lower panel we show the best-fit spectrum for the combined extinction-spectral type set of parameters. The extinction that minimizes the residuals for the outer companion seems to agree quite well with the derived reddening factor of the primary star (AV = 0.82). However, a extinction-free scenario for B reproduces the SCExAO/CHARIS data much better. As the spectral types are consistent with those obtained in Figure 5, for the rest of the calculations we will assume that the computed reddening for the primary star applies to the triple system.
4.1.3 Final adopted spectral types
Based on the comparison with empirical spectra from the Montreal library and with the Luhman et al. (2017) standard templates, here we summarize the final spectral types and uncertainties that we adopt for the companions. For the C component, from Section 4.1.1 we obtained a 95 confidence level for M3–M5.5 spectral types, with a dearth of young objects in the Montreal library for spectral types earlier than M5, and an M4 best-fit from Section 4.1.2. We adopt a final spectral type of M4 0.5, which accurately reproduces the passbands of 10 Myr standard spectra (see Figure 5). For the inner B companion we adopt a spectral type of M6 0.5. The Montreal objects favor an M6-type, and a minimum at M5.5–M6 is found using the standard templates.
4.2 HR diagram: age of the HIP 79124 triple system
Once we have an estimation of the spectral type for each object in the triple system, we place its members on a Hertzsprung-Russell (HR) diagram to compare their position with theoretical models. This will hopefully allow us to constrain the age of the coeval system using such a diverse range of masses.
We estimate effective temperatures (Teff) and bolometric corrections (BC) from two different sources in the literature of young objects; Kraus Hillenbrand (2007) presented a set of spectral type models optimized with empirical data from the open cluster Praesepe, with an age of 600 Myr. More recently, Pecaut Mamajek (2013) used young moving group (5–30 Myr) members to also build a Teff scale by comparing their spectral energy distribution to BT-Settl atmospheric models (Allard et al., 2012), covering spectral types down to M5.
4.2.1 Temperature and luminosity of the companions
The estimated M4 0.5 spectral type for the C companion corresponds to a Teff = 3160 140 K and BCJ = 1.91 0.05 mag from the table of young objects in Pecaut Mamajek (2013). From the SCExAO/CHARIS dereddened absolute magnitude in band shown in Table 3, using the BCJ value we get a MBOL(C) = 7.27 0.07 mag, which translates into a luminosity of log((C)/) = -1.01 0.03 dex for a solar absolute magnitude of 4.755 mag.
Similarly for HIP 79124 B, we obtain a Teff = 2840 90 K from Kraus Hillenbrand (2007). Pecaut Mamajek (2013) do not count with values for young stars beyond M5, but the error bar encompasses their young M5 Teff, and a spectral type later than M6.5 is hardly a good fit to the data, as seen in Section 4.1.2. Given that no bolometric color correction is available for such a late spectral type in Pecaut Mamajek (2013), and that there is the possibility of some contamination from the primary star at short wavelengths, we obtain a BCK = 3.03 0.13 mag from Golimowski et al. (2004) for the best-fit field M6 dwarf. That leads to MBOL(B) = 9.2 0.2 mag and log((B)/) = -1.77 0.08 dex.
| Band | Wavelength | Flux | Reference |
|---|---|---|---|
| Bandwidth | (10-10 erg s-1 cm-2 m-1) | ||
| U | 0.3620 0.1380 | 242.469 11.628 | (1, 2) |
| B | 0.4412 0.1816 | 399.360 19.153 | (1, 2) |
| Gbp | 0.5050 0.2347 | 303.500 0.376 | (3, 4) |
| V | 0.5529 0.1129 | 290.463 6.965 | (1, 2) |
| G | 0.6230 0.4183 | 209.466 0.077 | (3, 4) |
| Grp | 0.7730 0.2757 | 130.538 0.181 | (3, 4) |
| J | 1.2603 0.2095 | 41.282 1.980 | (1, 5) |
| H | 1.6652 0.1362 | 17.389 1.501 | (1, 5) |
| K | 2.2094 0.2142 | 6.287 0.271 | (1, 5) |
| W1 | 3.350 0.660 | 1.347 0.045 | (6) |
| IRAC 2 | 4.4930 1.0200 | 0.443 0.005 | (7, 8) |
| W2 | 4.600 1.040 | 0.398 0.007 | (6) |
| IRAC 4 | 7.8720 2.8810 | 0.0499 0.0004 | (7, 8) |
4.2.2 Temperature and luminosity of the host star
In this case, we take two different approaches. First, as done for the B and C companions, from Pecaut Mamajek (2013) we can obtain a Teff = 9700 700 K with an uncertainty of one subclass in the spectral type. As we have a well defined reddening factor in the band, we use it to calculate a bolometric magnitude MBOL(A) = 1.1 0.2. We adopted the apparent magnitude from Hinkley et al. (2015), the GAIA-DR2 distance (Lindegren et al., 2018) and BCV for A0 stars in Pecaut Mamajek (2013). This value is compatible within error bars with the result presented in Hinkley et al. (2015), although our computation is slightly brighter, as we have adopted the updated GAIA-DR2 distance. This magnitude corresponds to log((A)/) = 1.46 0.08 dex.
On the other hand, we attempt to refine these values by constructing the spectral energy distribution of HIP 79124 A from the data in the literature (see Table 4). We deredden the observed photometry by using a second-order polynomial fit to the values derived in Section 3.1, and refrain from using photometric points at wavelengths 10 m, as they might be affected by the two low-mass companions. We then fit BT-Settl models (Allard et al., 2012) with = 4.5 dex and , with solar reference abundances from Caffau et al. (2011), to the data via the G goodness-of-fit statistic presented in Cushing et al. (2008), which accounts for the individual filter widths. As the reddening factor for the entire wavelength range is uncertain (especially for the shortest wavelengths), we simply adopt an error bar of 5 the flux of each passband. The results are presented in Figure 7. There is a minimum at 9200 K. Well-fitting models are again taken if their G values are smaller than . That signifies an uncertainty of 600 K, probably due to the absence of photometric values with 0.36 m and the effect of reddening. On the other hand, integrating the best-fit BT-Settl spectrum of Teff = 9200 600 K and using the GAIA-DR2 distance, we obtain log((A)/) = 1.40 0.07 dex
The two different approaches are clearly consistent with each other within error bars. To place HIP 79124 A in a HR diagram, we adopt the mean of the resulting values, and their scatter as uncertainty. In this way, we consider for the primary a Teff = 9450 250 K and log((A)/) = 1.43 0.03 dex for HIP 79124 A.
4.2.3 HR diagrams
The HIP 79124 system includes one high-mass star, just arrived (or about to) in the main sequence, and two low-mass pre-main sequence companions contracting along a Hayashi track (Siess et al., 2000; Pecaut et al., 2012). The different physical processes occurring on these objects might pose difficulties to the pre-main sequence evolution models, which (if accurate) should be expected to yield a common age estimate for the entire system. For the similar, albeit older, HD 1160 triple system studied by Garcia et al. (2017), the primary A-type star was on/just beginning to evolve off the main sequence and its two low-mass (M star) companions were closer to the main sequence. In this case, isochrone comparisons for the primary yielded younger age estimates than those for the two low-mass companions. Our study allows a similar analysis at young ages.
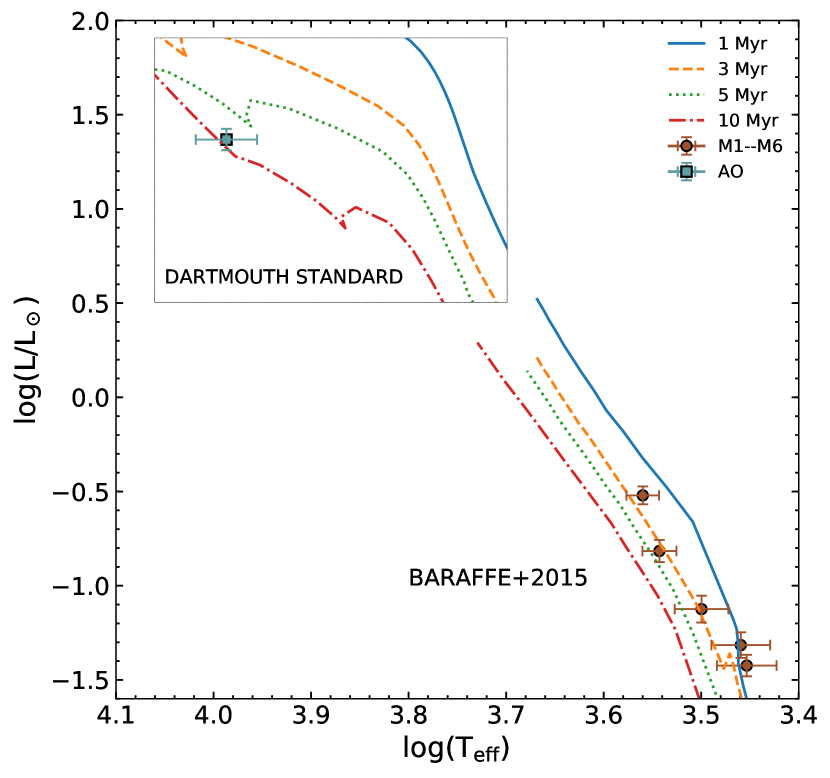
Figure 8 shows the luminosity-Teff diagram of the HIP 79124 triple system, where the objects are compared with evolutionary models at different ages. We use a different set of solar-metallicity evolutionary tracks to derive a range of well-fitting ages: the MESA Isochrones Stellar Tracks (MIST, Paxton et al., 2011, 2013, 2015; Choi et al., 2016; Dotter, 2016) for the massive primary star and HIP 79124 C; the PARSEC-COLIBRI stellar isochrones (Marigo et al., 2017) encompassing the triple system; both the original Dartmouth Stellar Evolution isochrones (Dotter et al., 2008) and those accounting for magnetic inhibition of convection555http://github.com/gfeiden/MagneticUpperSco/, which should be reliable for systems that are approximately 10 Myr, as the surface magnetic field strengths in those models were tuned for modeling 10 Myr systems (Feiden, 2016); and the BHAC15 Baraffe et al. (2015) evolutionary tracks for low-mass objects for the B and C companions.
The isochrones are sufficiently well-spaced to derive precise age estimates for each component. Early-type stars evolve onto the main sequence along a Henyey track both horizontally and vertically in an HR diagram. Close to the main-sequence “turn-on”, small errors in the temperature/luminosity can translate into larger uncertainties in the component age. Fortunately, as shown in Figure 8, HIP 79124 A resides in a region on the HR diagram sufficiently away from the MS turn-on for early A stars: differences in predicted luminosities/temperatures for isochrones at 1–10 Myr are significantly larger than measurement uncertainties. While uncertainties are larger for HIP 79124 BC, the vertical spacing for isochrones for low-mass stars is larger, 0.1-0.2 dex.
Pecaut Mamajek (2016) reported an age spread of 7 Myr for their adopted 10- Myr US subregion, finding an age gradient within the subgroup where stars are older as they blend with UCL. This seems to be consistent with a star-formation history that might explain the conflict in the derived ages between hot and cold stars (Fang et al., 2017). If this was indeed the case, the models would deliver the same age estimates for the three HIP 79124 objects. However, as presented in Table 5, we find that the primary seems to be consistently older for the models ( 6 Myr) than the B and C components ( 3 Myr). The PARSEC-COLIBRI isochrones differ significantly from the rest of models for the two low-mass companions, as it has also been the case in previous studies (e.g., Kraus et al., 2015). This might be due to the artificial shift to the models made to fit the observed mass-radius relation for low-mass stars (Chen et al., 2014). For this reason, we do not consider their derived values to compute the mean age of HIP 79124 B and C.
The fact that the models predict a younger age for low-mass objects compared to the massive primary is in line with the results by Pecaut Mamajek (2016), where essentially all the objects with a later type than M0 are inferred to have an age below 5 Myr, moving to younger ages as the stars are cooler. Also, an age of 6 Myr for the primary star is indeed expected from the location of the HIP 79124 system in the USco subregion. Figure 9 in Pecaut Mamajek (2016) shows a map of the spatial distribution of derived median-ages within the Sco-Cen complex. In this diagram, HIP 79124 falls exactly in the northern part of USco where stars tend to be younger than the mean age of the subregion.
The magnetic isochrones from Feiden (2016), which take into account the possible magnetic inhibition of convection in young low-mass stars, seem to provide a more compatible age estimate between the A and C components. Another effect linked to magnetic fields is the occurrence of spots on the surface of young stars. Spotted stars not only cause inflated radii at all ages, but they also experience a decrease in their luminosity and temperature (the latter especially for low-mass stars), which may produce a dispersion in the HR diagram. As found by Somers Pinsonneault (2015), this effect makes PMS stars appear younger and less massive when spots are present. Although the scatter does not seem to be high enough to explain the global age-mass discrepancy, it might be a contributor to take into account. In this way, we can apply the age correction factors derived in Somers Pinsonneault (2015) to our 3-Myr HIP 79124 B and C companions. Assuming that 1/6 of the stellar surface is covered by spots, we find that C would have an age of 6 Myr (for a corresponding mass of 250 MJup, see Section 4.3). The B companion is not massive enough to derive a correction factor from the models, but its age would certainly lay beyond 6 Myr. This is very much in line with the observed age of the primary star. Indeed, the fact that models do not reproduce the effect of magnetic fields, which slow down the contraction of PMS stars and affect their luminosity and temperature, appears to explain our results well.
Another source of uncertainty in the PMS ages arises from the physical processes that contribute to the initial position of the star in the HR diagram at , from which the contraction follows. The radius at which the contraction starts varies with early accretion rate, which creates a spread in radii (and luminosities) with which the stars of different masses are born (e.g., Hartmann, 2003; Soderblom et al., 2014). This introduces uncertainties on the contraction ages, especially for intermediate-mass stars (Hartmann et al., 2016). In the case of HIP 79124 A, a shift in luminosity of log() 0.5 dex would be required for it to match the 3 Myr-old isochrone that better fits the age of the low-mass companions. This means that for the triple system to have common ages, the birthline for intermediate-mass stars would need to be corrected to a lower luminosity level by a factor of 3.
Finally, in a similar fashion to what has been done for the HIP 79124 companions, we have obtained an estimation of the luminosity and temperature of the stars in the vicinity (within 10 ) of HIP 79124 A. We found five M-type stars members of USco confirmed by the BANYAN tool (Gagne et al., 2018), which are confronted in Figure 9 against the BHAC15 isochrones. When no extinction factors were available or we could not calculate them, we adopted the same extinction as for HIP 79124 A, and an uncertainty of 0.5 mag. If the calculated extinction was non-physical, i.e., negative, AV was set to zero. We have also included the closest massive star to HIP 79124 A, which also happens to be an A0-type star at about 28 , compared to the Dartmouth standard models. In the same way as for the HIP 79124 system, the low-mass stars tend to give an age of 3 Myr, about half of the age that the Dartmouth models estimate for the A0 star (5–10 Myr).
4.3 Mass of the HIP 79124 triple system
We thus consider an age of 6 1 Myr for HIP 79124, derived from the primary A0-type star. With this parameter well constrained, the observed photometry presented in Table 2 and 3 and the excellent accuracy in the distance to the system taken from GAIA-DR2, we can derive the mass of B and C using the BHAC15 isochrones (Baraffe et al., 2015).
Figure 10 shows an approximate mass for the low-mass companions using photometry derived from our CHARIS data and Keck/NIRC2 photometry. The close M6-type B companion agrees well with a mass of 100 MJup. Hinkley et al. (2015) reported a mass of 135 MJup for an age of 10 Myr from Lp observations, as we similarly obtain for 6 Myr. It is interesting to note that this object seems to be slightly brighter in and Lp bands than in and . The effect in can be explained by the object simply being bright in this band, or it might also be due to slight contamination from the primary star (see Section 4.1.2), while in the object appears to be somewhat red compared to what it is predicted by BT-Settl models (Allard et al., 2012; Baraffe et al., 2015). C is more massive and it is found to fall at 350 MJup in all bands, which proves the consistency of our derived photometry coupled with the extracted magnitudes from Keck/NIRC2 archival data. If we considered an age of the system of 3 Myr, as obtained from the models for the low-mass companions, B and C would have respective estimated masses of 55 MJup and 250 MJup. Applying the correction for spotted stars from Somers Pinsonneault (2015) for the C companion, its mass would be of the order of 310 MJup, very close to the mass obtained using the age derived from the primary, which indicates that magnetic fields have an important role in the observed discrepancy.
This same effect can be translated to the inferred masses of exoplanets discovered by direct imaging in star-forming regions. For instance, the recent planetary-mass companion revealed within the transition disk around the 5 Myr-old PDS 70 star (Keppler et al., 2018) is estimated to have a mass of 5 MJup from its photometry, using the hot-start COND models (Baraffe et al., 2003). As PDS 70 is a low-mass K7-type star in Upper Centaurus-Lupus group (with a mean age of 16 2 Myr (Pecaut Mamajek, 2016)), one might hypothesize that the real age of the system could be underestimated. If PDS 70 was older by a factor of 2, as we see for HIP 79124, the planetary-mass companion would be more massive, of 7 MJup, using again the COND models. Similarly, the ROXs 42B T Tauri binary star with an M0-type primary, is a member of the Oph complex, and hosts a directly imaged companion. According to the COND models, this circumbinary object lies in the planetary-mass regime with 10 MJup (Currie et al., 2014b). If instead of 2.5 Myr the system age was twice of that, the mass of the planet would increase up to 13 MJup.
| Model | A | B | C |
|---|---|---|---|
| MIST | 5 1 | – | 2 1 |
| PARSEC-COLIBRI | 6 1 | 17 5 | 5 |
| Dartmouth std | 6 1 | – | 3 1 |
| Dartmouth mag | – | – | 4 |
| Baraffe+2015 | – | 3 2 | 2 1 |
| Mean | 6 1 | 3 2 | 3 1 |
4.4 Formation scenario
Given the stellar nature of the companions, the natural approach to study the formation path of the low-mass stars would be to consider the fragmentation of the molecular cloud that gave origin to the HIP 79124 system. Indeed, radiation hydrodynamical calculations by Bate (2012) show that the initial mass function (IMF) of the formed objects peak at about the masses of HIP 79124 B and C. These simulations also reproduce a formation timescale for a massive A-type star that is very similar (well below 1 Myr difference) to that of low-mass objects down to the brown dwarf regime. Triple systems however seem to be rare, with a frequency of 4 , as also found by observational results (e.g., Daemgen et al., 2015), and a separation distribution culminating at 100 AU.
An intriguing possibility is that the two low-mass stellar companions are formed via gravitational instability (GI). In this scenario, a massive and cold disk may gravitationally collapse and break down in fragments of sizes ranging from planetary-mass companions to low-mass stars on wide orbits (e.g., Boss, 1998; Rafikov Goldreich, 2005). For one of these fragments to form, the cooling timescale needs to be shorter than the orbital period, which also assures coevality of the triple system in the GI scenario (Gammie, 2001). Recent models are able to generate a synthetic population of GI-formed objects, and dynamically evolve the system before and after disk dispersal (Forgan Rice, 2013; Forgan et al., 2015, 2018). These predictions have been tested against high-contrast direct imaging data, showing that, if substellar objects at separations 30 AU are indeed formed via GI, this formation method is rare (Vigan et al., 2017).
For solar-mass stars with protoplanetary disks extending up to 100 AU, models by Forgan et al. (2018) resulted in the formation of companions as massive as 120 MJup. Stamatellos Whitworth (2009) also showed that the fragmentation of a 400 AU disk around a 0.7 star can give rise to a broad range of companions, 30 of them being low-mass stars (up to 200 MJup). This indeed could be the formation process to explain the location of HIP 79124 B, a 100 MJup star located at a projected separation of only 25 AU.
| HIP 79124 | Distance | Spectral Type | Teff | log() | Age | Mass | Sep. | PA |
|---|---|---|---|---|---|---|---|---|
| (pc) | (K) | (dex) | (Myr) | (MJup) | (mas) | () | ||
| A | 137.0 1.2a𝑎aa𝑎aFrom the WISE W1 channel (Cutri et al., 2012) | A0Vb𝑏bb𝑏bFrom Houk Smith-Moore (1988) | 9450 250 | 1.43 0.03 | 6 1 | – | – | – |
| B | – | M6 0.5 | 2840 90 | -1.77 0.08 | 3 2 | 100 30 | 180 5 | 252.9 1.6 |
| C | – | M4 0.5 | 3160 140 | -1.01 0.03 | 3 1 | 330 30 | 967 6 | 100.39 0.03 |
5 Conclusions
We have presented the first spectrophotometric study of the USco HIP 79124 triple system with SCExAO/CHARIS. Combining low-resolution spectroscopy with archival photometry from Hinkley et al. (2015) and Serabyn et al. (2017), we estimate the spectral types of the companions, which altogether serves as a diagnostic to derive the age of the system and the masses of the low-mass objects. The key results of our analysis can be summarized as
-
–
SCExAO/CHARIS detects HIP 79124 B and C in low-resolution mode without the employment of any PSF-subtraction algorithm at a S/N of 9 and 120 and at distances of 0.18 and 0.97 , respectively.
-
–
We account for the correlated noise present in IFS data (Greco Brandt, 2016). B falls in a highly-correlated regime, even for well-separated wavelength channels. In the case of the outer C companion, the uncorrelated amplitude is predominant. Using these correlated errors, we find that young ( 10 Myr) standard objects from Luhman et al. (2017) best match the spectra of B (M6) and C (M4).
-
–
We assemble an HR diagram where we place the triple system, and confront their luminosity-Teff values with several theoretical models to assess a common age estimate. However, the primary star is found to have an age of 6 Myr, while the models consistently deliver about half this age for the low-mass companions.
-
–
This age-mass discrepancy for young low-mass stars is in line with the results seen in several young regions such as Sco-Cen (Pecaut Mamajek, 2016). As HIP 79124 should be coeval with the three objects forming in timescales ¡ 1 Myr (Bate, 2012), this result strongly points towards the fact that the models do not reproduce well enough the PMS phase of low-mass stars.
-
–
Adopting the age of the primary star for the entire system, we find a mass of B of 100 MJup, and 330 MJup for C. Given their masses and small orbital separation, there is the possibility that these objects formed via disk instability (e.g., Forgan et al., 2018).
-
–
This effect can alter the mass of the directly-imaged companions to low-mass stars, if the age of the system is derived from isochronal fits to the photometric data of the host star.
We have demonstrated the SCExAO/CHARIS capabilities by resolving a very packed system and constraining their properties through low-resolution spectroscopy. For this very likely coeval system, models predict an older age for the A0-type primary star than for the low-mass companions. This result might be related to magnetic field effects, which implies that the models do not reproduce with enough accuracy the contraction rate of low-mass PMS stars or the presence of stellar spots , and thus deliver a younger age (Somers Pinsonneault, 2015; Feiden, 2016; Somers Stassun, 2017). Further observations of this system could constrain the orbit of the B companion to derive its period and a more reliable mass estimate.
Acknowledgements.
We thank Kevin Luhman, Eric Mamajek, and Mark Pecaut for helpful draft comments. We wish to emphasize the pivotal cultural role and reverence that the summit of Maunakea has always had within the indigenous Hawaiian community. We are most fortunate to have the privilege to conduct scientific observations from this mountain. R.A.-T. and M.J. gratefully acknowledge funding from the Knut and Alice Wallenberg foundation. S.D. acknowledges support from the “Progetti Premiali” funding scheme of the Italian Ministry of Education, University, and Research. E. A. is supported by MEXT/JSPS KAKENHI grant No. 17K05399. M.T. is supported by MEXT/JSPS KAKENHI grant Nos. 18H05442, 15H02063, and 22000005.M. H. is supported by the Grant-in-Aid for Scientific Research on Innovative Areas (2302, 23103002) under the Ministry of Education, Culture, Sports, Science and Technology (MEXT) of Japan. This research has benefited from the Montreal Brown Dwarf and Exoplanet Spectral Library, maintained by Jonathan Gagne. This work has made use of data from the European Space Agency (ESA) mission Gaia (https://www.cosmos.esa.int/gaia), processed by the Gaia Data Processing and Analysis Consortium (DPAC, https://www.cosmos.esa.int/web/gaia/dpac/consortium). Funding for the DPAC has been provided by national institutions, in particular the institutions participating in the Gaia Multilateral Agreement.References
- Allard et al. (2012) Allard, F., Homeier, D., Freytag, B. 2012, RSPTA, 370, 2765
- Allers Liu (2013) Allers, K. N., Liu, M. C. 2013, ApJ, 772, 79
- Barman et al. (2011) Barman, T. S., Macintosh, B., Konopacky, Q., Marois, C., 2011, ApJ, 735, L39
- Bell et al. (2015) Bell, C. P. M., Mamajek, E. E., Naylor, T. 2015, MNRAS, 454, 593
- Baraffe et al. (2003) Baraffe, I., Chabrier, G., Barman, T. S., et al. 2003, AA, 402, 701
- Baraffe et al. (2015) Baraffe, I., Homeier, D., Allard, F., et al. 2015, AA, 577, 42
- Bate (2012) Bate, M. R. 2012, MNRAS, 419, 3115
- Biller Bonnefoy (2018) Biller, B., Bonnefoy, M. 2018, 2018arXiv180705136B
- Bonnefoy et al. (2014) Bonnefoy, M., Chauvin, G., Lagrange, A. M., et al. 2014, A&A, 562, 127
- Boss (1998) Boss, A. P. 1998, ApJ, 503, 923
- Bowler (2016) Bowler, B. 2016, PASP, 128, 2001
- Brandt et al. (2017) Brandt, T. D., Rizzo, M., Groff, T., et al. 2017, JATIS, 3d8002B
- Caffau et al. (2011) Caffau, E., Ludwig, H.-G., Steffen, M., et al. 2011, Sol. Phys., 268, 255
- Canty et al. (2013) Canty, J. I., Lucas, P. W., Roche, P. F., et al. 2013, MNRAS, 435, 2650
- Carpenter (2001) Carpenter, J. M. 2001, AJ, 121, 2851
- Carpenter et al. (2006) Carpenter, J. M., Mamajek, E. E., Hillenbrand, L. A., et al. 2006, ApJ, 651, 49
- Chen et al. (2014) Chen, Y., Girardi, L., Bressan, A., et al. 2014, MNRAS, 444, 2525
- Choi et al. (2016) Choi, J., Dotter, A., Conroy, C., et al. 2016, ApJ, 823, 102
- Cook et al. (2017) Cook, N. J., Scholz, A., Jayawardhana, R. 2017, AJ, 154, 256
- Currie et al. (2011) Currie, T., Burrows, A., Itoh, Y., et al. 2011, ApJ, 729, 128
- Currie et al. (2014a) Currie, T., Daemgen, S., Debes, J. H., et al. 2014, ApJ, 780, L30
- Currie et al. (2014b) Currie, T., Burrows, A., Daemgen, S. 2014, ApJ, 787, 104
- Currie et al. (2015) Currie, T., Cloutier, R., Brittain, S., et al., 2015, ApJ, 814, L27
- Currie et al. (2018a) Currie, T., Kasdin, N. J., Groff, T. D., et al. 2018, PASP, 130, 4505
- Currie et al. (2018b) Currie, T., Brandt, T. D., Uyama, T., et al. 2018, AJ in press, 1810.09457
- Cushing et al. (2008) Cushing, M. C., Marley, M. S., Saumon, D., et al. 2008, ApJ, 678, 1372
- Cutri et al. (2003) Cutri, R. M., Skrutskie, M. F., van Dyk, S., et al. 2003, yCat, 2246, 0
- Cutri et al. (2012) Cutri, R. M., Wright, E. L., Conrow, T., et al. 2012, yCat, 2311, 0
- Daemgen et al. (2015) Daemgen, S., Bonavita, M., Jayawardhana, R., et al. 2015, ApJ, 799, 155
- de Zeeuw et al. (1999) de Zeeuw P. T., Hoogerwerf R., de Bruijne J. H. J., et al. 1999, AJ, 117, 354
- Donaldson et al. (2016) Donaldson, J. K., Weinberger, A. J., Gagne, J., et al. 2016, ApJ, 833, 95
- Dotter et al. (2008) Dotter, A. Chaboyer, B., Jevremovic, D., et al. 2008, ApJS, 178, 89
- Dotter (2016) Dotter, A. 2016, ApJS, 222, 8
- Eikenberry et al. (2004) Eikenberry, S., Elston, R., Raines, S., et al. 2004, SPIE, 5492, 1196
- Faherty et al. (2016) Faherty, J. K., Riedel, A. R., Cruz, K. L., et al. 2016, ApJS, 225, 10
- Fang et al. (2017) Fang, Q., Herczeg, G. J., Rizzuto, A. 2017, ApJ, 842, 123
- Feiden (2016) Feiden, G. A. 2016, A&A, 593, 99
- Fiorucci Munari (2003) Fiorucci M., Munari U. 2003, A&A, 401, 781
- Forgan Rice (2013) Forgan D., Rice K. 2013, MNRAS, 432, 3168
- Forgan et al. (2015) Forgan D., Parker, R. J., Rice, K. 2015, MNRAS, 447, 836
- Forgan et al. (2018) Forgan, D. H., Hall, C., Meru, F., et al. 2018, MNRAS, 474, 5036
- Gagne et al. (2018) Gagne, J., Mamajek, E. E., Malo, L., et al. 2018, ApJ, 856, 16
- Gagne et al. (2015) Gagne, J., Faherty, J. K., Cruz, K. L., et al. 2015, ApJS, 219, 33
- Gaia coll. (2018) Gaia Collaboration, Brown, A. G. A., Vallenari, A., et al. 2018, A&A, 616, 1
- Gammie (2001) Gammie, C. F. 2003, ApJ, 553, 174
- Garcia et al. (2017) Garcia, E. V., Currie, T., Guyon, O., et al. 2017, ApJ, 834, 162
- Golimowski et al. (2004) Golimowski, D. A., Leggett, S. K., Marley, M. S., et al. 2004, AJ, 127, 3516
- Greco Brandt (2016) Greco, J. P., Brandt, T. D. 2016, ApJ, 833, 134
- Groff et al. (2013) Groff, T., Peters, M., Kasdin, N., et al. 2013, AAS, 22134510G
- Hartmann (2003) Hartmann, L. 2003, ApJ, 585, 398
- Hartmann et al. (2016) Hartmann, L., Herczeg, G., Calvet, N. 2016, ARAA, 54, 135
- Herczeg Hillenbrand (2015) Herczeg, G. J., Hillenbrand, L. A. 2015, ApJ, 808, 23
- Hillenbrand (1997) Hillenbrand, L. A. 1997, AJ, 113, 1733
- Hinkley et al. (2015) Hinkley, S., Kraus, A. L., Ireland, M. J., et al. 2015, ApJ, 806, 9
- Houk Smith-Moore (1988) Houk, N., Smith-Moore, M. (ed.) 1988, in Michigan Spectral Survey, Vol. 4 (Ann Arbor, MI: Dept. of Astronomy, Univ. of Michigan)
- Jasmin et al. (2016) Robert, J., Gagne, J., Artigau, E., et al. 2016, 830, 144
- Jordi et al. (2010) Jordi, C., Gebran, M., Carrasco, J. M., et al. 2010, A&A, 523, 48
- Jovanovic et al. (2015) Jovanovic, N., Martinache, F., Guyon, O., et al. 2015, PASP, 127, 890
- Keppler et al. (2018) Keppler, M., Benisty, M., Müller, A., et al. 2018, A A, 617, 44
- Kouwenhoven et al. (2005) Kouwenhoven, M. B. N., Brown, A. G. A., Zinnecker, H., et al. 2005, A A, 430, 137
- Kouwenhoven et al. (2007) Kouwenhoven, M. B. N., Brown, A. G. A., Kaper, L. 2007, A&A, 464, 581
- Kraus Hillenbrand (2007) Kraus, A. L., Hillenbrand, L. A. 2007, AJ, 134, 2340
- Kraus Hillenbrand (2009) Kraus, A. L., Hillenbrand, L. A. 2009, ApJ, 704, 531
- Kraus et al. (2015) Kraus, A. L., Cody, A. M., Covey, K. R., et al. 2015, ApJ, 807,3
- Lafreniere et al. (2014) Lafreniere, D., Jayawardhana, R., van Kerkwijk, M. H., et al. 2014, ApJ, 785, 47
- Lindegren et al. (2018) Lindegren, L., Hernandez, J., Bombrun, A., et al. 2018, A&A, 616, 2
- Luhman et al. (2003) Luhman, K. L., Stauffer, J. R., Muench, A. A., et al. 2003, ApJ, 593, 1093
- Luhman Mamajek (2012) Luhman, K. L., Mamajek, E. E. 2012, ApJ, 758, 31
- Luhman et al. (2017) Luhman, K. L., Mamajek, E. E., Shukla, S. J., et al. 2017, AJ, 153, 46
- Luhman et al. (2018) Luhman, K. L., Herrmann, K. A., Mamajek, E. E., et al. 2018, ApJ, 156, 76
- Mamajek (2005) Mamajek, E. E. 2005, ApJ, 634, 1385
- Mann von Braun (2015) Mann, A. W., von Braun, K. 2015, PASP, 127, 102
- Marigo et al. (2017) Marigo, P., Girardi, L., Bressan, A., et al. 2017, ApJ, 835, 77
- Marois et al. (2006) Marois, C., Lafreniere, D., Doyon, R. 2006, ApJ, 641, 556
- Mawet et al. (2014) Mawet, D., Milli, J., Wahhaj, Z., et al. 2014, ApJ, 792, 97
- McLean et al. (2003) McLean, I. S., McGovern, M. R., Burgasser, A. J., et al. 2003, ApJ, 596, 561
- Myers et al. (2015) Myers, J. R., Sande, C. B., Miller, A. C., et al. 2015, Vizier Online Data Catalog 5145
- Paxton et al. (2011) Paxton B., Bildsten, L., Dotter, A., et al. 2011, ApJS, 192, 3
- Paxton et al. (2013) Paxton B., Cantiello, M., Arras, P., et al. 2013, ApJS, 208, 4
- Paxton et al. (2015) Paxton B., Marchant, P., Schwab, J., et al. 2015, ApJS, 220, 15
- Pecaut et al. (2012) Pecaut M. J., Mamajek E. E., Bubar, E., J. 2012, ApJ, 746, 154
- Pecaut Mamajek (2013) Pecaut M. J., Mamajek E. E. 2013, ApJS, 208, 9
- Pecaut Mamajek (2016) Pecaut M. J., Mamajek E. E. 2016, MNRAS, 461, 794
- Perrin et al. (2014) Perrin, M., Maire, J., Ingraham, P., et al. 2014, SPIE, 9147, 3
- Peters et al. (2012) Peters, M., Groff, T., Kasdin, N. J., et al. 2012, SPIE, 8446, 7
- Pickles (1998) Pickles, A. J. 1998, PASP, 110, 863
- Preibisch et al. (2002) Preibisch, T., Brown, A., Bridges, T., et al., 2002, AJ, 124, 404
- Preibisch Mamajek (2008) Preibisch, T., Mamajek, E. 2008, in Handbook of Star Forming Regions, Volume II, The Nearest OB Association: Scorpius-Centaurus (Sco OB2)
- Quijada et al. (2004) Quijada, M. A., Marx, C. T., Arendt, R. G., et al. 2004, SPIE, 5487, 244
- Rafikov Goldreich (2005) Rafikov, R. R., Goldreich, P. 2005, ApJ, 631, 488
- Rayner et al. (2003) Rayner, J. T., Toomey, D. W., Onaka, P. M., et al. 2003, PASP, 115, 362
- Rayner et al. (2009) Rayner, J.T., Cushing, M.C., Vacca, W.D., et al. 2009, ApJS, 185, 289
- Rodriguez et al. (2013) Rodriguez, D. R., Zuckerman, B., Kastner, J. H., et al. 2013, ApJ, 774, 101
- Serabyn et al. (2017) Serabyn, E., Huby, E., Matthews, K., et al. 2017, ApJ, 153, 43
- Siess et al. (2000) Siess, L., Dufour, E., Forestini, M. 2000, AA, 358, 593
- Soderblom et al. (2014) Soderblom, D. R., Hillenbrand, L. A., Jeffries, R. D., et al. 2014, arXiv:1311.7024
- Somers Pinsonneault (2015) Somers, G., Pinsonneault, M. H. 2015, ApJ, 807, 174
- Somers Stassun (2017) Somers, G., Stassun, K. G. 2017, AJ, 153, 101
- Stamatellos Whitworth (2009) Stamatellos, D., Whitworth, A. P. 2009, MNRAS, 392, 413
- Thalmann et al. (2009) Thalmann, C., Carson, J., Janson, M., et al. 2009, ApJ, 707, 123
- Thalmann et al. (2013) Thalmann, C., Janson, M., Buenzli, E., et al. 2013, ApJ, 763, 29
- Thalmann et al. (2014) Thalmann, C., Desidera, S., Bonavita, M., et al. 2014, A A, 572, 91
- Vigan et al. (2017) Vigan, A., Bonavita, M., Biller, B., et al. 2017, A A, 603, 3
- Webb et al. (1999) Webb, R. A., Zuckerman, B., Platais, I. et al., 1999, ApJ, 512, 63