The infrared-luminous progenitors of high- quasars
Abstract
Here we explore the infrared (IR) properties of the progenitors of high- quasar host galaxies. Adopting the cosmological, data constrained semi-analytic model GAMETE/QSOdust, we simulate several independent merger histories of a luminous quasar at , following black hole growth and baryonic evolution in all its progenitor galaxies. We find that a fraction of progenitor galaxies (about 0.4 objects per single luminous quasar) at has an IR luminosity of (hyper-luminous IR galaxies; HyLIRGs). HyLIRGs progenitors reside in the most massive halos, with dark matter (DM) masses of . These systems can be easily observed in their mm-continuum emission in a few seconds of integration time with the Atacama Large Millimeter/submillimeter Array (ALMA), and at least 40% of them host nuclear BH activity that is potentially observable in the soft and hard X-ray band. Our findings are in line with recent observations of exceptional massive DM halos hosting HyLIRGs at , suggesting that luminous quasars are indeed the signposts of these observed rare peaks in the high- cosmic density field, and that massive IR-luminous galaxies at higher are their natural ancestors.
keywords:
Galaxies: evolution, high-redshift; quasars: general, supermassive black holes; infrared: galaxies; submillimetre: galaxies1 Introduction
Observations of dusty star-forming galaxies (DSFGs) at high-redshift, often selected at (sub-)millimeter wavelengths (submillimeter galaxies, or SMGs; Smail
et al., 1997; Hughes
et al., 1998; Chapman et al., 2005; Hayward
et al., 2013), can provide unique insights into our understanding of the early formation of massive galaxies (see e.g., Blain et al., 2002; Casey
et al., 2014 for reviews).
Because of their large dust content, DSFGs emit most of their luminosity at infrared (IR) wavelengths () and are typically considered ultra-luminous IR galaxies (ULIRGs), reaching IR luminosities () of (Kovács et al., 2006; Coppin
et al., 2008; Hayward et al., 2011).
Spectroscopic surveys targeting the redshift distributions of SMGs indicate that the bulk of the DSFGs population peaks at (e.g., Chapman et al., 2005; Strandet
et al., 2016), encompassing the peaks of supermassive black hole (SMBH) accretion (Cattaneo &
Bernardi, 2003; Hopkins et al., 2007) and cosmic star formation activity (Madau &
Dickinson, 2014).
However, a significant tail of higher redshift DSFGs appears to be already in place at (e.g., Riechers
et al., 2013, 2017; Walter
et al., 2012; Weiß
et al., 2013; Strandet
et al., 2017).
The latter are often found to be extreme hyper-luminous IR galaxies (HyLIRGs), reaching infrared luminosities of and star formation rates (SFRs) exceeding , likely tracing the result of strong dynamical interactions (i.e., major mergers) and intense gas accretion events occurring in the densest regions of the early Universe (e.g., Riechers
et al., 2011, 2017; Ivison et al., 2011; Capak
et al., 2011; Oteo
et al., 2016; Pavesi
et al., 2018).
Recently, Marrone
et al. (2018) reported high-resolution Atacama Large Millimeter/submillimeter Array (ALMA) observations of SPT0311-58, a IR-luminous system at , originally identified in the 2500 deg2 South Pole Telescope (SPT) survey (Carlstrom
et al., 2011).
ALMA reveals this source to be a pair of interacting extremely massive and IR-luminous star-bursting galaxies:
SPT0311-58W, a HyLIRG with and a , and
SPT0311-58E, a ULIRG with and .
Using different proxies, Marrone
et al. (2018) estimated the DM halo mass hosting this system to be , showing that SPT0311-58 marks a rare peak
in the cosmic density field at this early cosmic time and it lies close to the exclusion curve predicted by the current structure formation paradigm.
Many models of SMBH-galaxy co-evolution suggest an evolutionary link between ULIRGs and quasars (quasars; Sanders
et al., 1988a; Sanders et al., 1988b; Silk &
Rees, 1998; Springel
et al., 2005; Di
Matteo et al., 2005; Hopkins et al., 2006, 2008, and Alexander &
Hickox, 2012 for a review).
ULIRGs may represent the initial, heavily obscured, stages of quasars, which, after shedding the surrounding dust through energetic galaxy-scale outflows (e.g., Maiolino
et al., 2012; Harrison
et al., 2012; Fan et al., 2018), evolve into a ultraviolet (UV)/optical bright unobscured phase.
In this work, we explore
the hierarchical merger histories of quasars to investigate their connection with ULIRGs and HyLIRGs.
To this aim, we use GAMETE/QSOdust (hereafter GQd, Valiante et al., 2014, 2016), a semi-analytic model tested to reproduce the observed properties of a sample of high- quasars (Valiante et al., 2014).
GQd consistently follows the formation and evolution of nuclear black holes (BHs) and their host galaxies, accounting for star formation, interstellar medium (ISM) chemical evolution (metals and dust) and mechanical feedback, along different merger histories of the parent DM halo.
Therefore, GQd is a suitable tool to (i) investigate the physical properties of the ancestors at of luminous quasars at ; (ii) statistically quantify the number density of expected ULIRG and HyLIRG progenitors, and (iii) probe whether luminous quasars can be the signposts
of the rare peaks in the cosmic density field observed at (i.e., Marrone
et al., 2018).
The paper is organized as follows.
In Section 2, we briefly describe the GQd model.
Section 3 and 4 show the results of this work and a discussion of their implications.
Throughout the paper, we assume a CDM cosmology with , , , and .
2 Model Description
GQd111The model GAMETE (GAlaxy MErger Tree and Evolution) was originally developed to study the formation and cosmological evolution of local, Milky-Way like galaxies (Salvadori et al., 2007, 2008). is a semi-analytic, data-constrained model aimed at studying the formation and evolution of high-redshift quasars and their host galaxies in a cosmological framework.
In this section we summarize the main features of GAMETE/QSOdust, referring the reader to Valiante et al. (2011, 2014, 2016) for a thorough description of the model.
GQd has been tested to reproduce the observed properties of quasars at , such as the BH mass, the molecular gas and dust masses in the ISM (Valiante et al., 2014).
Following Valiante et al. (2016), in this work we focus on the evolution of a SDSS J1148+5251 (hereafter J1148)-like quasar at , one the best studied high- luminous quasars222Absolute AB magnitude of the continuum in the rest-frame at 1450 Å of (Fan et al., 2003).
(e.g., Willott
et al., 2003; Walter et al., 2004; Maiolino
et al., 2005; Cicone
et al., 2015), and we use it as a prototype for the general class of luminous quasars.
| (a)SFR | (a) | (c) | ||
| [] | [] | [] | [] | [] |
- •
- •
-
•
(c) The black hole mass, , is estimated from the MgII doublet and the Å continuum (De Rosa et al., 2011).
The hierarchical merger history
We first reconstruct different hierarchical merger histories (merger trees) of a DM halo hosting a J1148-like quasar at , using a binary Monte Carlo algorithm accounting for mass infall (e.g., Volonteri et al., 2003), based on the Extended Press-Schechter theory (e.g., Lacey & Cole, 1993). This approach enables us to produce a large (statistically meaningful) number of random, semi-analytical merger trees of the same DM halo, simultaneously resolving the first collapsed objects. The DM resolution mass, , is chosen to resolve the first collapsed objects where the gas is able to cool and form stars, i.e., the so-called mini-haloes, with masses of and virial temperatures of (see Bromm, 2013 for a review). Given this requirement, we simulate the merger trees adopting a of:
| (1) |
where is the host DM halo at redshift .
Mini-haloes dominate the halo mass spectrum at very high-; at the merger tree halo population is dominated instead by Ly-cooling halos, namely DM halos with (see Valiante et al., 2016 for details).
By construction, the entire population of halos along the merger trees, that we call progenitors, contribute to assembling the simulated quasar host galaxies.
However, when specified within the text, we will restrict the analysis to massive progenitors, hosted by DM halos with .
This mass-selection, as discussed in Sec. 3, reflects our interest of studying the most IR-luminous galaxies in the simulation.
BH growth and baryonic evolution
Merger trees are used as an input to reconstruct the formation and evolution of the J1148-like quasar and its host galaxy through cosmic time.
The baryonic evolution inside each progenitor galaxy is regulated by processes of star formation, BH growth and feedback, and followed consistently through the cosmic mass assembly.
BHs growth is driven by:
- mergers: we assume that in major mergers333A major merger occurs when two DM halos with mass ratio (less massive over the most massive) coalesce. the
BHs present in the nuclei of the two interacting galaxies coalesce, forming a new more massive BH.
In minor mergers, the merger time-scale of the two BHs is of the order of the Hubble time or longer (see e.g., Tanaka &
Haiman, 2009). The less massive BH of the merging pair is assumed to remain
as a satellite and we do not follow its evolution.
- gas accretion: the accretion rate is described by a modified444We re-scaled by a factor ,
to account for the higher central densities around accreting BHs (e.g., Di
Matteo et al., 2005). Bondi-Hoyle-Lyttleton (BHL) formula, capped at the Eddington rate (see Valiante et al., 2014 for details).
We find that, while BH growth is mostly driven by mergers at very high- (i.e., ), gas accretion is the dominant growth mode at lower redshifts (Valiante et al., 2016).
At each snapshot of the merger tree, stars in the progenitor galaxies form according to a SFR proportional to the available gas mass, with an efficiency that is enhanced during major mergers (see Valiante et al., 2014).
Following star formation, supernovae (SNe) and asymptotic giant branch stars (AGB) progressively enrich the ISM of each galaxy with metals and dust according to their specific mass and metallicity-dependent yields and to their evolutionary time-scales.
We follow the life-cycle of metals and dust including physical prescriptions for dust processing in a two-phase ISM: SN shocks can destroy dust grains in the hot, diffuse medium while dust grains can grow in mass by accreting gas-phase heavy elements in the cold medium (see Valiante et al., 2014 and de Bennassuti et al., 2014, for details).
A fraction of the energy released by SN explosions (0.2%) and BH accretion (0.25%) is converted into kinetic energy of the gas in the host galaxy, driving gas outflows in the form of winds.
While these efficiencies are lower than what generally adopted in hydrodynamical simulations555In one of the most popular descriptions of AGN-driven winds in hydrodynamical simulations, of the
radiation energy is thermally coupled to the surrounding gas (Di
Matteo et al., 2005). This difference may be due to the complex interaction of the outflow with the inhomogeneous ISM and the effects of radiative
losses that can not be captured by our simple semi-analytical model.
the predicted strength of mechanical feedback is in good agreement with observations of the outflowing gas in J1148 (Maiolino
et al., 2005, 2012; Valiante et al., 2012; Cicone
et al., 2015; see also Bischetti et al., 2018, who carry out a stacking analysis of a sample of 48 quasars at detected by ALMA in the [CII] 158 m line, and find an outflow kinetic power that is of the AGN luminosity).
3 THE IR PROPERTIES OF MASSIVE PROGENITORS OF HIGH-Z quasar HOST GALAXIES
We calculate the IR luminosity of each galaxy by assuming that in the Rayleigh-Jeans part of the spectrum (in the limit of small frequencies, that is ), dust radiates as a ‘grey-body’ with an opacity coefficient per unit dust mass, , where , , depend on the adopted model of dust. Integrating over the IR wavelength range ( GHz), we compute the corresponding as,
| (2) |
where is the Planck function for a dust temperature . We estimate , averaging over 7 different models of dust composition666Following Valiante et al. (2011) we use models of dust composition from Bertoldi et al. (2003), Robson et al. (2004), Beelen et al. (2006), Weingartner & Draine (2001), Bianchi & Schneider (2007). In addition, we also consider the more recent ‘AC’-model by Galliano et al. (2011) and ‘THEMIS’ by Jones et al. (2017) (see the review by Galliano et al., 2017 for a discussion). (each of them providing a unique combination of the parameters ; see Table 2) and we vary the dust temperature777Warm interstellar dust, associated to starburst regions, dominates the emission in the rest-frame far-IR (Dunne et al., 2000; Wang et al., 2008; Valiante et al., 2016). in the range .
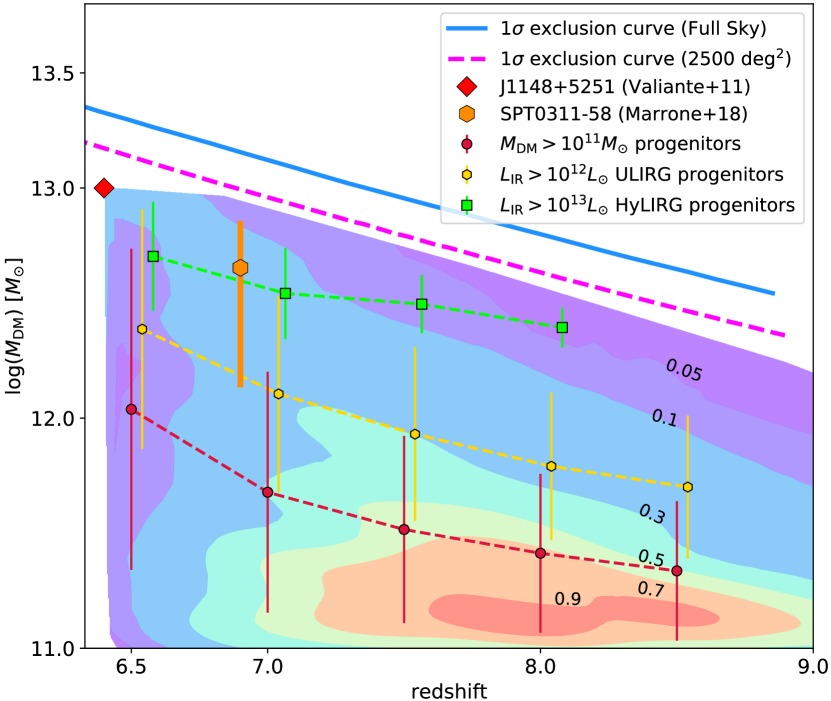
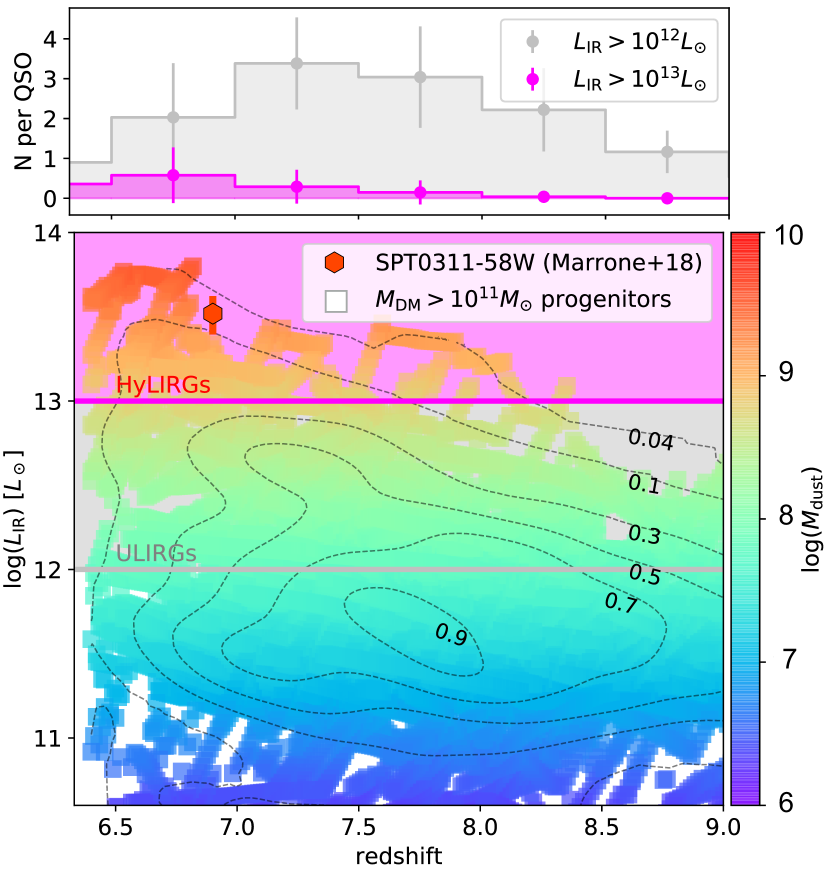
Fig. 1 and Fig. 2 show respectively (i) the redshift distribution of simulated DM halo masses and (ii) the IR luminosities of massive progenitors () of J1148-like quasar host galaxies at , in all the simulated merger trees.
Fig. 1 shows that, although the bulk of the mass distribution of massive progenitors is concentrated in the mass range
(especially at ; see percentile levels in the density plot),
IR-luminous galaxies with occupy DM halos with , at least in the redshift interval .
In particular, we find that galaxies with HyLIRGs-like luminosity (, consistent with the IR luminosity measured in SPT0311-58W; Marrone
et al., 2018)
reside in the most massive halos, with masses of about , consistent with the dynamical mass inferred for the interacting system SPT0311-58 (see orange hexagon in Fig. 1).
These findings indicate that exceptionally massive DM halos hosting HyLIRGs, as the halo hosting SPT0311-58 at , can be found within the family tree of UV/optical bright quasars at .
In the next paragraphs we explore the expected physical properties of the IR-luminous progenitors of high- luminous quasar host galaxies, as well as their frequency (i.e., the expected number per quasar) and their observability in the mm and X-ray bands.
3.1 How many IR-luminous progenitor galaxies do we expect for each luminous quasar?
In the top panel of Fig. 2 we show the predicted number of IR-luminous progenitor galaxies in the redshift interval expected for each luminous J1148-like quasar at . Each high- luminous quasar has, on average, about 2.8 ULIRG progenitors with , and about 0.4 HyLIRG progenitors with , between . Recently, Jiang et al. (2016) using a complete sample of 52 quasars at selected from the Sloan Digital Sky Survey (SDSS), spanning a wide luminosity range of , found that the number density of bright quasars with at is 888This value is consistent with the estimates provided by previous works, e.g., Fan et al. (2004) and Willott et al. (2010).. Combining this information with our estimate of the number of expected IR-luminous progenitor galaxies per quasar, we predict the spatial number density of HyLIRG (ULIRG) progenitors to be about () in the redshift range . Since these values refer to the population of ULIRGs/HyLIRGs found within the merger trees of UV/optical bright quasars at , they provide lower limits on the effective number density of the overall population of IR-luminous galaxies at . Potential deviations might be also driven by the effect of the duty cycle on the number counting of high- quasars, resulting in a systematic under-estimation of their number densities in large single-epoch imaging surveys (see e.g., Romano-Diaz et al., 2011). An alternative way to estimate the number density of the overall population of IR-luminous galaxies at comes from our finding that, at , the most massive DM halos () in the merger trees of simulated quasars are most likely to host HyLIRGs (see Fig. 1). Assuming that this finding can be extended to all DM halos in the same mass regime (i.e., also halos that are not expected to evolve in a quasar at ), then the number density of the HyLIRGs population should be consistent with the number density of DM halos with predicted by the CDM cosmology999The CDM-predicted number density of DM halos was obtained using HMFcalc, publicly available at http://hmf.icrar.org/ (see Murray et al., 2013). at , i.e., about .
Fig. 2 also shows that HyLIRGs are characterized by dust masses already at , while ULIRGs have dust masses in the range .
Despite their large stellar masses, of the dust mass has formed in the ISM of these galaxies through processes involving some form of grain growth101010We note that the efficiency and even the physical nature of grain growth is still an active subject of study (e.g., Zhukovska et al., 2016; Ceccarelli et al., 2018; Ginolfi
et al., 2018).
(see Valiante et al., 2011, where the maximum dust masses obtained from stellar sources, e.g., SNe and AGB stars, is calculated as a function of , under the conservative assumption that dust grains are not destroyed by interstellar shocks).
3.2 The physical properties of high- HyLIRGs
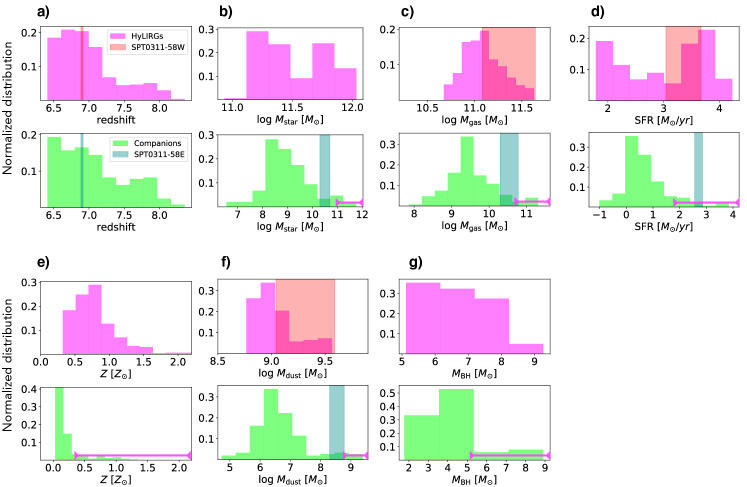
In Fig. 3 we show the redshift, stellar mass (), gas mass (), SFR, dust mass (), metallicity () and BH mass () distributions of HyLIRG progenitors (magenta histograms) of high- quasars. We find that HyLIRG progenitors are generally highly massive (i.e., ; Fig. 3.b), gas rich (i.e., ; Fig. 3.c) systems. They experience strong starbursts, with (see Fig. 3.d), enabling them to reach super-solar metallicities (see Fig. 3.e) and large dust masses (i.e., ; Fig. 3.f) already at . The same properties are also shown for galaxies experiencing mergers with HyLIRG companions along the merger trees (light green histograms). Those galaxies are found to have different properties than HyLIRGs (note the different x-axis range between magenta and green histograms in Fig. 3). In particular, we find that the bulk of the population of interacting companions is generally less massive (the distribution peaks at ), less star-forming (the SFR distribution peaks at ) and less chemically evolved (i.e., sub-solar metallicities and ). However, we find that the tails of the distributions of interacting companions extend toward the HyLIRG regime, as shown by the intersections between the light green histograms and the magenta lines in Fig. 3. The existence of this channel of interaction is crucial from the point of view of evolutionary models of SMBH-galaxy co-evolution: in fact, gas-rich major mergers are thought to be an efficient mechanism to deliver cold gas at the centre of the resulting halo and therefore fuel the growth of the SMBH and trigger AGN activity (Di Matteo et al., 2005; Hopkins et al., 2008; Pezzulli et al., 2016).
3.3 The observability of high- HyLIRGs with ALMA
By assuming an optically thin, , rest-frame far-IR emission, the intrinsic flux observed in a given band can be estimated as,
| (3) |
where is the luminosity distance of a source at given redshift.
However, it is well known that at high redshift the cosmic microwave background (CMB) is hotter and brighter.
Its temperature, , at approaches the temperature of the cold dust, decreasing the contrast of the intrinsic rest-frame IR emission against the CMB.
To account for this effect, we adopted the results by da Cunha
et al. (2013), who provided general correction factors to estimate what fraction of the dust emission can be detected against the CMB as a function of frequency, redshift and temperature,
| (4) |
It follows from Eq. 4 that the flux-CMB contrast increases at higher (see also the discussion in da Cunha
et al. 2013).
This is the case for our simulated HyLIRGs, where the interstellar dust in the warm phases of the ISM is heated by the vigorous starburst activity, reaching the high temperature values adopted in this paper (, see also Dunne et al., 2000; Wang
et al., 2008; Valiante et al., 2016).
Indeed we find that a large fraction, namely , of the intrinsic rest-frame IR emission can be detected against the CMB.
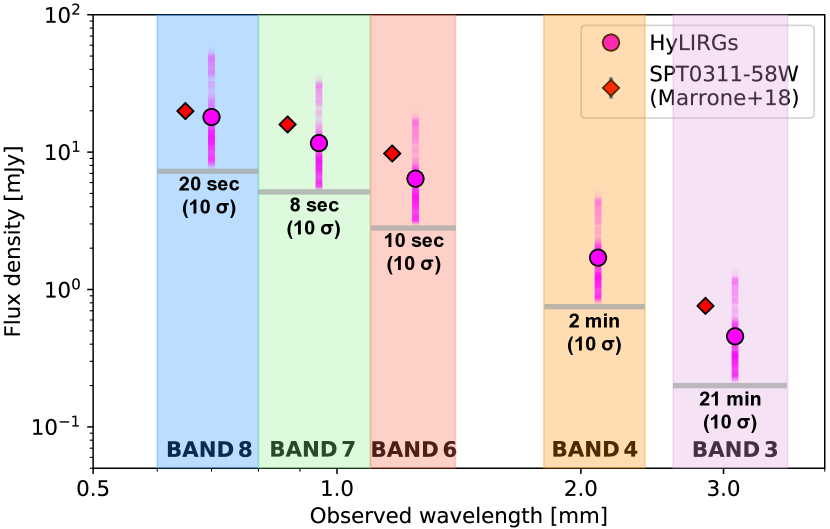
Fig. 4 shows the distribution (both averaged values and dispersions) of the rest-frame IR fluxes (CMB-corrected) for HyLIRG progenitors at .
Fluxes are calculated in the ALMA Bands [8, 7, 6, 4, 3], respectively centered at observed-frame wavelengths [0.7, 0.95, 1.25, 2, 3] mm, and range from a minimum value of at 3 mm (Band 3), to a maximum value of at 0.7 mm (Band 8).
We calculated the on-source integration times111111The on-source integration times were obtained using the ALMA Cycle 6 sensitivity calculator.
needed to detect the estimated continuum fluxes with a signal-to-noise of .
We find that HyLIRGs progenitors of high- quasar host galaxies can be easily detected with ALMA with a modest amount of observing time, ranging from few second in Bands 6-7-8, to minutes in Band 3 (see Fig. 4).
We note that, although for such short integrations most of the time is dedicated to the instrumental setup and calibrations, the total integration time (including overheads) needed to reach the required sensitivity is less than 30 min in all the Bands.
3.4 The X-ray observability of BH activity in high- HyLIRGs
As shown in Fig. 3.g, we find that the HyLIRG progenitors of luminous high- quasars, host nuclear BHs with an almost uniform distribution of masses in the range , and a high-mass tail at (populated by systems in the last steps of the merger trees).
Such a broad range of nuclear BH masses results from the diversity of merging and accretion histories predicted
by the model.
To assess the possibility of detecting BH activity in the nuclei of high- HyLIRGs, we compared the predicted
X-ray luminosity in the (observed-frame) soft ([0.5 - 2] keV) and hard ([2 - 10] keV) X-ray bands
with the flux limits of recent surveys.
Following Pezzulli
et al. (2017), we modeled the X-ray luminosity
of accreting BHs considering the primary emission from the hot corona and
the reflection component due to the surrounding neutral medium. The first one is
parametrized as a power law,
, with an exponential cut-off energy
of (Sazonov
et al., 2004; Yue et al., 2013) and photon spectral index
, that we assume to depend on the Eddington ratio
(Brightman
et al., 2013). The metallicity
dependent reflection component is computed using the PEXRAV model (Magdziarz &
Zdziarski, 1995)
in the XSPEC code121212The reflection component is computed assuming an isotropic source located above the disc,
fixing the reflection solid angle to , the inclination angle to and the reflection strength parameter
to , consistent with typical values of local AGNs (Zappacosta
et al., 2018).. The metallicity and Eddington
ratio are computed using the values
predicted by GQd for each accreting BH.
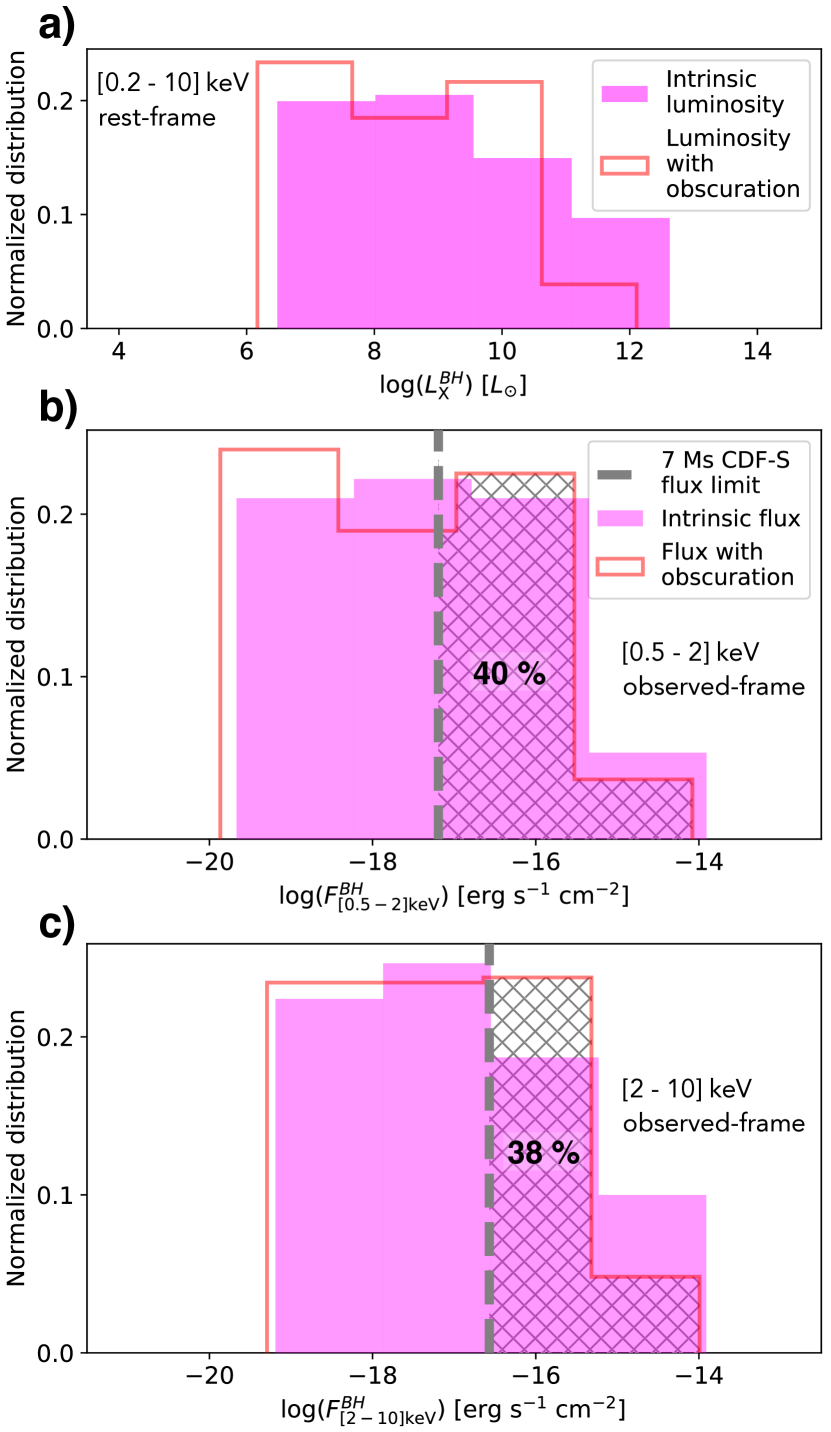
We find that the BH activity in HyLIRGs generates an intrinsic emission corresponding to X-ray luminosities (integrated over the rest-frame [0.5-10] keV band) of [] (see Fig. 5.a),
and to intrinsic fluxes [] in the observed-frame soft/hard bands (see flux distributions in Fig. 5.b and Fig. 5.c).
The intrinsic X-rays flux is attenuated by the interaction of the radiation produced during the BH accretion with the gas and dust in the immediate surroundings of the BH (mainly photoelectric absorption and Compton scattering of photons against free electrons).
For this reason the effect of obscuration has to be taken into account, and the obscured emerging flux can be written as ; at energies keV, assuming a fully-ionized H-He mixture, the optical depth is (Yaqoob, 1997):
| (5) |
where is the hydrogen column density, while and are the Thomson and photoelectric cross section, respectively (see Pezzulli et al., 2017 for a description of and its dependence on energy and metallicity). We computed assuming the gas to be distributed following a singular isothermal sphere (SIS) profile (see Valiante et al. 2016),
| (6) |
where the normalization factor is a function of , the virial radius () and the core radius ().
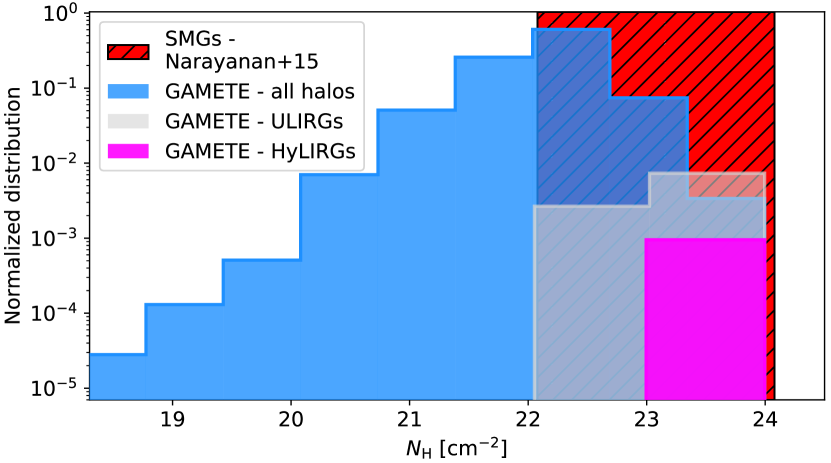
By assuming pc, we find that our simulated ULIRGs have , in the same range predicted by cosmological hydrodynamical simulations for high- SMGs (e.g., Narayanan
et al., 2015; see Fig. 6).
Adopting the same , we find that HyLIRG progenitors have .
As shown in Fig. 5.b and Fig. 5.c, the resulting net attenuation of fluxes by obscuration in the observed-frame soft X-ray band is about a factor of 2, while fluxes in the observed-frame hard X-ray band are almost unaffected by attenuation.
This can be explained in terms of the photoelectric cross section decreasing for increasing energy (see a thorough discussion in Pezzulli
et al., 2017).
Finally, we compared the predicted, obscuration-attenuated with the flux limits obtained by Chandra observations of the recent 7 Ms Chandra Deep Field South Survey (7 Ms CDF-S; Luo et al., 2017), i.e., in the soft band and in the hard band.
We find that in both bands a significant fraction of our simulated HyLIRGs population has a potentially detectable (40% and 38%, respectively; see hatched regions of the red histograms in Fig. 5.b and Fig. 5.c).
To test if can be considered as a tracer of nuclear activity in high- HyLIRGs, we estimated the contribution of SFR-related (e.g., X-ray binary populations; XRBs) processes to the X-ray luminosity, , by using the redshift-dependent scaling relation between the rest-frame hard and SFR, found by Lehmer
et al. (2016):
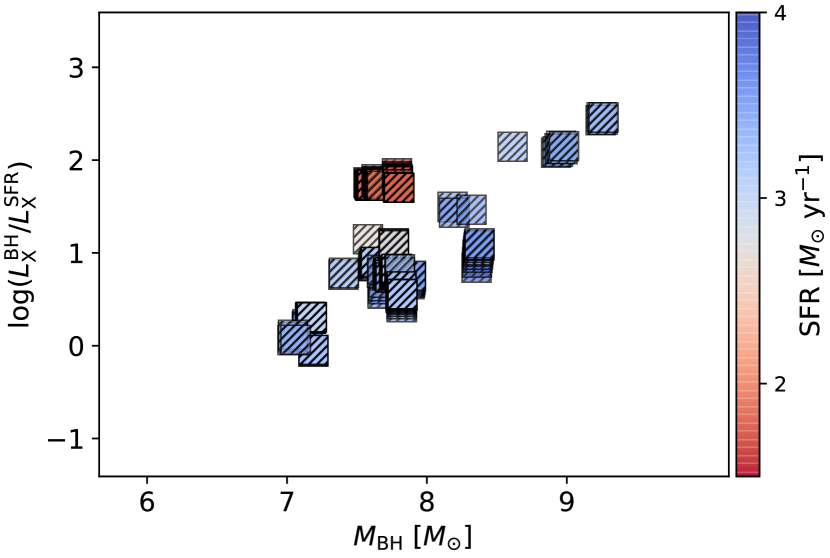
In Fig. 7, we show the relative contribution between the X-ray luminosity produced by the accreting SMBHs (once the attenuation by obscuration has been considered) and by XRBs, in the rest-frame hard band, as a function of the BH mass (and colour coded with the SFR), for the HyLIRGs progenitors with a detectable observed-frame soft131313The observed-frame [0.5-2] keV band traces hard X-ray emission at the redshifts of interest. (i.e., namely the objects located in the hatched region of the histograms in Fig. 5.b).
We find that HyLIRGs hosting black holes with have X-ray emission dominated by their SMBH activity.
In particular, we find that, for about 40 % of the these galaxies, the X-ray luminosity due to the nuclear activity is at least one order of magnitude larger than that
associated to star formation. Since we are conservatively assuming that the X-ray emission produced by stars is completely unobscured, if were
corrected for attenuation141414GQd model cannot provide information on the spatial distribution of stars, therefore a self-consistent treatment of
obscuration of the stellar X-ray emission is very difficult (see Valiante et al. 2016), without coupling detailed hydrodynamical models with radiative transfer simulations accounting for X-ray physics (Smidt
et al., 2017; Graziani
et al., 2018).
On the other hand a statistical approach is currently impossible due to computational limits., the relative contribution of SMBH activity to the total X-ray emission
would be even higher.
In conclusions, we find that (i) a significant fraction of HyLIRG progenitors has detectable (obscuration-attenuated) X-ray fluxes produced by accreting BHs in both the observed-frame soft (40 %) and hard (38 %) bands; (ii) for those objects, the overall is dominated by , making the observed X-ray emission an optimal tracer of SMBH activity.
Combining these findings with the predicted spatial density of HyLIRGs (see Sec. 3.1), we estimate the spatial density of HyLIRGs with detectable
X-ray emission tracing SMBH activity to be .
4 Conclusions
In the last decade, observations of DSFGs have extended toward .
High- DSFGs are often found to be HyLIRGs () with SFRs exceeding , likely tracing the result of strong dynamical interactions and intense gas accretion events occurring in the densest regions of the early Universe
(Walter
et al., 2012; Riechers
et al., 2017; Pavesi
et al., 2018).
Recently, Marrone
et al. (2018) found a IR-luminous system, SPT0311-58, at , composed by a pair of extremely massive and IR-luminous interacting galaxies.
Using different proxies to estimate the halo mass hosting the system, they show that SPS0311-58 marks an exceptional peak in the cosmic density field at this early cosmic time and it lies close to the exclusion curve predicted by the current structure formation paradigm.
In this work we use GQd model to simulate several independent merger histories of a typical luminous quasar at , following the black hole growth and the baryonic evolution (including star formation, metals and dust life-cycles, and mechanical feedback) of its ancestors up to .
We find that:
-
-
a fraction of progenitor galaxies (about 0.4 objects per single luminous quasar, between ) has HyLIRGs-like IR luminosity of (see Fig. 2) and similar characteristics to the system observed by Marrone et al. (2018) (e.g., generally highly massive, extremely star-bursting and chemically evolved; see Fig. 3);
-
-
the IR-luminous progenitors of quasar host galaxies, reside in the most massive DM halos, with masses of (see Fig. 1). Their far-IR continuum fluxes can be easily observed with ALMA with a modest amount of time, ranging from few seconds in Bands [8,7,6] (centered at observed-frame [0.7, 0.95, 1.25] mm, respectively) to about 2 minutes in Band 4 (2 mm) and 20 minutes in Band 3 (3 mm).
-
-
the HyLIRGs progenitors of high- quasar host galaxies, have nuclear black holes with masses . The X-ray fluxes associated to the nuclear BH activity could be detectable in the observed-frame soft and hard X-ray bands (they lie above the sensitivity limit of the 7 Ms Chandra Deep Field South Survey) for of these galaxies, even accounting for obscuration, and dominate over the X-ray emission associated to star formation.
Altogether our results suggest that luminous quasars are indeed the signposts of the observed rare high- overdensities, and that massive-IR luminous galaxies at higher are their natural ancestors. These findings corroborate models of SMBH-galaxy co-evolution predicting an evolutionary link between IR-luminous galaxies and quasars.
Acknowledgements
The authors would like to thank D. Marrone for helpful discussions. The research leading to these results has received funding from the European Research Council under the European Union’s Seventh Framework Programme (FP/2007- 2013)/ERC Grant Agreement n. 306476. We have benefited from the public available programming language Python, including the numpy, matplotlib and scipy packages. This research made extensive use of ASTROPY, a community-developed core Python package for Astronomy (Astropy Collaboration et al., 2013), and glueviz, a Python library for multidimensional data exploration (Beaumont et al., 2015).
References
- Alexander & Hickox (2012) Alexander D. M., Hickox R. C., 2012, New Astronomy Reviews, 56, 93
- Astropy Collaboration et al. (2013) Astropy Collaboration et al., 2013, A&A, 558
- Beaumont et al. (2015) Beaumont C., Goodman A., Greenfield P., 2015, in Taylor A. R., Rosolowsky E., eds, Astronomical Society of the Pacific Conference Series Vol. 495, Astronomical Data Analysis Software an Systems XXIV (ADASS XXIV). p. 101
- Beelen et al. (2006) Beelen A., Cox P., Benford D. J., Dowell C. D., Kovács A., Bertoldi F., Omont A., Carilli C. L., 2006, ApJ, 642, 694
- Bertoldi et al. (2003) Bertoldi F., Carilli C. L., Cox P., Fan X., Strauss M. A., Beelen A., Omont A., Zylka R., 2003, A&A, 406, L55
- Bianchi & Schneider (2007) Bianchi S., Schneider R., 2007, MNRAS, 378, 973
- Bischetti et al. (2018) Bischetti M., Maiolino R., Fiore S. C. F., Piconcelli E., Fluetsch A., 2018, preprint, p. arXiv:1806.00786 (arXiv:1806.00786)
- Blain et al. (2002) Blain A. W., Smail I., Ivison R. J., Kneib J. P., Frayer D. T., 2002, Phys. Rep., 369, 111
- Brightman et al. (2013) Brightman M., et al., 2013, MNRAS, 433, 2485
- Bromm (2013) Bromm V., 2013, Reports on Progress in Physics, 76
- Capak et al. (2011) Capak P. L., et al., 2011, Nature, 470, 233
- Carlstrom et al. (2011) Carlstrom J. E., et al., 2011, Publications of the Astronomical Society of the Pacific, 123, 568
- Casey et al. (2014) Casey C. M., Narayanan D., Cooray A., 2014, Phys. Rep., 541, 45
- Cattaneo & Bernardi (2003) Cattaneo A., Bernardi M., 2003, MNRAS, 344, 45
- Ceccarelli et al. (2018) Ceccarelli C., Viti S., Balucani N., Taquet V., 2018, MNRAS, 476, 1371
- Chapman et al. (2005) Chapman S. C., Blain A. W., Smail I., Ivison R. J., 2005, ApJ, 622, 772
- Cicone et al. (2015) Cicone C., et al., 2015, A&A, 574
- Coppin et al. (2008) Coppin K. E. K., et al., 2008, MNRAS, 389, 45
- De Rosa et al. (2011) De Rosa G., Decarli R., Walter F., Fan X., Jiang L., Kurk J., Pasquali A., Rix H. W., 2011, ApJ, 739, 56
- Di Matteo et al. (2005) Di Matteo T., Springel V., Hernquist L., 2005, Nature, 433, 604
- Dunne et al. (2000) Dunne L., Eales S., Edmunds M., Ivison R., Alexander P., Clements D. L., 2000, MNRAS, 315, 115
- Fan et al. (2003) Fan X., et al., 2003, AJ, 125, 1649
- Fan et al. (2004) Fan X., et al., 2004, AJ, 128, 515
- Fan et al. (2018) Fan L., Knudsen K. K., Fogasy J., Drouart G., 2018, ApJ, 856
- Galliano et al. (2011) Galliano F., et al., 2011, A&A, 536, A88
- Galliano et al. (2017) Galliano F., Galametz M., Jones A. P., 2017, preprint, p. arXiv:1711.07434 (arXiv:1711.07434)
- Ginolfi et al. (2018) Ginolfi M., Graziani L., Schneider R., Marassi S., Valiante R., Dell’Agli F., Ventura P., Hunt L. K., 2018, MNRAS, 473, 4538
- Graziani et al. (2018) Graziani L., Ciardi B., Glatzle M., 2018, MNRAS, 479, 4320
- Harrison & Hotchkiss (2013) Harrison I., Hotchkiss S., 2013, Journal of Cosmology and Astro-Particle Physics, 2013, 022
- Harrison et al. (2012) Harrison C. M., et al., 2012, MNRAS, 426, 1073
- Hayward et al. (2011) Hayward C. C., Kereš D., Jonsson P., Narayanan D., Cox T. J., Hernquist L., 2011, ApJ, 743
- Hayward et al. (2013) Hayward C. C., Narayanan D., Kereš D., Jonsson P., Hopkins P. F., Cox T. J., Hernquist L., 2013, MNRAS, 428, 2529
- Hopkins et al. (2006) Hopkins P. F., Hernquist L., Cox T. J., Di Matteo T., Robertson B., Springel V., 2006, The Astrophysical Journal Supplement Series, 163, 1
- Hopkins et al. (2007) Hopkins P. F., Richards G. T., Hernquist L., 2007, ApJ, 654, 731
- Hopkins et al. (2008) Hopkins P. F., Hernquist L., Cox T. J., Kereš D., 2008, The Astrophysical Journal Supplement Series, 175
- Hughes et al. (1998) Hughes D. H., et al., 1998, Nature, 394, 241
- Ivison et al. (2011) Ivison R. J., Papadopoulos P. P., Smail I., Greve T. R., Thomson A. P., Xilouris E. M., Chapman S. C., 2011, MNRAS, 412, 1913
- Jiang et al. (2016) Jiang L., et al., 2016, ApJ, 833, 222
- Jones et al. (2017) Jones A. P., Köhler M., Ysard N., Bocchio M., Verstraete L., 2017, A&A, 602, A46
- Kovács et al. (2006) Kovács A., Chapman S. C., Dowell C. D., Blain A. W., Ivison R. J., Smail I., Phillips T. G., 2006, ApJ, 650, 592
- Lacey & Cole (1993) Lacey C., Cole S., 1993, MNRAS, 262, 627
- Lehmer et al. (2016) Lehmer B. D., et al., 2016, ApJ, 825, 7
- Luo et al. (2017) Luo B., et al., 2017, ApJS, 228, 2
- Madau & Dickinson (2014) Madau P., Dickinson M., 2014, Annual Review of Astronomy and Astrophysics, 52, 415
- Magdziarz & Zdziarski (1995) Magdziarz P., Zdziarski A. A., 1995, MNRAS, 273, 837
- Maiolino et al. (2005) Maiolino R., et al., 2005, A&A, 440, L51
- Maiolino et al. (2012) Maiolino R., et al., 2012, MNRAS, 425, L66
- Marrone et al. (2018) Marrone D. P., et al., 2018, Nature, 553, 51
- Murray et al. (2013) Murray S. G., Power C., Robotham A. S. G., 2013, Astronomy and Computing, 3, 23
- Narayanan et al. (2015) Narayanan D., et al., 2015, Nature, 525, 496
- Oteo et al. (2016) Oteo I., et al., 2016, ApJ, 827
- Pavesi et al. (2018) Pavesi R., et al., 2018, preprint, (arXiv:1803.08048)
- Pezzulli et al. (2016) Pezzulli E., Valiante R., Schneider R., 2016, MNRAS, 458, 3047
- Pezzulli et al. (2017) Pezzulli E., Valiante R., Orofino M. C., Schneider R., Gallerani S., Sbarrato T., 2017, MNRAS, 466, 2131
- Richards et al. (2006) Richards G. T., et al., 2006, The Astrophysical Journal Supplement Series, 166, 470
- Riechers et al. (2011) Riechers D. A., et al., 2011, ApJ, 733
- Riechers et al. (2013) Riechers D. A., et al., 2013, Nature, 496, 329
- Riechers et al. (2017) Riechers D. A., et al., 2017, ApJ, 850
- Robson et al. (2004) Robson I., Priddey R. S., Isaak K. G., McMahon R. G., 2004, MNRAS, 351, L29
- Romano-Diaz et al. (2011) Romano-Diaz E., Shlosman I., Trenti M., Hoffman Y., 2011, ApJ, 736, 66
- Salvadori et al. (2007) Salvadori S., Schneider R., Ferrara A., 2007, MNRAS, 381, 647
- Salvadori et al. (2008) Salvadori S., Ferrara A., Schneider R., 2008, MNRAS, 386, 348
- Sanders et al. (1988a) Sanders D. B., Soifer B. T., Elias J. H., Madore B. F., Matthews K., Neugebauer G., Scoville N. Z., 1988a, ApJ, 325, 74
- Sanders et al. (1988b) Sanders D. B., Soifer B. T., Elias J. H., Neugebauer G., Matthews K., 1988b, ApJ, 328, L35
- Sazonov et al. (2004) Sazonov S. Y., Ostriker J. P., Sunyaev R. A., 2004, MNRAS, 347, 144
- Silk & Rees (1998) Silk J., Rees M. J., 1998, A&A, 331, L1
- Smail et al. (1997) Smail I., Ivison R. J., Blain A. W., 1997, ApJ, 490, L5
- Smidt et al. (2017) Smidt J., Whalen D. J., Johnson J. L., Li H., 2017, preprint, p. arXiv:1703.00449 (arXiv:1703.00449)
- Springel et al. (2005) Springel V., et al., 2005, Nature, 435, 629
- Strandet et al. (2016) Strandet M. L., et al., 2016, ApJ, 822
- Strandet et al. (2017) Strandet M. L., et al., 2017, ApJ, 842
- Tanaka & Haiman (2009) Tanaka T., Haiman Z., 2009, ApJ, 696, 1798
- Valiante et al. (2011) Valiante R., Schneider R., Salvadori S., Bianchi S., 2011, MNRAS, 416, 1916
- Valiante et al. (2012) Valiante R., Schneider R., Maiolino R., Salvadori S., Bianchi S., 2012, MNRAS, 427, L60
- Valiante et al. (2014) Valiante R., Schneider R., Salvadori S., Gallerani S., 2014, MNRAS, 444, 2442
- Valiante et al. (2016) Valiante R., Schneider R., Volonteri M., Omukai K., 2016, MNRAS, 457, 3356
- Volonteri et al. (2003) Volonteri M., Haardt F., Madau P., 2003, ApJ, 582, 559
- Walter et al. (2004) Walter F., Carilli C., Bertoldi F., Menten K., Cox P., Lo K. Y., Fan X., Strauss M. A., 2004, ApJ, 615, L17
- Walter et al. (2012) Walter F., et al., 2012, Nature, 486, 233
- Wang et al. (2008) Wang R., et al., 2008, ApJ, 687, 848
- Weingartner & Draine (2001) Weingartner J. C., Draine B. T., 2001, ApJ, 548, 296
- Weiß et al. (2013) Weiß A., et al., 2013, ApJ, 767
- Willott et al. (2003) Willott C. J., McLure R. J., Jarvis M. J., 2003, ApJ, 587, L15
- Willott et al. (2010) Willott C. J., et al., 2010, AJ, 139, 906
- Yaqoob (1997) Yaqoob T., 1997, ApJ, 479, 184
- Yue et al. (2013) Yue B., Ferrara A., Salvaterra R., Xu Y., Chen X., 2013, MNRAS, 433, 1556
- Zappacosta et al. (2018) Zappacosta L., et al., 2018, ApJ, 854, 33
- Zhukovska et al. (2016) Zhukovska S., Dobbs C., Jenkins E. B., Klessen R. S., 2016, ApJ, 831, 147
- da Cunha et al. (2013) da Cunha E., et al., 2013, ApJ, 766, 13
- de Bennassuti et al. (2014) de Bennassuti M., Schneider R., Valiante R., Salvadori S., 2014, MNRAS, 445, 3039