A Survey of Collection Methods and Cross-Data Set Comparison of Android Unlock Patterns
Abstract
Android’s graphical password unlock remains one of the most widely used schemes for phone unlock authentication, and it is has been studied extensively in the last decade since its launch. We have learned that users’ choice of patterns mimics the poor password choices in other systems, such as PIN or text-based passwords. A wide variety of analysis and data collections methods was used to reach these conclusions, but what is missing from the literature is a systemized comparison of the related work in this space that compares both the methodology and the results. In this paper, we take a detailed accounting of the different methods applied to data collection and analysis for Android unlock patterns. We do so in two dimensions. First we systemize prior work into a detailed taxonomy of collection methods, and in the second dimension, we perform a detailed analysis of 9 different data sets collected using different methods. While this study focuses singularly on the collection methods and comparisons of the Android pattern unlock scheme, we believe that many of the findings generalize to other graphical password schemes, unlock authentication technology, and other knowledge-based authentication schemes.
1 Introduction
Studies examining password systems are an important part of computer and usable security. The challenge with password systems, generally, is that humans choose passwords as opposed to using randomly generated or mnemonic passwords/pass-phrases [24, 31, 29, 28]. With the advent of mobile computing on smartphones and tablets, unlock authentication choices used to locking and unlocking mobile device plays a significant role in information security.
The two prominent platforms, Apple’s iPhone running iOS and Android OS devices, dominate the market and both provide ingrained mechanisms for protecting the unlock procedure. While biometrics, e.g., fingerprint- or face-identification, are secondary/continuous authentication options, passcode/knowledge-based authentication is still the primary means for securing a mobile device.
The most common knowledge-based passcode authentication is PINs, where the iPhone requires users to create and enter a passcode consisting of (at-least) a 4-digit PIN (later updates may require a 6-digit PIN). Android, from the time of its initial launch, offers a wider variety of unlock authentication techniques, including PIN, text-based passwords, face identification, and, most relevant to this paper, the graphical password pattern.
Since its launch, the Android unlock pattern has been widely studied in many contexts. Foremost, studies of choice of unlock authentication type [15, 19, 40, 17, 18, 43] has shown Android patterns remains relatively popular as an authentication choice. Patterns has also been studied with respect to side channels, such as smudge attacks [7], sensor attacks [9], video attacks [48], shoulder surfing [30, 42, 14, 5] or eye tracing [12]. Other studies have examined the impact of guessing attacks [37, 4].
Most relevant to this paper, there have also been a number of studies [33, 34, 20, 37, 26, 4, 3, 44] analyzing user choice of Android graphical password patterns, variations therein [4, 37, 36, 13] (such as adding or removing contact points), methods to affect choice [33, 34, 2] (such as password meters), and demographic factors in selection [8, 26]. What is missing from the literature is a systemized comparison of the related work in this space that compares both the methodology and the results.
In this paper, we perform such analysis by first performing an extensive classification and categorization across the prior studies in a taxonomy of collection methods and analysis techniques used. Second, we were able to obtain 9 distinct datasets from 4 prior publications [37, 4, 26, 44] and perform an extensive comparison of both the visual features of the patterns and the relative security. From this analysis and our classifications we make the following contributions:
-
•
Collection methods can minimally affect spatial features, such as the length of the patterns, but for other visual properties, e.g., crosses, start, and end, there does not appear to be correlations with collection method.
-
•
Collection methods can affect the comparative guessing strength. We find that there exists three regimes, a high, medium and low strength regime; we conjecture that the medium strength regime likely is the most realistic as it contains the highest clustering, including a data set with self reported patterns.
-
•
Patterns in the high and low strength regimes are related to adversarial collection methods, whereby participants both select patterns they do not want others to guess and generate patterns to guess others. The so-called “defensive” patterns are significantly harder to guess compared to the medium strength regime, and the “offensive” patterns are significantly easier to guess.
-
•
Collection whereby participants are encouraged to generate patterns that match a scenario, e.g., are asked to generate a pattern to secure a bank account, can provide both medium and low strength datasets, dependent on the strength of the motivator in the scenario.
-
•
While pattern collection on devices is likely preferred, we do not see significant differences between data sets collected using a device or pen-and-paper.

2 Related Work and Background
Mobile Authentication Unlock Choices
There are three basic choices for knowledge-based unlock authentication on mobile devices, depending on platform and model.
-
•
PIN based authentication, sometimes referred to as passcodes on iPhones: where a user is asked to recall a PIN of a length at least four digits (newer iPhones, however, will require a 6-digit passcode [16]).
-
•
Pattern based authentication: where a user is asked to recall a gesture that interconnects a set of 3x3 contact points. On the Android OS, four or more points should be selected. The user cannot jump over points not visited before. We will focus almost exclusively on this authentication method in this survey.
-
•
Password based authentication, sometimes called an alpha-numeric passcode: where a user is asked to recall a standard text-based password (entered using a soft-keyboard) to unlock the device.
On more recent mobile devices, users also have the option to select a biometric, such as a fingerprint or face recognition, but as users are also required to select a PIN or pattern in this setting, we consider the choices above the primary choices. Moreover, an attacker attacking an authentication scheme will likely focus on knowledge based attacks—something that can be guessed or enumerated—which make user choice of authentication secrets still quite relevant.
Mobile Device Locking Practices
There have been a number of studies of mobile device unlocking behavior [15, 19, 40, 17, 18, 18, 40] dating back from 2013 through 2016. From these studies we know that users perceive patterns as more secure and less error-prone (as opposed to PINs) in entry [43]; however the opposite is often true in practice. Generally, these studies suggest that it is important to continue to study Android’s graphical password system. Despite the fact that other methods exist, it remains a popular choice that many users (perhaps wrongly) see as a more secure choice for protecting their device from unauthorized access.
Background on Android Graphical Pattern
The Android graphical password pattern belongs to a family of draw-metric graphical passwords systems like Draw-A-Secret [21], Qualitative Draw-A-Secret [25], PassPoints [47], Pass-Go [35], PassShapes [46] and PassDoodles [41] to name a few. These solutions require the user to draw a predefined shape or an arbitrary representation.
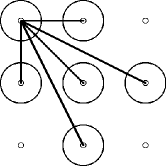
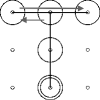
The Android graphical password pattern presents the user with a grid of 3x3 contact points on which the password pattern is “drawn” (see Figure 1). If the pattern is successfully recreated, entry to the device is granted. The drawing of a pattern is constrained such that (1) a pattern must contain at least 4 contact points, (2) a contact point may only be used once, (3) a pattern must be entered without lifting, and (4) a user may not avoid a previously un-selected contact point. In Figure 1, an example of the allowable strokes originating from the upper left corner are shown.
3 Limitations
It is relevant to also note the unique challenges associated with measuring and comparing data related to the Android unlock patterns and unlock authentication methods, generally. Foremost is that, unlike text-based passwords (and PINs), pattern authentication is not used in other contexts beyond mobile devices and is also not used for remote authentication. This impacts data collection because, for example, much of the common knowledge of the strength and variations in text based passwords comes from the leaks of large password datasets from remote authentication services. Android pattern unlock, however, are primarily used as a local authentication process, so obtaining real, user-worn graphical passwords through leaks or other means is highly unlikely.
The limits of not having known real data to analyze challenges testing the veracity of other collection methods because there does not exist a clear ground truth for comparison. Much of the data collected is only self-confirming in that researchers look to find consistency between the datasets with respect to commonalities (e.g., most frequent patterns) in the user generated/reported patterns and the strength of those patterns. Here, we attempt to cluster relevant data sets together based on features to determine if there is broader consistency and if these consistencies can be associated with a given collection method.
We are additionally limited in that the size of the datasets analyzed are not as rich as one would want from, say, a leaked password dataset. Again, this is due to the fact that leaks of real pattern data is not available, and thus all the available datasets are smaller, user-study collected. Fortunately, we can use alpha-guesswork [10], which provides comparable results even for smaller datasets, but we acknowledge that this is a limitation on our findings.
Finally, the survey of data was completed by reviewing relevant conferences and journal in the space of human computer interaction, computer security, and usable security. We did not use a formal system of review, such as searching a known research database, and we acknowledge this limitations. But, with extensive background in this space and a relatively limited number of publications in the area, we are confident that we have broad coverage of the space.
| Term | Description |
|---|---|
| Adversarial | Participants are asked to generate patterns that they believe others have used (offensive) and patterns that others cannot guess (defensive) |
| Self-Report | Participants are asked to honestly (with some checks) report the pattern that they use (or have used) on their mobile device |
| Situational | The survey proposes scenarios underwhich participants should consider generating a pattern, e.g., for a bank vs. just to unlock the device. |
| Online | The survey occurred via an online form or web application without the oversight of a researcher |
| App | The survey occured using a specialized mobile App, either installed on the participants device or researchers device |
| Local | The survey occurred within the purview of the researcher |
| On-device | The survey occurred using a mobile device |
| User-device | The survey occurred using the participants own mobile device |
| Pen-and-Paper | The survey occurred using pen-and-paper where participants “draw” the patterns |
| Mouse | The survey allowed participants to use a “mouse” rather than touch to enter patterns |
| Altered | The survey measured altered forms of unlock patterns, e.g., background images, expanded contact points, less contact points |
4 A Taxonomy of Collection Methods
Here, we provide a survey and taxonomy of the relevant work regarding data collection for Android unlock patterns, as identified by reviewing top conferences and journals in the area of computer security, usable security, and computer human interaction. This taxonomy is organized based on the terms found in Table 1 and is applied to the relevant research in Table 2. Studies are named based on the first letters of the authors’ surnames in which the studies are first presented, and for simplicity we only focus on the portions of study that collect patterns directly, without modifications to the scheme such as in SysPal [13] or 4x4 patterns [4].
4.1 Protocol Scenarios
A study must incentivize participants to act in realistic ways when generating patterns, and we observed three major forms of scenario building to incentivize participants: adversarial/game-theoretic settings, self-reporting, and situational settings.
Adversarial Incentives
One method to provide incentives to generate patterns that have a security connection is to design an Adversarial protocol (first proposed by Uellenbeck et. al [37] and later used in a pen-and-paper study by Aviv et. al [4] as well as by Tupsamudre et. al [36]). The core idea for this protocol is to have participants create a set of patterns that they wish to protect, so called defensive patterns, and a set of patterns that they believe others may have chosen, so called offensive patterns. If a participant is able to generate a defensive pattern that others did not guess with their offensive patterns, or come up with offensive patterns that others selected as their defensive pattern, the participant earns a reward.
This was primary method used in UDWH [37], labeled with *-off and *-def, collected on a mobile device. Additionally, the ABK-MP-adv [4] used a similar method, but collected using pen-and-paper. For collecting the TBLV dataset, Tupsamudre et. al [36] ran an organization-wide contest allowing each participant to choose three defensive and three offensive patterns. The challenge with adversarial technique, as we will show, is that it may both over incentivize participants in the defensive setting to create unrealistic, overly-strong patterns and similar so for the offensive setting, but instead weaker patterns.
| Name | Reference | Year | Collection Method | Analysis Method | # Participants | # Patterns | Protocol Description |
| ATOY | [3] | 2013 | Local, Online, Mouse, Situational | Visual, Physical, Demographic | 144 | 144 | Recruited participants for a lab based study, asking them to generate one strong and one weak pattern using a web-based survey using a mouse. Performed visual and physical attack analysis on collected data. |
| UDWH⋆ | [37] | 2013 | Adversarial, Local, On-device | Visual, Guessability, Recall | 113 | 106 / 573 | Recruited participants in university cafeteria to interact in an adversarial protocol of offensive and defensive patterns. Analyzed data based on guessability, visual features, common sub sequences, and recall rate. (#patterns reported deffensive/offsenive) |
| SWZ | [34] | 2014 | On-Device, Local | Visual, Meter | 81 | 27 / 54 | Recruited participants at university to generate patterns with and without a password meter (#patterns reported with-meter/without-meter) |
| SCOKH | [33] | 2015 | Self-Reported, User-device, App | Visual, Meter, Physical | 101 | 49 / 52 | Recruited participants by distributing an application in the Android App Store called EnCloud that allowed participants to store data in the cloud protected with a pattern. Some participants used a password meter and other did not. Analysis used visual features, physical attacks, and guessability. (#patterns reported with-meter/without-meter) |
| ABK-MP-self⋆ | [4] | 2015 | Self-reported, Online, User-device | Visual, Guessability, Demographics | 757 | 443 | Recruitment via MTurk to either report their pattern or statistics about the pattern. Attention tests were used to checks for honesty, and participants must use Android Devices to complete survey. |
| ABK-MP-adv⋆ | [4] | 2015 | Adversarial, Local, Pen-and-paper | Visual, Guessability, Recall, Demographics | 38 | 114 / 380 | Recruitment at university and group participants into small focus groups of size (8-to-20) to conduct adversarial protocol. (#patterns reported defensive/offensive) |
| SGSMA | [32] | 2015 | Online, User-device, Situational | Visual, Guessability | 92 | 92 | Recruited via MTurk and asked participants to imagine receive new phone and generate a pattern for that phone (with some participants received nudges to select strong patterns, see SGSMA-BLINK and SGSMA-EPSM) |
| LDR⋆ | [26] | 2016 | Online, User-device, Situational | Visual, Guessability, Demographics | 802 | 841 / 842 / 838 | Recruited using snowball methods and asked participants to generate patterns under three application scenarios (#patterns report for scenarios banking/shopping/unlock) |
| ZEBOdLAH⋆ | [44] | 2016 | Online, User-device | Visual | 506 | 506 | Recruitment via MTurk to generate patterns on participants own device (with some participants using background images or other nudges, see ZEBSOdLAH-bg) |
| CHCOSK | [13] | 2017 | Online, User-Device | Recall, Guessability, Visual | 384 | 384 | Recruitment via MTurk for individuals who owned an Android device. |
| TBLV | [36] | 2017 | Online, Adversarial (variant), Mouse | Visual, Guessability | 11,960 | 34,548/35,249 | Recruitment within organization, asking them for 3 distinct patterns that are easy for them to remember but difficult for others to guess, and 3 distinct patterns which they think are being used by other participants. Participants were able to choose between the standard arrangement and a circular arrangement (see TBLV-passO) |
| Name | Reference | Year | Collection Method | Analysis Method | # Participants | # Patterns | Protocol Description |
|---|---|---|---|---|---|---|---|
| UDWH-los | [37] | 2013 | Adversarial, Local, On-device, Altered | Guessability, Recall | 105 | 92 / 460 | Recruitment/protocol the same as UDWH but with altered contact point layout dubbed “Left-out small” with one point removed. (#patterns reported defensive/offensive) |
| UDWH-lol | [37] | 2013 | Adversarial, Local, On-device, Altered | Guessability, Recall | 99 | 87 / 439 | Recruitment/protocol the same as UDWH but with altered contact point layout dubbed “Left-out large” with one point removed. (#patterns reported defensive/offensive) |
| UDWH-circ | [37] | 2013 | Adversarial, Local, On-device, Altered | Guessability, Recall | 82♮ | 86 / 429 | Recruitment/protocol the same as UDWH but with altered contact point layout in a “circular” arrangement. (#patterns reported defensive/offensive) |
| UDWH-rand | [37] | 2013 | Adversarial, Local, On-device, Altered | Guessability, Recall | 80 | 80 / 399 | Recruitment/protocol the same as UDWH but with altered contact point layout in a “random placement” arrangement. (#patterns reported defensive/offensive) |
| ABK-MP-adv-4x4 | [4] | 2015 | Adversarial, Local, Pen-and-paper, Altered | Visual, Guessability, Recall | 40 | 119 / 382 | Protocol same as ABK-MP-adv except the grid-szize was expanded to 4x4. (#patterns reported defensive/offensive) |
| SGSMA-EPSM | [32] | 2015 | Online, User-Device, Situational, Altered | Visual Guessability | 72 | 72 | Protocol same as SGSMA except pattern entry was altered to include continuous meter feedback based on [2]. |
| SGSMA-BLINK | [32] | 2015 | Online, User-Device, Situational, Altered | Visual Guessability | 106 | 105 | Protocol same as SGSMA pattern entry was altered to include blinking contact points to suggest starting points. |
| ZEBOdLAH-bg | [44] | 2016 | Online, User-device, Mouse, Altered | Visual | 496 | 496 / 496 | Recruitment via email lists and divided participants into two alterations one with static background image (girl’s face) and one with dynamic background image (moving air bubbles (#patterns reported for static/dynamic) |
| CHCOSK-syspal | [13] | 2017 | Online, User-Device | Recall, Guessability, Visual | 331/342/326/334 | 331/342/326/334 | Same as CHCOSK except that 1-point/2-point/3-point/Random-points were pre-selected that the participant must select patterns using those contact points |
| TBLV-passO | [36] | 2017 | Online, Adversarial (variant), Mouse, Altered | Visual, Guessability | 9,093 | 26,469/26,914 | Protocol same as TBLV. Participants were able to choose between the standard arrangement and a circular arrangement. |
Self Reporting
Another collection method is to directly ask participants to Self-Report the patterns they use. The challenges with this approach are obvious: what is to stop participants from lying? Additionally, it is counter to security practices for participants to release this information. These limitations are non-negligible, but researchers can build in checks to exclude participants who abuse the survey and provide assurances to incentivize participation. For example, the survey can have participants enter the pattern multiple times, conduct the survey on the participants own Android device, or ask the participant directly (without penalty) if they provided truthful answers. Additionally, as patterns are only useful with access to the physical device, participants may feel comfortable revealing this information.
These methods were used to collect the ABK-MP-self [4] dataset which applied a self-report method by recruiting participants from MTurk. Participants were given the option to report their pattern (on their own device) or answer statistics (e.g., length, start point, common sequences) about their pattern. Attention tests were used to ensure that participants answered honestly.
Situational Representations
Another technique to increase the variation of patterns is to place participants in situational scenarios with reduced or increased risk to data. The idea being that increased risk scenarios may illicit participants to report stronger passwords as compared to the reduced risk scenarios. These techniques have been used in text-based password research [39].
The LDR [26] data set used this technique in its protocol to increase the diversity of reported patterns. In particular, researchers asked participants to generate a pattern for use as a bank password, as a shopping web site password, and as normal device unlock password. One of their results shows that patterns created for the bank are significantly stronger than those created for online shopping and device unlock. In a similar, but less situational setting, ATOY dataset was collected with a protocol asking participants to provide one easy to remember password and one hard to guess password [3]. SGSMA also provided a situation setting in their dataset collection directing participants to consider setting up a new phone [32].
4.2 Participant Recruitment
Local vs. On-line
Collecting Android unlock patterns can be conducted in two main ways, locally or remotely. A local study occurs when the researchers and participants are co-located, for example, in the form of a lab study where participant are asked to come into a setting and generate patterns under the supervision of the researcher(s). The benefits of such an approach relate to the experimenter’s ability to control extraneous and independent variables. However, logistics of bringing in a large sample of participants within a short time period is not without its challenges. Additionally, the presence of a research can lead to Hawethorn effect whereby participants behave differently due to being directly observed or having an expectation of a given outcome.
In contrast, a remote study is conducted without the direct supervision of the researcher, and is generally conducted on-line via a web-based platform accessed through the browser. They can be distributed using services like Amazon Mechanical Turk, the marketplace, or using a snowball technique. Users may feel more comfortable interacting with technologies within their own environment during remote studies, although the risk of interruptions in an uncontrolled environment is higher than in an in-lab study. A challenge with the on-line setting is verifying that participants act in ways that are conducive to the study, which can be directly observed in the local setting.
Good examples of local studies in our survey are the data sets ATOY, UDWH, SGSMA, SWZ, and ABK-MP-adv [37, 3, 34, 4, 32]. In each of these studies the researchers were present during data collection; in ATOY, this took the form of a lab computer where participants were asked to enter patterns that were easy and hard; in UDWH, this took the form of research recruiting participants in the institutions cafeteria and instructing them in the procedures of the protocol; and in ABK-MP-adv participants were divided into study groups and operated under the supervision of the researchers to complete the protocol.
Good examples of online studies are ABK-MP-self, LDR, ZEBOdLAH, CHKCOSK, and TBLV [4, 26, 44, 13, 36]. In each of these studies, the participants were recruited either via a system like Amazon Mechanical Turk [4, 44, 13], snowball efforts [26], or company mailing lists [36] to complete a survey hosted on-line. The researcher and the participant are separated from each other, as opposed to a local study.
Application Based
A separate, but related form of on-line surveys recruitment, is by distributing a specialized application (i.e., an App) developed using Android’s development tools and posting the App via one of the Android Application marketplaces. We describe this technique as App in Table 1 and can be an effective way to get known, real Android users to participate in the study. The challenges with this technique comes down to ethics; users may interpret the application as non-research and use the application in ways that are unintended by the researchers. However, proper informed consent can account for this.
A good example of this methodology is the SCOKH study [33]. The researchers released an application into the market place called EnCloud which purported to be a encrypted cloud storage service where data was secured using an Android unlock pattern. The participants were then allowed to choose patterns under different conditions, e.g., having a meter or not, to measure the effectiveness of their choices.
4.3 User Input Methods
There are also varied forms for the ways in which participants generate a pattern for study. For example, as the Android unlock pattern is used on a touchscreen device, it is most natural to conduct the survey where users enter patterns via touch gestures on a smartphone or tablet. This natural setting is described as On-device, and if it occurred on participants’ own devices, we describe this as User-device. Both App based studies and on-line studies can utilize on-device/user-device methods as well as local collections.
A good example of the distinction between on-device (but not user-device) is the UDWH data set where participants were recruited at a school cafeteria and were directed to use a device with the survey pre-built in [37]. ABK-MP-self, LDR, ZEBOdLAH, SGSMA and SCOKH, in contrast, were conducted on-line and allowed participants to use their own device to complete the survey [32, 4, 26, 33, 44] often requiring participants to use an Android device (checked via the user-agent field) or because the survey was distributed through the App marketplace.
For some online studies, though, it could be the case that some participants used a Mouse to enter patterns (as in ATOY), which may affect the kinds of patterns that are deemed “usable” as the mouse allows for finer motor control as compared to gestures [3].
Additionally, as the Android unlock patterns are “drawn” it is also possible to conduct studies using pen-and-paper where participants literally draw patterns using a pen on a sheet of paper with printed contact points, as was the case in ABK-MP-adv. Such a non-technical data collection method may seem counter intuitive for this space, but the sensory aspect of drawing translates well between touching and writing. There is also evidence that this technique does produce realistic results [8], but some spatial aspects of patterns (e.g., the starting points) may be slightly changed as compared to other collection methods.
| Term | Description |
|---|---|
| Visual | Patterns were analyzed based on visual or structural properties, such as the length, crosses, or other aspects that affect its visual construction |
| Meter | Patterns were anlayzed based on a password-like meter construction developed by the authors |
| Physical | Patterns were analyzed in the context of physical attacks, such as smudge attacks [7] or shoulder surfing [30, 42, 14, 5] |
| Occurrence Rates | Patterns were analyzed for how frequently they appear in the data, or how frequently subests of patterns (e.g., 3-grams) appear |
| Guessability | Patterns were analyzed based on how guessable they are to an adversary trying to crack the password, typically reported in terms of the guessing entropy [22, 10] |
| Recall | Patterns were measured based on memorability and recall rates of the participants |
| Demographic | Pattern properties were measured (e.g., using one of the above methods) and compared along demographic factors (e.g., handedness, male/female, location). |
5 Analysis and Comparison of Datasets
Next, we turn our attention to the actual collected data, performing analysis over that data using the most common techniques. A list of analysis methods used in the prior work are provided in Table 4; we focus on occurrence rates, visual features, and guessability. We do not consider ad-hoc methods of pattern strength, as used in password meters [33, 34] as these are not grounded and are typically based on visual features anyway. We also do not consider recall rates as they are not germane to comparing datasets.
Unfortunately, we were not able to acquire all relevant datasets, either due to ethical reasons or institutional oversight, but we were able to access 9 distinct datasets presented in four prior publications: ABK-MP-self, ABK-MP-adv-def, ABK-MP-adv-off [4]; LDR-banking, LDR-shopping, LDR-unlock [26]; UDWH-def, UDWH-off [37]; and ZEBOdLAH [44].
| ABK-MP-adv-off | |||||||||
|---|---|---|---|---|---|---|---|---|---|
| freq=9 | freq=9 | freq=9 | freq=7 | freq=6 | freq=5 | freq=5 | freq=5 | freq=5 | freq=5 |
| ABK-MP-self | |||||||||
| freq=17 | freq=11 | freq=8 | freq=8 | freq=7 | freq=6 | freq=6 | freq=6 | freq=5 | freq=4 |
| LDR-banking | |||||||||
| freq=17 | freq=16 | freq=15 | freq=9 | freq=8 | freq=8 | freq=6 | freq=6 | freq=6 | freq=6 |
| LDR-shopping | |||||||||
| freq=26 | freq=24 | freq=21 | freq=19 | freq=18 | freq=15 | freq=14 | freq=10 | freq=9 | freq=9 |
| LDR-unlock | |||||||||
| freq=27 | freq=23 | freq=22 | freq=16 | freq=15 | freq=12 | freq=8 | freq=8 | freq=8 | freq=8 |
| UDWH-offensive | |||||||||
| freq=25 | freq=22 | freq=11 | freq=9 | freq=9 | freq=8 | freq=7 | freq=6 | freq=6 | freq=6 |
| ZEBOdLAH | |||||||||
| freq=12 | freq=11 | freq=10 | freq=7 | freq=7 | freq=6 | freq=6 | freq=6 | freq=5 | freq=5 |
| Total | |||||||||
| freq=95 | freq=91 | freq=90 | freq=86 | freq=70 | freq=41 | freq=40 | freq=40 | freq=39 | freq=37 |
Occurrence Rates
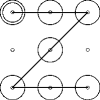
The most basic analysis one can perform to compare datasets is to look at the most commonly used patterns. One can visualize the most frequent patterns (such a visual is provided in Figure 2), and a casual observations provides some intuition that there exists a number of high occurring patterns that are consistent across datasets, such as a the Z or L shape (in various symmetries).
We avoid analysis of the frequency of individual patterns, which has been covered in prior work related to these datasets, and instead concern ourselves with comparing the datasets with respect to how frequent repeated patterns occur as well as the overall uniqueness of the data. Both of these metrics are related to the strength of the dataset; the less unique (or more repetitions) a dataset is (or has) the easier it is to predict the patterns and thus guess the patterns.
Repetitions are calculated by counting the number of patterns that occur two ore more times in the dataset, which we can then normalize by the size of the dataset because larger datasets should have proportionally larger number of repetitions. The uniqueness of the dataset measures the proportion of unique patterns to the total number of data in the dataset. For example, a 50% unique dataset implies that of the 100 patterns in the dataset, 50 of them are unique and the other 50 are repeats. These results are presented in Table 5.
Using a test, we can test for significant differences in the proportions of both repetitions and uniqueness, and in both cases, we find that there are significant differences ( for repetitions, and for uniqueness). Further investigation into the differences using a post-hoc, pairwise test using a false discover rate correction, showed that there are distinct groupings of similar datasets in each category. The groupings are represented in Table 5 using letters, such that datasets with the same letter are not significantly different.
For the proportion of repetitions, the defensive datasets stand out, but particularly the UDWH-def dataset which has significantly fewer repetitions than the other datasets and is only similar to the other defensive dataset. This suggests that the adversarial collection method tends to encourage participants to select more unique patterns for the defensive collection, and as these were both collected in-person, the effect of having other participants and researchers present may further encourage this behavior.
When measuring dataset uniqueness, the post-hoc analysis reveals other relationships, breaking down into three basic regimes. The highest proportion of unique patterns is, again, the defensive datasets (a grouping). There is also a low regime with the lowest proportion of unique patterns which contains the LDR-shopping and LDR-unlock (d grouping). In the middle, bottom-half, are the two offensive datasets ABK-MP-adv-off, UDWH-off (overlapping in b) and the top-half contains the remaining datasets of ABK-MP-self, ZEBOdLAH, and LDR-banking (overlapping at c groupings).
This suggests that the adversarial model produces similar results in both the higher regime defensive and middle regime offensive. The scenario driven data collection with the weakest motivator, shopping and, surprisingly, unlocking, have some of the least unique sets of patterns. Finally, the remaining datasets, which contain collection with stronger scenarios and self-reporting, on device, have a close consistent groupings. We will see similar groupings when analyzing the strengths of the datasets as uniqueness properties are related to guessability strength metrics.
| dataset | size | rep. | norm. rep. | %unique | avg | std | ||
|---|---|---|---|---|---|---|---|---|
| UDWH-def | 106 | 3 | 0.028 | a | 97.2% | a | 0.029 | 0.168 |
| ABK-MP-adv-def | 113 | 8 | 0.071 | ab | 92.9% | a | 0.076 | 0.265 |
| UDWH-off | 573 | 78 | 0.136 | b | 59.2% | b | 0.690 | 2.196 |
| ABK-MP-self | 440 | 61 | 0.139 | b | 67.7% | c | 0.477 | 1.484 |
| LDR-shopping | 841 | 119 | 0.141 | b | 52.6% | d | 0.903 | 2.694 |
| ZEBOdLAH | 507 | 72 | 0.142 | b | 69.0% | c | 0.449 | 1.297 |
| ABK-MP-adv-off | 378 | 57 | 0.151 | b | 65.6% | bc | 0.524 | 1.292 |
| LDR-banking | 838 | 128 | 0.153 | b | 66.2% | c | 0.510 | 1.482 |
| LDR-unlock | 842 | 138 | 0.164 | b | 49.8% | d | 1.010 | 2.604 |
| Spatial Features | Visual Properties | ||
|---|---|---|---|
 |
 |
 |
 |
| Length=7 | Cross | KMove | Non-adj |
| Stroke-Length=6.82 | |||
| Turns=2 | |||


Spatial Features and Visual Properties
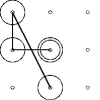
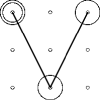
We analyzed the provided datasets using three spatial features and three visual properties. Each of these pattern classification methods have been applied in prior work as a way to understand the shapes of patterns [13, 26, 32, 4, 8, 3, 37], or as way to estimate the strength of a pattern, as in a password meter [33, 34]. For a pictorial, refer to Figure 3, as each is explained.
-
•
Spatial Features:
-
–
Length (length): The number of contact points used in the pattern. For example, the Z-shaped pattern used 7 contact points.
-
–
Stroke Length (s-length): The length of the gesture lines in the pattern by using the Gaussian distance measure with the center contact point mapped to (0,0) and each contact point being one unit apart. For example, the Z-shaped pattern has a stroke length 6.82, with the top and bottom line worth 2 units, and the diagonal is .
-
–
Turns (turns): The number of direction changes in a pattern. For example, the Z-shaped pattern makes two direction changes, thus has 2 turns.
-
–
-
•
Visual Properties:
-
–
Crosses (crosses): When two lines overlap and cross over in any shape.
-
–
Knight Moves (kmoves): When a line connects two contact points over 1 and down 2 (or in symmetries), like a knight moves in chess.
-
–
Non Adjacency (non-adj): When a previous contacted point is traced over to connect two non-adjacent contact points. In the example in Figure 3, the middle contact point is first, then right, then over the middle to the left, connecting two non-adjacent contact points.
-
–
The results of calculating these features and properties across the datasets are presented in Table 6. Significance testing was done using Kruskal-Wallis as there was unequal variance or non-normal distributions in the data. As this is a conservative test, and the datasets are relatively large, we found that there was significant differences among the dataset for each of the tested features. Using pairwise Mann-Whitney U-tests with a Bonferroni correction, we sought to identify groups of similar datasets, these are labeled with letter codes in Table 6. As before, datasets, under the category, with the same letter are not significantly different.
| dataset | length | slength | turns | crosses | kmoves | non-adj | ||||||
|---|---|---|---|---|---|---|---|---|---|---|---|---|
| UDWH-off | 6.30 (1.68) | a | 5.88 (1.97) | a | 2.64 (1.35) | a | 0.08 (0.39) | bc | 0.06 (0.30) | a | 0.09 (0.32) | bc |
| UDWH-def | 6.55 (1.74) | a | 6.45 (2.08) | a | 3.31 (1.40) | b | 0.21 (0.58) | a | 0.15 (0.43) | b | 0.16 (0.42) | ac |
| ABK-MP-adv-off | 6.34 (1.67) | a | 5.90 (1.75) | a | 2.62 (1.15) | a | 0.02 (0.18) | c | 0.03 (0.23) | a | 0.11 (0.32) | abc |
| ABK-MP-adv-def | 6.11 (1.53) | ab | 5.99 (1.89) | ab | 2.94 (1.30) | ab | 0.13 (0.59) | ab | 0.09 (0.43) | ab | 0.14 (0.42) | abc |
| ABK-MP-self | 6.05 (1.63) | ab | 5.82 (2.08) | ab | 2.65 (1.30) | a | 0.14 (0.75) | ab | 0.08 (0.44) | ab | 0.16 (0.43) | a |
| LDR-banking | 5.92 (1.83) | b | 5.67 (2.44) | b | 2.78 (1.58) | a | 0.21 (1.08) | a | 0.14 (0.66) | b | 0.12 (0.43) | abc |
| LDR-shopping | 5.54 (1.70) | c | 5.05 (2.02) | c | 2.28 (1.31) | c | 0.08 (0.53) | bc | 0.08 (0.41) | ab | 0.07 (0.33) | b |
| LDR-unlock | 5.40 (1.57) | c | 4.92 (1.93) | cd | 2.20 (1.23) | c | 0.07 (0.48) | bc | 0.06 (0.36) | a | 0.07 (0.30) | b |
| ZEBOdLAH | 5.03 (1.44) | d | 4.66 (1.77) | d | 2.22 (1.09) | c | 0.08 (0.30) | ab | 0.07 (0.32) | ab | 0.08 (0.28) | bc |
| dataset | start-x | start-y | end-x | end-y | ||||
|---|---|---|---|---|---|---|---|---|
| ABK-MP-adv-def | -0.34 (0.76) | ab | 0.41 (0.81) | ab | 0.15 (0.79) | a | -0.20 (0.84) | ab |
| ABK-MP-adv-off | -0.32 (0.80) | a | 0.34 (0.83) | a | 0.19 (0.86) | a | -0.12 (0.87) | a |
| ABK-MP-self | -0.49 (0.77) | b | 0.39 (0.86) | ab | 0.34 (0.79) | a | -0.19 (0.84) | ab |
| LDR-banking | -0.42 (0.82) | ab | 0.40 (0.84) | ab | 0.25 (0.81) | a | -0.22 (0.81) | ab |
| LDR-shopping | -0.42 (0.81) | ab | 0.51 (0.79) | b | 0.28 (0.80) | a | -0.26 (0.82) | ab |
| LDR-unlock | -0.43 (0.80) | ab | 0.43 (0.83) | ab | 0.34 (0.79) | a | -0.32 (0.79) | b |
| UDWH-def | -0.45 (0.83) | ab | 0.28 (0.90) | ab | 0.13 (0.81) | a | -0.21 (0.79) | ab |
| UDWH-off | -0.50 (0.79) | b | 0.42 (0.85) | ab | 0.21 (0.85) | a | -0.26 (0.85) | ab |
| ZEBOdLAH | -0.50 (0.73) | b | 0.37 (0.81) | a | 0.26 (0.80) | a | -0.18 (0.79) | a |
For length and slength, there is a clear grouping which suggests that collection methods may have had an effect on pattern length features. In particular, both adversarial method’s datasets are much longer than the scenario-driven ones, with the self-reporting in the middle. As length is correlated with slength and turns, similar groupings exist there. For visual properties, e.g., crosses, kmoves, non-adj, we see that these groupings by collection do not persists, and there are is much overlap across different datasets.
These results suggest that the collection method can impact some of the features, namely those based on the length of the pattern, but the effect is small (). Adversarial (e.g, *-off,*-def) collection methods encourage slightly longer patterns, while scenario-driven (ZEBOdLAH, LDR-*) collection tends towards slightly shorter. While other visual features vary across datasets, the overlapping similarities do not appear to correlate across collection methods and there is very small, perhaps trivial, effects.
Start- and End-conditions
A similar analysis is used to understand the start and end conditions of patterns, that is, which contact points in the grid do users tend to select for initiating and terminating a pattern. We compute averages by assigning the middle point of the pattern to the (0,0) in the Cartesian plain, as before, and calculating the average x and y shift for the start and end locations when mapped into the plain. The analysis is found in Table 7.
Using Kruskal-Wallis, we find that there does exist significant differences between the data sets, but these differences are small, and in post-hoc analysis using pairwise Mann-Whitney U-test with Bonferroni corrections, there are large groupings of similarities between the datasets that appear uncorrelated with dataset or collection method. Additionally, the effect size of is trivial, all suggesting that collection methods likely plays little role in spatial shifting of the start and end points. Users seems consistent in preferring to start in the upper-left and end in the lower-right.
| min | 1st quart. | median | 3rd quart. | max | |
| UDWH-def | 0.52 | 5.68 | 8.83 | 13.13 | 19.93 |
| ABK-MP-adv-def | 0.52 | 4.87 | 7.64 | 11.76 | 19.93 |
| ABK-MP-adv-off | 0.52 | 3.86 | 6.46 | 9.13 | 19.93 |
| ABK-MP-self | 0.52 | 3.91 | 6.00 | 9.59 | 19.93 |
| ZEBOdLAH | 0.52 | 4.29 | 6.38 | 9.43 | 19.93 |
| LDR-banking | 0.52 | 4.21 | 6.48 | 9.39 | 19.93 |
| UDWH-off | 0.52 | 3.60 | 5.50 | 9.04 | 19.93 |
| LDR-shopping | 0.52 | 3.65 | 5.27 | 8.42 | 19.93 |
| LDR-unlock | 0.52 | 3.76 | 5.27 | 7.94 | 19.93 |
Strength of individual patterns
Pattern strength is inversely related to the frequency and probability of a pattern being used in real life, as a rational attacker will try to guess more frequent/likely patterns first to maximize his success for a limited number of attempts. While the frequency of patterns is known within the sample sets, it is imperative to estimate the likelihood of patterns, generally.
Different approaches have been used to do this estimation. We use Markov models to calculate the probabilities of users selecting a given pattern which can then be used as an approximations for the pattern strength. The technique we apply follows closely that of Aviv et al. [4], which expands on the Markov model of Uellenbeck et al. [37] by adding in additional predictions related to the start points, length, and finish points of the pattern.
Markov models are based on the observation that subsequent tokens, such as letters in normal text or contact points in the pattern, are rarely independently chosen by humans, but can often be quite accurately modeled based on a short history of tokens. For example, in English texts, the letter following a t is more likely to be an h than a q, and for Android pattern unlock, a similar process occurs by which users are more likely to choose some transitions over others based on prior state, e.g., starting in the upper left, a user will more likely move to the right as opposed to the center contact point.
Using these facts, one can construct an -gram Markov model that estimates the likelihood of a pattern by considering the probability of a transition from the previous contact points to the next contact point. For a given sequence of contact points for a pattern , an -gram Markov model estimates its probability as
| (1) | |||
The required initial probabilities and transition probabilities can be determined empirically from the relative frequencies from training data. To handle the varying length of patterns we additionally multiply with a length term . Also, as suggested by Aviv et al [4], we consider special (non-contact) start transitions and end transitions to capture start and end conditions for transitions less than length as they occur at the beginning and end of a pattern.
One commonly applies further post-processing to the raw frequencies: So-called smoothing tries to even out statistical effects in the transition matrix and initial probabilities. In particular, smoothing avoids relative frequencies of , as these would yield an overall probability of regardless of the remaining probabilities. We use smoothing based on a uniform probability drawn from the set of all 389,112 possible patterns, assuming each are equally likely.
In our analysis, to determine the strength of an individual pattern, we trained a 3-gram Markov model using all patterns in our collected dataset with one instance of the pattern being measured left out. This process ensures independence of training and evaluation sets while preserving information about pattern frequencies. For example, the pattern may be very frequent, but only a single instance is removed. The estimated probabilities for patterns, , could be used directly as a strength measurement, but as probabilities over a large set of possibilities, they are quite small. A more readable measure is , where logarithms are to basis , and we add a small constant to cap strength scores at . We use this strength measure in the rest of this work as a representation of a likelihood of pattern as estimated by the Markov model.
We compare the strength scores for the individual datasets and present the results in Table 9. A Shapiro-Wilk test suggest that the data is not normally distributed (), and so we compare the data using a Kruskal-Wallis to find that that there are significant differences across the datasets () The results from the post-hoc test (pairwise Mann-Whitney U with Holm correction) are shown in Table 10. The table shows the corrected -values from the pairwise comparison, and marks significant differences in bold.
These results directly inform the grouping of our datasets based on similarity of pattern strength, and are similar to the groupings found in the dataset uniqueness analysis as the Markov model probabilities are sensitive to that metric. This grouping into a low, medium, and high strenght regime informs our analysis going forward.
| 20-guesses | ||||
| UDWH-def | 10.02 | 11.51 | 13.28 | 4.76% |
| ABK-MP-adv-def | 8.91 | 9.73 | 12.65 | 5.91% |
| ABK-MP-adv-off | 6.85 | 7.70 | 9.40 | 13.47% |
| ABK-MP-self | 6.00 | 7.23 | 9.31 | 14.62% |
| ZEBOdLAH | 6.37 | 6.87 | 8.92 | 18.00% |
| LDR-banking | 6.87 | 7.84 | 9.81 | 13.38% |
| UDWH-off | 5.54 | 6.85 | 8.95 | 19.00% |
| LDR-shopping | 5.50 | 6.74 | 8.35 | 18.88% |
| LDR-unlock | 4.90 | 6.43 | 8.06 | 21.12% |
| UDWH-def | ABK-MP-adv-def | ABK-MP-adv-off | ABK-MP-self | ZEBOdLAH | LDR-banking | UDWH-off | LDR-shopping | LDR-unlock | |
| UDWH-def | - | 0.55084 | 3.1e-06 | 1.3e-05 | 0.00011 | 3.6e-06 | 3.1e-08 | 5.0e-11 | 4.0e-12 |
| ABK-MP-adv-def | 0.55084 | - | 0.01777 | 0.04427 | 0.22124 | 0.06071 | 0.00063 | 4.5e-06 | 1.2e-06 |
| ABK-MP-adv-off | 3.1e-06 | 0.01777 | - | 1.00000 | 1.00000 | 1.00000 | 1.00000 | 0.05711 | 0.01500 |
| ABK-MP-self | 1.3e-05 | 0.04427 | 1.00000 | - | 1.00000 | 1.00000 | 0.57343 | 0.01500 | 0.00363 |
| ZEBOdLAH | 0.00011 | 0.22124 | 1.00000 | 1.00000 | - | 1.00000 | 0.01500 | 7.9e-06 | 8.0e-07 |
| LDR-banking | 3.6e-06 | 0.06071 | 1.00000 | 1.00000 | 1.00000 | - | 0.02543 | 2.8e-06 | 1.2e-07 |
| UDWH-off | 3.1e-08 | 0.00063 | 1.00000 | 0.57343 | 0.01500 | 0.02543 | - | 1.00000 | 0.87558 |
| LDR-shopping | 5.0e-11 | 4.5e-06 | 0.05711 | 0.01500 | 7.9e-06 | 2.8e-06 | 1.00000 | - | 1.00000 |
| LDR-unlock | 4.0e-12 | 1.2e-06 | 0.01500 | 0.00363 | 8.0e-07 | 1.2e-07 | 0.87558 | 1.00000 | - |
(Partial) Guessing Entropy based on Markov Model
(Partial) guessing entropy [27, 10] is a measure of the strength of human-chosen authentication secrets, such as pattern sequences, with a strong theoretical foundation. Intuitively, it models an “ideal” attacker who knows the probabilities of all patterns, and guesses those patterns in order of decreasing likelihood. This has the advantage that it does not depend on a specific guessing algorithm, but has the disadvantage that it assumes an ideal (and possibly unrealistic) adversary. We use the logarithmic variant of this measure, , which gives “bits of information” (see [10] for definitions and details).
Computing requires an accurate approximation of the distribution , which normally requires large sample sizes beyond the collected data. In line with previous work [37] we use an approximation based on Markov models to compute . Thus the entropy results are relative to the chosen Markov model, and typically constitute an upper bound only. We report (partial) entropy estimates for the levels , i.e., for an attacker trying to break 10%, 20%, or 50% of the accounts, respectively.
To do the guessing, we performed a 5-fold cross-validation on each dataset by which we trained the Markov model using 4 of the folds and guessed on the remaining fold. We guessed based on the absolute ordering of all 389,112 patterns based on the likelihood measures as computed by the Markov model. More advanced and aggressive guessing strategies could be used (as described by Aviv et. al [4]), but this strategy produces the most repeatable results.
The results are presented in Table 9 which are an average of 3 runs of the cross-fold validation. The results show similar groupings as in Table 10. We also note that these entropy measures are not precisely as reported in prior work [4, 37] and is likely due to small variations (or over-fitting) in modeling for the Markov model; however, general trends remain.
6 Discussion of Collection Methods
Adversarial Setting
Two datasets are collected under the adversarial settings: The UDHW and the ABK-MP-adv datasets. Tables 8 and 9 shows that the two defensive datasets are the strongest datasets available to us, and in fact the post-hoc tests show that the two defensive sets are significantly stronger than almost every other dataset (the only two exceptions are ABK-MP-adv-def/ZEBOdLAH and ABK-MP-adv-def/LDR-banking).
It seems most likely that these differences can be explained by the collection method. This is evident due to the fact that the corresponding offensive data is collected during the same experiment from the same user base and shows significant differences in strength — namely, they are some of the weakest in terms of strength — but while significant differences exist in spatial features, there are reactively small magnitude differences. We also see similarity between the offensive and defensive (respectively) for repetitions and uniqueness qualities. This all suggests that the adversarial setting encourages participants to draw the same patterns based on visual indicators, but somehow are incentivized to choose less common, harder to guess patterns. Second, all the other datasets behave much more similar (in terms of strength and guessability) compared to the defensive sets. For example, the ABK-MP-adv-def and UDWH-def are 3 and 4 bits higher in partial guessing entropy compared to the next highest data set.
Situational Settings
On the weak end of the spectrum, three datasets are generally weaker than the other datasets, the LDR-shopping and LDR-unlock datasets, as well as the UDWH-off. The three LDR datasets were collected using the same situational protocol, but it was observed in the original publication [26] that the three datasets behave differently and that the banking scenario prompted participants to choose stronger patterns. The three datasets are significantly weaker than any other dataset, with three exceptions (UDWH-off/ABK-MP-adv-off, UDWH-off/ABK-MP-self, and LDR-shopping/ABK-MP-adv-off). From these results, we speculate and would recommend that researchers use strong situational motivation.
Medium strength datasets
The four remaining datasets, i.e., ABK-MP-adv-off, ABK-MP-self, ZEBOdLAH, and LDR-banking, have no significant differences in strength amongst each other. They form a more or less consistent subset with very similar strength and guessability characteristics. We conjecture that this group of datasets may most likely mimic reality of pattern strength as they include the only self-reported dataset (ABK-self) and there is such strong similarity.
Participant recruitment
Both UDWH and ABK-MP-adv performed local recruitment, while most other datasets in our evaluation performed online recruitment. In principle, this could provide an alternate explanation for the strength of the defensive datasets, e.g., some form of a Hawthorn effect whereby the presence of the researcher (or other participants) affected the results. However, the differences in collection protocol, specifically the strong external incentives from other participants attacking the pattern, seem a much more likely explanation for the observed strength differences.
There is some argument to be made that application-based data collection may provide the most reliable data from a population using their phone with an installed application with real-world accounts. Unfortunately, we do not have access to a dataset collected under this protocol.
Input methods
Almost all datasets available to us were collected on a mobile device (either user device or provided device), but it doesn’t seem likely that this difference influences the strength of patterns. (The only exception is the ABK-MP-adv dataset which was collected using pen-and-paper.) In most cases it seems advisable to have an input method as close to the original input as possible, and thus perform a study on a provided or the user’s own device. Sometimes, e.g., to address privacy concerns, data collection using pen-and-paper can be preferable. This is consistent with the results previously reported by Aviv et. al [6] that there were minimal differences in the pen-and-paper sample. As such, we woudl recommend that studies be conducted on-device when possible, but pen-and-paper can be used as substitute in an adversarial setting with only considering the offensive data set.
7 Conclusion
We present the first cross dataset comparison of Android unlock patterns, as well as a systemized review of the collection and analysis methods used in this space. From this work, we find that there exist significant differences, both in terms of pattern strength (as measured using guessability metrics) and visual/spatial properties. However, the impact of spatial properties is relatively small, albiet significant, but collection method has a large effect on pattern strength. Adversarial settings both over and under incentivize strong and weak patterns, and weak situational motivators can also have a negative effect. We find that there is a strong, consistent midrange of data that we conjecture that most likely contains the most realistic patterns. Additionally, the input method and participant recruitment settings seem to have limitted or no effect.
Based on this survey and analysis, we would recommend that researchers carefully consider the collection method to ensure that there are clear motivators. For example, use a variety of data collection methods to assess a range of possible values when performing strength. Additionally, researchers should use grounded strength metrics, based on guessability, as there is not enough differences in spatial and visual features to make strong claims.
References
- [1] Pin analysis. http://www.datagenetics.com/blog/september32012/index.html.
- [2] P. Andriotis, T. Tryfonas, and G. Oikonomou. Complexity metrics and user strength perceptions of the pattern-lock graphical authentication method. In Human Aspects of Information Security, Privacy, and Trust, pages 115–126. Springer, 2014.
- [3] P. Andriotis, T. Tryfonas, G. Oikonomou, and C. Yildiz. A pilot study on the security of pattern screen-lock methods and soft side channel attacks. In Proceedings of the sixth ACM conference on Security and privacy in wireless and mobile networks, WiSec’13, pages 1–6, 2013.
- [4] A. J. Aviv, D. Budzitwoski, and R. Kuber. Is bigger better? Comparing user-generated passwords on 3x3 vs. 4x4 grid sizes for Android’s pattern unlock. In Proceedings of the 31th Annual Computer Security Applications Conference, ACSAC’15, 2015.
- [5] A. J. Aviv, J. T. Davin, F. Wolf, and R. Kuber. Towards baselines for shoulder surfing on mobile authentication. In Proceedings of the 33rd Annual Computer Security Applications Conference, ACSAC 2017, pages 486–498, New York, NY, USA, 2017. ACM.
- [6] A. J. Aviv and D. Fichter. Understanding visual perceptions of usability and security of Android’s graphical password pattern. In Proceedings of the 30th Annual Computer Security Applications Conference, ACSAC’14, pages 286–295, 2014.
- [7] A. J. Aviv, K. Gibson, E. Mossop, M. Blaze, and J. M. Smith. Smudge attacks on smartphone touch screens. In Proceedings of the 2010 Workshop on Offensive Technology, WOOT’10, 2010.
- [8] A. J. Aviv, J. Maguire, and J. L. Prak. Analyzing the impact of collection methods and demographics for Android’s pattern unlock. In Usable Security (USEC) Workshop, USEC’16, 2016.
- [9] A. J. Aviv, B. Sapp, M. Blaze, and J. M. Smith. Practicality of accelerometer side channels on smartphones. In Proceedings of the 28th Annual Computer Security Applications Conference, ACSAC’12, pages 41–50, 2012.
- [10] J. Bonneau. The science of guessing: analyzing an anonymized corpus of 70 million passwords. In Proceedings of the 2012 IEEE Symposium on Security and Privacy, SP’12, pages 538–552, 2012.
- [11] J. Bonneau, S. Preibusch, and R. Anderson. A birthday present every eleven wallets? The security of customer-chosen banking PINs. In Financial Cryptography and Data Security, pages 25–40. 2012.
- [12] Y. Chen, T. Li, R. Zhang, Y. Zhang, and T. Hedgpeth. Eyetell: Video-assisted touchscreen keystroke inference from eye movements. In IEEE Symposium on Security and Privacy, S&P’18, 2018.
- [13] G. Cho, J. H. Huh, J. Cho, S. Oh, Y. Song, and H. Kim. Syspal: System-guided pattern locks for android. In 2017 IEEE Symposium on Security and Privacy (SP), pages 338–356, May 2017.
- [14] J. T. Davin, A. J. Aviv, F. Wolf, and R. Kuber. Baseline measurements of shoulder surfing analysis and comparability for smartphone unlock authentication. In Proceedings of the 2017 CHI Conference Extended Abstracts on Human Factors in Computing Systems, CHI EA ’17, pages 2496–2503, New York, NY, USA, 2017. ACM.
- [15] S. Egelman, S. Jain, R. S. Portnoff, K. Liao, S. Consolvo, and D. Wagner. Are you ready to lock? In Proceedings of the 2014 ACM SIGSAC Conference on Computer and Communications Security, CCS ’14, pages 750–761, 2014.
- [16] C. Farivar. Apple to require 6-digit passcodes on newer iPhones, iPads under iOS 9: Stronger passcode ups the ante: there will be one million possible permutations. Jun 8, 2015.
- [17] M. Harbach, A. De Luca, and S. Egelman. The anatomy of smartphone unlocking: A field study of android lock screens. In Proceedings of the 2016 CHI Conference on Human Factors in Computing Systems, CHI ’16, pages 4806–4817, 2016.
- [18] M. Harbach, A. De Luca, N. Malkin, and S. Egelman. Keep on lockin’in the free world: A multi-national comparison of smartphone locking. In Proceedings of the 2016 CHI Conference on Human Factors in Computing Systems, CHI ’16, pages 4823–4827, 2016.
- [19] M. Harbach, E. von Zezschwitz, A. Fichtner, A. De Luca, and M. Smith. It’s a hard lock life: A field study of smartphone (un) locking behavior and risk perception. In Symposium on Usable Privacy and Security (SOUPS), 2014.
- [20] S. Heidt and A. J. Aviv. Refining graphical password strength meters for Android phones. In Poster presented at the Twelfth Symposium on Usable Security and Privacy, SOUPS’16.
- [21] I. Jermyn, A. Mayer, F. Monrose, M. K. Reiter, and A. D. Rubin. The design and analysis of graphical passwords. In Proceedings of the 8th Conference on USENIX Security Symposium - Volume 8, SSYM’99, 1999.
- [22] P. G. Kelley, S. Komanduri, M. L. Mazurek, R. Shay, T. Vidas, L. Bauer, N. Christin, L. F. Cranor, and J. Lopez. Guess again (and again and again): Measuring password strength by simulating password-cracking algorithms. In Proceedigns of the IEE Symposium on Security and Privacy, SP’12, pages 523–537, 2012.
- [23] H. Kim and J. H. Huh. PIN selection policies: Are they really effective? Computers & Security, 31(4):484–496, 2012.
- [24] C. Kuo, S. Romanosky, and L. F. Cranor. Human selection of mnemonic phrase-based passwords. In Proceedings of the Second Symposium on Usable Privacy and Security, SOUPS ’06, pages 67–78, 2006.
- [25] D. Lin, P. Dunphy, P. Olivier, and J. Yan. Graphical passwords & qualitative spatial relations. In Proceedings of the 3rd symposium on Usable privacy and security, pages 161–162. ACM, 2007.
- [26] M. Loge, M. Duermuth, and L. Rostad. On user choice for Android unlock patterns. In 1st European Workshop on Usable Security, 2016.
- [27] J. L. Massey. Guessing and entropy. In Proc. 1994 IEEE International Symposium on Information Theory, 1994.
- [28] M. L. Mazurek, S. Komanduri, T. Vidas, L. Bauer, N. Christin, L. F. Cranor, P. G. Kelley, R. Shay, and B. Ur. Measuring password guessability for an entire university. In Proceedings of the 2013 ACM SIGSAC Conference on Computer & communications security, CCS’13, pages 173–186, 2013.
- [29] R. Morris and K. Thompson. Password security: A case history. Communications of the ACM, 22(11):594–597, 1979.
- [30] F. Schaub, R. Deyhle, and M. Weber. Password entry usability and shoulder surfing susceptibility on different smartphone platforms. In Proceedings of the 11th International Conference on Mobile and Ubiquitous Multimedia, MUM ’12, 2012.
- [31] R. Shay, P. G. Kelley, S. Komanduri, M. L. Mazurek, B. Ur, T. Vidas, L. Bauer, N. Christin, and L. F. Cranor. Correct horse battery staple: Exploring the usability of system-assigned passphrases. In Proceedings of the eighth symposium on usable privacy and security, SOUPS ’12, page 7, 2012.
- [32] H. Siadati, P. Gupta, S. Smith, N. Memon, and M. Ahamad. Fortifying Android patterns using persuasive security framework. In Proceedings of the nineth International Conference on Mobile Ubiquitous Computing, UBICOMM’15, pages 68–75, 2015.
- [33] Y. Song, G. Cho, S. Oh, H. Kim, and J. H. Huh. On the effectiveness of pattern lock strength meters: Measuring the strength of real world pattern locks. In Proceedings of the 33rd Annual ACM Conference on Human Factors in Computing Systems, CHI ’15, 2015.
- [34] C. Sun, Y. Wang, and J. Zheng. Dissecting pattern unlock: The effect of pattern strength meter on pattern selection. Journal of Information Security and Applications, 19(4):308–320, 2014.
- [35] H. Tao and C. Adams. Pass-go: A proposal to improve the usability of graphical passwords. International journal of Network Security, 7 (2):273–292, 2008.
- [36] H. Tupsamudre, V. Banahatti, S. Lodha, and K. Vyas. Pass-o: A proposal to improve the security of pattern unlock scheme. In Proceedings of the 2017 ACM on Asia Conference on Computer and Communications Security (ASIACCS 17), pages 400–407. ACM, 2017.
- [37] S. Uellenbeck, M. Dürmuth, C. Wolf, and T. Holz. Quantifying the security of graphical passwords: the case of Android unlock patterns. In Proceedings of the 2013 ACM SIGSAC conference on Computer & communications security, pages 161–172. ACM, 2013.
- [38] B. Ur, J. Bees, S. M. Segreti, L. Bauer, N. Christin, L. F. Cranor, and A. Deepak. Do users’ perceptions of password security match reality? In Proceedings of the SIGCHI Conference on Human Factors in Computing Systems (CHI), 2016.
- [39] B. Ur, F. Noma, J. Bees, S. M. Segreti, R. Shay, L. Bauer, N. Christin, and L. F. Cranor. ”I added ’!’ at the end to make it secure”: Observing password creation in the lab. In Eleventh Symposium On Usable Privacy and Security (SOUPS 2015), pages 123–140, Ottawa, July 2015. USENIX Association.
- [40] D. Van Bruggen, S. Liu, M. Kajzer, A. Striegel, C. R. Crowell, and J. D’Arcy. Modifying smartphone user locking behavior. In Proceedings of the Ninth Symposium on Usable Privacy and Security, page 10, 2013.
- [41] C. Varenhorst, M. Kleek, and L. Rudolph. Passdoodles: A lightweight authentication method. Research Science Institute, 2004.
- [42] E. Von Zezschwitz, A. De Luca, P. Janssen, and H. Hussmann. Easy to draw, but hard to trace?: On the observability of grid-based (un) lock patterns. In Proceedings of the 33rd Annual ACM Conference on Human Factors in Computing Systems, pages 2339–2342. ACM, 2015.
- [43] E. von Zezschwitz, P. Dunphy, and A. De Luca. Patterns in the wild: A field study of the usability of pattern and PIN-based authentication on mobile devices. In Proceedings of the 15th International Conference on Human-computer Interaction with Mobile Devices and Services, MobileHCI ’13, pages 261–270, 2013.
- [44] E. von Zezschwitz, M. Eiband, D. Buschek, S. Oberhuber, A. De Luca, F. Alt, and H. Hussmann. On quantifying the effective passsword space of grid-based unlock gestures. In Proceedings of the International Conference on Mobile and Ubiquitous Multimedia, MUM’16, 2016.
- [45] R. Wash, E. Rader, R. Berman, and Z. Wellmer. Understanding password choices: How frequently entered passwords are re-used across websites. In Twelfth Symposium on Usable Privacy and Security (SOUPS), SOUPS’16, 2016.
- [46] R. Weiss and A. De Luca. Passshapes: Utilizing stroke based authentication to increase password memorability. In Proceedings of the 5th Nordic Conference on Human-computer Interaction: Building Bridges, NordiCHI ’08, pages 383–392, 2008.
- [47] S. Wiedenbeck, J. Waters, J.-C. Birget, A. Brodskiy, and N. Memon. Passpoints: Design and longitudinal evaluation of a graphical password system. Int. J. Hum.-Comput. Stud., 63(1-2):102–127, July 2005.
- [48] G. Ye, Z. Tang, D. Fang, X. Chen, K. I. Kim, B. Taylor, and Z. Wang. Cracking Android pattern lock in five attempts. In The Network and Distributed System Security Symposium, NDSS ’17, 2017.