A combined network and machine learning approaches for product market forecasting
Abstract
Sustainable financial markets play an important role in the functioning of human society. Still, the detection and prediction of risk in financial markets remain challenging and draw much attention from the scientific community. Here we develop a new approach based on combined network theory and machine learning to study the structure and operations of financial product markets. Our network links are based on the similarity of firms’ products and are constructed using the Securities Exchange Commission (SEC) filings of US listed firms. We find that several features in our network can serve as good precursors of financial market risks. We then combine the network topology and machine learning methods to predict both successful and failed firms. We find that the forecasts made using our method are much better than other well-known regression techniques. The framework presented here not only facilitates the prediction of financial markets but also provides insight and demonstrate the power of combining network theory and machine learning.
I INTRODUCTION
Network science has been used to predict many natural and technological phenomena. Examples include, the evolution of a scientist’s impact sinatra_quantifying_2016 , forecast disease epidemics eubank_modelling_2004 ; colizza2006role ; brockmann_hidden_2013 , predict the spatial development of urban areas li_simple_2017 and forecast climate extreme events ludescher_very_2014 ; boers_prediction_2014 ; meng_percolation_2017 ; meng_forecasting_2018 . Network approach demonstrated its potential as a useful tool in the study of real world systems, such as, physics, biology, and social systems newman2010networks ; cohen2010complex ; zhao_inducing_2013 . Recently, a network approach has been applied to describe the instability in financial systems bardoscia_pathways_2017 , and to study the relationship between the structure of the financial network and the likelihood of systemic failures due to contagion of risk miura_effect_2012 ; acemoglu_systemic_2015 .
In the present study, we use text-based analysis of SEC Form 10-K product descriptions to construct the network of product similarity between firms. The firms are regarded as network nodes, and the level of similarity between the product descriptions of different firms represents the network links (strength). The 10-K product descriptions are obtained from the Securities Exchange Commission (SEC) Edgar website (https://www.sec.gov/). We then analyze the topological structure of the network, and determined how measures such as, clustering coefficient correlate with membership in the Standard & Poor’s 500 (S&P 500). Furthermore, we also analysed the -shell structure of the network carmi_model_2007 ; kitsak_identification_2010 and find that it reveals that firms in more outer shells have higher risk to collapse (or merge). Furthermore, we combine the network structure and machine learning methods to predict both the successful and collapsed firms. We find that the forecasting rates by using our combined method are significantly higher than random guessing and other methods breiman_random_2001 .
II Data
II.1 Product Similarity Data
In this study, we use text-based analysis of 10-K product descriptions to obtain the product similarity between firms, representing the links. For any two firms and , we have a product similarity, which is a real value in the interval [0,1] describing the similarity of words used by firms and in their 10-K forms. To compute the “product similarity” between two firms using the basic cosine similarity method hoberg_product_2010 ; Hoberg2016jpe , We first build the database for each year by taking the list of unique words used in all product descriptions in that year. We then take the text from each firm’s product description and construct a binary -vector summarizing its word usage. A given element of this -vector is 1 if the given dictionary word is used in firm ’s product description. For each firm , we denote this binary -vector as . We define the normalized vector as,
| (1) |
To measure the similarity of products of firms and , we compute the dot product of their normalized vectors, which is then the basic cosine similarity:
| (2) |
In this study, we use 18 years (from 1996 to 2013) of data. For a more detailed description see Ref. hoberg_product_2010 .
II.2 External Financial Data
Apart from the product similarity data, we also compile some external information to construct financial variables. We download the daily closing price of the S&P 500 index from the Center for Research in Security Prices (CRSP) (http://www.crsp.com/). This time-series can be used to measure the overall market dynamics. Several firm-specific variables are also taken to control the range of observed firm traits. Specifically, firm size is assumed to be the total market capitalization following as suggested in Ref. fama1992cross ; the book-to-market ratio is the book value of equity over the market value of equity and measures a firm’s growth opportunities; leverage is a measure of capital structure defined by the ratio of long-term debt and other debt (current liabilities) to the sum of long-term debt, debt in current liabilities, and stockholders’ equity; profitability is defined as income before extraordinary items over lagged total assets; prior year return is the return of the stock in the past year; investment is the year-over-year percent growth in total assets following cooper2008asset ; liquidity is a measure of firm liquidity found using reference amihud2002illiquidity ; and the Altman Z-score is a measure of default risk according to reference altman1968financial . The data can be downloaded from the Compustat database (http://www.compustat.com).
III Methods
III.1 Product Similarity Network
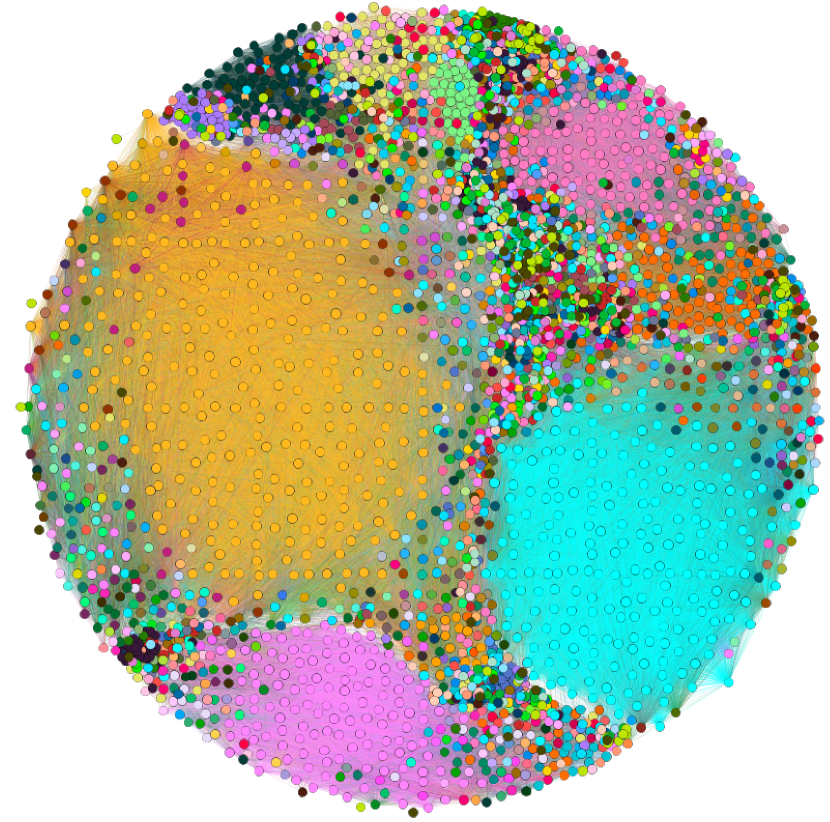
For each year, we construct a weighted undirected network based on the product similarity data where each firm or company is a node and the links have a given strength, , representing the level of similarity between pairs of nodes. The links are thresholding such that only links with a weight greater than significant value are kept in the network. Here, we only consider the similarity values that are above . This threshold is calculated based on the coarseness of the three-Digit Standard Industrial Classification (SIC). The level of coarseness thus matches that of three digit SIC codes, as both classifications result in the same number of firm pairs being deemed related hoberg_product_2010 . We present a specific product similarity network for the year 2012 in Fig. 1.
III.2 Network topology measures for machine learning
Multiple network topological measures have been used to predict the future gain of companies, as well as the probability of their collapse. The general approach is based on methods described in Rosen et. al rosen_topological_2016 and Naaman et. al naaman_edge_nodate . In brief, a vector representing a set of topological features has been computed for each node, and this vector was then used in a machine learning framework as decribed below. The following features were used for the topological network attribute vector (NAV):
-
•
Degree (number of neighbors).
-
•
Betweenness Centrality everett_centrality_1999 . Betweenness is a centrality measure of a node (or a link). It is defined as the number of shortest paths between all vertex pairs that pass through the node.
-
•
Closeness Centrality sabidussi_centrality_1966 . Closeness is a centrality measure of a node (or a link) defined as the average length of the shortest path between the vertex and all other vertices in the graph.
-
•
Distance distribution moments. We compute the distribution of distances from each node to all other nodes using a Dijkstra’s algorithm dijkstra_note_1959 , and then take the first and second moments of this distribution.
-
•
Flow rosen_directionality_2014 . We define the flow a node as the ratio between the directed and undirected distances between this node and all other nodes.
-
•
Network motifs milo_network_2002 . Network motifs are patterns of small connected sub-graphs. We use an extension of the Itzchack algorithm itzhack_optimal_2007 to calculate motifs. For each node, we compute the frequency of each motif in which this node participates. Note that the above algorithm is an extension of the concept to undirected graphs.
-
•
-core batagelj_fast_2011 . The -core of a network is a maximal subgraph that contains only vertices with degree or more. Equivalently, it is the subgraph of formed by recursively deleting all nodes of degree less than .
III.3 Machine learning
We computed for each node an NAV as described above. All nodes within a given year were then split into a training set composed of % of nodes and a test set composed of the remaining %. Each node was also associated with two binary valued tags representing whether the company collapsed in the following year and if it was within the top % of returns in the following year. The values of the tags were then learned using either a Random Forest (RF) ho_random_1995 classifier and a neural network with two internal layers. The Random Forest was trained with trees and a balanced loss matrix, where the error cost was inversely proportional to the training fraction of the appropriate tag (0 or 1). The trees were limited to samples per leave. All other parameters were the default parameters of the Matlab Treebagger. The neural network had a rectified linear unit (ReLU) activation functions and a cross entropy loss function. The solver used was an ADAM optimizer kingma_adam:_2014 . L2 regularization has been also applied. All other parameters were as in the default of the Keras python library: https://keras.io.
IV Results
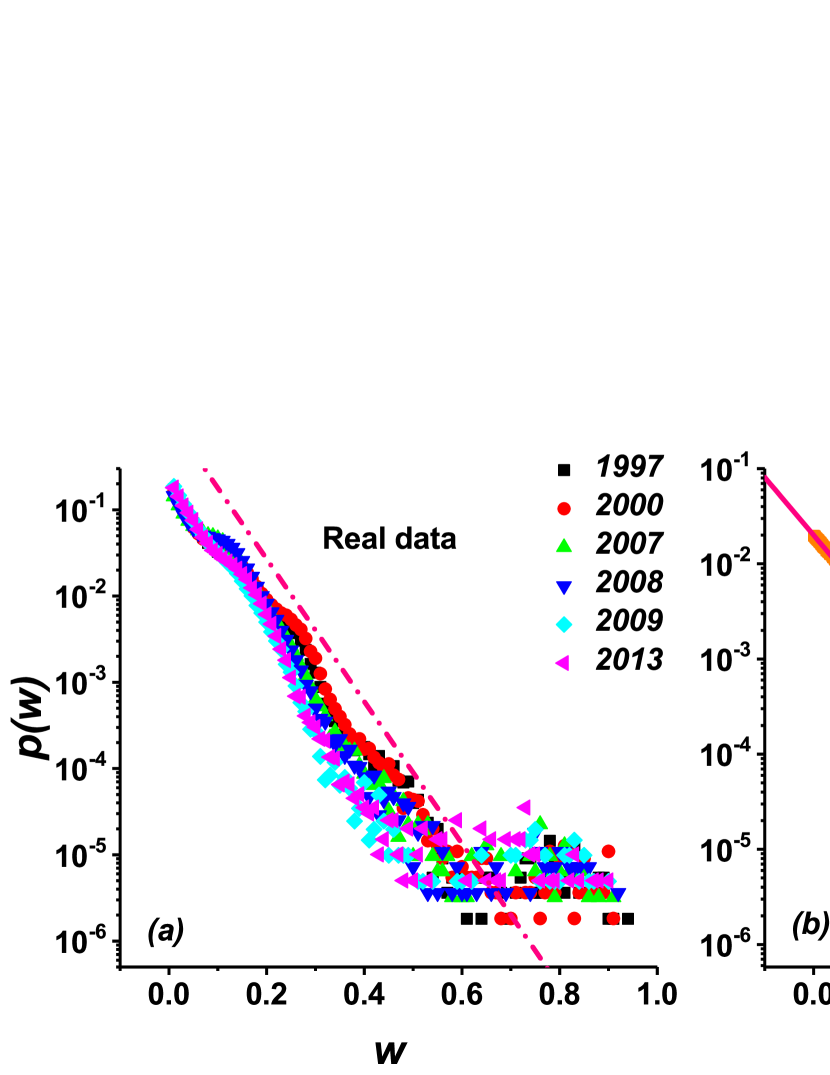
We first consider the probability density function (PDF) of links’ strength, , for each network (year). The results for six specific years are shown in Fig. 2 (a). We find that is robust and approximately follows an exponential distribution. The values of product similarity can reflect the product market synergies and competition of mergers and acquisitions hoberg_product_2010 , i.e., higher may mean the two firms are highly competitive or in cooperative relations. To better understand and explain the exponential distribution, we develop a competitive-cooperative model. For each node (firm) , we set a score , which follows a general mathematical function . We define the weight/strength relation between nodes and as,
| (3) |
where is the absolute difference between and , i.e., high values indicating a large difference or low similarity. is a constant used to guarantee that is between . If we assume that follows an uniform random distribution, we can show in our model that follows an exponential distribution (see more details in SI SI ). Indeed, Fig. 2(b) shows our Monte Carlo simulations and theoretical results of the model, where we find that agrees well with the real data. It suggests that our competitive-cooperative model can be used to accurately simulate/describe the real product similarity network.
Next, we consider two basic parameters to reveal the structure of the network: the weighted degree and clustering coefficient watts_collective_1998 . The weighted degree for node is defined as,
| (4) |
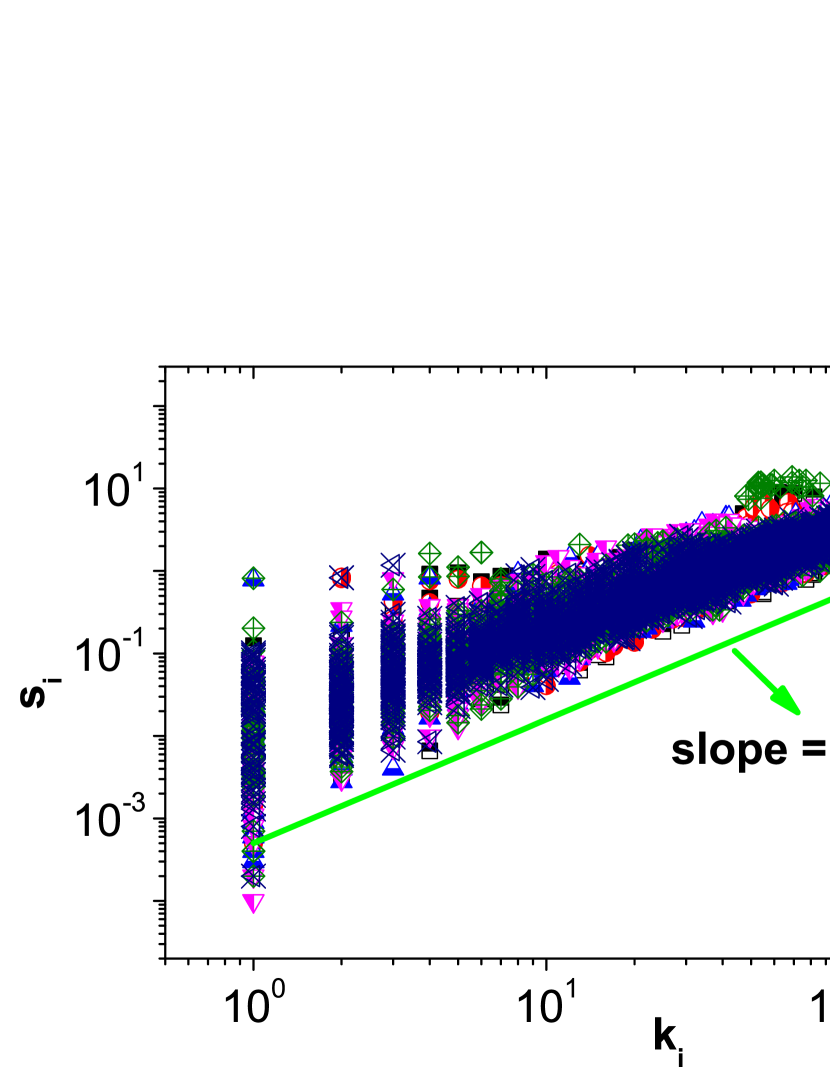
where is the adjacency matrix and quantifies the strength of node in terms of the total weight of its connections. In the case of the product similarity networks, it reflects the importance or impact of a firm in the network. We find, see Fig. S1, that the strength of nodes with degree increases with as,
| (5) |
We find that the power-law fit for the real data gives an exponent . This value implies that the strength of nodes grows faster than their degree, i.e., the weight of edges belonging to highly connected nodes tends to have a higher value. We notice that the universal power–law relationship is also observed in other real networks, e.g., the world-wide airport network, even with the same value of barrat_architecture_2004 .
For weighted networks, the clustering coefficient for node is defined as the geometric average of the subgraph edge weights saramaki_generalizations_2007 ,
| (6) |
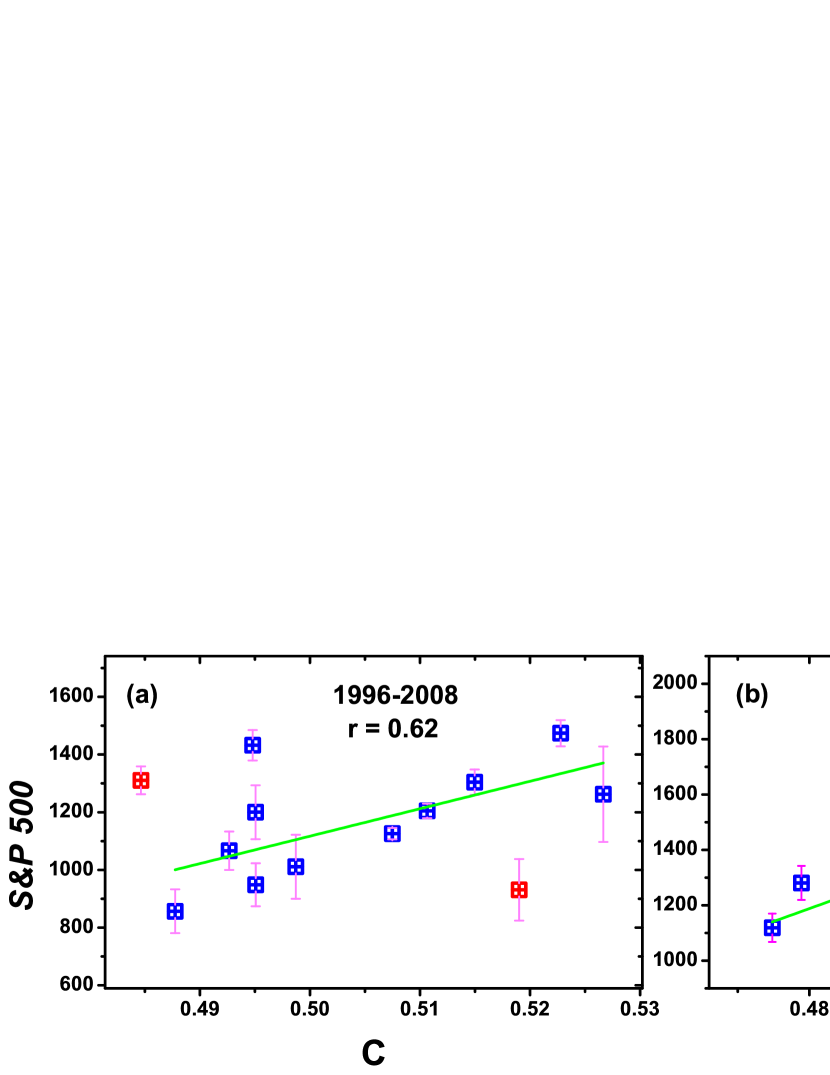
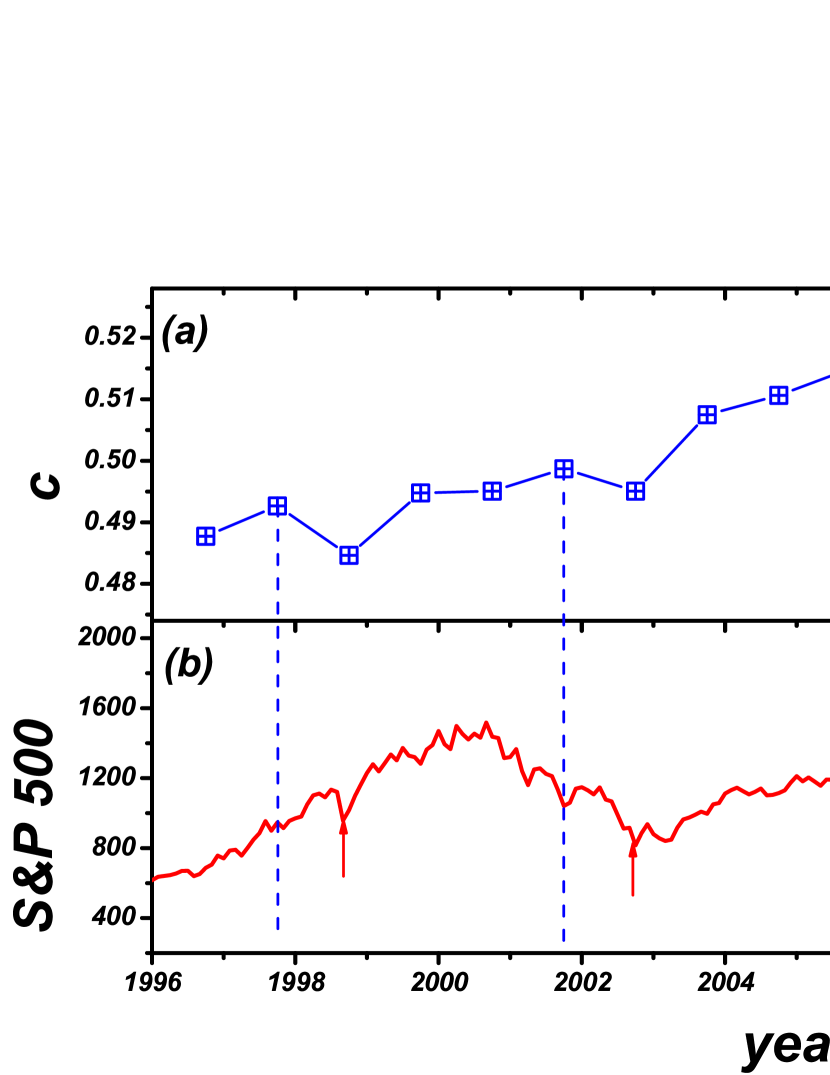
where the edge weight is normalized by the maximum weight in the network, . The average clustering coefficient is , representing the presence of triplets in the network. Fig. 3 (a) shows the dynamical evolution of with time (years), Fig. 3 (b) shows the S&P 500 Index. We find that the behavior of (1 year ahead) and the S&P 500 Index is highly correlated (see Fig. S2). In particular, we can see 3 local maxima (labeled by dashed blue lines) and 3 local minima S&P 500 (labeled by red lines with arrows), which stands for three financial crisis: the 1997-1998 Asian Financial Crisis, the 2002 dotcom bubble and the 2008 global financial crisis. The maxima values are always one year before the minima. This suggests that our network index might be able to help in forecasting the following year’s stock market returns.
Given the relation between the evolved topology of the network of market, we tested whether the network contains enough information to predict at the single node level whether the company represented by this node will collapse or make exceptional gains in the following year. We define the systemic risk as the disappeared firms (bankrupt or mergers and acquisitions) in the next year and the systemic return as the firms with the highest stock-market return ratio in the next year (we choose here the top of firms). Note that merger and bankrupt are obviously different. However, most such events are bankruptcy and merger events. Thus, the events can be approximated as bankruptcy.
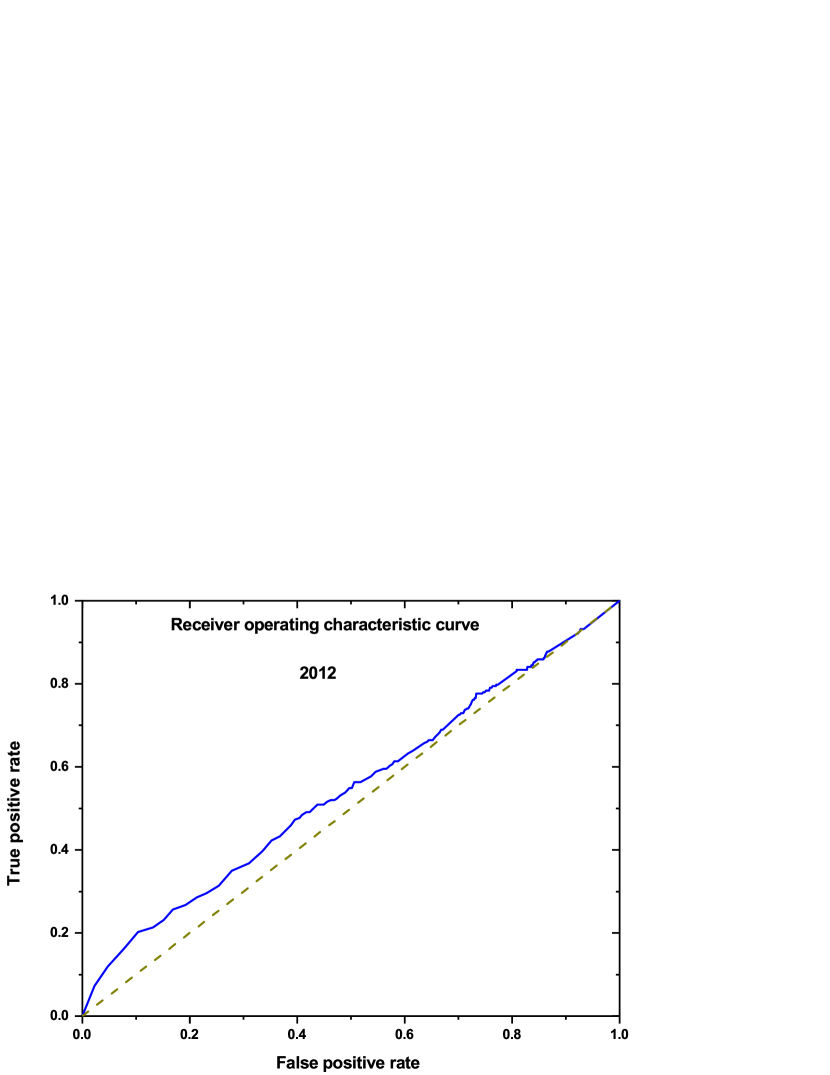
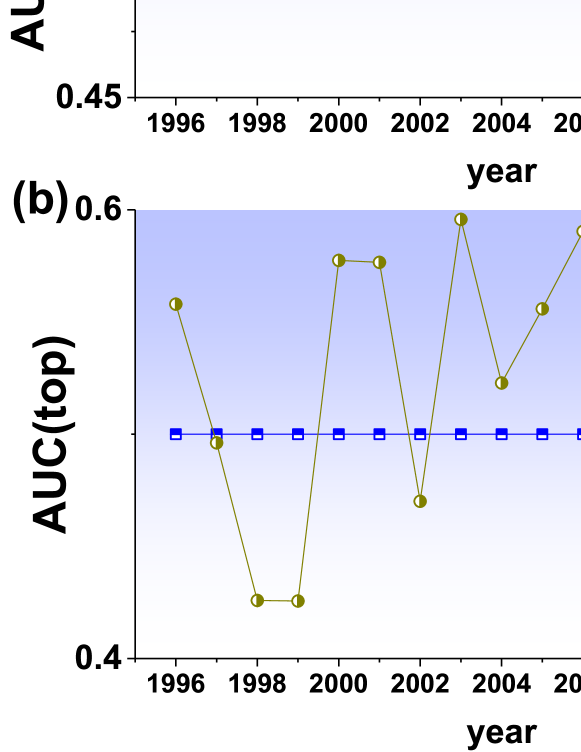
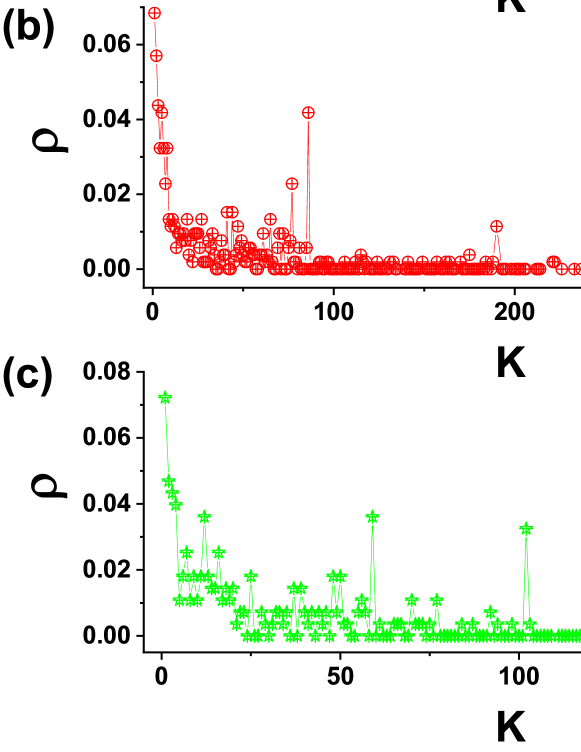
To further show that network topology matters, we next analyze the -shell structure of the network and find that the -shell method is quite useful for predicting well above random, the disappeared firms. We present the receiver operating characteristic curve (ROC) using the -shell method for predicting the disappeared firms of the 2012 network in Figs. S3. The area under the ROC curve (AUC) is significantly higher than the random case for all years (shown in Fig. S4). In particular, firms in the lower shells have higher market risk ratio. A possible reason is that the nodes in lower shells in the network are very fragile with higher risk. We present the scatter plot of risk ratio, (the ratio of disappeared firms at each shell), as a function of -shell, see Fig. S5 for three specific years, 1996, 2003 and 2012. Our results reveal that firms in more outer shells have higher risk to collapse.
Next a combined topological approach was tested to predict the same tags (collapsed or top) using a large set of topological measures and a Random Forest classifier. The combined features approach rosen_topological_2016 significantly outperformed the -Core based classification ( Fig. 4). For both collapsed and top companies, we find that the topological information of our network provides significantly better predictions than the random case (the AUC is shown in Fig. 4 upper and middle plots) for all 17 years. We also compared the AUC of machine learning using the network topology to the logistic regression based on the standard financial measures (non-network information): firm size, book-to-market ratio, leverage, profitability, prior year return, investment, liquidity, and Altman Z-score. The results are shown in Fig. 4 upper and middle plots.
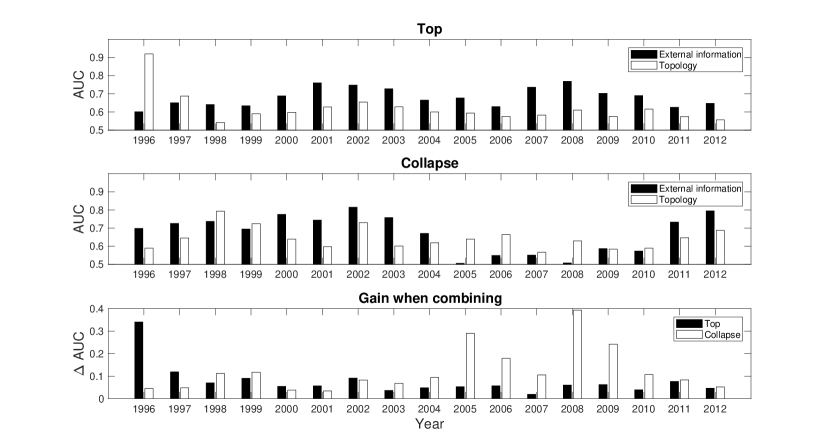
The topological classifier is approximately of equal quality and often outperforms the logistic regression methods (Fig. 4 upper and middle plots). Moreover when topological features are combined with the external features, the precision accuracy of RF method is significantly higher in almost all years and in both categories (see gain AUC in Fig. 4 bottom plot). This highly suggests that the network topological information plays a prominent role in the prediction of future collapsed and top companies, it can be complementary to the traditional logistic regression methods.
V SUMMARY
In summary, we developed a combined network and machine learning algorithm to predict both collapsed and top companies in the financial market. Our network is based on the 10-K product similarities. We find that multiple topological measures inherent in our networks can serve as good precursors for machine learning approach (Random Forest). The forecasting rates using our method are often higher than using well-known logistic regression techniques. Moreover, when combining the external features and network topological measures, we find that the accuracy of the machine learning is significantly higher in almost all years and in both categories (collapsed and top gain). The proposed method and analysis can provide a new perspective for prediction of individual companies in the financial product markets and can potentially be used as a template to study other financial systems.
Acknowledgements
We acknowledge the Italy-Israel project OPERA, the Israel-Italian collaborative project NECST, the Israel Science Foundation, ONR, Japan Science Foundation, BSF-NSF, and DTRA (Grant no. HDTRA-1-10-1-0014), EPICC for financial support. PIK is a Member of the Leibniz Association.
References
- (1) Sinatra, R., Wang, D., Deville, P., Song, C. & Barabási, A.-L. Quantifying the evolution of individual scientific impact. Science 354, 5239 (2016). URL http://science.sciencemag.org/content/354/6312/aaf5239.
- (2) Eubank, S. et al. Modelling disease outbreaks in realistic urban social networks. Nature 429, 180 (2004). URL https://www.nature.com/articles/nature02541.
- (3) Colizza, V., Barrat, A., Barthélemy, M. & Vespignani, A. The role of the airline transportation network in the prediction and predictability of global epidemics. Proceedings of the National Academy of Sciences of the United States of America 103, 2015–2020 (2006).
- (4) Brockmann, D. & Helbing, D. The Hidden Geometry of Complex, Network-Driven Contagion Phenomena. Science 342, 1337–1342 (2013). URL http://science.sciencemag.org/content/342/6164/1337.
- (5) Li, R. et al. Simple spatial scaling rules behind complex cities. Nature Communications 8, 1841 (2017). URL https://www.nature.com/articles/s41467-017-01882-w.
- (6) Ludescher, J. et al. Very early warning of next el nino. Proceedings of the National Academy of Sciences 111, 2064–2066 (2014). URL http://www.pnas.org/content/111/6/2064.
- (7) Boers, N. et al. Prediction of extreme floods in the eastern Central Andes based on a complex networks approach. Nature Communications 5, 5199 (2014). URL http://www.nature.com/doifinder/10.1038/ncomms6199.
- (8) Meng, J., Fan, J., Ashkenazy, Y. & Havlin, S. Percolation framework to describe El Nino conditions. Chaos: An Interdisciplinary Journal of Nonlinear Science 27, 035807 (2017). URL http://aip.scitation.org/doi/abs/10.1063/1.4975766.
- (9) Meng, J., Fan, J., Ashkenazy, Y., Bunde, A. & Havlin, S. Forecasting the magnitude and onset of El Niño based on climate network. New Journal of Physics 20, 043036 (2018). URL http://stacks.iop.org/1367-2630/20/i=4/a=043036.
- (10) Newman, M. Networks: an introduction (Oxford university press, 2010).
- (11) Cohen, R. & Havlin, S. Complex networks: structure, robustness and function (Cambridge university press, 2010).
- (12) Zhao, J.-H., Zhou, H.-J. & Liu, Y.-Y. Inducing effect on the percolation transition in complex networks. Nature Communications 4, 2412 (2013). URL http://www.nature.com/ncomms/2013/130909/ncomms3412/full/ncomms3412.html.
- (13) Bardoscia, M., Battiston, S., Caccioli, F. & Caldarelli, G. Pathways towards instability in financial networks. Nature Communications 8, 14416 (2017). URL https://www.nature.com/articles/ncomms14416.
- (14) Miura, W., Takayasu, H. & Takayasu, M. Effect of Coagulation of Nodes in an Evolving Complex Network. Physical Review Letters 108, 168701 (2012). URL https://link.aps.org/doi/10.1103/PhysRevLett.108.168701.
- (15) Acemoglu, D., Ozdaglar, A. & Tahbaz-Salehi, A. Systemic Risk and Stability in Financial Networks. American Economic Review 105, 564–608 (2015). URL https://www.aeaweb.org/articles?id=10.1257/aer.20130456.
- (16) Carmi, S., Havlin, S., Kirkpatrick, S., Shavitt, Y. & Shir, E. A model of Internet topology using k-shell decomposition. Proceedings of the National Academy of Sciences 104, 11150–11154 (2007). URL http://www.pnas.org/content/104/27/11150.
- (17) Kitsak, M. et al. Identification of influential spreaders in complex networks. Nature Physics 6, 888–893 (2010). URL http://www.nature.com/nphys/journal/v6/n11/full/nphys1746.html.
- (18) Breiman, L. Random Forests. Machine Learning 45, 5–32 (2001). URL https://doi.org/10.1023/A:1010933404324.
- (19) Hoberg, G. & Phillips, G. Product Market Synergies and Competition in Mergers and Acquisitions: A Text-Based Analysis. Review of Financial Studies 23, 3773–3811 (2010). URL http://rfs.oxfordjournals.org/content/23/10/3773.
- (20) Hoberg, G. & Phillips, G. Text-based network industries and endogenous product differentiation. Journal of Political Economy 124, 1423–1465 (2016). URL https://doi.org/10.1086/688176. eprint https://doi.org/10.1086/688176.
- (21) Fama, E. F. & French, K. R. The cross-section of expected stock returns. the Journal of Finance 47, 427–465 (1992).
- (22) Cooper, M. J., Gulen, H. & Schill, M. J. Asset growth and the cross-section of stock returns. The Journal of Finance 63, 1609–1651 (2008).
- (23) Amihud, Y. Illiquidity and stock returns: cross-section and time-series effects. Journal of financial markets 5, 31–56 (2002).
- (24) Altman, E. I. Financial ratios, discriminant analysis and the prediction of corporate bankruptcy. The journal of finance 23, 589–609 (1968).
- (25) Rosen, Y. & Louzoun, Y. Topological similarity as a proxy to content similarity. Journal of Complex Networks 4, 38–60 (2016). URL https://academic.oup.com/comnet/article/4/1/38/2366087.
- (26) Naaman, R., Cohen, K. & Louzoun, Y. Edge sign prediction based on a combination of network structural topology and sign propagation. Journal of Complex Networks URL https://academic.oup.com/comnet/advance-article/doi/10.1093/comnet/cny012/4999727.
- (27) Everett, M. G. & Borgatti, S. P. The centrality of groups and classes. The Journal of Mathematical Sociology 23, 181–201 (1999). URL https://doi.org/10.1080/0022250X.1999.9990219.
- (28) Sabidussi, G. The centrality index of a graph. Psychometrika 31, 581–603 (1966). URL https://doi.org/10.1007/BF02289527.
- (29) Dijkstra, E. W. A Note on Two Problems in Connexion with Graphs. Numer. Math. 1, 269–271 (1959). URL http://dx.doi.org/10.1007/BF01386390.
- (30) Rosen, Y. & Louzoun, Y. Directionality of real world networks as predicted by path length in directed and undirected graphs. Physica A: Statistical Mechanics and its Applications 401, 118–129 (2014). URL http://www.sciencedirect.com/science/article/pii/S0378437114000090.
- (31) Milo, R. et al. Network Motifs: Simple Building Blocks of Complex Networks. Science 298, 824–827 (2002). URL http://science.sciencemag.org/content/298/5594/824.
- (32) Itzhack, R., Mogilevski, Y. & Louzoun, Y. An optimal algorithm for counting network motifs. Physica A: Statistical Mechanics and its Applications 381, 482–490 (2007). URL http://www.sciencedirect.com/science/article/pii/S0378437107002257.
- (33) Batagelj, V. & Zaveršnik, M. Fast algorithms for determining (generalized) core groups in social networks. Advances in Data Analysis and Classification 5, 129–145 (2011). URL https://doi.org/10.1007/s11634-010-0079-y.
- (34) Ho, T. K. Random decision forests. In Proceedings of 3rd International Conference on Document Analysis and Recognition, vol. 1, 278–282 vol.1 (1995).
- (35) Kingma, D. P. & Ba, J. Adam: A Method for Stochastic Optimization. arXiv:1412.6980 [cs] (2014). URL http://arxiv.org/abs/1412.6980. ArXiv: 1412.6980.
- (36) Supplementary materials .
- (37) Watts, D. J. & Strogatz, S. H. Collective dynamics of ‘small-world’ networks. Nature 393, 440–442 (1998). URL http://www.nature.com/nature/journal/v393/n6684/full/393440a0.html.
- (38) Barrat, A., Barthélemy, M., Pastor-Satorras, R. & Vespignani, A. The architecture of complex weighted networks. Proceedings of the National Academy of Sciences of the United States of America 101, 3747–3752 (2004). URL http://www.pnas.org/content/101/11/3747.
- (39) Saramäki, J., Kivelä, M., Onnela, J.-P., Kaski, K. & Kertész, J. Generalizations of the clustering coefficient to weighted complex networks. Physical Review E 75, 027105 (2007). URL https://link.aps.org/doi/10.1103/PhysRevE.75.027105.
Supplemental Materials: A network and machine learning approach to product market forecasting
Jingfang Fan, Keren Cohen, Louis M. Shekhtman, Sibo Liu, Jun Meng, Yoram Louzoun, and Shlomo Havlin
Appendix A Further results
We present here further results not shown in the main text.
We first prove that the PDF of [see, Eq. LABEL:eq4] follows an exponential distribution by using a convolution method. We assume to be the full density function of , and let be the full density function of . Here, we assume that and are uniform random distributions. Then, for case 1, ,
This integral is zero unless , implying , since , therefore,
For case 2, ,
this integral is zero unless , implying , since . Thus,
From Eq. LABEL:eq3 and LABEL:eq5 we obtain that the probability distribution functions of link weights in our model follows an exponential distribution.