Fermi surface properties of the bifunctional organic metal -(BETS)2Mn[N(CN)2]3 near the metal–insulator transition
Abstract
We present detailed studies of the high-field magnetoresistance of the layered organic metal -(BETS)2Mn[N(CN)2]3 under a pressure slightly above the insulator-metal transition. The experimental data are analysed in terms of the Fermi surface properties and compared with the results of first-principles band structure calculations. The calculated size and shape of the inplane Fermi surface are in very good agreement with those derived from Shubnikov-de Haas oscillations as well as the classical angle-dependent magnetoresistance oscillations. A comparison of the experimentally obtained effective cyclotron masses with the calculated band masses reveals electron correlations significantly dependent on the electron momentum. The momentum- or band-dependent mobility is also reflected in the behavior of the classical magnetoresistance anisotropy in a magnetic field parallel to layers. Other characteristics of the conducting system related to interlayer charge transfer and scattering mechanisms are discussed based on the experimental data. Besides the known high-field effects associated with the Fermi surface geometry, new pronounced features have been found in the angle-dependent magnetoresistance, which might be caused by coupling of the metallic charge transport to a magnetic instability in proximity to the metal-insulator phase boundary.
I Introduction
The organic charge transfer salt -(BETS)2Mn[N(CN)2]3, where BETS stands for bis(ethylenedithio)tetraselenafulvalene, belongs to the family of hybrid molecular conductors which can be seen as natural multilayer structures of conducting and magnetic layers alternating on a subnanometer scale Kobayashi et al. (2004); Coronado and Day (2004); Ouahab (2012). While itinerant electrons in the BETS donor layers are responsible for metallic conduction, the magnetic moment is mainly determined by localized -electron spins of Mn2+ ions in the insulating anion layers Kushch et al. (2008). On the other hand, the quasi-two-dimensional (quasi-2D) conducting system undergoes a metal-insulator transition at K presumably associated with the Mott instability Kushch et al. (2008); Zverev et al. (2010). The insulating ground state is suppressed by a quasi-hydrostatic pressure of about 1 kbar, giving way to a metallic and even superconducting state with K. However, the shape of the “pressure–temperature” phase diagram of this compound Zverev et al. (2010) significantly differs from that of archetypical organic Mott insulators -(BEDT-TTF)2X with anions X- = {Cu[N(CN)2]Cl}- and {Cu2(CN)3}- Lefebvre et al. (2000); Kagawa et al. (2004); Kurosaki et al. (2005). A reason for that may lie in the interaction between the conduction -electrons and localized -electron spins. The - exchange coupling is known to be at the core of the metal-insulator transition of another hybrid organic salt -(BETS)2FeCl4 Brossard et al. (1998); Cépas et al. (2002). Moreover, in some BETS salts with Fe-cointaining tetrahedral anions the - coupling is clearly manifest already in the metallic state, playing, for example, a crucial role in stabilizing superconductivity in a magnetic field Kobayashi et al. (2004); Uji et al. (2001a, 2003); Fujiwara et al. (2002); Konoike et al. (2004); Kartsovnik et al. (2016). In the present material this coupling seems to be considerably weaker. It has been found to cause changes of magnetic properties of the Mn2+ subsystem upon entering the insulating state Vyaselev et al. (2011, 2012, 2017). However, no evidence of its influence on the conducting system has been reported so far.
For a better understanding of the mechanisms of the insulating and superconducting instabilities a thorough knowledge of the Fermi surface properties is indispensable. To that end, we have carried out a detailed study of the high-field magnetoresistance of pressurized -(BETS)2Mn[N(CN)2]3 supplemented by first-principles band structure calculations. For most of the measurements the pressure value of kbar was chosen so as to drive the compound into the fully normal state, but not far away from the metal-insulator phase boundary Zverev et al. (2010). In fields above 12 T quantum (Shubnikov-de Haas, SdH) oscillations have been found, providing a direct access to the topology and size of the 2D Fermi surface. Further quantitative information on the size and shape of the Fermi surface has been obtained from the classical angle-dependent magnetoresistance oscillations (AMRO). Besides the detailed Fermi surface geometry, the SdH data and classical magnetoresistance yield other important characteristics of the conducting system such as effective cyclotron masses of the charge carriers, scattering parameters, and interlayer transfer energy. In particular, by confronting the effective mass values obtained from the experiment with the calculated band masses we find a quite strong, momentum-dependent renormalization effect caused by electron correlations in the proximity to the metal-insulator transition. Finally, in addition to the “conventional” phenomena determined by the geometry of the quasi-2D Fermi surface, the classical magnetoresistance has shown new features, which may be related to an interaction of the charge carriers with the magnetic subsystem.
The paper is organized as follows. In the next Section the experimental details are described. Section III presents the results of the first-principles band structure calculations. The predicted conducting bands and Fermi surface look similar to those obtained by the semi-empirical extended Hückel method. However, the density of states and relevant band cyclotron masses are 40% higher. This rather large difference, often found in the organics, see, e.g., Merino and McKenzie (2000), is important to take into account when estimating the strength of many-body renormalization effects on the experimentally determined mass. Section IV presents experimental data on the SdH oscillations and their analysis. In Sect. V the behavior of the classical component of the interlayer magnetoresistance as a function of the strength and orientation of magnetic field is considered. A summary and concluding remarks are given in Sect. VI.
II Experimental
The samples used in the experiments were electrochemically grown single crystals Kushch et al. (2008) with typical dimensions mm3, the largest dimensions being in the plane of conducting layers, that is, the crystallographic -plane. Electrical leads for four-probe resistance measurements were made by attaching annealed 20 m thick Pt wires to the sample surface using a conducting graphite paste. All the measurements were done in the interlayer resistance geometry, which is the most convenient and informative for layered organic conductors, see, e.g., Kartsovnik (2004) for a review. The resistance was measured by the standard low-frequency a.c. technique. Field-dependent magnetoresistance with the focus on the SdH oscillations was measured in the temperature interval 0.36 to 1.0 K at a current of 1 A assuring no overheating for sample resistance values k. Angle-dependent measurements were done in liquid 4He at K with a current of 10 A.
Quasihydrostatic pressure was applied using a BeCu clamp cell with silicon oil as a pressure medium. A calibrated manganin coil with a resistance of and sensitivity 0.243%/kbar was used as a resistive pressure gauge. All the measurements, except one run presented at the end of Sect. IV.2, were done at pressure kbar.
All the field sweeps and most of the angle-dependent magnetoresistance data presented in the paper were carried out in a 30 T resistive magnet at the LNCMI-Grenoble. 15 T angular sweeps shown in Sect. V.2 and some test measurements were done using a superconducting solenoid.
For the angle-dependent studies the samples were mounted on a two-axes rotating stage. Continuous rotations in different planes perpendicular to the plane of conducting layers were done at a fixed field strength. The sample orientation was defined by polar angle between the field direction and the normal to the layers and by azimuthal angle between the field projection on the layer plane and the crystallographic (inplane) -axis. The angular resolution was and for and , respectively. The initial orientation of the sample was set with an error bar of for both and . However, by using the center of the dip in the dependence as a reference point for the exact inplane field direction (), the error bar was reduced to .
Three high-quality samples were used in the experiments, all showing consistent data both on quantum oscillations and on the classical magnetoresistance. In what follows, we will present detailed data obtained on two different samples, respectively, from field sweeps in the orientation perpendicular to the layers and from the angular sweeps at a fixed field strength.
III First-principles calculation of the conduction bands
Calculations of the low-temperature band structure were carried out using a spin-polarized numerical atomic orbitals density functional theory (DFT) approach Hohenberg and Kohn (1964); *kohn65 in the generalized gradient approximation (GGA) Perdew et al. (1996). Only the valence electrons were considered in the calculations with the core being replaced by norm-conserving scalar relativistic pseudopotentials Troullier and Martins (1991) factorized in the Kleinman-Bylander form Kleinman and Bylander (1982). We have used a split-valence double- basis set including polarization orbitals with an energy shift of 10 meV for all atoms Artacho et al. (1999). The energy cutoff of the real space integration mesh was 350 Ry. The Brillouin zone was sampled using a grid of -points Monkhorst and Pack (1976) in the irreducible part of the Brillouin zone. The experimental crystal structure at 15 K Zverev et al. (2010) was used in the calculations. The calculated bands near the Fermi level are shown in Fig. 1.
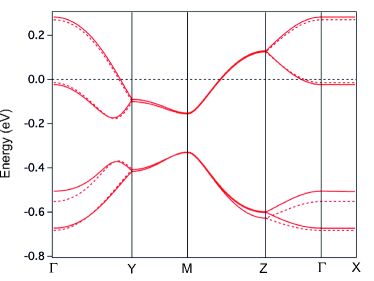
They contain only contributions from the highest occupied molecular orbitals of BETS and have shapes typical of strongly dimerized -salts of BEDT-TTF and BETS. The width of the bands crossing the Fermi level is 0.46 eV. This value is lower than that obtained by the extended Hückel method, 0.65 meV Zverev et al. (2010), as it is often found for organic charge transfer salts. As discussed below, the weaker dispersion leads to higher values of the density of states and cyclotron masses. On the other hand, comparing to the values eV obtained by first-principles calculations Kandpal et al. (2009); Xu et al. (1995); Ching et al. (1997); Jeschke et al. (2012) for -(BEDT-TTF)2X salts, exhibiting the Mott-insulating instability, the present value is very similar, just slightly higher. Along the interlayer direction ( – X) the dispersion is below the resolution of our calculations.
The calculated 2D Fermi surface is shown in Fig. 2. It is a cylinder crossing the Brillouin zone boundary along Z – M. As expected, it shares all features of the Fermi surface obtained by the extended Hückel method Zverev et al. (2010), in particular, the presence of a rhombus-like portion around point with quite flat (however, slightly more rounded near ) sides. The area of this rhombus-like part is of the Brillouin zone cross section.
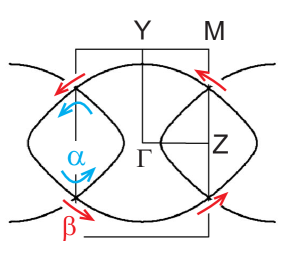
Due to the crystal symmetry, the calculated two upper bands in Fig. 1 are degenerate along Z – M, which causes crossing of the adjacent Fermi surfaces on the Brillouin zone boundary. It should be noted, however, that our DFT calculations do not take into account a statistical disorder of the dicyanamide groups of the anion along the crystallographic -axis Kushch et al. (2008). This disorder barely affects the electronic structure of the donor layer, however the associated random potential lifts the double degeneracy of the crystal orbitals along the Z – M boundary of the Brillouin zone. As a result, small gaps arise between the rhombus-like Fermi pocket and the open sheets extended along the Y – M direction. As will be shown in the next Section, the presence of the gaps is confirmed by magnetic quantum oscillations. The oscillations reveal a classical cyclotron orbit on the rhombus-like pocket (conventionally labeled as -orbit) and a large magnetic-breakdown orbit (-orbit) caused by tunneling through the gaps and encircling the entire Fermi surface, as illustrated in Fig. 2.
Shown in Fig. 3 is the density of states (DOS) calculated for two temperatures.
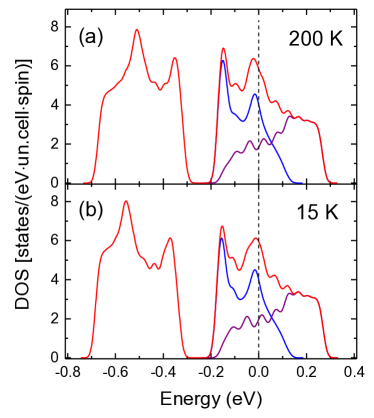
The blue curve is the contribution of the lower-lying partially filled band, which forms the rhombus-like portion of the FS, and the purple curve corresponds to the upper band associated with the open sheets extended along the Y–M direction. The total DOS is given in red. Interestingly, by contrast to other -type salts, the upper part of the DOS exhibits two pronounced peaks and the Fermi level occurs very near the top of one of them. Qualitatively the same result was obtained by the extended Hückel method Zverev et al. (2010) and attributed to a significant inplane anisotropy of the present salt: the coupling between chains of dimers, running along the crystallographic axis, is weaker than the intrachain interactions. This anisotropy causes a flattening of the lower partially filled band around point , near the Fermi level. The resulting peak in the DOS shifts even more close to the Fermi energy at decreasing temperature, as one can see from Fig. 3.
Knowing the DOS, one can evaluate the cyclotron mass on the Fermi surface. For a quasi-2D metal there is a simple relation between the two quantities Merino and McKenzie (2000):
| (1) |
where is the 2D DOS (per spin per unit cell) at the Fermi level, and Å and Å are the unit cell parameters in the plane of conducting layers Zverev et al. (2010). Substituting in Eq. (1) the calculated values eV-1 and eV-1 for the total DOS and for the contribution from the rhombus-like Fermi pocket, respectively, we obtain the cyclotron masses and , where is the free electron mass. These values are 1.4 times larger than the masses ( and , respectively) following from the extended Hückel calculations Zverev et al. (2010). However, the ratio is almost the same. Note that this ratio is higher than what one usually obtains, both theoretically and experimentally, for -salts Merino and McKenzie (2000); Kawamoto and Mori (2006). The reason for this obviously lies in the fact that the enhancement of the DOS at the Fermi level originates solely from the band responsible for the pocket.
IV Magnetic quantum oscillations

Figure 4 shows the general behavior of the interlayer resistance of pressurized -(BETS)2Mn[N(CN)2]3 at a temperature K, in a magnetic field perpendicular to layers. Besides superconductivity at very low fields, the magnetoresistance exhibits a few features which will be addressed in the following. We start with a detailed consideration of the Shubnikov-de Haas (SdH) oscillations observed at fields T.
IV.1 SdH spectrum and the Fermi surface topology
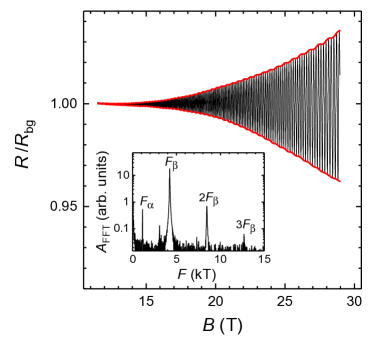
An example of the oscillatory part of magnetoresistance is presented in Fig. 5. It is dominated by rapid SdH oscillations; the fast Fourier transform (FFT) spectrum, shown in the inset, has a peak at a frequency T. The relevant cyclotron orbit in -space covers the area nm-2. This coincides, within an accuracy of , with the first Brillouin zone area calculated from the 15 K crystallographic data Zverev et al. (2010). In addition, weak slower oscillations can be resolved in the envelopes of the main oscillations (red lines in Fig. 5). The corresponding peak in the FFT spectrum is at T, revealing a cyclotron orbit area of nm-2 or of the Brillouin zone area. This agrees fairly well with the size of the rhombus-like part of the calculated 2D Fermi surface centered at point on the Brillouin zone boundary, see Fig. 2. The presence of this oscillatory component indicates that there is no band degeneracy at the zone boundary: the Fermi surface consists of a pair of open sheets and a cylinder separated from each other by a small gap. The slow oscillations originate from the classical orbit on the Fermi cylinder indicated by the blue arrows in Fig. 2, whereas the fast oscillations are a result of magnetic breakdown (MB) through the gaps (red arrows in Fig. 2).
While not predicted by band structure calculations, a small MB gap between the open sheets and cylindrical Fermi surface has also been found in SdH experiments on several other -type salts of BETS and BEDT-TTF with a center-symmetric layer structure Balicas et al. (2000); *uji01c; Konoike et al. (2005); Harrison et al. (1998a); Togonidze et al. (2001); Helm et al. (1995); *harr98; Kartsovnik et al. (1995); Yamauchi et al. (1996); Weiss et al. (1999a). One can consider a weak, meV, spin-orbit interaction as a possible source of the gap Winter et al. (2017). However, as pointed out in Sec. III, in the present case a gap should already arise due to the disorder in the anion layer along the -axis.
In the earlier study Zverev et al. (2010) performed at similar pressures no SdH oscillations with the frequencies and were observed, but instead a very low frequency T has been found and attributed to a very small Fermi pocket. The latter could be formed due to folding the original Fermi surface caused by the superstructure transition at about 100 K Zverev et al. (2010). In that scenario the orbits and can also be realized, but now both would additionally require magnetic breakdown through the superstructure gap. The absence of the relevant frequencies could be attributed to the lower field range, T, and higher temperatures, K, used in the experiment Zverev et al. (2010). On the other hand, the reason for the absence of in our present data is not quite clear. It is possible that the discrepancy is caused by different pressurizing procedures applied in the two experiments. In the work Zverev et al. (2010) the sample was cooled at ambient pressure down to low temperatures and pressures of kbar were applied below 20 K using the helium gas pressure technique. In the present experiment the sample was first pressurized at room temperature in the clamp cell and then cooled down under pressure. One can speculate that the 100 K transition responsible for the Fermi surface reconstruction is suppressed under these conditions, which would explain the absence of the slow oscillations in our data. To verify this scenario, it would be interesting to perform low-temperature X-ray studies at different pressures.
IV.2 Effective cyclotron masses
The effective cyclotron masses corresponding to the and orbits can be evaluated in the standard way from the temperature dependence of the oscillation amplitude. The latter is described by the Lifshitz-Kosevich temperature damping factor Lifshitz and Kosevich (1956); Shoenberg (1984a):
| (2) |
where
| (3) |
is the Boltzmann constant, the elementary charge, and , the cyclotron mass on the () orbit expressed in free electron mass units.
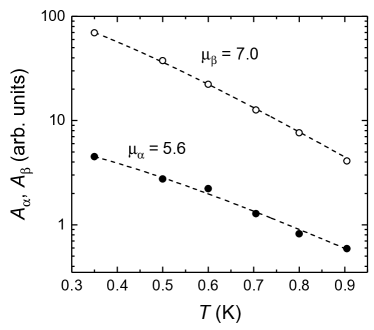
Figure 6 shows the FFT amplitudes of the and oscillations obtained in the field window from 14 to 17 T at different temperatures. Fitting the experimental data by the Lifshitz-Kosevich temperature dependence yields the effective cyclotron masses and .
The experimentally determined cyclotron masses significantly exceed the theoretical values given in Sect. III. This apparent discrepancy is often observed for the -type salts and attributed to many-body effects Merino and McKenzie (2000); Kawamoto and Mori (2006): electron-electron and electron-phonon interactions lead to a renormalization of the effective mass entering Eq. (2) by a factor as compared to the “band” mass obtained from the band structure calculations (here we defined as the mass obtained from Eq. (1) and normalized to the free electron mass) Shoenberg (1984a). However, usually the renormalization is uniform over the Fermi surface, i.e. the factor is the same for the and orbits Merino and McKenzie (2000); Kawamoto and Mori (2006). By contrast, in our case the renormalization factor for the orbit, , is notably higher than for the orbit, . Keeping in mind that the orbit contains all the states on the Fermi surface, including those on the -pocket (see Fig. 2), the difference between the many-body renormalization on the orbit and on the rest of the Fermi surface must be even stronger.
The reason for the enhanced many-body effects on the pocket may be qualitatively understood by taking into account the proximity of the electronic system to the metal-insulator transition. As shown in Sect. III, the band associated with the pocket is partially flattened around the Fermi level (which already causes an increase of the one-particle band mass ). It is reasonable to expect that the effective reduction of the bandwidth places this part of the conduction system more close to the Mott-insulating state, resulting in a relative enhancement of electron correlation effects. Additionally, the rhombus-like shape of the pocket is suggestive of the so-called “nesting” instability, that is, a strongly enhanced scattering at the wave vector connecting the opposite flat segments of the pocket Whangbo et al. (1991); Borisenko et al. (2008); Ruvalds and Virosztek (1991). This may further contribute to the many-body renormalization factor for the effective mass.
To check the role of the proximity to the Mott-insulating state, we have repeated the SdH experiment at an elevated pressure, kbar, moving the material far away from the metal-insulator phase boundary. Expectedly, the cyclotron masses become considerably smaller at this pressure: and , indicating weakening of the many-body effects. But an important result is that, within the experimental accuracy com (a), the mass enhancement factor is now the same for both orbits, . This provides a strong support for the suggested above momentum- or band-dependent enhancement of electronic correlations near the metal-insulator transition in -(BETS)2Mn[N(CN)2]3. It is worth noting that even at this pressure the mass values are relatively high compared to the other -salts Caulfield et al. (1994); Weiss et al. (1999b); Togonidze et al. (2001); Biggs et al. (2002). This can be at least partially attributed to the peak in the one-particle DOS near the Fermi level predicted by the band structure calculations, see Sect. III.
IV.3 Field dependence of the SdH amplitudes
As one can see in Fig. 5, the oscillation amplitude increases in a monotonic manner with no traces of beating. The absence of beats suggests that the Landau level separation near the Fermi energy, (where is the cyclotron frequency), is larger than the interlayer bandwidth, , in the whole field range where the oscillations are observed. Therefore we apply the 2D Lifshitz-Kosevich-Shoenberg formula Shoenberg (1984a, b); Champel and Mineev (2002); Grigoriev (2011a),
| (4) |
which is valid for weak oscillations in a 2D system for analysing the magnetic field dependence of the oscillation amplitudes. Besides the temperature factor introduced above, this formula contains the Dingle damping factor , determined by scattering, and the MB factor. The prefactor is proportional to the contribution from the carriers on the -th orbit to the zero-field conductivity, . It does not depend on , but we have included it in Eq. (4) since it has to be taken into account when comparing the amplitudes of the and oscillations. The Dingle factor is conventionally considered in the form Shoenberg (1984a); Dingle (1952); Bychkov (1961):
| (5) |
where is defined by Eq. (3), and the Dingle temperature is associated with the scattering rate . The MB factors for orbits and are readily expressed in the form (see, e.g., Sasaki et al. (1991)):
| (6a) | ||||
| (6b) | ||||
with the characteristic field related to the energy gap at the MB junction Shoenberg (1984a): .
Figure 7 shows the Dingle plot of the oscillation amplitudes: the experimentally obtained amplitudes, divided by the temperature damping factors (which are known from the above analysis of the -dependence), are plotted in logarithmic scale against inverse magnetic field.

The amplitudes were taken from FFT spectra made in 3 T-wide field windows. The horizontal positions of the points correspond to the midpoints of the respective windows in the scale.
Before starting with the fitting procedure, it should be noted that a precise evaluation of the MB field from our experiment can hardly be done. On the one hand, the functional -dependence of the MB factor for the oscillations is the same as the -dependence of the Dingle factor, cf. Eqs. (5) and (6b). Therefore, one cannot extract separately the values and from the oscillations only. On the other hand, the influence of MB on the shape of the dependence is very weak. Indeed, despite the higher cyclotron mass, the oscillations strongly dominate in the whole field range in Fig. 5, implying that the MB field is well below this range. Hence, the expression in Eq. (6a) for the MB factor for the oscillations can be approximated as . This dependence is much weaker than the exponential dependence of the Dingle damping factor. Therefore, the influence of MB on the oscillations is basically reduced to that on the absolute amplitude. Further, the prefactors can hardly be directly evaluated, as they depend on numerous details of interlayer charge transfer and scattering. However, taking into account that the orbit comprises roughly twice as many states as the orbit, one can tentatively assume .
In spite of the mentioned issues affecting the accuracy of , our analysis yields some interesting qualitative results.
We begin with fitting the amplitude of the oscillations. In the Dingle plot coordinates we obtain a linear fit [dashed line in Fig. 7(b)] with the -intercept , in the units of the graph, and the slope contributed by both the Dingle and MB factors, T.
Next, we turn to the oscillations. The slope of the fitting curve in Fig. 7(a) is mainly determined by the Dingle factor, yielding K. As mentioned above, the effect of MB on the shape of the field dependence is very weak. It leads to a barely visible nonlinearity of the Dinlge plot in Fig. 7(a). Obviously, this nonlinearity cannot be unambiguously evaluated within the present experimental accuracy.
Nevertheless, the MB field can be estimated from the absolute value of the -oscillation amplitude provided the coefficient is known. Setting, as suggested above and using for the value found by fitting the amplitude, we obtain a very low MB field: T. For instance, the corresponding energy gap, meV, is more than an order of magnitude lower than in -(BEDT-TTF)2Cu(NCS)2 Sasaki et al. (1991); Meyer et al. (1995); Goddard et al. (2004). But the large difference between the two cases is not surprising. Indeed, the lack of the inversion symmetry of the crystal structure in the latter compound is expected to produce a much larger gap than the subtle mechanisms discussed above in relation to our material, see Sects. III, IV.1. However, it should be kept in mind that the present estimation of crucially depends on the assumed ratio . A decrease of this ratio would lead to a proportional increase of the estimated MB field. Thus, the obtained value of should only be considered as a very rough estimate.
Coming back to the oscillations, we see that the term associated with MB provides a negligibly small contribution to the slope of the -dependence. Even a 10-fold increase of the given above value would only lead to a change of in . So the evaluation of the Dingle temperature is robust against the uncertainty in the MB field. Using the cyclotron mass , we find K.
The obtained values of and differ from each other by a factor of . This apparently comes at odds with momentum-independent scattering commonly assumed for our materials at low temperatures. The difference can be somewhat reduced by a more accurate consideration of many-body renormalization effects. Strictly speaking, both the cyclotron mass and the Dingle temperature in the expression for in Eq. (5) are renormalized. It was shown both theoretically Fowler and Prange (1965); Engelsberg and Simpson (1970); Elliott et al. (1980) and experimentally Palin (1972) that the effects of electron-phonon interactions on and compensate each other in a broad field and temperature range. The influence of electron-electron interactions is less studied in this respect. However, it was argued Martin et al. (2003) that at least for a 2D Fermi liquid the same compensation should be valid for any inelastic process, including electron-electron scattering, as long as the oscillations are weak, i.e. . These conditions are obviously fulfilled in our case. Therefore we can consider the Dingle temperature in Eq. (5) to be free of many-body renormalization but simultaneously replace the renormalized mass , by the band mass . By doing that, we come to new values for the Dingle temperatures in our fits: K and K. One can see that the relative difference between them has reduced, however is still quite large and cannot be explained by the experimental error or uncertainties in the fitting procedure.
Thus, the assumption of a momentum-independent scattering time seems to be inappropriate in our case. As mentioned in Sect. IV.2, the nesting property of the rhombus-like orbit may cause enhanced scattering on this part of the Fermi surface. However, this should lead to a relative increase of , whereas our estimated value is considerably lower than .
Another possibility is to consider a momentum-independent mean free path instead of as a characteristic parameter of scattering for different states on the Fermi surface com (b). This may be a realistic scenario, for example, if scattering is mainly determined by a 2D dislocation network Shoenberg (1984a). In Eq. (5) the scattering time can be replaced by the mean free path with the help of the approximate relation , where is the relevant “averaged” Fermi momentum estimated from the SdH frequency . Then, using the given above estimations of and , we obtain nm and nm for the and orbits, respectively. These two values are much closer to each other than and . This is because the relatively large is partially compensated by the strongly enhanced effective cyclotron mass , see Sect. IV.2. Of course, these are only rough estimates, taking into account the approximations made above. However, one can consider this result as a hint to an important role of dislocations in the damping of SdH oscillations in the present material.
V Semiclassical magnetoresistance
V.1 Field perpendicular to layers: effects of magnetic breakdown and field-induced dimensional crossover
Apart from the quantum oscillations, the magnetoresistance of -(BETS)2Mn[N(CN)2]3 exhibits several other features, which can be seen in detail in Fig. 8. At zero field the material is superconducting. However, the zero-resistance superconducting state is very rapidly suppressed in this field geometry: the normal-state resistance is already restored at T. The resistive transition is followed by a small sharp peak. This anomaly is better pronounced at liquid 4He temperatures Zverev et al. (2010) and has been observed on a number of other layered organic superconductors Zuo et al. (1996); Su et al. (1999); Yamauchi et al. (1996). Its origin is most likely associated with a specific influence of superconducting fluctuations on the interlayer conduction in a strongly anisotropic, quasi-2D superconductor Friemel et al. (1997); Kartsovnik et al. (1999); Glatz et al. (2011).
In the fully normal state the resistance begins to increase rapidly with the field. However, already starting from T it gradually flattens out, shows a broad maximum around 4 T and slightly, by , decreases as the field is further increased to T.

One can qualitatively explain this behavior in terms of the MB effect. Generally speaking, at low fields, , there are two distinct types of electron orbits on the Fermi surface: closed orbits on the pockets and the orbits on the open Fermi sheets. The contribution of the carriers on the closed orbits to the interlayer conductivity only weakly depends on magnetic field, whereas the contribution from the open orbits decreases proportionally to Lifshitz et al. (1957); Lifshitz and Peschansky (1959); Abrikosov (1988). Thus, in the absence of MB, the open orbits are “freezing out” and magnetoresistance rapidly increases with field, asymptotically approaching a value solely determined by the closed cyclotron orbits. When the field becomes comparable to , tunneling of carriers through the MB gap gives rise to new closed orbits and reduces the relative weight of the classical open orbits. Finally, at almost all the carriers execute the large closed orbit, equally contributing to the interlayer conductivity. This leads to a significant increase of interlayer conductivity, hence, decrease of resistivity in comparison to what it would be without MB.
While the above description is only qualitative, one could try to roughly estimate the MB field, ascribing it to the field at which the magnetoresistance considerably curves down from its initial slope. According to Fig. 8(a), it happens in the interval between and T, which would imply a MB gap meV. This is much higher than meV obtained from the analysis of the quantum oscillations. However, as pointed out in Sect. IV.3, the latter value is also only a very rough estimation. Therefore, the obtained discrepancy should not be considered as a severe contradiction between two methods but rather as an illustration of subtlety of such kind of estimations.
At high enough fields, , the large closed orbit dominates. However, the magnetoresistance does not keep saturating, as the standard magnetotransport theory Lifshitz et al. (1957); Lifshitz and Peschansky (1959); Abrikosov (1988) predicts, but rather grows notably starting from T all the way up to the highest field. Above 10 T it precisely follows a -dependence, as illustrated in Fig. 8(b). The same field dependence has recently been reported for another highly anisotropic layered conductor and explained in terms of a field-induced dimensional crossover to a “weakly coherent” interlayer transport regime Grigoriev et al. (2012). The latter is defined as coherent interlayer charge transfer under a strong magnetic field, when the cyclotron frequency significantly exceeds both the zero-field intralayer scattering rate and the interlayer tunneling rate . At such conditions the impact of scattering on point-like defects on charge transport is enhanced similarly to the case of a purely two-dimensional system Ando and Uemura (1974). As a result, the scattering rate and hence interlayer resistance are predicted Grigoriev (2011a); *grig11a; Grigoriev (2013) to grow proportionally to .
Assuming that bending of the dependence at is entirely caused by the crossover to the weakly coherent regime, one can evaluate the upper limit for the interlayer transfer integral: meV (here we used the value for the cyclotron mass obtained from the SdH data). Estimating, further, the Fermi energy as meV, we obtain the anisotropy ratio, . The information on in known BETS salts is very scarce. Comparing with better studied -type BEDT-TTF salts, similar values have been reported for the most anisotropic compounds -(BEDT-TTF)2X with X = Cu(NCS)2 Singleton et al. (2002) and I3 Wosnitza et al. (2002). The very low value of is fully consistent with the absence of beats in the SdH oscillations and thus further justifies the use of the 2D Lifshitz-Kosevich-Shoenberg formula (4) for the oscillation amplitude.
In Figs. 4 and 8, the bending of magnetoresistance at may look somewhat too sharp for what one would generally expect from a gradual crossover. However, a similar sharp bending has been found on pressurized -(BEDT-TTF)2KHg(SCN)4 at T Grigoriev et al. (2012). Moreover, the recent numerical calculations of the interlayer magnetoresistance in a quasi-two-dimensional metal Grigoriev and Grigoriev (2014) made in the self-consistent Born approximation have reproduced a relatively sharp crossover from a nearly constant value to a -dependence in a field when the Landau level separation becomes larger than their width . Note that in this case the crossover is determined by scattering rather than by interlayer charge transfer: the condition is supposed to be fulfilled already at lower fields. If we adopt the same crossover criterion, , for our case, we can estimate the transport scattering time, ps. This value is much higher than the scattering time derived from the Dingle factor of the SdH oscillations, ps. Such a large difference is not uncommon for organic metals Hill (1997); Kartsovnik et al. (2002); Grigoriev et al. (2012) and is caused by different scattering mechanisms dominating in the charge transport and quantum oscillation damping. In particular, as argued in Sect. IV.3, the Dingle factor in our material is mainly determined by scattering on dislocations, which usually plays only a minor role in the charge transport, especially in the interlayer direction.
V.2 Angle-dependent magnetoresistance and the Fermi surface geometry
The main panel of Fig. 9 shows examples of the resistance recorded at rotating the sample in a constant magnetic field, T. The resistance was measured as a function of polar angle at different fixed azimuthal angles , see Sect. II. The measurements were done in the range .
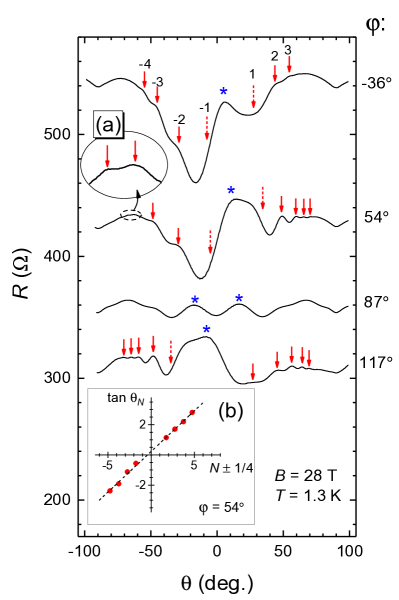
For most of the azimuthal orientations clear oscillations periodic in have been detected. In Fig. 9 the relevant local maxima are marked by arrows. These angle-dependent magnetoresistance oscillations (AMRO), also known as Yamaji oscillations, originate from periodic geometric resonances of the interlayer charge transport in a quasi-2D metal in a tilted magnetic field Yamaji (1989); Yagi et al. (1990); Peschansky et al. (1991); Kurihara (1992); Yakovenko and Cooper (2006); Grigoriev (2010). They are frequently observed in organic metals and utilized for exploring the Fermi surface geometry Kartsovnik (2004).
To determine the shape of the Fermi-surface inplane cross section, we follow the procedure proposed in Ref. 90 for the general case of a low-symmetry layered system. First, for each -sweep the AMRO period is evaluated from the linear fit of the -th local maximum positions plotted in the -scale against , according to the condition:
| (7) |
where the offset () is determined by the inplane projection of the interlayer hopping vector Kartsovnik et al. (1992). An example of such fitting for is shown in Fig. 9(b). In the figure, the positive and negative indices are shifted by and , respectively, in order to include data for both positive and negative angles in a common fit.
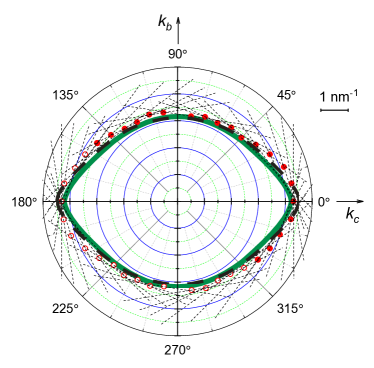
The period is given by the ratio of the reciprocal lattice period in the interlayer direction and the maximum inplane Fermi wave vector projection on the field rotation plane: . Thus, using the experimentally determined AMRO periods and substituting nm-1 taken from the low-temperature crystallographic data Zverev et al. (2010), we evaluate for different azimuthal orientations . The result, in polar coordinates, is shown in Fig. 10. Here, the filled circles represent the data obtained directly from the experiment, while the open circles are the same data translated by , taking into account the inversion symmetry of the Fermi surface. Further, through each point a straight line perpendicular to the direction is drawn (thin dashed lines in Fig. 10) and the inplane Fermi surface (thick green line) is constructed as a contour inscribed in the whole set of these straight lines.
The size of the obtained Fermi surface is close to that of the first Brillouin zone, in agreement with the large Fermi surface predicted by the band structure calculations and with the frequency of the fast quantum oscillations presented above. No AMRO associated with the small pockets of the Fermi surface have been found. This is obviously a consequence of the strong MB regime which governs the magnetoresistance behavior at T even at relatively high tilt angles, at least up to .
As to the shape of the Fermi surface, it is also quite similar to the theoretical one, which is indicated in Fig. 10 by the thick dashed line. It also has relatively flat segments inclined by with respect to the -axis and a sharp “nose” along . The dimension along appears to be slightly smaller and along slightly larger than calculated. However, the difference does not exceed the experimental error bar. Therefore we can speak about very good quantitative agreement between the theoretical predictions and the experimental results.
Surprisingly, at azimuthal orientations in a narrow interval of around direction the conventional AMRO vanish. In this interval the dependence is governed by other, nonperiodic oscillations, see the curve in Fig. 9. The new features seem to compete with the AMRO. Outside the mentioned range they only persist at low tilt angles, . At the same time the AMRO maxima, which are expected at the positions pointed by dotted arrows in Fig. 9, are completely suppressed. By contrast, at higher the conventional AMRO are restored, whereas the new features disappear. Thus, there seems to be no angular range where both kinds of oscillations coexist. It should be noted that at the angles, at which switching between the two kinds happens, no change in the cyclotron orbit topology is expected.
Similarily to the AMRO and other geometrical effects of the Fermi surface in a quasi-2D metal Kartsovnik (2004), the new features appear to keep their angular positions at changing the field strength.
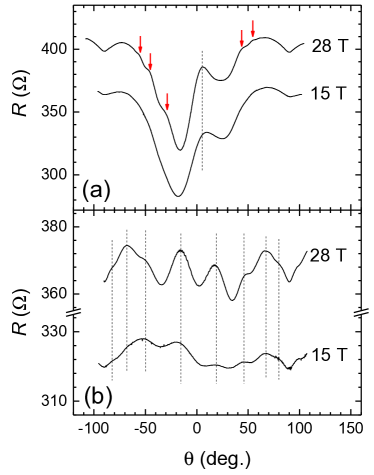
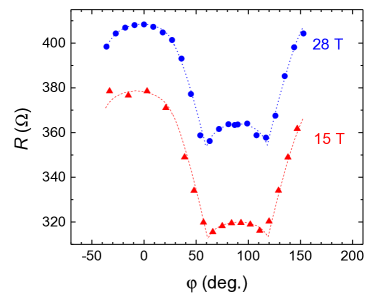
This is illustrated in Fig. 11 where the dependence is shown for two azimuthal orientations at and 15 T. On the other hand, the influence of the field strength on the amplitude of the features is relatively weak: Fig. 11(a) shows that at decreasing the field to 15 T the usual AMRO practically vanish, whereas the peak around only becomes slightly lower and more smeared.
All in all, the new features are unlikely a pure effect of the Fermi surface geometry. One may look for their origin in coupling between charge and spin degrees of freedom. Indeed, the magnetoresistance, especially in the interlayer direction, may be sensitive to the magnetic state of Mn2+ ions in the anion layer. The ambient-pressure magnetic experiments Vyaselev et al. (2011, 2012, 2017) have revealed a dramatic slowing of the spin dynamics in the manganese subsystem at low temperatures and considerable interactions with antiferromagnetically ordering -electron spins in the Mott-insulating state. However, at present we do not have enough data to establish a direct link between the magnetoresistance behavior and magnetic properties. A further study, for example, combined angle-resolved resistance and magnetic measurements in the metallic state should be helpful for clarifying the situation.
Finally, we discuss the dependence of magnetoresistance on the inplane field orientation. Figure 12 shows the resistance values corresponding to , taken from the curves recorded at different . The notable variation of the resistance, as the field is turned in the layer plane, is generally associated with coherent interlayer charge transport in a layered system with an anisotropic inplane cross section of the Fermi surface Kartsovnik et al. (2005, 2006)
The shape of the dependence resembles that observed on materials with open Fermi sheets such as Bechgaard salts (TMTSF)2X Osada et al. (1996); Lee and Naughton (1998); Kang and Chung (2009) or (DMET)2X Yoshino et al. (1995, 1997). The magnetoresistance is at a maximum when the field is directed along the plane of the sheets, in our case (i.e. ), and decreases towards , exhibiting two minima at . As shown in Fig. 12, a change of the field strength by almost a factor of two only affects the absolute value of magnetoresistance; the shape of the -dependence remains largely unchanged. Most importantly, the angles of the resistance minima stay the same, suggesting that they are associated with the Fermi surface geometry. At first glance, they can be ascribed to the “third angular effect”at the field directions perpendicular to inflection points on the Fermi surface Osada et al. (1996); Lee and Naughton (1998). However, our Fermi surface contains, besides the open sheets, a cylindrical -pocket. Moreover, since the gaps between the sheets and the pocket are very small, it is the large closed Fermi surface cross section delineated in Fig. 10, which basically determines the magnetoresistance behavior. Assuming a momentum-independent scattering rate, one would expect minima of at a field perpendicular to the parts of the Fermi surface with the smallest curvature Kartsovnik (2004), that is, perpendicular to the flat segments of the -pocket. According to Figs. 2 and 10, these directions are tilted by from the -axis, i.e. away from the positions of the detected resistance minima. This discrepancy definitely exceeds the experimental error bar and the uncertainty in the Fermi surface shape.
A shift of the resistance minimum positions from the directions given by the Fermi surface geometry may occur if the carrier mobility significantly depends on momentum For example, Sugiwara et al. Sugawara and Tamura (2013a, b) used the apparent mismatch between the dependence and the Fermi surface shape to evaluate the -dependence of scattering rate in some BETS and BEDT-TTF salts. In our case, the shift of the resistance minima towards the direction of the -axis can be explained by a suppressed mobility on the Fermi pocket. This seems to be a likely scenario, keeping in mind the particularly strong enhancement of the effective mass revealed in the SdH experiment.
As mentioned above, the significant -dependence of magnetoresistance associated with the Fermi surface geometry is an evidence of a coherent interlayer charge transport. On the other hand, a broad dip observed in all -sweeps around , see, e.g., Fig. 9, reveals the presence of an incoherent conduction channel Kartsovnik et al. (2006, 2009). Thus, the total interlayer conduction includes both the coherent and incoherent channels. However, the small amplitude of the dip ( of the total magnetoresistance) indicates that only a minor fraction of the total conductivity is incoherent.
Despite the dominant contribution of the coherent conduction channel, we were unable to detect a sharp peak in the angle-dependent magnetoresistance around Peschansky and Kartsovnik (1999); Hanasaki et al. (1998), which is often considered as a fingerprint of the coherent interlayer transport regime. The reason for that is most likely the very high anisotropy. Indeed, besides the effective field-strength parameter , the magnitude of such “coherence peak” depends on the anisotropy ratio Hanasaki et al. (1998). The peak is particularly strong in clean quasi-2D metals with a moderately high anisotropy, Hanasaki et al. (1998); Kartsovnik et al. (1992); Ohmichi et al. (1999); Kikugawa et al. (2016) but diminishes in more anisotropic materials Wosnitza et al. (2002); Kartsovnik et al. (2006); Singleton et al. (2002). In a clean sample of -(BEDT-TTF)2Cu(NCS)2, showing an anisotropy similar to our compound, the peak height was found to be only few percent of the total resistance in fields T Singleton et al. (2002); Goddard et al. (2004). In our experiment the highest field was 1.5 times lower and the Dingle temperature about 4 times higher ( K against 0.5 K in Ref. 60), which explains the absence of the peak in the present data.
VI Summary
We have studied the Fermi surface properties of -(BETS)2Mn[N(CN)2]3 both theoretically and experimentally. The experiment was done under a moderate pressure, in order to stabilize the metallic ground state. The large cylindrical Fermi surface predicted by the calculations is found to be split into a pair of open sheets extended in the -plane and a cylinder with a rhombus-like inplane cross-section area of of the first Brillouin zone. The sheets and the cylinder are separated from each other by small, of the order of 1 meV, gaps on the Brillouin zone boundary caused by a disorder of the dicyanamide groups in the anion layers and, possibly, by a weak spin-orbit interaction. The predicted size and shape of the Fermi surface are confirmed by the SdH oscillations as well as by the classical AMRO. In particular, the SdH spectrum shows two fundamental frequencies corresponding, respectively, to the classical cyclotron orbit on the small Fermi cylinder and to the large orbit caused by magnetic breakdown through the gaps. While the topology of the Fermi surface is typical of the -type salts of BEDT-TTF and BETS, there are a few interesting features specific to the present compound.
The effective cyclotron masses determined from the -dependence of the SdH oscillations show a strong enhancement which can only partially be attributed to the peak in the calculated one-particle DOS near the Fermi level. The main reason for the enhancement is the renormalization effect of electron correlations in the vicinity of the Mott-insulating transition. The effect clearly exhibits a momentum dependence, being especially strong on the -pocket of the Fermi surface. A likely reason for the momentum-selective enhancement of correlations is a partial flattening of the conducting band, associated with the -pocket, which places this part of the system more close to the metal-insulator transition. Additionally, the nesting property of this pocket could contribute to the instability of the metallic state. The heavier effective mass leads to a lower mobility of the carriers on the -pocket. Indeed, a close examination of the -dependence of the classical magnetoresistance in conjunction with the shape of the inplane Fermi surface indicates a suppressed contribution of these carriers to the interlayer conductance. Further experiments at different pressures are required in order to understand how the insulating instability develops on different parts of the Fermi surface upon approaching the metal-insulator transition.
The field dependence of the SdH amplitude reveals a considerable difference between the Dingle temperatures corresponding to the and orbits. The apparent contradiction can be solved by suggesting a constant mean free path instead of scattering time to be the relevant parameter in the Dingle factor. This is a realistic scenario if the Landau level broadening responsible for damping of the oscillations is mainly determined by scattering on a 2D dislocation network. By contrast to the quantum oscillations, the classical magnetoresistance is largely insensitive to dislocations. As a result, the scattering time estimated from the crossover in the magnetoresistance field dependence is considerably longer than that inferred from the quantum oscillations.
The crossover field also sets the upper limit for the interlayer transfer energy, meV, which is times lower than the Fermi energy. Despite the weak coupling between the layers, the interlayer charge transport is dominated by the coherent conduction channel. This is indicated both by prominent AMRO and by the considerable -dependence of the magnetoresistance in a field parallel to layers.
Besides the well-known AMRO effect, an additional series of pronounced nonmonotonic features has been found in the -dependent magnetoresistance. These features are unlikely a pure effect of the Fermi surface geometry. Keeping in mind the proximity to the insulating state with nontrivial magnetic properties, they might be a result of charge-spin coupling in the presence of a magnetic instability. Ideally, combined resistive and magnetic studies under pressure should clarify this point. This is, however, a difficult experimental task due to the very small size of the samples. On the other hand, one could gain additional information from a magnetoresistance study of the mixed salt -(BETS)2Co0.13Mn0.87[N(CN)2]3. This sister compound displays very similar phase diagram and zero-field resistive properties but a considerably different magnetic anisotropy as compared to the present salt Kushch et al. (2017). Confronting the magnetoresistance behaviors of the two salts may be helpful for understanding the origin of the new oscillations.
VII Acknowledgements
We are grateful to N.D. Kushch for providing the high-quality crystals for our studies and to P.D. Grigoriev for numerous useful discussions. The work was supported by the German Research Foundation (DFG) via the grant KA 1652/4-1. The high-field measurements were done under support of the LNCMI-CNRS, member of the European Magnetic Field Laboratory (EMFL). V.N.Z. acknowledges the support from RFBR Grant 18-02-00280. Work in Spain was supported by the Spanish Ministerio de Economía y Competitividad (Grants FIS2015-64886-C5-4-P and CTQ2015-64579-C3-3-P) and Generalitat de Catalunya (2017SGR1506, 2017SGR1289 and XRQTC). E.C. acknowledges support from the Severo Ochoa Centers of Excellence Program under Grant SEV-2015-0496. P.A. acknowledges support from the Maria de Maeztu Units of Excellence Program under Grant MDM-2017-0767.”
References
- Kobayashi et al. (2004) H. Kobayashi, H. Cui, and A. Kobayashi, Chem. Rev. 104, 5265 (2004).
- Coronado and Day (2004) E. Coronado and P. Day, Chem. Rev. 104, 5419 (2004).
- Ouahab (2012) L. Ouahab, ed., Multifunctional Molecular Materials (Pan Stanford, New York, 2012).
- Kushch et al. (2008) N. D. Kushch, E. B. Yagubskii, M. V. Kartsovnik, L. I. Buravov, A. D. Dubrovskii, A. N. Chekhlov, and W. Biberacher, J. Am. Chem. Soc. 130, 7238 (2008).
- Zverev et al. (2010) V. N. Zverev, M. V. Kartsovnik, W. Biberacher, S. Khasanov, R. P. Shibaeva, L. Ouahab, L. Toupet, N. D. Kushch, E. B. Yagubskii, and E. Canadell, Phys. Rev. B 82, 155123 (2010).
- Lefebvre et al. (2000) S. Lefebvre, P. Wzietek, S. Brown, C. Bourbonnais, D. Jérome, C. Mézière, M. Fourmigué, and P. Batail, Phys. Rev. Lett. 85, 5420 (2000).
- Kagawa et al. (2004) F. Kagawa, T. Itou, K. Miyagawa, and K. Kanoda, Phys. Rev. Lett. 93, 127001 (2004).
- Kurosaki et al. (2005) Y. Kurosaki, Y. Shimizu, K. Miyagawa, K. Kanoda, and G. Saito, Phys. Rev. Lett. 95, 177001 (2005).
- Brossard et al. (1998) L. Brossard, R. Clerac, C. Coulon, M. Tokumoto, T. Ziman, D. K. Petrov, V. N. Laukhin, M. J. Naughton, A. Audouard, F. Goze, A. Kobayashi, H. Kobayashi, and P. Cassoux, Eur. Phys. J. B 1, 439 (1998).
- Cépas et al. (2002) O. Cépas, R. H. McKenzie, and J. Merino, Phys. Rev. B 65, 100502 (2002).
- Uji et al. (2001a) S. Uji, H. Shinagawa, T. Terashima, T. Yakabe, Y. Terai, M. Tokumoto, A. Kobayashi, H. Tanaka, and H. Kobayashi, Nature 410, 908 (2001a).
- Uji et al. (2003) S. Uji, T. Terashima, C. Terakura, T. Yakabe, Y. Terai, S. Yasuzuka, Y. Imanaka, M. Tokumoto, A. Kobayashi, F. Sakai, H. Tanaka, H. Kobayashi, L. Balicas, and J. S. Brooks, J. Phys. Soc. Jpn. 72, 369 (2003).
- Fujiwara et al. (2002) H. Fujiwara, H. Kobayashi, E. Fujiwara, and A. Kobayashi, J. Am. Chem. Soc. 124, 6816 (2002).
- Konoike et al. (2004) T. Konoike, S. Uji, T. Terashima, M. Nishimura, S. Yasuzuka, K. Enomoto, H. Fujiwara, B. Zhang, and H. Kobayashi, Phys. Rev. B 70, 094514 (2004).
- Kartsovnik et al. (2016) M. Kartsovnik, M. Kunz, L. Schaidhammer, F. Kollmannsberger, W. Biberacher, N. Kushch, A. Miyazaki, and H. Fujiwara, J. Supercond. Nov. Magn. 29, 3075 (2016).
- Vyaselev et al. (2011) O. Vyaselev, M. Kartsovnik, W. Biberacher, L. Zorina, N. Kushch, and E. Yagubskii, Phys. Rev. B 83, 094425 (2011).
- Vyaselev et al. (2012) O. M. Vyaselev, R. Kato, H. M. Yamamoto, M. Kobayashi, L. V. Zorina, S. V. Simonov, N. D. Kushch, and E. B. Yagubskii, Crystals 2, 224 (2012).
- Vyaselev et al. (2017) O. M. Vyaselev, W. Biberacher, N. D. Kushch, and M. V. Kartsovnik, Phys. Rev. B 96, 205154 (2017).
- Merino and McKenzie (2000) J. Merino and R. H. McKenzie, Phys. Rev. B 62, 2416 (2000).
- Kartsovnik (2004) M. V. Kartsovnik, Chem. Rev. 104, 5737 (2004).
- Hohenberg and Kohn (1964) P. Hohenberg and W. Kohn, Phys. Rev. 136, B864 (1964).
- Kohn and Sham (1965) W. Kohn and L. J. Sham, Phys. Rev. 140, A1133 (1965).
- Perdew et al. (1996) J. P. Perdew, K. Burke, and M. Ernzerhof, Phys. Rev. Lett. 77, 3865 (1996).
- Troullier and Martins (1991) N. Troullier and J. L. Martins, Phys. Rev. B 43, 1993 (1991).
- Kleinman and Bylander (1982) L. Kleinman and D. M. Bylander, Phys. Rev. Lett. 48, 1425 (1982).
- Artacho et al. (1999) E. Artacho, D. Sánchez-Portal, P. Ordejón, A. García, and J. M. Soler, Physica Status Solidi (b) 215, 809 (1999).
- Monkhorst and Pack (1976) H. J. Monkhorst and J. D. Pack, Phys. Rev. B 13, 5188 (1976).
- Kandpal et al. (2009) H. C. Kandpal, I. Opahle, Y.-Z. Zhang, H. O. Jeschke, and R. Valentí, Phys. Rev. Lett. 103, 067004 (2009).
- Xu et al. (1995) Y.-N. Xu, W. Y. Ching, Y. C. Jean, and Y. Lou, Phys. Rev. B 52, 12946 (1995).
- Ching et al. (1997) W. Y. Ching, Y.-N. Xu, Y. C. Jean, and Y. Lou, Phys. Rev. B 55, 2780 (1997).
- Jeschke et al. (2012) H. O. Jeschke, M. de Souza, R. Valentí, R. S. Manna, M. Lang, and J. A. Schlueter, Phys. Rev. B 85, 035125 (2012).
- Kawamoto and Mori (2006) T. Kawamoto and T. Mori, Phys. Rev. B 74, 212502 (2006).
- Balicas et al. (2000) L. Balicas, J. S. Brooks, K. Storr, D. Graf, S. Uji, H. Shinagawa, E. Ojima, H. Fujiwara, H. Kobayashi, A. Kobayashi, and M. Tokumoto, Solid State Commun. 116, 557 (2000).
- Uji et al. (2001b) S. Uji, H. Shinagawa, Y. Terai, T. Yakabe, C. Terakura, T. Terashima, L. Balicas, J. S. Brooks, E. Ojima, H. Fujiwara, H. Kobayashi, A. Kobayashi, and M. Tokumoto, Physica B 298, 557 (2001b).
- Konoike et al. (2005) T. Konoike, S. Uji, T. Terashima, M. Nishimura, S. Yasuzuka, K. Enomoto, H. Fujiwara, E. Fujiwara, B. Zhang, and H. Kobayashi, Phys. Rev. B 72, 094517 (2005).
- Harrison et al. (1998a) N. Harrison, C. H. Mielke, D. G. Rickel, L. K. Montgomery, C. Gerst, and J. D. Thompson, Phys. Rev. B 57, 8751 (1998a).
- Togonidze et al. (2001) T. G. Togonidze, M. V. Kartsovnik, J. A. A. J. Perenboom, N. D. Kushch, and H. Kobayashi, Physica B 294-295, 435 (2001).
- Helm et al. (1995) P. Helm, W. Kraak, D. Schweitzer, and H. J. Keller, Phys. Stat. Sol (b) 189, 509 (1995).
- Harrison et al. (1998b) N. Harrison, C. H. Mielke, D. G. Rickel, J. Wosnitza, J. S. Qualls, J. S. Brooks, E. Balthes, D. Schweitzer, I. Heinen, and W. Strunz, Phys. Rev. B 58, 10248 (1998b).
- Kartsovnik et al. (1995) M. V. Kartsovnik, W. Biberacher, K. Andres, and N. D. Kushch, JETP Lett. 62, 905 (1995).
- Yamauchi et al. (1996) Y. Yamauchi, M. V. Kartsovnik, T. Ishiguro, M. Kubota, and G. Saito, J. Phys. Soc. Jpn. 65, 354 (1996).
- Weiss et al. (1999a) H. Weiss, M. V. Kartsovnik, W. Biberacher, E. Balthes, A. G. M. Jansen, and N. D. Kushch, Phys. Rev. B 60, R16259 (1999a).
- Winter et al. (2017) S. M. Winter, K. Riedl, and R. Valentí, Phys. Rev. B 95, 060404 (2017).
- Lifshitz and Kosevich (1956) I. M. Lifshitz and A. M. Kosevich, Sov. Phys. JETP 2, 636 (1956).
- Shoenberg (1984a) D. Shoenberg, Magnetic Oscillations in Metals (Cambridge University Press, Cambridge, 1984).
- Whangbo et al. (1991) M. H. Whangbo, E. Canadell, P. Foury, and J. P. Pouget, Science 252, 96 (1991).
- Borisenko et al. (2008) S. V. Borisenko, A. A. Kordyuk, A. N. Yaresko, V. B. Zabolotnyy, D. S. Inosov, R. Schuster, B. Büchner, R. Weber, R. Follath, L. Patthey, and H. Berger, Phys. Rev. Lett. 100, 196402 (2008).
- Ruvalds and Virosztek (1991) J. Ruvalds and A. Virosztek, Phys. Rev. B 43, 5498 (1991).
- com (a) We estimate the renormalization factor by comparing the effective cyclotron masses determined at pressures and kbar with the theoretical values obtained from the ambient-pressure band structure. This is a reasonable approximation, since the expected pressure-induced relative changes in the band masses do not exceed a few percent within the given pressure range.
- Caulfield et al. (1994) J. Caulfield, J. Singleton, P. T. J. Hendriks, J. A. A. J. Perenboom, F. L. Pratt, M. Doporto, W. Hayes, M. Kurmoo, and P. Day, J. Phys.: Condens. Matter 6, L155 (1994).
- Weiss et al. (1999b) H. Weiss, M. V. Kartsovnik, W. Biberacher, E. Steep, E. Balthes, A. Jansen, K. Andres, and N. Kushch, Phys. Rev. B 59, 12370 (1999b).
- Biggs et al. (2002) T. Biggs, A.-K. Klehe, J. Singleton, D. Bakker, J. Symington, P. Goddard, A. Ardavan, W. Hayes, J. A. Schlueter, T. Sasaki, and M. Kurmoo, J. Phys.: Condensed Matter 14, L495 (2002).
- Shoenberg (1984b) D. Shoenberg, J. Low Temp. Phys. 56, 417 (1984b).
- Champel and Mineev (2002) T. Champel and V. P. Mineev, Phys. Rev. B 66, 195111 (2002).
- Grigoriev (2011a) P. D. Grigoriev, Phys. Rev. B 83, 245129 (2011a).
- Dingle (1952) R. B. Dingle, Proc. Roy. Soc. A 211, 517 (1952).
- Bychkov (1961) Y. A. Bychkov, Sov. Phys. JETP 12, 977 (1961).
- Sasaki et al. (1991) T. Sasaki, H. Sato, and N. Toyota, Physica C 185-189, 2687 (1991).
- Meyer et al. (1995) F. A. Meyer, E. Steep, W. Biberacher, P. Christ, A. Lerf, A. G. M. Jansen, W. Joss, P. Wyder, and K. Andres, Europhys. Lett. 32, 681 (1995).
- Goddard et al. (2004) P. A. Goddard, S. J. Blundell, J. Singleton, R. D. McDonald, A. Ardavan, A. Narduzzo, J. A. S. A. M. Kini, and T. Sasaki, Phys. Rev. B 69, 174509 (2004).
- Fowler and Prange (1965) M. Fowler and R. E. Prange, Physics 1, 315 (1965).
- Engelsberg and Simpson (1970) S. Engelsberg and G. Simpson, Phys. Rev. B 2, 1657 (1970).
- Elliott et al. (1980) M. Elliott, T. Ellis, and M. Springford, J. Phys. F: Metal Phys. 10, 2681 (1980).
- Palin (1972) C. J. Palin, Proc. R. Soc. A 329, 17 (1972).
- Martin et al. (2003) G. W. Martin, D. L. Maslov, and M. Y. Reizer, Phys. Rev. B 68, 241309 (2003).
- com (b) Of course, we consider the mean free path in the conducting layers, since it is the inplane electron dynamics, which determines the behavior of magnetic quantum oscillations in our quasi-2D metal.
- Zuo et al. (1996) F. Zuo, J. A. Schlueter, M. E. Kelly, and J. M. Williams, Phys. Rev. B 54, 11973 (1996).
- Su et al. (1999) X. Su, F. Zuo, J. A. Schlueter, J. M. Williams, P. G. Nixon, R. W. Winter, and G. L. Gard, Phys. Rev. B 59, 4376 (1999).
- Friemel et al. (1997) S. Friemel, C. Pasquier, and D. Jérome, Physica C 292, 273 (1997).
- Kartsovnik et al. (1999) M. V. Kartsovnik, G. Y. Logvenov, K. Maki, and N. D. Kushch, Synth. Metals 103, 1827 (1999).
- Glatz et al. (2011) A. Glatz, A. A. Varlamov, and V. M. Vinokur, Phys. Rev. B 84, 104510 (2011).
- Lifshitz et al. (1957) I. M. Lifshitz, M. Y. Azbel’, and M. I. Kaganov, Sov. Phys. JETP 4, 41 (1957).
- Lifshitz and Peschansky (1959) I. M. Lifshitz and V. G. Peschansky, Sov. Phys. JETP 8, 875 (1959).
- Abrikosov (1988) A. A. Abrikosov, Fundamentals of the Theory of Metals (Elsevier Science Publishers B.V., Amsterdam, 1988).
- Grigoriev et al. (2012) P. D. Grigoriev, M. V. Kartsovnik, and W. Biberacher, Phys. Rev. B 86, 165125 (2012).
- Ando and Uemura (1974) T. Ando and Y. Uemura, J. Phys. Soc. Jpn. 36, 959 (1974).
- Grigoriev (2011b) P. D. Grigoriev, JETP Lett. 94, 47 (2011b).
- Grigoriev (2013) P. D. Grigoriev, Phys. Rev. B 88, 054415 (2013).
- Singleton et al. (2002) J. Singleton, P. A. Goddard, A. Ardavan, N. Harrison, S. J. Blundell, J. A. Schlueter, and A. M. Kini, Phys. Rev. Lett. 88, 037001 (2002).
- Wosnitza et al. (2002) J. Wosnitza, J. Hagel, J. S. Qualls, J. S. Brooks, E. Balthes, D. Schweitzer, J. A. Schlueter, U. Geiser, J. Mohtasham, R. W. Winter, and G. L. Gard, Phys. Rev. B 65, 180506(R) (2002).
- Grigoriev and Grigoriev (2014) A. D. Grigoriev and P. D. Grigoriev, Low Temp. Phys. 40, 367 (2014).
- Hill (1997) S. Hill, Phys. Rev. B 55, 4931 (1997).
- Kartsovnik et al. (2002) M. V. Kartsovnik, P. D. Grigoriev, W. Biberacher, N. D. Kushch, and P. Wyder, Phys. Rev. Lett. 89, 126802 (2002).
- Yamaji (1989) K. Yamaji, J. Phys. Soc. Jpn. 58, 1520 (1989).
- Yagi et al. (1990) R. Yagi, Y. Iye, T. Osada, and S. Kagoshima, J. Phys. Soc. Jpn. 59, 3069 (1990).
- Peschansky et al. (1991) V. G. Peschansky, J. A. R. Lopes, and T. G. Yao, J. Phys. I 1, 1469 (1991).
- Kurihara (1992) Y. Kurihara, J. Phys. Soc. Jpn. 61, 975 (1992).
- Yakovenko and Cooper (2006) V. M. Yakovenko and B. K. Cooper, Physica E: Low-dimensional Systems and Nanostructures 34, 128 (2006).
- Grigoriev (2010) P. D. Grigoriev, Phys. Rev. B 81, 205122 (2010).
- Kartsovnik et al. (1992) M. V. Kartsovnik, V. N. Laukhin, S. I. Pesotskii, I. F. Schegolev, and V. Yakovenko, J. Phys. I 2, 89 (1992).
- Kartsovnik et al. (2005) M. Kartsovnik, S. Simonov, D. Andres, W. Biberacher, N. Kushch, and H. Müller, J. Phys. IV 131, 265 (2005).
- Kartsovnik et al. (2006) M. V. Kartsovnik, D. Andres, S. V. Simonov, W. Biberacher, I. Sheikin, N. D. Kushch, and H. Müller, Phys. Rev. Lett. 96, 166601 (2006).
- Osada et al. (1996) T. Osada, S. Kagoshima, and N. Miura, Phys. Rev. Lett 77, 5261 (1996).
- Lee and Naughton (1998) I. J. Lee and M. J. Naughton, Phys. Rev. B 57, 7423 (1998).
- Kang and Chung (2009) W. Kang and O.-H. Chung, Phys. Rev. B 79, 045115 (2009).
- Yoshino et al. (1995) H. Yoshino, K. Saito, K. Kikuchi, H. Nishikawa, K. Kobayashi, and I. Ikemoto, J. Phys. Soc. Jpn. 64, 2307 (1995).
- Yoshino et al. (1997) H. Yoshino, K. Saito, H. Nishikawa, K. Kikuchi, K. Kobayashi, and I. Ikemoto, J. Phys. Soc. Jpn. 66, 2410 (1997).
- Sugawara and Tamura (2013a) S. Sugawara and M. Tamura, J. Phys. Soc. Jpn. 82, 095003 (2013a).
- Sugawara and Tamura (2013b) S. Sugawara and M. Tamura, Science and Technology of Advanced Materials 14, 045004 (2013b).
- Kartsovnik et al. (2009) M. V. Kartsovnik, P. D. Grigoriev, W. Biberacher, and N. D. Kushch, Phys. Rev. B 79, 165120 (2009).
- Peschansky and Kartsovnik (1999) V. G. Peschansky and M. V. Kartsovnik, Phys. Rev. B 60, 11207 (1999).
- Hanasaki et al. (1998) N. Hanasaki, S. Kagoshima, T. Hasegawa, T. Osada, and N. Miura, Phys. Rev. B 57, 1336 (1998).
- Ohmichi et al. (1999) E. Ohmichi, H. Adachi, Y. Mori, Y. Maeno, T. Ishiguro, and T. Oguchi, Phys. Rev. B 59, 7263 (1999).
- Kikugawa et al. (2016) N. Kikugawa, P. Goswami, A. Kiswandhi, E. Choi, D. Graf, R. Baumbach, J. Brooks, K. Sugii, Y. Iida, M. Nishio, S. Uji, T. Terashima, P. Rourke, N. Hussey, H. T. S. Yonezawa, Y. Maeno, and L. Balicas, Nat. Comm. 7, 10903 (2016).
- Kushch et al. (2017) N. D. Kushch, O. M. Vyaselev, V. N. Zverev, W. Biberacher, L. I. Buravov, E. B. Yagubskii, E. Herdtweck, E. Canadell, and M. V. Kartsovnik, Synth. Metals 227, 52 (2017).