Bull Bear Balance: A Cluster Analysis of Socially Informed Financial Volatility
Abstract
Using a method rooted in information theory, we present results that have identified a large set of stocks for which social media can be informative regarding financial volatility. By clustering stocks based on the joint feature sets of social and financial variables, our research provides an important contribution by characterizing the conditions in which social media signals can lead financial volatility. The results indicate that social media is most informative about financial market volatility when the ratio of bullish to bearish sentiment is high, even when the number of messages is low. The robustness of these findings is verified across 500 stocks from both NYSE and NASDAQ exchanges. The reported results are reproducible via an open-source library for social-financial analysis made freely available.
Index Terms:
data mining; sentiment analysis; stock market; k-means clustering; mutual information; information theory; volatilityI Introduction
Recent research has dampened the consensus about the unpredictability of market prices. As a result, predicting the stock market has garnered the attention of diverse fields and domains where different information channels have been explored, such as news [1, 2, 3], search engines [4, 5, 6, 7] and, more recently, social media [8, 9, 10, 11].
Social media is of particular interest due to the high volume and velocity of activity of an ever-evolving network that is constantly providing and creating information. It offers real-time information that can be attributed to specific people, events, markets, and securities. This is channeled through the use of so-called cashtags (e.g., ‘$AAPL’) in messages, enabling the creation of feeds associated with particular stock symbols. The use of cashtags has since been propagated onto Twitter, thus providing a means to direct social sentiment to the specific stock or securities of that it references. As a result, social media user sentiment can be harnessed as a source of information with respect to financial market activity.
Now, the opinions of traders, professional bloggers and analysts, along with laypeople’s opinions, are aggregated in a dynamic social network that can possibly explain some of the variance in market behavior. Initial research [12] sought to quantify a relationship between social media analytics with financial market data such as daily returns. The observed results outperformed baseline trading strategies, providing evidence that the volume of tweets can reduce uncertainty about financial returns. However, volume-based methods disregard any possible predictive information from qualitative aspects of the data (i.e., the actual content or content polarity). By applying sentiment analysis techniques [13] to a corpus of tweets, a sentiment score or emotion classification can be derived to quantify this qualitative dimension [13]. The effectiveness of this semantic approach has been examined in [8], where collective moods analyzed from large collections of daily tweets were used to increase an existing financial predictor’s performance to an accuracy of 87.6%.
While a broad analysis across several financial securities might reveal that social signs are relevant for explaining financial dynamics to some extent [8, 9], little is known about confounding factors that distinguish assets with predictive social signs from assets with no extra information provided by social media. Leveraged by a non-parametric analysis founded in information-theoretic measures, we demonstrate that social signs can be useful for most stocks from both NYSE and NASDAQ exchanges. This alone is an interesting and very sound result, compared to current literature’ however, we extend this analysis to provide, for the first time, possible explanations of features that might be essential to distinguish predictive social signs from non-predictive ones.
I-A Research Questions
-
•
RQ1. Which stocks from the NASDAQ and NYSE exchanges exhibit a significant information surplus when using social media as a leading indicator of the stocks’ future volatility?
For each stock, lead-lag mutual information analysis is performed between financial and social media data. -
•
RQ2. Under what configuration of social media and financial variables are social media analytics informative of future financial movements?
We aim to determine the feature profile (using financial and social media variables) of companies that are most indicative of a statistically significant social media lead-time information.
II Methodology
II-A Data
The data correspond to the daily social media analytics and market quotes of NYSE and NASDAQ listed companies between 01-01-2012 and 01-01-2016.
Social media data were provided by PsychSignal [14], which operates a customized Twitter and StockTwits collection framework tracking messages containing cashtags (e.g., $AAPL). State-of-the-art natural language processing algorithms were applied to relevant messages, labeling each with a sentiment disposition (i.e., bullish or bearish) and a measure of disposition intensity. A daily aggregate of these data was provided for each tracked stock. Furthermore, for each stock with available social media data, we also considered the historic records of daily stock quotes. The following data sets were utilized:
-
•
PsychSignal Social Media Database. Sentiment daily aggregates containing the following stock quotes attributes:
-
–
SYMBOL: the stock symbol (ticker) to which the sentiment data refers to;
-
–
TIMESTAMP_UTC: the date and time of the analyzed data in UTC format;
-
–
BULLISH_INTENSITY: positive sentiment polarity;
-
–
BEARISH_INTENSITY: negative sentiment polarity;
-
–
BULL_SCORED_ MESSAGES: positive sentiment volume, number of messages;
-
–
BEAR_SCORED_ MESSAGES: negative sentiment volume, number of messages;
-
–
TOTAL_SCANNED_ MESSAGES: total number of scanned messages.
-
–
-
•
Google Finance. Daily Market Quotes:
-
–
OPEN: daily opening price;
-
–
HIGH: daily high price;
-
–
LOW: daily low price;
-
–
CLOSE: daily closing price;
-
–
VOLUME: financial volume, number of daily trades.
-
–
II-A1 Variables Analyzed
We used a value of Daily True Range (TR) (see Equation 1) as a measure of financial volatility. A time series of volatility data for each stock was derived using financial quotes as follows:
| (1) |
We applied a principal component analysis (PCA) to a set of social media variables in order to obtain a time series that contains the majority of underlying information from the sentiment features considered. PCA_SOCIAL_CHANGE is defined as the daily change in the time series obtained by applying the PCA and extracting the first principal component from the set of social media variables considered, as defined in Table I. Principal component analysis is a dimensionality reduction technique that we utilized for feature extraction. The PCA permits the reduction of numerous correlated, co-linear variables to a component (or feature set of components). Tables I and II list the features utilized in this work.
| Feature | Description | |
|---|---|---|
| 1 | BULLISH_INTENSITY | positive sentiment polarity |
| 2 | BEARISH_INTENSITY | negative sentiment polarity |
| 3 | BULL_MINUS_BEAR | the ratio of 1 to 2 |
| 4 | BULL_SCORED_ MESSAGES | positive sentiment volume, number of messages |
| 5 | BEAR_SCORED_ MESSAGES | negative sentiment volume, number of messages |
| 6 | BULL_BEAR_MSG_ RATIO | volume of bullish messages over volume of bearish messages |
| 7 | TOTAL_SCANNED_ MESSAGES | total messages, including neutral sentiment |
| 8 | LOG_BULL_RETURN | log difference in daily volume of bullish messages |
| 9 | LOG_BEAR_RETURN | log difference in daily volume of bearish messages |
| 10 | LOG_BULLISHNESS | log difference between 4 and 5 |
| 11 | LOG_BULL_BEAR_ RATIO | log ratio between 4 and 5 |
| 12 | LOG_BULL_MINUS_ BEAR_CHANGE | log daily difference in 3 |
| 13 | TOTAL_SCANNED_ MESSAGES_DIFF | daily difference in 7 |
| 14 | TOTAL_SENTIMENT_ MESSAGES_DIFF | daily difference in volume for messages with non-neutral polarity |
| 15 | PCA_SOCIAL_ CHANGE | First principal component derived from 8, 9, 10, 11, 12, 14, and 15 |
| Feature | Description | |
|---|---|---|
| 16 | OPEN | daily opening price |
| 17 | HIGH | daily high price |
| 18 | LOW | daily low price |
| 19 | CLOSE | daily closing price |
| 20 | VOLUME | financial volume, number of daily trades |
| 21 | LOG_RETURN | percent change in log close price |
| 22 | LOG_CLOSE | log closing price |
| 23 | LOG_HIGH | log daily high price |
| 24 | LOG_LOW | log daily low price |
| 25 | VOLATILITY_1 | the absolute value of the difference between 22 and 24 |
| 26 | VOLATILITY_2 | the absolute value of the difference between 22 and the previous day’s 21 |
| 27 | VOLATILITY_3 | the absolute value of the daily difference between 24 and the previous day’s 21 |
| 28 | TR | the max between 25, 26, and 27 |
| 29 | LOG_VOLUME_DIFF | log daily difference in 20 |
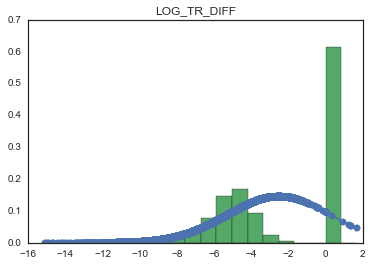
| 30 | LOG_TR_DIFF | log daily difference in 28 |
II-B Information Surplus
Information surplus [9] was derived from mutual information, a measure of the mutual dependence between two data sets. Let be the variable PCA_SOCIAL_CHANGE, which is the daily change in the time series obtained by applying the PCA and extracting the first principal component from the set of social media variables as defined in Table I and let be LOG_TR_DIFF, which is the log of the daily difference in the Daily True Range (see Equation 1). If the addition of series provides information about the movements of series , then it is said that a dependency or mutual information () exists between and . However, such a dependency is non-directional; in order to determine whether leads , must provide more information on a lagged series of than the baseline (i.e. non-lagged). Determining whether a baseline dependency exists between the series of a social media feature and a financial feature on the same day is the first step in identifying if leads or is predictive of . Mutual information tells us how much the information about reduces the uncertainty of . Equation (2) shows the formal form, where we attempt to reduce uncertainty or increase information by taking the double integral over the log of the joint entropy for both series over each distribution.
| (2) |
The data need to be grouped into bins to determine the mutual information between the two series. This is necessary to calculate entropy because the probability of observing an instance in each bin and constitutes the probability distributions. The number of bins is dependent on the size of the data; therefore, our bin sizes were typically identical per feature (i.e., there are roughly 365 daily instances of tweets and financial data per security per year). The bin size was calculated using Sturge’s Rule (see Equation 3), which has been found to be more accurate than comparable methods when used to calculate entropy in the algorithm [15].
| (3) |
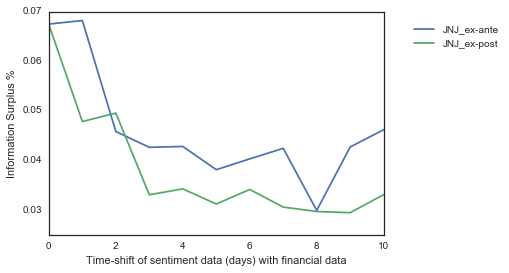
Mutual information was then computed at consecutive daily time lags. The information gain at time lag is calculated by finding the difference between mutual information at and , where is a certain day lag and corresponds to the baseline case. Information surplus is expressed as a percent of the above what we would expect over the given time frame. Therefore, if we achieve a surplus above the average from to , then the social media time series is said to lead .
| (4) |
II-C Validating Significant Information Surplus
To validate whether the information surplus is statistically significant, we verified whether information is more leading than trailing, and we compared the obtained results with those obtained via a randomly permuted time-series.
We first filtered companies whose surplus is more trailing than it is leading by identifying stocks for which the daily changes in carry more information about the daily in hindsight () rather than during the same () or a previous day (). We calculated on a forward shift (ex-post) and on a backward shift (ex-ante), eliminating stocks where the ex-post is greater than the ex-ante . Where the for a lag is less than the for a retrospective advance of the series (i.e. ), we can assert that trails more trailing than it leads, and it is thus insignificant.
A random permutation of the remaining symbols was then performed 100 times. With , the stocks must outperform 95% of the randomly permuted data to be considered to have a significant surplus.
II-D Clustering
To identify the conditions under which social signs may be predictive of financial volatility, we utilized a clustering method to determine the configuration of social media and financial variables that is indicative of a high information surplus. Each stock was represented as a vector of social media and financial variables. In addition, the respective scores of information surplus and the features that describe its nature (e.g., the size of the lag it was obtained at) were included. Stocks with similar configurations of social media and financial variables were grouped together in clusters.
Inspecting the feature profiles of the clusters (i.e., the average representation of constituent stocks’ features) allows us to identify the social signs of financial dynamics that are indicative of a high information surplus. Clusters with a profile containing many significant lags and high overall information surplus will provide us insight into the configuration of variables that characterizes a stock with predictable volatility.
We used k-means clustering, which is an unsupervised learning algorithm that partitions instances into k clusters by minimizing the within-cluster sum of square error (WCSS) between instances in each set using a distance metric (see Equation 5).
| (5) |
III Descriptive Statistics
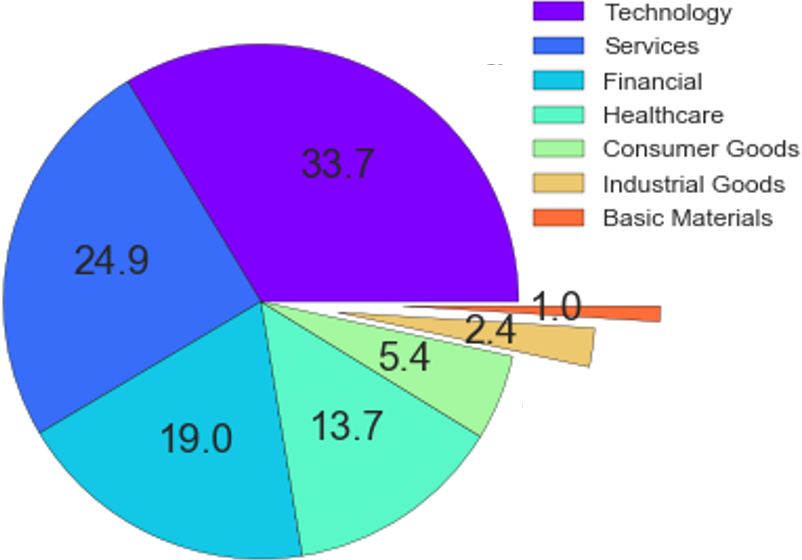
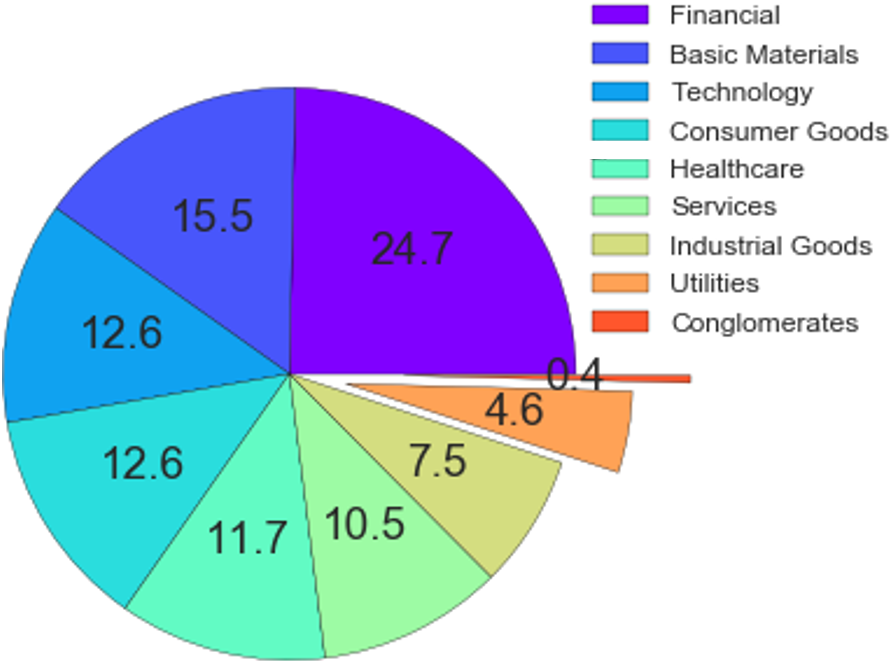
The following descriptive statistics provide context for our results. Figure 1 presents the sector breakdown of the top 250 stocks by market cap for both the NASDAQ and NYSE (i.e. 500 stocks in total). In the context of this work, it is interesting to note that the NASDAQ is typically characterized as being more volatile than the NYSE exchange [16].
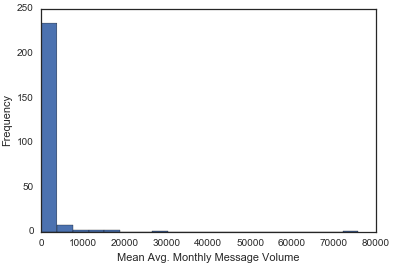
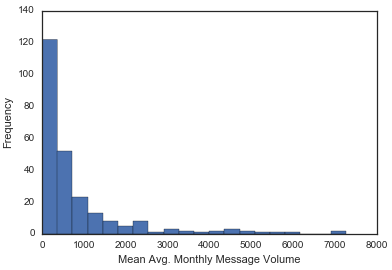
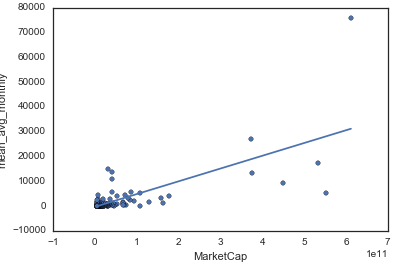
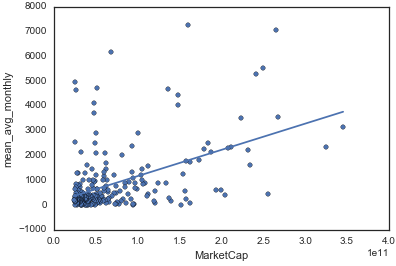
Figures 2 and 3 compare the relationship between the volume of tweets regarding exchange-specific securities and the size of those securities. In summary, there is a strong right skew in tweet volume, which contributes to a moderately positive relationship between the size of a security and its interest to investors as quantified by tweet volume. In both exchanges, there are several notable outliers, such as $AAPL that contains a disproportionate volume of tweets.
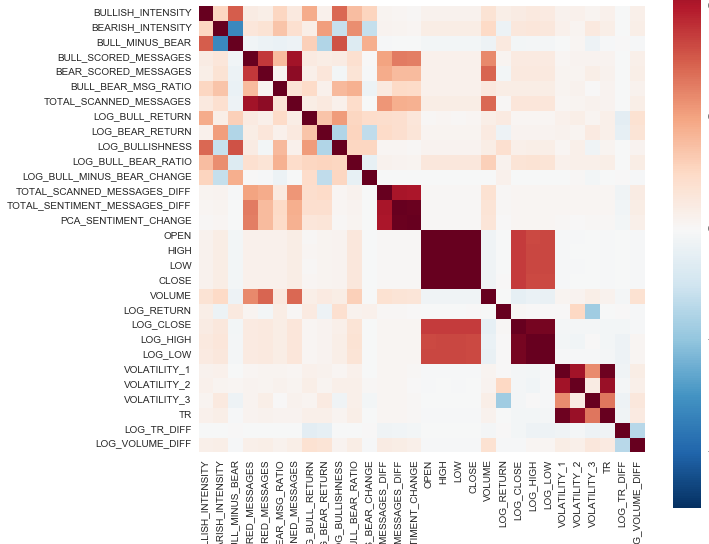
In Figures 4 and 5, we present a range of plots related to the feature behavior of the data utilized for calculating the . The correlation plot between all features (see tables I and II) in Fig. 4 reinforces the use of PCA dimensionality reduction. As the features are correlated, it is useful to inject a compression of these variables into our MI calculation. A correlation was found among social media features pertaining to, for instance, sentiment polarity, the volume of messages as well as with daily financial features.
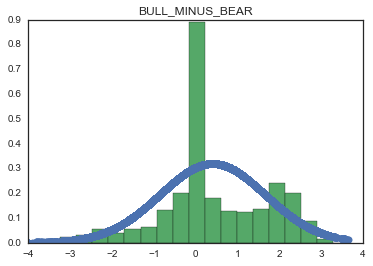
The majority of features is also characterized by non-normal distributions (see Fig. 5). For features that are highly dependent on market capitalization (e.g., mean average monthly message volume as (see Figure 2)), log-normal behavior exists. Furthermore, NASDAQ and NYSE stocks exchanges exhibit comparable results.
IV Results
We used the outlined information surplus method [9] and data from 01/01/2012 to 01/01/2016 to determine which stocks in the NYSE and NASDAQ exhibit, on average, a significant leading information surplus. We then built on this method by clustering stocks and examining which configuration of variables is indicative of a high information surplus.
IV-A Reducing Uncertainty about Volatility
Experiments on the NASDAQ and NYSE were carried out in tandem, and they produced comparable results. We found 101 stocks from the NASDAQ that exhibit a leading information surplus when using social media as an indicator of the daily change in True Range (our measure of volatility, see Equation 1). Of the original 250 stocks examined, 149 did not have a significant surplus, meaning that the surplus in each time lag over a 10-day period did not exceed the expected surplus. Thus, for example, the periods in Fig. 6 where the blue ex-ante series is below the average ex-post for the 10-day period do not contain a significant leading surplus. All 101 stocks with a significant leading surplus, however, passed through the second validation test by performing better than 95% of the randomly permuted data.
For the NYSE, 91 of the original 250 stocks exhibited a significant leading surplus. In addition, only one company did not pass the second validation test.
The full list of significant stocks from the NASDAQ and NYSE can be found in Appendix B.
IV-B Leading Surplus Indicators
Stocks with a statistically significant information surplus were clustered using relevant numeric features studied (see Tables I and II). The aim of the clustering is to identify the cluster feature profile of stocks with a surplus exhibited at many time lags (i.e. high POS_LAG_COUNT values) and the stocks with the highest surplus (i.e. high MAX_INF_SURP_PCT values). The results were robust across different values of number of clusters k tested. We found that moderate choices of k all produced the noteworthy cluster profile presented in Fig. 7, where a significant surplus is almost completely contained. The two cluster profiles presented in Fig. 7 correspond to the cluster centroid feature profiles of both the NASDAQ and NYSE which contained the highest information surplus values.
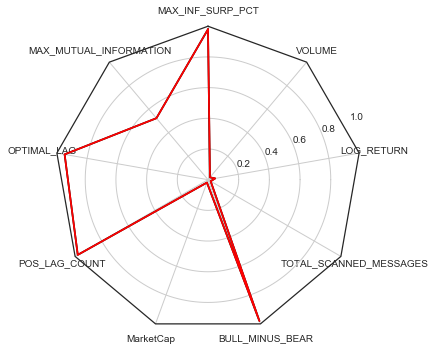
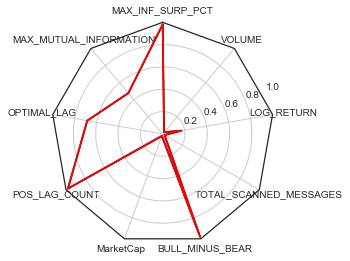
Interestingly, BULL_MINUS_BEAR is maximized in the cluster, indicating that stocks with many leading surpluses during the 10-day period (POS_LAG_COUNT) and large significant surpluses (MAX_INF_SURP_PERC) also have a particular ratio of bullish to bearing intensity. This suggests that in isolation, messages with a strong positive or negative sentiment are not as informative about future volatility; rather, the combination of features is important in the context of volatility or daily risk. Although we can speculate about the underlying factors contributing to this behavior, we note that this feature relationship seems to contradict the traditionally held assumption that negative sentiment is more indicative of volatility. It may be expected that a volatile security is lead by historically negative or bearish tweets because volatility is associated with risk, and high risk is synonymous with negative sentiment; however, our clustering suggests otherwise: the polarity between all sentiment-loaded tweets is important in predicting volatility. Another noteworthy implication of the clustering is the absence of VOLUME (number of trades), LOG_RETURN, and TOTAL_SCANNED_MESSAGES (volume of messages) in the cluster profile associated with significant leading surpluses. While those are features are commonly used in the literature, in this study they did not prove to be as relevant as the ratio of bullish to bearish messages.
V Conclusion
Our results demonstrate that signals from social media can lead daily financial volatility in a large proportion of the 500 stocks examined from the NASDAQ and NYSE. A total of 101 (40%) stocks from the NASDAQ and a further 91 stocks (36%) from the NYSE exhibited a statistically significant information surplus. This was found by identifying an increase in the mutual information between social and financial time series.
While our framework of analysis is closely aligned with earlier works [9], our results are novel. First, by identifying an information surplus in a large number of stocks, we found that social media has the capability to lead financial markets in a much larger segment of the market than in previous works, which only reported 12 stocks [9] of significant lead-time information.
A key aim of this work was to go beyond the determination of the predictive capability of social media and attempt to determine the configuration of features with which this occurs. Our results revealed that stocks with the highest net sentiment polarity had the highest information surpluses. Interestingly, in contrast to other works, stocks with a high information surplus did not require a high volume of messages and did not have a high average log-return. To identify this, we characterized each stock using an average representation of social and financial variables using PCA analysis, and we applied a clustering algorithm to inspect the group of stocks that exhibited the highest maximum information surplus.
In summary, we have challenged the notion of the efficient market hypothesis by examining the effect of the continuously evolving source of information embedded in social media and its effect in financial volatility. Using a method rooted in information theory, we have presented results that have identified a large set of stocks for which social media can be informative regarding financial volatility. By clustering stocks based on the joint feature sets of social and financial variables, our research has taken an important first step in characterizing the conditions under which this can be the case. The results indicate that social media is most informative about financial market volatility when the ratio of bullish to bearish sentiment is high, even when the number of messages is low. The reported results are reproducible via an open-source library, which allows the methodology outlined in this research paper to be re-used for sentiment analysis applied to finance.
Acknowledgment
This work was supported by PsychSignal for providing social media sentiment analytics data. We also thank Prof. Tomaso Aste for valuable comments provided.
References
- [1] P. C. Tetlock. Giving content to investor sentiment: The role of media in the stock market. The Journal of Finance, 62(3):1139–1168, 2007.
- [2] P. C. Tetlock, M. Saar-Tsechansky, and S. Macskassy. More than words: Quantifying language to measure firms’ fundamentals. The Journal of Finance, 63(3):1437–1467, 2008.
- [3] M. Alanyali, H. S. Moat, and T. Preis. Quantifying the relationship between financial news and the stock market. Sci. Rep., 3, 2013.
- [4] Chester Curme, Tobias Preis, H. Eugene Stanley, and Helen Susannah Moat. Quantifying the semantics of search behavior before stock market moves. Proceedings of the National Academy of Sciences, 2014.
- [5] T. Preis, D. Reith, and H. E. Stanley. Complex dynamics of our economic life on different scales: insights from search engine query data. Philosophical Transactions of the Royal Society of London A: Mathematical, Physical and Engineering Sciences, 368(1933):5707–5719, 2010.
- [6] T. Preis, H. S. Moat, and H. E. Stanley. Quantifying Trading Behavior in Financial Markets Using Google Trends. Scientific Reports, 3, April 2013.
- [7] Zhi Da, Joseph Engelberg, and Pengjie Gao. In search of attention. The Journal of Finance, 66(5):1461–1499, 2011.
- [8] J. Bollen, H. Mao, and X. Zeng. Twitter mood predicts the stock market. Journal of Computational Science, 2(1):1 – 8, 2011.
- [9] I. Zheludev, R. Smith, and T. Aste. When Can Social Media Lead Financial Markets? Scientific Reports, 4, February 2014.
- [10] T. T. P. Souza, O. Kolchyna, P. Treleaven, and T. Aste. Twitter sentiment analysis applied to finance: A case study in the retail industry. In Gautam Mitra and Xiang Yu, editors, Handbook of Sentiment Analysis in Finance, chapter 23. 2016.
- [11] T. T. P. Souza and T. Aste. A nonlinear impact: evidences of causal effects of social media on market prices. ArXiv e-prints. http://arxiv.org/abs/1601.04535, January 2016.
- [12] Eduardo J Ruiz, Vagelis Hristidis, Carlos Castillo, Aristides Gionis, and Alejandro Jaimes. Correlating financial time series with micro-blogging activity. In Proceedings of the fifth ACM international conference on Web search and data mining, pages 513–522. ACM, 2012.
- [13] O. Kolchyna, T. T. P. Souza, P. Treleaven, and T. Aste. Twitter sentiment analysis: Lexicon method, machine learning method and their combination. Handbook of Sentiment Analysis in Finance. ISBN 1910571571, 2016.
- [14] PsychSignal. The Psychsignal website. https://www.psychsignal.com, 2018. Last accessed on Oct 14, 2018.
- [15] Philip A Legg, Paul L Rosin, David Marshall, and James E Morgan. Improving accuracy and efficiency of registration by mutual information using sturges’ histogram rule. Proc. Med. Image Understand. Anal, pages 26–30, 2007.
- [16] Edward A. Dyl and George J. Jiang. Valuing illiquid common stock. Financial Analysts Journal, 64(4):40–47, 2008.
Appendix A Open Source Package
The functionality of the open source package111sentisignal package https://github.com/jonathanmanfield/sentisignal enables social-financial analytics development in Python. Tools are included for the following purposes:
-
•
web scraping of historic financial records
-
•
data fusion of social-financial databases
-
•
measuring of information surplus
-
•
statistical significance testing
-
•
cluster analysis
-
•
data visualization
Appendix B Significant Stocks Table
Tables LABEL:tb:nasdaq and LABEL:tb:nyse contain the NASDAQ and NYSE stocks that exhibit a significant leading surplus. The symbols are organized alphabetically, and the columns include the maximum surplus expressed as a percent of the above the baseline exhibited over the 10-day window. The max lag is the day when this maximum occurs (e.g. -7 one week prior). The average surplus is the expected surplus over the 10-day window. Each day with a significant leading surplus greater than 0 is tallied in the count column. The final column is the sector of the corresponding stock.
| Symbol | Max_Surplus | Max_Lag | Avg_Surplus | Count | Sector | |
| 1 | AAL | 5.98 | -7 | 0.60 | 1 | Transportation |
| 2 | ACGL | 16.46 | -10 | 5.86 | 6 | Finance |
| 3 | ACWI | 76.02 | -10 | 8.78 | 2 | n/a |
| 4 | ADBE | 23.44 | -1 | 2.34 | 1 | Technology |
| 5 | AFSI | 0.36 | -1 | 0.04 | 1 | Finance |
| 6 | AKAM | 15.02 | -1 | 1.50 | 1 | Miscellaneous |
| 7 | ANSS | 2.54 | -1 | 0.25 | 1 | Technology |
| 8 | ASML | 20.80 | -1 | 2.08 | 1 | Technology |
| 9 | BBBY | 30.15 | -1 | 3.01 | 1 | Consumer Services |
| 10 | BUFF | 8.83 | -3 | 0.88 | 1 | Consumer Non-Durables |
| 11 | CA | 149.77 | -7 | 44.00 | 7 | Technology |
| 12 | CASY | 9.28 | -1 | 0.93 | 1 | Consumer Durables |
| 13 | CDNS | 2.66 | -10 | 0.34 | 2 | Technology |
| 14 | CG | 17.93 | -2 | 4.07 | 3 | Finance |
| 15 | CINF | 22.04 | -7 | 3.01 | 2 | Finance |
| 16 | CMCSA | 6.33 | -1 | 0.63 | 1 | Consumer Services |
| 17 | CME | 16.55 | -1 | 1.65 | 1 | Finance |
| 18 | COST | 16.93 | -4 | 2.84 | 3 | Consumer Services |
| 19 | CSAL | 21.08 | -10 | 2.14 | 2 | Consumer Services |
| 20 | CSGP | 22.04 | -1 | 3.57 | 4 | Miscellaneous |
| 21 | CTAS | 28.09 | -1 | 3.81 | 2 | Consumer Non-Durables |
| 22 | CTXS | 2.61 | -1 | 0.26 | 1 | Technology |
| 23 | DISCB | 9.46 | -3 | 1.17 | 2 | Consumer Services |
| 24 | DISCK | 0.72 | -2 | 0.07 | 1 | Consumer Services |
| 25 | DOX | 52.25 | -7 | 9.85 | 5 | Technology |
| 26 | EA | 16.98 | -1 | 1.70 | 1 | Technology |
| 27 | ERIE | 3.85 | -9 | 0.38 | 1 | Finance |
| 28 | EWBC | 34.58 | -3 | 12.88 | 6 | Finance |
| 29 | FANG | 3.40 | -8 | 0.59 | 2 | Energy |
| 30 | FB | 18.25 | -1 | 1.82 | 1 | Technology |
| 31 | FFIV | 22.07 | -1 | 2.21 | 1 | Technology |
| 32 | FISV | 4.59 | -10 | 0.46 | 1 | Technology |
| 33 | FITB | 26.25 | -6 | 5.68 | 3 | Finance |
| 34 | FOXA | 13.71 | -1 | 1.37 | 1 | Consumer Services |
| 35 | FTNT | 20.34 | -1 | 2.03 | 1 | Technology |
| 36 | GLPI | 5.94 | -8 | 1.51 | 3 | Consumer Services |
| 37 | GNTX | 1.81 | -1 | 0.18 | 1 | Capital Goods |
| 38 | HAS | 30.73 | -7 | 14.56 | 6 | Consumer Non-Durables |
| 39 | HDS | 11.63 | -1 | 1.33 | 2 | Consumer Services |
| 40 | HOLX | 1.81 | -1 | 0.18 | 1 | Health Care |
| 41 | HSIC | 20.18 | -1 | 3.47 | 2 | Health Care |
| 42 | IBKR | 2.55 | -1 | 0.26 | 1 | Finance |
| 43 | INFO | 108.15 | -7 | 32.00 | 4 | Technology |
| 44 | INTU | 4.26 | -5 | 1.01 | 4 | Technology |
| 45 | JBHT | 12.73 | -1 | 1.27 | 1 | Transportation |
| 46 | JD | 38.70 | -5 | 12.18 | 6 | Consumer Services |
| 47 | JKHY | 20.47 | -8 | 4.89 | 6 | Technology |
| 48 | KLAC | 5.28 | -1 | 0.53 | 1 | Capital Goods |
| 49 | LBRDA | 14.82 | -1 | 1.57 | 2 | Consumer Services |
| 50 | LBTYA | 8.17 | -1 | 0.82 | 1 | Consumer Services |
| 51 | LBTYB | 40.41 | -7 | 12.91 | 7 | Consumer Services |
| 52 | LBTYK | 19.43 | -7 | 3.04 | 2 | Consumer Services |
| 53 | LILA | 35.42 | -10 | 3.54 | 1 | Consumer Services |
| 54 | LILAK | 39.67 | -7 | 8.16 | 3 | Consumer Services |
| 55 | LVNTA | 26.84 | -1 | 4.91 | 4 | Consumer Services |
| 56 | MAR | 27.35 | -7 | 5.02 | 2 | Consumer Services |
| 57 | MIDD | 11.30 | -1 | 1.50 | 2 | Technology |
| 58 | MNST | 13.12 | -2 | 1.31 | 1 | Consumer Non-Durables |
| 59 | MSCC | 25.80 | -7 | 5.98 | 5 | Technology |
| 60 | NTAP | 26.26 | -1 | 2.63 | 1 | Technology |
| 61 | NTRS | 11.51 | -1 | 1.15 | 1 | Finance |
| 62 | NWS | 44.64 | -4 | 11.26 | 5 | Consumer Services |
| 63 | NWSA | 3.65 | -1 | 0.36 | 1 | Consumer Services |
| 64 | ON | 24.65 | -2 | 4.50 | 2 | Technology |
| 65 | ORLY | 21.53 | -1 | 2.15 | 1 | Consumer Services |
| 66 | PACW | 4.40 | -8 | 0.44 | 1 | Finance |
| 67 | PAYX | 21.76 | -1 | 2.18 | 1 | Consumer Services |
| 68 | PBCT | 17.27 | -4 | 3.10 | 3 | Finance |
| 69 | PDCO | 34.06 | -1 | 3.93 | 2 | Health Care |
| 70 | PPC | 48.37 | -5 | 18.08 | 5 | Consumer Non-Durables |
| 71 | PYPL | 0.15 | -9 | 0.01 | 1 | Miscellaneous |
| 72 | QCOM | 21.89 | -1 | 2.19 | 1 | Technology |
| 73 | QGEN | 38.94 | -1 | 7.80 | 3 | Health Care |
| 74 | QVCA | 17.89 | -4 | 6.90 | 5 | Consumer Services |
| 75 | RYAAY | 4.68 | -6 | 0.55 | 2 | Transportation |
| 76 | SABR | 35.74 | -1 | 3.57 | 1 | Technology |
| 77 | SBAC | 17.38 | -1 | 3.00 | 2 | Consumer Services |
| 78 | SCZ | 42.50 | -7 | 8.77 | 5 | n/a |
| 79 | SIVB | 30.48 | -6 | 7.09 | 4 | Finance |
| 80 | SNH | 41.11 | -5 | 4.50 | 2 | Consumer Services |
| 81 | SNPS | 13.11 | -1 | 1.31 | 1 | Technology |
| 82 | SSNC | 18.27 | -1 | 2.93 | 3 | Technology |
| 83 | STLD | 11.49 | -6 | 1.15 | 1 | Basic Industries |
| 84 | SYMC | 1.92 | -1 | 0.19 | 1 | Technology |
| 85 | TEAM | 219.09 | -10 | 76.32 | 4 | Technology |
| 86 | TFSL | 2.09 | -1 | 0.21 | 1 | Finance |
| 87 | TROW | 2.61 | -8 | 0.52 | 3 | Finance |
| 88 | TSCO | 0.26 | -1 | 0.03 | 1 | Consumer Services |
| 89 | UHAL | 17.33 | -9 | 1.73 | 1 | Consumer Services |
| 90 | ULTI | 24.29 | -1 | 3.35 | 3 | Technology |
| 91 | VCIT | 69.82 | -8 | 13.20 | 4 | n/a |
| 92 | VIP | 9.70 | -4 | 0.97 | 1 | Public Utilities |
| 93 | VRSK | 7.91 | -6 | 0.79 | 1 | Technology |
| 94 | VRSN | 13.25 | -1 | 1.32 | 1 | Technology |
| 95 | VXUS | 11.17 | -2 | 1.71 | 3 | n/a |
| 96 | WDC | 5.33 | -1 | 0.53 | 1 | Technology |
| 97 | WFM | 53.08 | -1 | 5.31 | 1 | Consumer Services |
| 98 | WOOF | 5.13 | -8 | 0.54 | 2 | Consumer Non-Durables |
| 99 | Z | 43.88 | -1 | 17.12 | 9 | Miscellaneous |
| 100 | ZG | 85.96 | -9 | 18.36 | 4 | Miscellaneous |
| 101 | ZION | 31.92 | -1 | 3.66 | 3 | Finance |
| Symbol | Max_Surplus | Max_Lag | Avg_Surplus | Count | Sector | |
| 1 | ABB | 52.00 | -4 | 20.95 | 8 | Consumer Durables |
| 2 | ABEV | 0.71 | -1 | 0.07 | 1 | Consumer Non-Durables |
| 3 | ABT | 161.83 | -10 | 29.49 | 4 | Health Care |
| 4 | ADM | 36.02 | -10 | 3.60 | 1 | Consumer Non-Durables |
| 5 | AEP | 44.91 | -1 | 5.31 | 2 | Public Utilities |
| 6 | AFL | 17.21 | -1 | 1.72 | 1 | Finance |
| 7 | AGN | 17.41 | -6 | 2.11 | 2 | Health Care |
| 8 | ALL | 13.99 | -1 | 2.37 | 2 | Finance |
| 9 | AON | 1.84 | -1 | 0.18 | 1 | Finance |
| 10 | APC | 3.40 | -5 | 0.34 | 1 | Energy |
| 11 | APD | 5.80 | -1 | 0.58 | 1 | Basic Industries |
| 12 | AVB | 4.89 | -4 | 1.09 | 3 | Consumer Services |
| 13 | BA | 13.08 | -7 | 1.85 | 2 | Capital Goods |
| 14 | BAC | 8.54 | -1 | 0.85 | 1 | Finance |
| 15 | BAM | 3.24 | -8 | 0.32 | 1 | Consumer Services |
| 16 | BAX | 27.76 | -1 | 2.78 | 1 | Health Care |
| 17 | BBD | 3.07 | -5 | 0.31 | 1 | Finance |
| 18 | BBT | 12.70 | -1 | 1.27 | 1 | Finance |
| 19 | BBVA | 0.90 | -6 | 0.09 | 1 | Finance |
| 20 | BMO | 6.82 | -8 | 0.83 | 2 | Finance |
| 21 | BNS | 20.90 | -6 | 2.09 | 1 | Finance |
| 22 | BSBR | 8.60 | -1 | 0.86 | 1 | Finance |
| 23 | BT | 27.21 | -1 | 2.88 | 2 | Public Utilities |
| 24 | CAJ | 16.87 | -1 | 1.69 | 1 | Miscellaneous |
| 25 | CAT | 139.16 | -6 | 41.02 | 6 | Capital Goods |
| 26 | CHA | 45.38 | -1 | 20.53 | 5 | Public Utilities |
| 27 | COP | 1.84 | -7 | 0.18 | 1 | Energy |
| 28 | CRH | 11.57 | -8 | 1.16 | 1 | Capital Goods |
| 29 | CS | 10.87 | -8 | 1.24 | 2 | Finance |
| 30 | CUK | 2.56 | -3 | 0.26 | 1 | Consumer Services |
| 31 | DAL | 9.74 | -10 | 3.21 | 4 | Transportation |
| 32 | DCM | 8.48 | -6 | 0.87 | 2 | Technology |
| 33 | DHR | 2.81 | -1 | 0.28 | 1 | Capital Goods |
| 34 | DIS | 19.97 | -4 | 2.47 | 3 | Consumer Services |
| 35 | DOW | 267.29 | -6 | 87.33 | 10 | Basic Industries |
| 36 | DUK | 7.83 | -1 | 0.78 | 1 | Public Utilities |
| 37 | EMR | 17.66 | -7 | 6.15 | 7 | Energy |
| 38 | EOG | 33.09 | -9 | 5.21 | 3 | Energy |
| 39 | EPD | 16.03 | -4 | 4.25 | 4 | Public Utilities |
| 40 | FMX | 37.36 | -7 | 4.34 | 2 | Consumer Non-Durables |
| 41 | GGP | 17.05 | -10 | 2.10 | 2 | Consumer Services |
| 42 | HMC | 3.52 | -2 | 0.35 | 1 | Capital Goods |
| 43 | HPE | 44.37 | -7 | 8.20 | 3 | Technology |
| 44 | HPQ | 0.30 | -1 | 0.03 | 1 | Technology |
| 45 | HUM | 76.89 | -7 | 39.40 | 8 | Health Care |
| 46 | IBM | 26.29 | -10 | 7.16 | 4 | Technology |
| 47 | ING | 11.96 | -8 | 2.73 | 3 | Finance |
| 48 | JNJ | 12.29 | -1 | 1.23 | 1 | Health Care |
| 49 | JPM | 2.67 | -1 | 0.27 | 1 | Finance |
| 50 | KEP | 48.05 | -9 | 11.22 | 6 | Public Utilities |
| 51 | KO | 2.83 | -1 | 0.28 | 1 | Consumer Non-Durables |
| 52 | LFC | 10.22 | -5 | 2.19 | 4 | Finance |
| 53 | LYG | 11.33 | -1 | 1.13 | 1 | Finance |
| 54 | MFC | 0.03 | -1 | 0.00 | 1 | Finance |
| 55 | MFG | 4.11 | -2 | 0.41 | 1 | Finance |
| 56 | MMC | 22.17 | -3 | 4.05 | 4 | Finance |
| 57 | MMM | 5.85 | -1 | 0.59 | 1 | Health Care |
| 58 | MS | 7.49 | -1 | 0.75 | 1 | Finance |
| 59 | MTU | 35.42 | -2 | 8.86 | 6 | Finance |
| 60 | ORAN | 28.61 | -10 | 11.02 | 7 | Public Utilities |
| 61 | PCG | 9.17 | -10 | 0.92 | 1 | Public Utilities |
| 62 | PLD | 1.27 | -9 | 0.13 | 1 | Consumer Services |
| 63 | PPG | 26.29 | -5 | 3.91 | 2 | Basic Industries |
| 64 | PRU | 13.98 | -5 | 4.81 | 5 | Finance |
| 65 | PSA | 16.23 | -8 | 3.22 | 4 | Consumer Services |
| 66 | PTR | 17.52 | -8 | 3.13 | 2 | Energy |
| 67 | PUK | 37.53 | -7 | 12.24 | 5 | Finance |
| 68 | RAI | 0.71 | -1 | 0.07 | 1 | Consumer Non-Durables |
| 69 | RIO | 7.35 | -9 | 0.74 | 1 | Basic Industries |
| 70 | RTN | 15.74 | -1 | 1.57 | 1 | Capital Goods |
| 71 | SAN | 47.81 | -10 | 13.18 | 5 | Finance |
| 72 | SMFG | 124.01 | -3 | 44.31 | 6 | Finance |
| 73 | SNY | 25.29 | -9 | 5.69 | 4 | Health Care |
| 74 | SRE | 49.66 | -6 | 20.94 | 7 | Public Utilities |
| 75 | T | 13.15 | -1 | 1.31 | 1 | Public Utilities |
| 76 | TD | 6.17 | -1 | 0.62 | 1 | Finance |
| 77 | TEF | 12.43 | -3 | 1.51 | 2 | Public Utilities |
| 78 | TJX | 4.62 | -1 | 0.46 | 1 | Consumer Services |
| 79 | TLK | 28.79 | -8 | 5.21 | 2 | Public Utilities |
| 80 | TM | 28.68 | -10 | 4.72 | 3 | Capital Goods |
| 81 | TOT | 9.79 | -10 | 0.98 | 1 | Energy |
| 82 | TRP | 5.26 | -1 | 0.53 | 1 | Public Utilities |
| 83 | TRV | 54.89 | -5 | 7.85 | 2 | Finance |
| 84 | TWX | 3.11 | -1 | 0.31 | 1 | Consumer Services |
| 85 | UBS | 31.27 | -1 | 4.70 | 3 | Finance |
| 86 | UN | 12.38 | -8 | 1.96 | 2 | Basic Industries |
| 87 | VIV | 7.40 | -9 | 0.84 | 2 | Public Utilities |
| 88 | VMW | 10.31 | -1 | 1.03 | 1 | Technology |
| 89 | VTR | 12.66 | -9 | 2.66 | 3 | Consumer Services |
| 90 | WBK | 37.99 | -10 | 8.98 | 4 | Finance |
| 91 | WMT | 5.26 | -1 | 0.53 | 1 | Consumer Services |