Photometric and Spectroscopic Properties of Type Ia Supernova 2018oh with Early Excess Emission from the 2 Observations
Abstract
Supernova (SN) 2018oh (ASASSN-18bt) is the first spectroscopically-confirmed type Ia supernova (SN Ia) observed in the field. The data revealed an excess emission in its early light curve, allowing to place interesting constraints on its progenitor system (Dimitriadis et al., 2018; Shappee et al., 2018b). Here, we present extensive optical, ultraviolet, and near-infrared photometry, as well as dense sampling of optical spectra, for this object. SN 2018oh is relatively normal in its photometric evolution, with a rise time of 18.30.3 days and m0.03 mag, but it seems to have bluer colors. We construct the “uvoir” bolometric light curve having peak luminosity as 1.491043erg s-1, from which we derive a nickel mass as 0.550.04M⊙ by fitting radiation diffusion models powered by centrally located 56Ni. Note that the moment when nickel-powered luminosity starts to emerge is +3.85 days after the first light in the data, suggesting other origins of the early-time emission, e.g., mixing of 56Ni to outer layers of the ejecta or interaction between the ejecta and nearby circumstellar material or a non-degenerate companion star. The spectral evolution of SN 2018oh is similar to that of a normal SN Ia, but is characterized by prominent and persistent carbon absorption features. The C II features can be detected from the early phases to about 3 weeks after the maximum light, representing the latest detection of carbon ever recorded in a SN Ia. This indicates that a considerable amount of unburned carbon exists in the ejecta of SN 2018oh and may mix into deeper layers.
Fmi
T. Zhang D. A. Howell
A. Rest G. Dimitriadis [0000-0003-4631-1149]B. J. Shappee
S. J. Smartt K. Sárneczky , P. Milne
P. J. Brown J. Nordin J. J. Hermes J. L. Tonry
G. Barentsen J. Coughlin
1 Introduction
Type Ia supernovae (SNe Ia) have been used as standardizable candles for measuring cosmic expansion, leading to the discovery of accelerating expansion of universe and hence the “mysterious” dark energy (Riess et al., 1998; Perlmutter et al., 1999). However, the exact nature of their progenitor systems is still highly controversial (Wang et al., 2013; Maoz et al., 2014). Two popular scenarios have been proposed so far for SN Ia progenitors. One is an explosion of a carbon-oxygen (CO) WD that accretes hydrogen-rich or helium-rich materials from a non-degenerate companion that could be a main-sequence star, a redgiant, or even a helium star (Whelan & Iben, 1973; Nomoto, 1982; Nomoto et al., 1997), this single degenerate (SD) scenario is favored by possible detections of circumstellar material (CSM) around some SNe Ia (Hamuy et al., 2003; Aldering et al., 2006; Patat et al., 2007; Sternberg et al., 2011; Dilday et al., 2012; Maguire et al., 2013; Silverman et al., 2013). It is disfavored by the lack of narrow hydrogen emission lines in late-time spectra (Mattila et al., 2005; Leonard, 2007; Shappee et al., 2013; Maguire et al., 2016). The other scenario involves merging explosion of two WDs, dubbed as double degenerate (DD) scenario (Iben & Tutukov, 1984; Webbink, 1984). The DD model has recently gained more attention due to the observational findings that there are no companion signatures for some SNe Ia, including the nearby object SN 2011fe and the supernova remnant SN 1006 and SNR 0509-67.5 in LMC, down to the luminosity that is much fainter than the Sun (Li et al., 2011; González Hernández et al., 2012; Schaefer & Pagnotta, 2012). Some population synthesis calculations predict delay time distributions (DTD) shapes for the birthrate of SNe Ia in the DD scenario, which are consistent with observations (Mennekens et al., 2010; Toonen et al., 2012).
SNe Ia also show increasing diversity in their spectroscopic and photometric properties. For instance, the so-called high velocity (HV) subclass are found to have larger ejecta velocities, redder peak colors, and slower late-time decline rates at bluer wavelength than those with normal ejecta velocities (Wang et al., 2008, 2009b; Foley & Kasen, 2011; Foley et al., 2011; Foley, 2012; Mandel et al., 2014). The observed differences between the HV and normal SNe Ia have been interpreted as a geometric consequence of asymmetric explosions (Maeda et al., 2010; Maund et al., 2010). However, the fact that the HV subclass tend to be associated with more metal-rich and more luminous stellar environments indicates that SNe Ia likely arise from more than one progenitor population (Wang et al., 2013).
Very early observations of SNe Ia can provide clues to distinguish different progenitor models. According to the theoretical analysis by Kasen (2010), the collision between the material ejected by the supernova and a non-degenerate companion star will produce extra emission leading to a “bump” feature in the early time light curves. This amount depends on the viewing angle, companion size and separation. Possible detections of such bump features have been reported for SNe 2012cg (Marion et al. 2016 although see Shappee et al. 2018a), iPTF14atg (Cao et al., 2015), iPTF16abc (Miller et al., 2018) and SN 2017cbv (Hosseinzadeh et al. 2017 although see Sand et al. 2018), indicating that they might have SD progenitor systems. Of these, iPTF14atg is a peculiar low luminosity supernova like SN 2002es (Ganeshalingam et al., 2012), and is not representative of normal SNe Ia. Miller et al. (2018) suggested the early flux of iPTF16abc can be explained by the collision of the SN with nearby material and/or strong mixing of 56Ni in the SN ejecta. For SN 2017cbv, however, the collision of SN ejecta with a non-degenerate companion star matches well with the optical observations but overpredicts the UV flux.
The Kepler Space Telescope, observing with a time resolution of 30 minutes, can be an extremely powerful tool for finding excess early time emission (Haas et al., 2010). Olling et al. (2015) studied the Kepler light curves of 3 SNe Ia, and they found no signatures of ejecta-companion interaction in the early phase of the explosions. This is consistent with DD models. However, further studies of these SNe were limited by the lack of prompt follow up observations by other facilities.
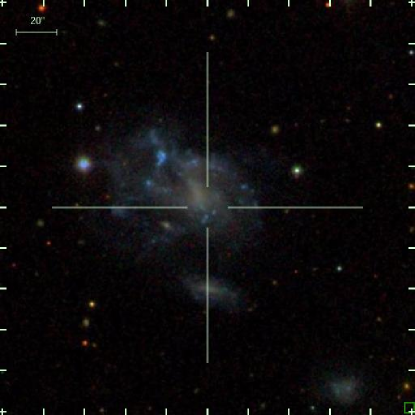
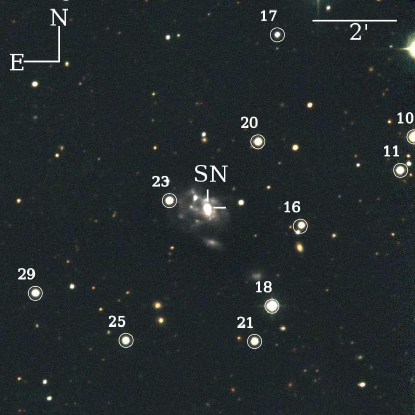
SN 2018oh (ASASSN-18bt), a type Ia supernova in the face-on spiral galaxy UGC 4780 (see Figure 1) at a distance of about Mpc (z0.0109), provides us a rare opportunity to examine the progenitor of a SN Ia system through the observed properties based on both continuous Kepler data and extensive follow up observations. This supernova was discovered by the All Sky Automated Survey for SuperNovae (ASAS-SN; Shappee et al., 2014) on 2018 February 4.41 (UT time is used throughout this paper) at R.A. , decl. (Brown et al., 2018; Shappee et al., 2018b), located at 2′′.0 east and 7′′.8 north of the center of UGC 4780. It was soon identified as a normal SN Ia at about 10 days before the maximum light (Leadbeater, 2018; Zhang et al., 2018). ASAS-SN monitors the K2 fields at heightened cadence to help identify such SN at the earliest possible phases for detailed study. The excess flux above a quadratic rise detected in the early rising phase of the Kepler light curve cannot be well modeled as a single power law. This is alternately explained as the collision of the SN ejecta with a non-degenerate 1-6 M⊙ Roche-lobe-filling star at 2 1012 cm (Dimitriadis et al. 2018 but see the caveats in Shappee et al. 2018b).
In this paper we present extensive follow-up observations of SN 2018oh in optical, ultraviolet (UV) and near-infrared (NIR) bands, and analyze its observational properties and explosion parameters in contrast to other well-studied SNe Ia. The observations and data reductions are described in Section 2, Section 3 presents the light/color curves, and Section 4 presents the spectral evolution. We discuss the properties of SN 2018oh and its explosion parameters in Section 5. The conclusions are summarized in Section 6.
2 OBSERVATIONS
2.1 Photometry
After the discovery of SN 2018oh and the recognition that it would have a Kepler light curve, follow-up photometric observations started immediately using more than a dozen of telescopes, including: (1) the 0.8 m Tsinghua-NAOC Telescope (TNT) in China (Huang et al., 2012); (2) the 2.4 m Lijiang Telescope (LJT) of Yunnan Astronomical Observatory (YNAO) in China (Fan et al., 2015); (3) the Las Cumbres Observatory (LCO) 1 m telescope network (Brown et al., 2013); (4) Pan-STARRS1 survey (PS1) telescopes (Chambers et al., 2016); (5) Swope 1.0-m telescope at Las Campanas Observatory; (6) DEMONEXT 0.5 m telescope (Villanueva et al., 2018); (7) the 0.61-m at Post Observatory (PONM), Mayhill, NM; (8) the 60/90cm Schmidt-telescope on Piszkéstető Mountain Station of Konkoly Observatory in Hungary; (9) the Gemini 0.51 m telescope at the Winer Observatory; (10) CTIO 4-m Blanco telescope with DECam (Honscheid et al., 2008; Flaugher et al., 2015); (11) the 0.51-m T50 at the Astronomical Observatory of the University of Valencia in Spain and (12) the 0.6-m Super-LOTIS (Livermore Optical Transient Imaging System; Williams et al., 2008) telescope at Kitt Peak Steward Observatory. Broadband - and Sloan -band photometry were obtained with all these telescopes except for the 60/90cm Schmidt-telescope of Konkoly Observatory, and the 0.6-m Super-LOTIS telescope which both used the bands. Observations made with LCO 1 m telescope and Swope also used the and band, respectively.
All CCD images were pre-processed using standard IRAF111IRAF is distributed by the National Optical Astronomy Observatories, which are operated by the Association of Universities for Research in Astronomy, Inc., under cooperative agreement with the National Science Foundation (NSF). routines, including bias subtraction, flat fielding and the removal of cosmic rays. No template subtraction technique was applied in measuring the magnitudes as the SN was still relatively bright in preparations of this work. We performed point-spread-function (PSF) photometry for both the SN and the reference stars using the pipeline developed for automatic photometry on TNT, LJT, LCO, DEMONEXT, PONM, Gemini and T50 images (Mo et al. in prep.). This pipeline was modified to analyze the data obtained with the other telescopes involved in our study. All Swope imaging was processed using photpipe (Rest et al., 2005, 2014).
The instrumental magnitudes of the supernova were converted into the standard Johnson (Johnson et al., 1966), Kron-Cousins (Cousins, 1981) and Sloan systems using observations of a series of Landolt (1992) and SDSS/PS1 (Chambers et al., 2016; Flewelling et al., 2016; Magnier et al., 2016; Waters et al., 2016; Albareti et al., 2017) standard stars on a few photometric nights. We transformed the PS1 -band magnitudes to the Swope natural system (see, e.g., Contreras et al., 2010; Krisciunas et al., 2017) using Supercal transformations as described in Scolnic et al. (2015). The filter transmission curves of different telescopes are displayed in Figure LABEL:filter, which are not far from the standard ones. These filter transmissions are multiplied with the CCD quantum efficiency and atmospheric transmission when the information of the latter two is available. The Astrodon filters are used by PONM and Gemini observations. Tables 1 and 2 list the standard and magnitudes of the comparison stars. The photometric results for the different photometric systems are consistent to within 0.05 mag after applying the color-term corrections. As the instrumental responses from the different photometric systems do not show noticeable differences, as shown in Figure LABEL:filter, we did not apply additional corrections (i.e., S-corrections) to the photometry due to the lack of telescope information such as CCD quantum efficiency and the mirror reflectivity for some telescopes. The final calibrated magnitudes are presented in Table 3.
The near-infrared (NIR) photometry of SN 2018oh was obtained with two telescopes, the 3.6-m ESO New Technology Telescope (NTT) with SOFI and the 1.3-m CTIO telescope with ANDICAM. The -band photometry from the NTT was reduced using the SOFI reduction pipeline and calibrated against the 2MASS stars in the field. The -band images obtained with the CTIO 1.3-m telescope, were first subtracted with the sky background and then reduced with SExtractor Bertin & Arnouts (1996). Magnitudes were then calibrated with the 2MASS catalogue in bands and with the Pan-STARRS catalogue in band.
SN 2018oh was also observed with the Ultraviolet/Optical Telescope (UVOT; Roming et al., 2005) onboard the (; Gehrels et al., 2004). The space-based observations were obtained in uvw1, uvm2, uvw2, , , and filters, starting from 2018 Feb.05.4. The Swift/UVOT data reduction is based on that of the Swift Optical Ultraviolet Supernova Archive (SOUSA; Brown et al., 2014). A 3″ aperture is used to measure the source counts with an aperture correction based on an average PSF. Magnitudes are computed using the zeropoints of Breeveld et al. (2011) for the UV and Poole et al. (2008) for the optical and the 2015 redetermination of the temporal sensitivity loss. Table 5 lists the final background-subtracted UVOT UV/optical magnitudes. The instrumental response curves of the UVOT and band are similar with standard Johnson and band. Therefore our ground-based and photometry of these two bands can be compared directly. Note that some differences exist between the U-band observations of UVOT and LCO due to different transmission curves (see Figure LABEL:filter).
2.2 Spectroscopy
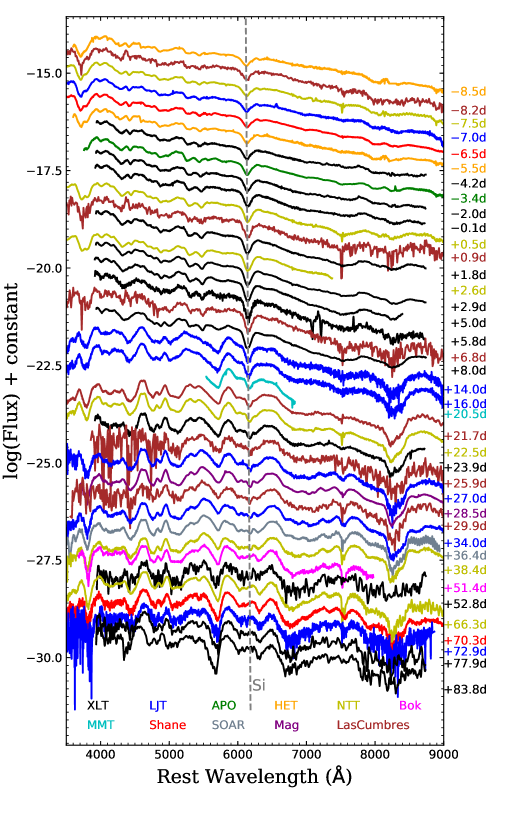
A total of 56 optical spectra were obtained from the Xinglong 2.16-m telescope (+BFOSC), the Lijiang 2.4-m telescope (+YFOSC), the Lick 3-m Shane telescope (+KAST; Miller & Stone, 1993), the SOAR 4.1-m telescope (+Goodman Spectrograph; Clemens et al., 2004), the Bok 2.3-m telescope, the HET 10-m telescope (+LRS2; Chonis et al., 2016), the MMT 6.5-m telescope, the Magellan 6.5-m telescope, the Las Cumbres Observatory 2.0-m telescopes (+FLOYDS), NTT (+EFOSC2; Buzzoni et al., 1984; Smartt et al., 2015)222NTT spectra were reduced using the PESSTO pipeline (Smartt et al., 2015). and the APO 3.5-m telescope (+DIS). These spectra covered the phases from 8.5 days to +83.8 days after the maximum light. A log of the spectra is listed in Table 6. All spectra were reduced using standard IRAF routines. Flux calibration of the spectra was performed using spectrophotometric standard stars observed at similar airmass on the same night as the SN. The spectra were corrected for atmospheric extinction using the extinction curves of local observatories; and in most cases the telluric lines were removed. All the spectra presented in this paper will be made available via WISeREP (Yaron & Gal-Yam, 2012).
2.3 K2 photometry
We performed an independent photometric analysis on the Kepler long-cadence imaging data by involving the FITSH package (Pál, 2012) and using our former experience on photometry of stars appearing in the vicinity of background galaxies (Molnár et al., 2015). Astrometric jitters were derived using a dozen of nearby K2-stamps (see also Molnár et al., 2015; Pál et al., 2015), and the derived information is used afterwards to perform frame registration at sub-pixel level with an effective pixel scale of 1.0”/pixel. Pre-explosion images with small pointing errors were used to construct a background reference image prior to applying image subtraction. This construction is based on median averaging of the first 400 frames that were taken days before the explosion. During the subsequent differential aperture photometry, this median-combined image was used as a template frame. In order to correct for various systematic effects, including instrumental artifacts and intrinsic background-level variations such as the rolling band issue (see e.g. Shappee et al., 2018b), we performed an additional background estimation on the subtracted images. Finally, the background-subtracted instrumental light curve was calibrated to physical units by comparing with synthetic photometry computed with the SNCOSMO code (Barbary et al., 2016). This was obtained using the Kepler bandpass on the extended SALT2-templates with the light curve parameters derived in Section 3.3. The resulting K2 light curve agreed well within the error bars of those presented in Dimitriadis et al. (2018) and Shappee et al. (2018b).
3 Light Curves
3.1 UV/Optical Light Curves
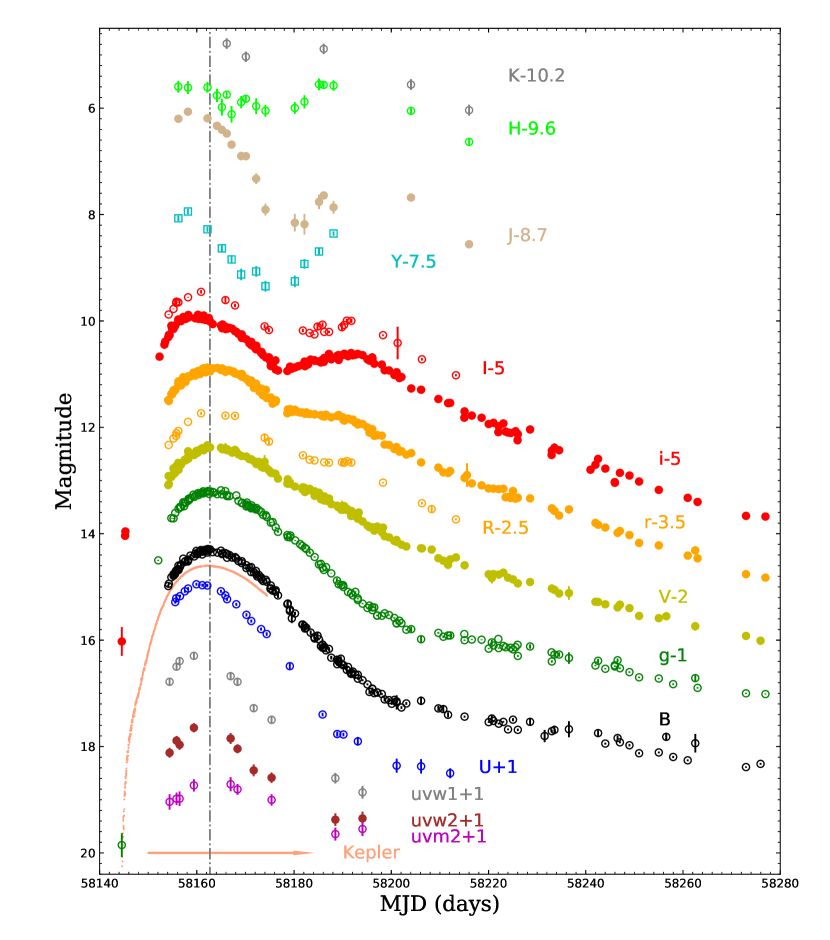
Figure 3 and 5 shows the optical, UV, and NIR light curves of SN 2018oh. The optical light curves have a nearly daily cadence from 10 days before to about 100 days after maximum light of band. The earliest detections of this SN can be actually traced back to the PS1 images taken on 2018 Jan. 26.56, corresponding to 18.1 days relative to the peak, when the and band magnitude were 20.850.22 and 21.030.27, respectively. We take MJD 58144.370.04 as the explosion time, which is the average of the values adopted in Dimitriadis et al. (2018) and Shappee et al. (2018b). Like other normal SNe Ia, the light curves of SN 2018oh show prominent shoulders in the bands and secondary peaks in and NIR bands, and they reached their peaks slightly earlier in -, - and -band relative to the -band.
Using a polynomial fit to the observed light curves, we find that SN 2018oh reached peak magnitude of = 14.310.03 mag and = 14.370.03 mag on MJD 58162.70.3 (2018 February 13.7) and 58163.70.3, respectively. The post-maximum decline rate in the band, (B) is 0.960.03 mag. The results for all the band light curves are reported in Table 7. Results from standard light curve models like MLCS2k2 (Jha et al., 2007), SALT2 (Guy et al., 2010), and SNooPy2 (Burns et al., 2011) will be used to derive the distance to the SN and discussed in §3.3.
In Figure 4, we compare the light curves of SN 2018oh with other well-observed SNe Ia that have similar (B). The comparison sample includes SN 2002fk (m15(B) = 1.020.04 mag, Cartier et al. (2014)), SN 2003du (m15(B) = 1.020.03 mag, Stanishev et al. (2007)), SN 2005cf (m15(B) = 1.070.03 mag, Wang et al. (2009a)), SN 2011fe (m15(B) = 1.100.02 mag, Munari et al. (2013)), SN 2012cg ((B) = 1.040.03, Munari et al. (2013)), SN 2013dy ((B) = 0.920.03, Pan et al. (2015)), and SN 2017cbv ((B) = 1.060.03, Hosseinzadeh et al. (2017)). The morphology of the light curves of SN 2018oh closely resembles to that of SN 2003du and SN 2013dy, with (B) lying between these two comparison SNe Ia.
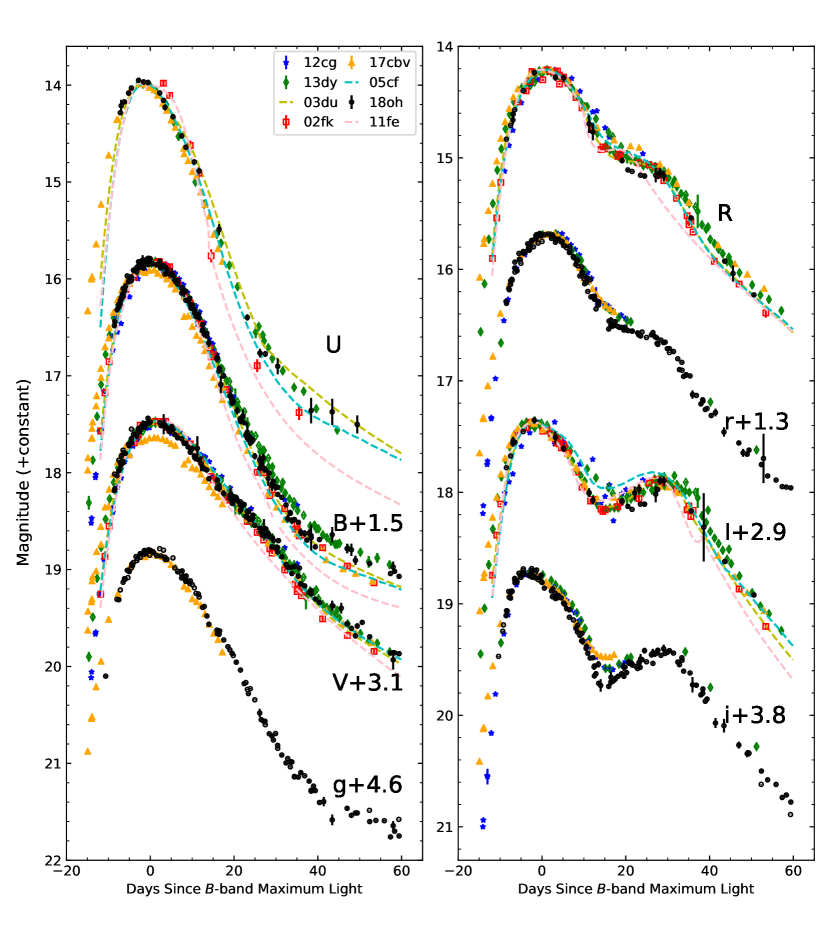
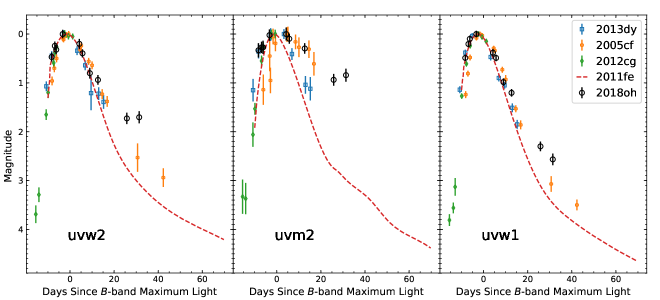
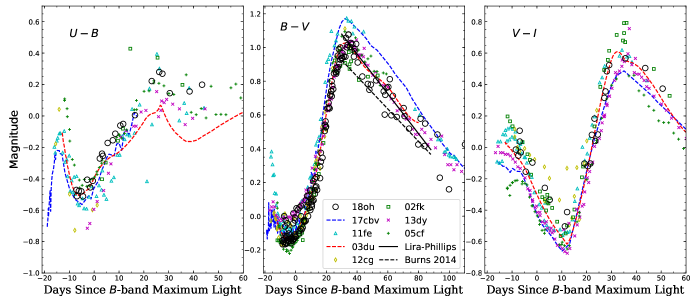
Figure 6 shows that the optical color evolution of SN 2018oh is similar to that of the comparison sample. At t 10 days, both the and colors become progressively red until t4-5 weeks after the maximum light; the color initially becomes bluer until t+10 days and it then turns redder, reaching the reddest color at t+35 days. After t+35 days, both the and curves colors become bluer. In the very early phases (at t14 days), however, the color evolution of the SN is scattered. For instance, SN 2011fe evolved from very red colors towards blue ones, while SN 2017cbv (and perhaps SN 2012cg) shows the opposite trend. Bluer colors seen in the early phase of some SNe Ia have been interpreted as a result of interactions between the ejecta and a companion star, supporting SD progenitor scenario (Brown et al., 2012; Marion et al., 2016; Hosseinzadeh et al., 2017). It is not clear whether SN 2018oh had such blue colors due to the lack of color information at very early times. SN 2018oh shows relatively bluer colors than the comparison SNe Ia, but it is redder in the and colors. The slightly redder color seen in SN 2018oh could be related to stronger Ca II H&K and iron-group elements (IGEs) absorption at shorter wavelengths. We do not show the -band color evolution due to the lack of data in these bands for most of our comparison sample, but SN 2018oh shows a similar evolutionary trends to SN 2017cbv in its and colors at comparable phases. Dimitriadis et al. (2018) show the very early color and conclude that before t10 days SN 2018oh looks bluer than SN 2011fe and is similar to SN 2017cbv.
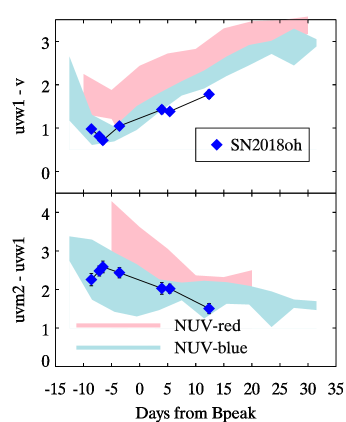
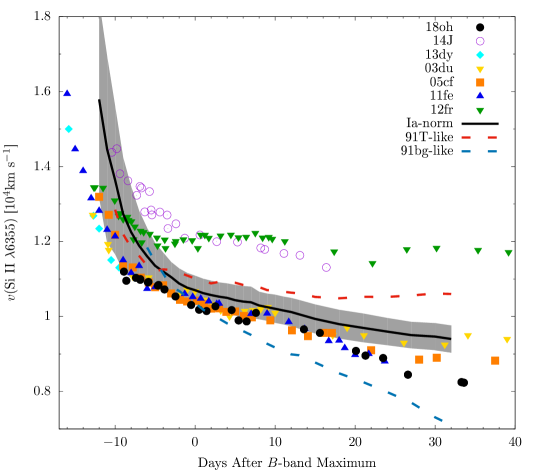
Milne et al. (2013) found that the near-ultraviolet (NUV) colors of SNe Ia can be divided into NUV-blue and NUV-red groups. We compare SN 2018oh with these two groups in Figure 7. As shown in Figure 7, SN 2018oh belongs to the NUV-blue group, consistent with the finding of Milne et al. (2013) that the detection of C II (see 4.3) is common among the NUV-blue SNe Ia and rare amongst NUV-red SNe Ia. SN 2018oh has normal velocity and low velocity gradient of Si II 6355 absorption feature which also follows the same trend as the NUV-blue group (Milne et al., 2013). These groupings (or the positions of SNe along a continuum of NUV colors) are affected by reddening but are still present for SNe Ia with low reddening (Brown et al., 2017).
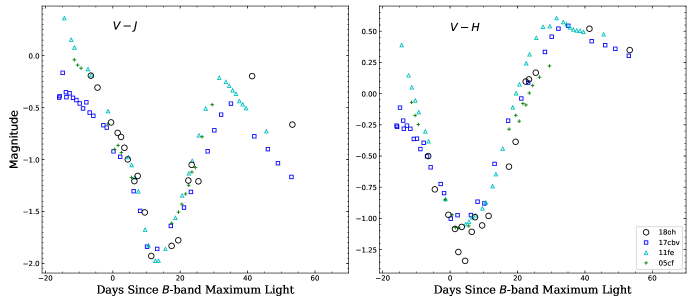
We also compare the color evolution of SN 2018oh with SN 2005cf (Wang et al., 2009a), SN 2017cbv (Wang L et al. in prep.) and SN 2011fe (Matheson et al., 2012) in the NIR bands, as shown in Figure 8. SN 2017cbv is bluer in both NIR colors before maximum. SN 2018oh is bluer around maximum in . The last two points of SN 2018oh are significantly redder than the others.
3.2 Reddening Correction
The Galactic extinction towards SN 2018oh is estimated as (Gal) = 0.124 mag (Schlafly & Finkbeiner, 2011), corresponding to 0.040 mag for a Cardelli et al. (1989) extinction law with = 3.1. As SN 2018oh appears close to the projected center of its host galaxy, it is necessary to examine the reddening due to the host galaxy. After corrections for the Galactic extinction, the colors at peak and at t = +35 days are found to be 0.10 0.03 mag and 1.02 0.04 mag, respectively, which are consistent with typical values of unreddened SNe Ia with comparable (B) (Phillips et al., 1999; Jha et al., 2007; Wang et al., 2009a; Burns et al., 2014). Similarly, if we fit the evolution over the phases from t = 30 to 90 days past the peak ( relation, Phillips et al., 1999) using Burns et al. (2014), we derive a reddening of 0.060.04 mag and 0.060.04 mag, respectively. Finally, we did not find any evidence for Na I D (5890) absorption due to the host galaxy. We thus conclude that there is no significant host-galaxy extinction, even though the SN is located near the projected center of its host galaxy.
3.3 Light Curve Fitting
We adopt SALT 2.4 (Betoule et al., 2014) as our primary LC-fitter because it has the most flexibility in fitting multi-band light curves taken in different photometric systems, and the most recent calibrations include the dependence on the host galaxy stellar mass. We also use the SNooPy2 (Burns et al., 2011) and MLCS2k2 (Jha et al., 2007) to verify the distances (see also in Vinko et al., 2018).
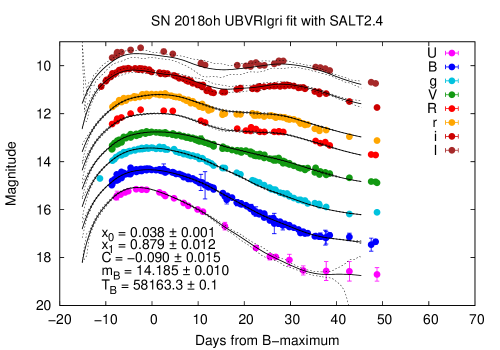
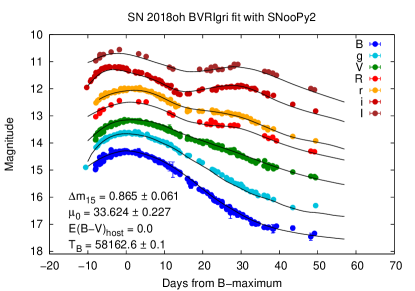
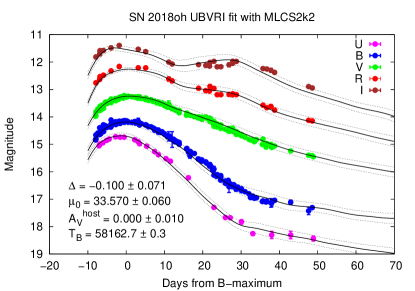
The final, best-fit results are shown in Figure 9 and 10. Table 8 summarizes the LC parameters and the inferred distance moduli. The distance modulus from the SALT 2.4 best-fit parameters are derived using the calibration by Betoule et al. (2014). The stellar mass of the host of SN 2018oh (UGC 04780) is (see Section 5.1), is taken into account as a “mass-step” correction of mag in the Betoule et al. (2014) calibration. The distance moduli listed in the last row in Table 8 are brought to a common Hubble constant of kms-1Mpc-1 (Riess et al., 2016, 2018).
It is readily seen that the distances from the three independent LC-fitting codes are in excellent agreement. We adopt the SALT 2.4 distance modulus of mag, corresponding to Mpc as the final result in our following analysis.
4 Optical spectra
Figure 11 displays the spectral evolution of SN 2018oh. The earlier spectra are dominated by absorption features of Si, Ca, S, and Fe. Near maximum light, the spectral evolution follows that of a normal SN Ia, with the distinctive “W”-shaped S II lines near 5400 Å, the blended lines of Fe II and Si II near 4500 Å, and the prominent Ca II absorption feature near 8300 Å, respectively. A weak absorption feature that can be attributed to C II 6580 is seen on the red edge of Si II 6355 absorption feature for a long time (see discussions in Section 4.3). We discuss the spectral evolution of SN 2018oh in detail in the following subsections.
4.1 Temporal Evolution of the Spectra
In Figure LABEL:spec_com, we compare the spectra of SN 2018oh with those of SNe Ia having similar decline rates at several epochs. The earliest spectrum of SN 2018oh was taken at t9.0 days. Figure LABEL:spec_com (a) compares this spectrum with other SNe Ia at similar phases. The prominent features include Ca II H&K/Si II 3858, the “W”-shaped S II lines, and Si II 6355 absorption features. Other features include Si II 4130, Fe II 4404/ Mg II 4481, Si II 5051/Fe II 5018, Fe III 5129. The minor absorption neighbouring with Si II 4130 can be due to C II 4267. The absorption feature appearing on the right edge of S II doublet, also visible in all of our comparison SNe Ia, is not presently identified. For SN 2018oh, the absorption due to Si II 5958, 5979 seems to be weaker than in SN 2011fe, SN 2003du, and SN 2005cf, but is comparable to that in SN 2012cg and SN 2013dy. The strength of Fe III 5129 for SN 2018oh follows the same manner as Si II 5958, 5979 relative to the comparison SNe Ia. A smaller line-strength ratio of Si II 5958, 5979 to Si II 6355, known as (Si II), indicates a relatively higher photospheric temperature for SN 2018oh (Nugent et al., 1995). Recently, Stritzinger et al. (2018) found that SNe Ia exhibiting blue colors in very early phase all belong to the shallow silicon (SS) subtype among Branch’s classification scheme(Branch et al., 2006), i.e., SNe 2012cg, 2013dy, and 2017cbv. The pseudo-equivalent widths (pEWs) of Si II5972, 6355 measured near the maximum light for SN 2018oh are 79Å and 8Å, respectively, suggesting that it can be also put into the SS subgroup or at least locates near the boundary between SS and core-normal subgroups. At about one week before the maximum light, absorption features of C II 7234 and O I 7774 are not prominent in SN 2018oh and the comparison SNe Ia except for SN 2011fe which had more unburned oxygen in the ejecta. A detached high-velocity feature (HVF) can be clearly identified in the Ca II NIR triplet absorption features, and its relative strength is similar to that seen in SN 2013dy but weaker than SN 2005cf and SN 2012cg. A weak HVF of Si II 6355 is also visible in SN 2018oh and the comparison SNe Ia but not in SN 2011fe.
Figure LABEL:spec_com (b) compares the near-maximum spectra. At this phase, the spectrum of SN 2018oh has evolved while maintaining most of its characteristics from the earlier epochs. The weak features (e.g., Si II 4130, Si III 4560, and the S II “W”) become more prominent with time, as also seen in the comparison SNe Ia. The C II absorption features are still clearly visible near 6300Å and 7000Å in the spectrum of SN 2018oh around maximum light, while they are barely detectable in other SNe Ia at this phase except for SN 2002fk. The O I 7774 line gains in strength for all the SNe, and the absorption at 7300Å might be due to an O I HVF. By t0 days, the relative strength of the two absorption components of the Ca II NIR triplet evolve rapidly, with the blue component (HVF) becoming weak and the red (photospheric) component becoming gradually strong and dominant. At this phase, the (Si II) parameter is measured as 0.150.04, which suggests a high photospheric temperature and high luminosity. This is consistent with a smaller decline rate that is characterized by an intrinsically more luminous Type Ia SN.
At about 1 week after maximum light, most of the spectral features show no obvious evolution relative to those seen near the maximum light, as seen in Figure LABEL:spec_com (c). We note that the absorption near 5700Å becomes stronger in all of our sample, which is likely due to the contamination of Si II 5972 by Na I that gradually develops after maximum light. For SN 2018oh, the most interesting spectral evolution is that the C II 6580Å absorption gains in strength during this phase, which has never been observed in other SNe Ia. Moreover, the C II 6580 absorption can even be detected in the t 20.5 day spectrum, which is unusually late for a normal SN Ia. The spectral comparison at t 1 month is shown in Figure LABEL:spec_com (d), where one can see that SN 2018oh exhibits spectral features very similar to other SNe Ia in comparison. With the receding of the photosphere, the Fe II features are well developed and become dominant in the wavelength range from 4700 Å to 5000 Å. By a few weeks after maximum, the region of Si II 5972 is dominated by Na I absorption, and the Si II 6355 absorption trough is affected by Fe II 6238, 6248 and Fe II 6456, 6518. Although the Ca II NIR triplet shows the most diverse features in the earlier phases, they develop into an absorption profile that is quite smooth and similar to comparison sample at this time.
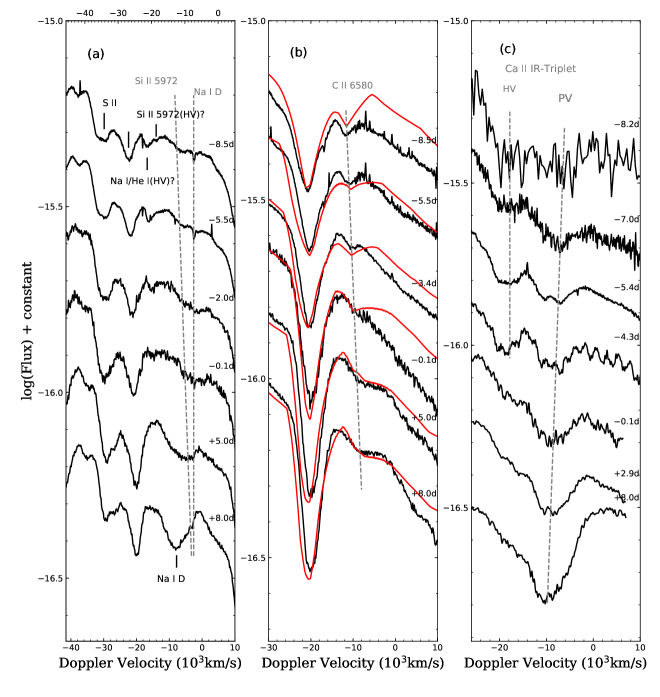
Figure 13 presents the detailed evolution of “W-shaped” S II, Si II 5972, Si II 6355, C II 6580, and Ca II NIR triplet for SN 2018oh. This evolution is shown in a velocity space. The left panel shows the line profile of S II 5460, 5640 and Si II 5972. One notable feature is the asymmetric absorption trough near 5500Å where there is a notch on the red wing. This notch feature is likely a detached high-velocity component of Si II 5972, since it has a velocity of 19,000 km s-1 comparable to that of the HVF of Si II 6355 and it became weak and disappeared in the spectra simultaneously with the Si II 6355 HVF. The absorption feature at 5500Å has not been identified but could be due to an Na I/He I HVF with a velocity at around 17,500 km s-1. Figure 13 (b) shows the velocity evolution of Si II 6355 and the neighboring C II 6580 feature. The HVF of Si II 6355 is visible in the two earliest spectra and it disappeared in the later ones. The presence of C II 6580 is obvious, as also illustrated by the SYNOW (Fisher et al., 1997) fit (the red curves). The C II 6580 feature decreased in strength from t = 8.5 d to t = 0 d, and it then became wider and stronger in the first week after the peak. Such an evolution is unusual for a SN Ia and it is perhaps related to the interaction of the ejecta with the companion star or CSM. The evolution of the Ca II NIR triplet absorption feature is presented in Figure 13 (c). In the Ca II NIR triplet, the HVF component is more separated from the photospheric component than in the Si II line, and it dominates at earlier phases but gradually loses its strengths with time.
4.2 High Resolution Spectra
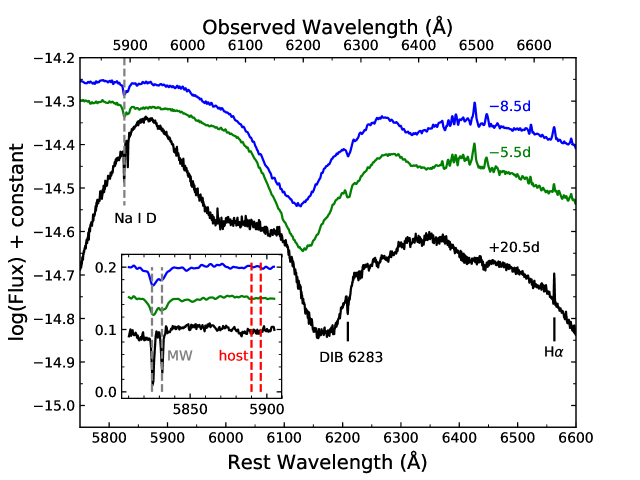
A few spectra presented in this paper were observed with higher resolutions, i.e., the two HET spectra taken at 8.5d and 5.5d and the MMT spectrum taken at +20.5d. These spectra are shown in Figure 14, where we can see some narrow spectral features that are barely visible in other low-resolution spectra. One can see that the absorption by Na I D and the diffuse interstellar band (DIB) at 6283 from the Milky Way are clearly visible in the high resolution spectra, consistent with the presence of a modest level of Galactic reddening. There are some minor absorption features in the red wing of Si II 6355, which may also be related to unidentified DIBs. A few SNe have been reported to have host-galaxy DIB detections in their spectra (D’Odorico et al., 1989; Sollerman et al., 2005; Cox & Patat, 2008; Phillips et al., 2013; Welty et al., 2014). The absence of Na I D and DIB absorption components from UGC 4780 is consistent with that SN 2018oh suffering negligible reddening within the host galaxy. A weak, narrow emission that is likely from the host galaxy feature can be clearly seen in both the HET and MMT spectra.
4.3 Carbon Features
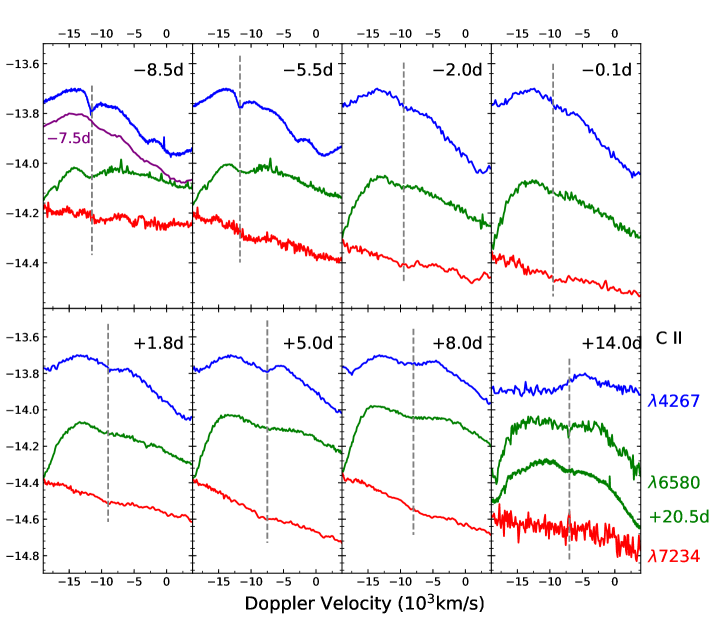
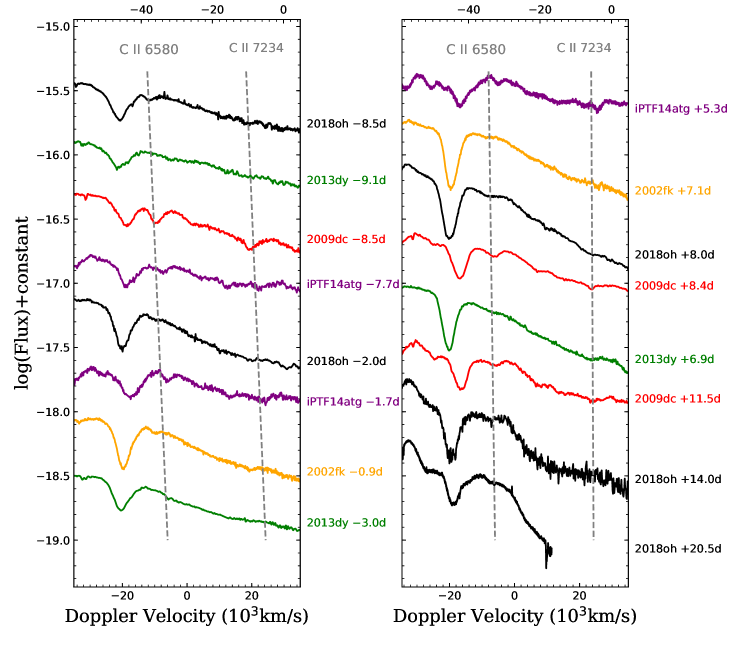
C II features are clearly detected in SN 2018oh, and they seem to persist for an unusually long time compared to other known SNe Ia. As shown in Figure 15, the C II 6580 absorption feature can be detected in the spectra from t = 8.5 to t = +20.5 days. And the C II 4267 and C II 7234 absorptions are also detectable in the spectra from t =8.5 day to t =+8.0 days333Note that there is an instrumental trough around 4150 in the HET spectra, which nearly coincides with the expected position of the C II 4267 feature and this makes it difficult to judge whether the presence of this feature is real or not. Nevertheless, a weak C II 4267 feature can be still identified in the 7.5d spectrum taken by NTT as shown in the left-top panel of Figure 15. Identifying these carbon features is justified by the agreement in velocity at early phases (see Figure 15) and the SYNOW spectral models. It should be noted that the SYNOW velocities shown in Figure 13 are higher than the measured values by 2000 km s-1 (see Table 9). This offset is due to low optical depths at the line centers in the SYNOW fits producing a steep drop in optical depths bluewards of the best fit velocity, resulting in minimal absorption bluer than the line center, which shifts the apparent minimum in the line profile.
Silverman & Filippenko (2012) measured the velocity ratio between C II 6580 to Si II 6355 and found a median value of 1.05 at phases earlier than 4 days from maximum. For SN 2018oh, this ratio is 1.051.00 at t4 days, consistent with Silverman & Filippenko (2012). However, the C/Si velocity ratio keeps decreasing after t4d and reaches about 0.85 0.06 at t+20.5 days for SN 2018oh, which suggests that unburned carbon may be more strongly mixed than silicon and extends deep into the ejecta.
Folatelli et al. (2012) calculate the pseudo-equivalent width (pEW) evolution of C II 6580 using SYNOW synthetic spectra with different unburned carbon mass. The pEW is found to grow monotonically with the mass of carbon. For SN 2018oh, the C II 6580 absorption has a pEW 4Å and 2Å around 4.3d and 2.0d, respectively, which is very similar to that of the synthetic spectra with 0.03 M⊙ of unburned carbon in the ejecta.
4.4 Ejecta Velocity
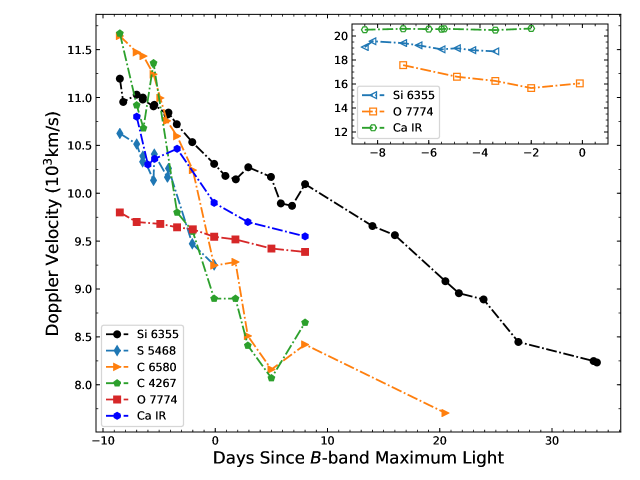
We measured the ejecta velocities from the blueshifted absorption features of Si II 6355, S II 5468, C II 6580, C II 7234, O I 7774, and the Ca II NIR triplet lines, and the velocity evolution is shown in Figure 16. All velocities have been corrected for the host galaxy redshift. The photospheric velocity of Si II 6355, characterized by a linear decline from 11,000 km s-1 to 8000 km s-1, is comparable to that of other intermediate-mass elements at similar phases. Assuming a homologous expansion of the ejecta, this indicates a complex distribution of carbon in the ejecta. However, it is possible that the position of C II 6580 absorption in late-time spectra might be contaminated by other unknown elements. The best-fit C II velocities from SYNOW show an offset by 2000 km s-1 relative to the measured values, and this suggests that carbon is detached until +5 days from the maximum light. After that, the SYNOW velocity of C II becomes comparable to the photospheric values, matching that of Si II 6355.
The high-velocity features (HVF) of Si II 6355, O I 7774 and the Ca II IR triplet have been systematically examined in the spectra of SNe Ia (Childress et al., 2014; Maguire et al., 2014; Silverman et al., 2015; Zhao et al., 2015, 2016). The HVFs of both the Si II 6355 and the Ca II IR triplet can be clearly identified in the early spectra of SN 2018oh. Since the region overlapping with the oxygen absorption has lower spectral quality for our early data, the O-HVF cannot be clear identified. The velocities measured for the HVFs identified for Si II 6355 and Ca II NIR triplet can reach at about 19,000 22,000 km s-1, far above the photosphere. According to recent studies by Zhao et al. (2015, 2016), the HVFs cannot be explained by ionization and/or thermal processes alone, and different mechanisms are required for the creation of HVF-forming regions. Mulligan & Wheeler (2017, 2018) showed that a compact circumstellar shell having M⊙ mass is capable of producing the observed HVF component of the Ca II NIR triplet.
In Figure 17, we compare the Si II velocity evolution of SN 2018oh with some well-observed SNe Ia. The evolution of SN 2018oh is comparable to that of SN 2005cf and SN 2011fe, as shown in Figure 17. At around the -band maximum light, SN 2018oh has an expansion velocity of 10,300 km s-1, which can be clearly put into the NV group according to the classification scheme proposed by Wang et al. (2009b). The velocity gradient of Si II 6355 during the first 10 days after is measured as = 69 4 km s-1 d-1, which locates just around the boundary between high-velocity gradient (HVG) and low-velocity gradient (LVG) objects (Benetti et al., 2005). A relatively fast velocity decline might be due to the collision of the ejecta with the nearby companion as suggested by the early light curve observed by Kepler Dimitriadis et al. (2018) or CSM. However, Shappee et al. (2018b) found that a single power-law rise with a non-degenerate companion or CSM interaction cannot reproduce well the early light curve. They derived that, at a radius of 4 1015 cm from the progenitor, the CSM density is less than 4.5105 cm-3.
5 Discussion
5.1 Origin of Persistent Carbon Absorption
The unburned carbon features in early spectra can help to discriminate between various explosion mechanisms or progenitor models for SNe Ia. Previous studies show that the C II signatures can be detected in 20 30 % of SNe Ia with ages younger than 4 days from the maximum light and 40% of SNe Ia have unburnt carbon before 10 days (Parrent et al., 2011; Thomas et al., 2011; Silverman & Filippenko, 2012; Maguire et al., 2014). The latest detection was at t = 4.4 days for SN 2008sl. In a late study, SN 2002fk showed carbon absorption lasting 7 days after maximum (Cartier et al., 2014) and the 2002cx-like supernova iPTF14atg showed C II 6580 absorption until about +2 weeks after maximum (Cao et al., 2015).
The carbon absorption persists in the spectra of SN 2018oh for an unusually long time. To examine this abnormal behavior, we further compare the C II 6580 evolution of SN 2018oh with some well-known SNe Ia with prominent carbon absorption features, including SN 2002fk, SN 2009dc, SN 2011fe, SN 2013dy, and iPTF14atg in Figure 18. The C II absorption is strong in the t=8.5d and t=5.5d spectra of SN 2018oh. After that, the C II 6580 tends to become flattened, which was not seen in other normal SNe Ia. The strength of carbon absorption features is found to decrease with time (except for the period at t=13 - 11 days from the maximum light, Silverman & Filippenko (2012)). However, the strength of C II 6580 absorption of SN 2018oh increases after the maximum.
For SN 2012cg and SN 2017cbv, the C II 6580 of the former lasted until 8d (Silverman et al., 2012), while it disappeared in the t = 13d spectrum of the latter (Hosseinzadeh et al., 2017). The super-Chandrasekhar (SC) SNe Ia like SN 2009dc are known to show prominent carbon absorptions (Howell et al., 2006; Scalzo et al., 2010; Silverman et al., 2011; Taubenberger et al., 2011). The C II 4267 absorption is difficult to identify due to several Fe-group features in this wavelength region. It was previously identified in SNLS-03D3bb and SN 2006D (Howell et al., 2006; Thomas et al., 2007), while Scalzo et al. (2010) proposed that this feature might be due to Cr II absorption. However, this feature in SN 2018oh has similar velocity and strength evolution with C II 6580 until t+8.0d (see Figure 15), unlike SN 2009dc (Taubenberger et al., 2011). This gives us more confidence in the identification of C II 4267 absorption in SN 2018oh.
In theory, pulsating delayed-detonation (PDD) model predicts the presence of carbon in the outer ejecta during pulsation period (Hoeflich et al., 1996). Dessart et al. (2014) claim that PDD can leave more unburned carbon than standard delayed-detonation models and thus produce prominent C II lines in the spectra. However, these C II features should disappear within one week after explosion. Their models can reproduce the strong C II lines of SN 2013dy but cannot explain the long-lasting C II lines seen in SN 2018oh.
Heringer et al. (2017) suggest that the emission of iron near 6100 Å can smear out the C II 6580 absorption. Thus, a smaller amount of IGEs in the outer ejecta could explain for the prominent carbon feature in SN 2018oh, which could be due to stringent abundance stratification or lower metallicity for the progenitor. For example, SN 2013cv was a transitional SN Ia between normal and SC SNe Ia with persistent C II 6580 and 7234 until one week after maximum. It has high UV luminosity and its early phase spectra were absent of Fe II/III features, suggestive of strong stratified structure in the explosion ejecta and hence the progenitor (Cao et al., 2016). SN 2018oh exhibits relatively weaker Fe III 5129 than SN 2003du, SN 2005cf and SN 2011fe (Section 4.1) and has blue UV color (see Figure 7), which suggests that it suffered less mixing in the explosion ejecta.
As an alternative explanation for the abundance stratification, it is possible that the progenitor of SN 2018oh has lower metallicity. In order to study the properties of host galaxy, we downloaded the spectrum from the SDSS DR14 (Abolfathi et al., 2018). It corresponds to the light that falls within the 2” diameter fiber that is pointed at the center of the galaxy. Thus, to estimate the total mass of the galaxy, we scaled the synthetic broad band magnitudes measured from the spectrum to match the real photometric measurements of the integrated light of the galaxy (modelMag parameter). However, this procedure has a caveat: it makes the assumption that the mass to light ratio (M/L) obtained from the spectrum (hence representative of the area inside the fiber) is the same as the one outside the fiber. Then, following Galbany et al. (2014), we performed simple stellar population (SSP) synthesis to the spectrum with STARLIGHT (Cid Fernandes et al., 2005) using the Granada-MILES bases (González Delgado et al., 2015), and fit all the emission lines with gaussian profiles in the subtracted gas-phase spectrum. We estimated a stellar mass of 0.12, a star formation rate (SFR) of 5.54 0.36 10-4 M⊙ yr-1 and a subsolar oxygen abundance 12 + log10(O/H) of 8.49 0.09 dex using the O3N2 calibration from Pettini & Pagel (2004), confirming that UGC04780 is actually a metal-poor galaxy. These findings are in total agreement with reported numbers in the SDSS DR14 from different methods and codes444http://skyserver.sdss.org/dr14/en/tools/explore/parameters.aspx?id=1237667430628982959&spec=2573869371524933 632&apid=&fieldId=0x112d13f880b60000&ra=136.664749886541&dec=19.3362515108894&plateId=2573807249117964288. In comparison, Shappee et al. (2018b) derive a larger mass of 4.68 from GALEX and PS1 photometry, while they suggest that this value can be regarded as an upper limit, which is thus not inconsistent with our determination.
Based on the above discussions, we suggest that the outer ejecta of SN 2018oh may have few IGEs as a result of less mixing and/or having metal-poor progenitor, which could explain the presence of prominent and persistent C II 6580 absorption feature in the spectra.
5.2 Bolometric Light Curves and Explosion Parameters
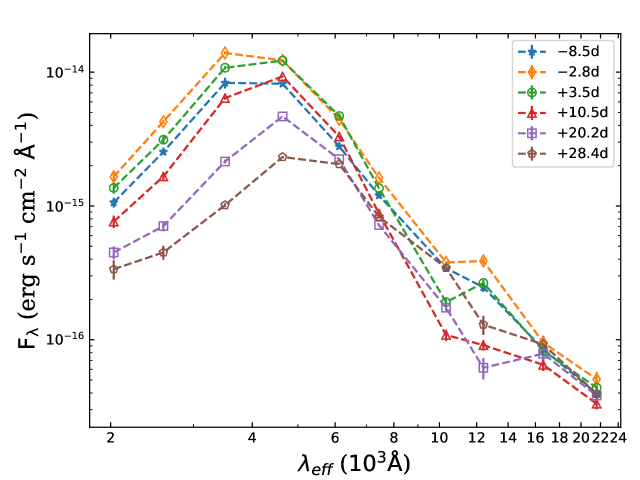
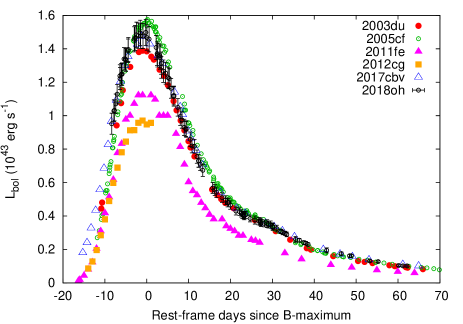
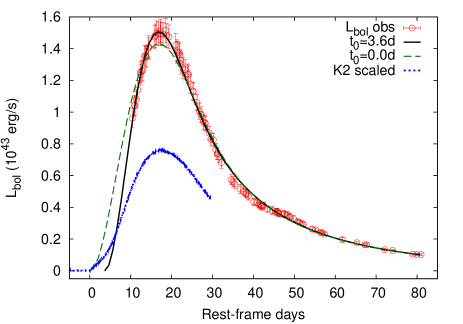
The extensive photometric observations of SN 2018oh enable us to construct a “bolometric” light curve spanning the wavelength region from 0.16 to 2.3 m. The spectral energy distribution (SED) includes the uvw2, uvm2, uvw1, , , , , , , , and bands. We interpolated the UV, optical and NIR photometry from their neighboring epochs or the corresponding template light curves whenever necessary. The final SED evolution is displayed in Figure 19. Adopting the distance d Mpc from 3.3, the bolometric luminosity evolution is shown in the left panel of Figure 20. Like other comparison SNe Ia (except for SN 2005cf), SN 2018oh reached its peak about 1.5 days earlier than the -band maximum. The overall shape of the light curve is quite similar to that of SN 2017cbv, and shows an apparently slower rise compared to SN 2003du.
To estimate the nickel mass and other physical parameters of the ejecta, we apply the radiation diffusion model of Arnett (1982) (see also Chatzopoulos et al., 2012). Adopting the constant opacity approximation, we fit the bolometric light curve using the Minim code (Chatzopoulos et al., 2013). The fit parameters are the time of “first light” (see below), the initial mass of the radioactive nickel , the light curve timescale and the gamma-ray leaking timescale (see e.g. Chatzopoulos et al., 2012, for details).
If is constrained to the moment of first light in the Kepler data (MJD 58144.3 0.1) we get M⊙, d and d. The model light curve is plotted as a green dashed line together with the observations in the right panel of Figure 20. It is seen that this model poorly fits the light curve, because it deviates from the observed data systematically before and around maximum light: the model is too bright at days, while it is too faint (although still within the errorbars) compared to the data around the maximum.
The fit quality improves when is optimized: bf the model having days (the black curve in Figure 20) fits the data much better and does not show such kind of systematic deviations around maximum that the model with does. Having means that the radioactivity-powered light curve starts to rise days after the first light seen by Kepler. This is consistent with the finding by Shappee et al. (2018b), who pointed out that the early K2 light curve of SN 2018oh could be modeled with two power-laws having different starting moments ( and ) that are separated by days, to produce a much better fit than with a single power law starting at MJD 58144.3. Within the framework of the radiative diffusion model, their second power-law () can be associated with the initial phase of the light curve emerging from the homologously expanding, quasi-spherical SN ejecta that is powered by the radioactive decay of 56Ni and 56Co located in the center of the ejecta. Such a delay between the moment of explosion and the emergence of the radioactivity-powered light curve is predicted in some SN Ia models as the “dark phase” (Piro & Nakar, 2013, 2014; Piro & Morozova, 2016) caused by the location of the radioactive 56Ni within the ejecta. The duration of the dark phase is determined by the initial diffusion time of the deposited radioactive energy between the location of 56Ni and the surface of the ejecta. The Arnett model does not contain such a dark phase, because it assumes an initial temperature distribution that remains spatially constant during the SN evolution, i.e. at the initial diffusion wave already reached the surface. Piro & Morozova (2016) predict the length of the dark phase as days, while our result () is almost a factor of 2 longer. However, after taking into account the model-dependent uncertainties involved in such an estimate, our result of day could be interpreted as being this dark phase, i.e. it is the timescale of the initial diffusion wave propagating between the center and the surface of the ejecta.
From our best-fit Arnett model we also get d, d and M⊙. The ejecta mass () and the expansion velocity () are related to the model timescales ( and ) as
| (1) |
(Arnett, 1982; Clocchiatti & Wheeler, 1997; Valenti et al., 2008; Chatzopoulos et al., 2012; Wheeler et al., 2015), where is the effective optical opacity, is the opacity for -rays (assuming full trapping of positrons released in the cobalt decay), and is the light curve parameter related to the density profile of the ejecta (Arnett, 1982). Combining and one can find a self-consistent solution for and (or the kinetic energy ) depending on the chosen value of , because the the -ray opacity is well constrained as cm2 g-1 (Wheeler et al., 2015). There are additional constraints for the other parameters, as must not exceed the Chandrasekhar mass and must be at least as large as the observed expansion velocities (Section 4.4). For SN 2018oh, km s-1 requires cm2 g-1, while implies cm2 g-1. Adopting cm2 g-1 as a fiducial value, we get M⊙ and erg (the quoted uncertainties reflect the upper and lower value of given above). These values are close to the typical ejecta masses and kinetic energies for SNe Ia (e.g. Scalzo et al., 2014a, b).
The uncertainty in the true explosion date has a consequence for the nickel mass estimate. Our first model having fixed to the moment of first light in the K2 light curve gives M⊙, which is very similar to the estimate of 0.640.04 M⊙ based on “Arnett’s rule” (Arnett, 1982; Arnett et al., 1985; Branch & Tammann, 1992; Stritzinger & Leibundgut, 2005; Chatzopoulos et al., 2012) Both of these estimates predict M⊙ higher nickel mass than our best-fit Arnett model described above, due to the d longer rise time to maximum light. Since this model gives a much better description of the evolution of the bolometric light curve, we adopt its final nickel mass of M⊙. This is very similar to the estimate of 0.57 M⊙ for SN 2011fe (Zhang et al., 2016) while smaller than the estimates of 0.77 0.11 M⊙ for SN 2005cf (Wang et al., 2009a) and 0.68 0.14 M⊙ for SN 2003du (Stanishev et al., 2007).
All these are based on the assumption that the bolometric light curve of SN 2018oh is entirely powered by the Ni-Co radioactive decay located centrally within the ejecta (Arnett, 1982). The early, linear rise of the flux observed by Kepler which could be due to either the interaction with a close companion star (Dimitriadis et al., 2018) or the presence of radioactive 56Ni in the outer layers of the ejecta and/or interaction with a nearby CSM (Shappee et al., 2018b), suggests that the assumptions of the Arnett model are not entirely fulfilled. For example, in the interaction model, the flux from the early shock may contribute to the full bolometric light curve non-negligibly even around and after maximum light. Subtracting the prediction of the shock-interaction model by Kasen (2010) assuming a Roche-lobe filling companion at cm from the exploding white dwarf (Dimitriadis et al., 2018) and optimal viewing angle would yield M⊙, d and d. Thus, while and are not changed significantly, the post-maximum contribution from the shock may slightly decrease the -ray leaking timescale. Finally, one can get cm2 g-1, M⊙ and erg using the same model as above. Although these parameters are somewhat less than those estimated from the pure Ni-Co model above, they are consistent within their uncertainties. The contribution of an early shock does not have a significant effect on the parameters estimated from the bolometric light curve.
We then compare observational properties and fitting parameters of SN 2018oh with two explosion models of SNe Ia. Thermonuclear explosion near the center of the C+O WD triggered by the detonation of He near the surface of the progenitor (the He detonation scenario; Noebauer et al., 2017; Jiang et al., 2017; Maeda et al., 2018) can produce early flux excess. Our explosion parameters are similar to model 10A/N from Maeda et al. (2018). One major effect of spectral evolution by the model 10A/N is the Ti trough at 4,000Å around maximum. However, we do not see such feature in our spectra. Therefore we disfavor this scenario for SN 2018oh. Gravitationally confined detonation (the GCD model; Plewa et al., 2004; Kasen & Plewa, 2007; Jordan et al., 2008) is another possible explosion mechanism. In the GCD, a deflagration off-center bubble ignited near the stellar core quickly rise towards the stellar surface with a lateral velocity component which will converge at the opposite side. There, a runaway detonation may be triggered. Seitenzahl et al. (2016) use 3D simulations to produce synthetic observables for one model, GCD200, which met their very optimistic detonation criteria. However, they yielded a nickel mass of 0.74 M⊙ which is much larger than that of SN 2018oh. The GCD200 model also failed to reproduce the secondary peak in the -band light curve. Nevertheless, the GCD model might explain the bump feature in the data of SN 2018oh, as it has a strong dependence on viewing-angle caused by asymmetric deflagration ashes. The UV flux is expected to enhance if the SN was observed at a viewing angle near the detonation ignition side. However, this specific viewing angle does not produce synthetic spectra that are consistent with the observed ones over multiple epochs. Thus, we conclude that the current GCD200 model cannot explain the bulk properties of SN 2018oh.
6 Conclusion
We present extensive follow up photometry and spectroscopy for SN 2018oh, the first spectroscopically-confirmed SN Ia (at a distance of 52.7 Mpc) observed by Kepler. SN 2018oh reached its B-band peak on MJD = 58162.70.3 with an apparent magnitude of = 14.31 0.03 and an absolute magnitude of M19.470.10. SN 2018oh has normal photometric evolution, with a rise time of 18.3 0.3 days and m15(B) = 0.96 0.03 mag, but it seems to have a relatively bluer color.
Using three light curve models, we derive a distance to the host galaxy of UGC 4780 as d = 52.7 1.2 Mpc. UGC 04780 is a star-forming dwarf galaxy with and a low metallicity. Based on the extensive UV/optical/NIR photometry, we established the generic bolometric light curve of SN 2018oh. Fitting Arnett’s radiation diffusion model powered by radioactive decay of Ni and Co to the bolometric light curve, we derived a peak luminosity of = 1.49 1043 erg s-1 with a synthesized nickel mass = 0.55 0.04 M⊙. The moment when the luminosity begin to emerge in the radiation diffusion model, , is found to be +3.85 days after explosion. This is consistent with the hypotheses explored by Dimitriadis et al. (2018) and Shappee et al. (2018b) that the early flux is either due to interaction between the ejecta and some nearby material (a non-degenerate companion star or a CSM) or a non-central location of the radioactive 56Ni within the ejecta, and it does not emerge directly from the SN ejecta. In addition, we also explored two SN Ia explosion models, He-detonation and gravitationally confined detonation, while neither of them can fully explain the properties of SN 2018oh.
The overall spectral evolution of SN 2018oh is similar to normal SNe Ia like SN 2003du, but there are still some interesting features which distinguished it from other SNe Ia. For instance, the line-strength ratio of Si II 5958, 5979 to Si II 6355 ((Si II)) is found to increase from the early phase to t4 day and it then decrease towards the maximum light, suggesting a fluctuation of the photospheric temperature, consistent with the line profile change of C II 6580. SN 2018oh can be put into the Branch shallow-silicon subtype or at the boundary between shallow-silicon and core-normal subtypes based on the pEWs of Si II 5972, 6355, similar to other few SNe Ia showing excess emissions in the early phase in Stritzinger et al. (2018). The velocity of Si II 6355 (i.e., 10,300200 km s-1 at t 0 day) suggests that SN 2018oh belongs to the normal subclass but it shows a somewhat larger velocity gradient (near the boundary between LVG and HVG groups) after the maximum light.
The most striking spectral feature identified for SN 2018oh is the long-lasting C II absorptions. We can identify C II 4267, 6580 and 7234 in early spectra, which all have similar velocity and strength evolution from t9 days to t+8 days. During this phase, the velocity of C II 6580 and 4267 decreases from 11,700 km s-1 to 8,000 km s-1, suggesting a strong mixing of carbon in the exploding ejecta. The C II 6580 absorption can be even detected in the t=+20.5d spectrum, which is never seen in other SNe Ia. The origin of the persistent carbon in SN 2018oh is unclear but may be related to nature of progenitor systems such as lower metallicity. Detailed modeling is needed to clarify this issue.
References
- Abolfathi et al. (2018) Abolfathi, B., Aguado, D. S., Aguilar, G., et al. 2018, ApJS, 235, 42
- Albareti et al. (2017) Albareti, F. D., Allende Prieto, C., Almeida, A., et al. 2017, ApJS, 233, 25
- Aldering et al. (2006) Aldering, G., Antilogus, P., Bailey, S., et al. 2006, ApJ, 650, 510
- Arnett (1982) Arnett, W. D. 1982, ApJ, 253, 785
- Arnett et al. (1985) Arnett, W. D., Branch, D., & Wheeler, J. C. 1985, Nature, 314, 337
- Barbary et al. (2016) Barbary, K., Barclay, T., Biswas, R., et al. 2016, Astrophysics Source Code Library, ascl:1611.017
- Benetti et al. (2005) Benetti, S., Cappellaro, E., Mazzali, P. A., et al. 2005, ApJ, 623, 1011
- Bertin & Arnouts (1996) Bertin, E., & Arnouts, S. 1996, A&A, 117, 393
- Betoule et al. (2014) Betoule, M., Kessler, R., Guy, J., et al. 2014, A&A, 568, A22
- Blondin et al. (2012) Blondin, S., Matheson, T., Kirshner, R. P., et al. 2012, AJ, 143, 126
- Branch & Tammann (1992) Branch, D., & Tammann, G. A. 1992, ARA&A, 30, 359
- Branch et al. (2006) Branch, D., Dang, L. C., Hall, N., et al. 2006, Publications of the Astronomical Society of the Pacific, 118, 560.
- Breeveld et al. (2011) Breeveld, A. A., Landsman, W., Holland, S. T., et al. 2011, American Institute of Physics Conference Series, 1358, 373
- Brown et al. (2013) Brown, T. M., Baliber, N., Bianco, F. B., et al. 2013, Publications of the Astronomical Society of the Pacific, 125, 1031.
- Brown et al. (2012) Brown, P. J., Dawson, K. S., de Pasquale, M., et al. 2012, ApJ, 753, 22
- Brown et al. (2014) Brown, P. J., Breeveld, A. A., Holland, S., Kuin, P., & Pritchard, T. 2014, Ap&SS, 354, 89
- Brown et al. (2017) Brown, P. J., Landez, N. J., Milne, P. A., & Stritzinger, M. D. 2017, ApJ, 836, 232
- Brown et al. (2018) Brown, J. S., Stanek, K. Z., Vallely, P., et al. 2018, The Astronomer’s Telegram, 11253,
- Burns et al. (2011) Burns, C. R., Stritzinger, M., Phillips, M. M., et al. 2011, AJ, 141, 19
- Burns et al. (2014) Burns, C. R., Stritzinger, M., Phillips, M. M., et al. 2014, ApJ, 789, 32
- Buzzoni et al. (1984) Buzzoni, B., Delabre, B., Dekker, H., et al. 1984, The Messenger, 38, 9
- Cao et al. (2015) Cao, Y., Kulkarni, S. R., Howell, D. A., et al. 2015, Nature, 521, 328
- Cao et al. (2016) Cao, Y., Johansson, J., Nugent, P. E., et al. 2016, ApJ, 823, 147
- Cardelli et al. (1989) Cardelli, J. A., Clayton, G. C., & Mathis, J. S. 1989, ApJ, 345, 245
- Cartier et al. (2014) Cartier, R., Hamuy, M., Pignata, G., et al. 2014, ApJ, 789, 89
- Chambers et al. (2016) Chambers, K. C., Magnier, E. A., Metcalfe, N., et al. 2016, arXiv:1612.05560
- Chatzopoulos et al. (2012) Chatzopoulos, E., Wheeler, J. C., & Vinko, J. 2012, ApJ, 746, 121
- Chatzopoulos et al. (2013) Chatzopoulos, E., Wheeler, J. C., Vinko, J., Horvath, Z. L., & Nagy, A. 2013, ApJ, 773, 76
- Childress et al. (2014) Childress, M. J., Filippenko, A. V., Ganeshalingam, M., & Schmidt, B. P. 2014, MNRAS, 437, 338
- Chonis et al. (2016) Chonis, T. S., Hill, G. J., Lee, H., et al. 2016, Proc. SPIE, 9908, 99084C
- Cid Fernandes et al. (2005) Cid Fernandes, R., Mateus, A., Sodré, L., Stasińska, G., & Gomes, J. M. 2005, MNRAS, 358, 363
- Clemens et al. (2004) Clemens, J. C., Crain, J. A., & Anderson, R. 2004, Proc. SPIE, 5492, 331
- Clocchiatti & Wheeler (1997) Clocchiatti, A., & Wheeler, J. C. 1997, ApJ, 491, 375
- Contreras et al. (2010) Contreras, C., Hamuy, M., Phillips, M. M., et al. 2010, AJ, 139, 519
- Cox & Patat (2008) Cox, N. L. J., & Patat, F. 2008, A&A, 485, L9
- Cousins (1981) Cousins, A. W. J. 1981, South African Astronomical Observatory Circular, 6, 4
- Dessart et al. (2014) Dessart, L., Blondin, S., Hillier, D. J., & Khokhlov, A. 2014, MNRAS, 441, 532
- Dilday et al. (2012) Dilday, B., Howell, D. A., Cenko, S. B., et al. 2012, Science, 337, 942
- Dimitriadis et al. (2018) Dimitriadis, G. et al. 2018, accepted
- D’Odorico et al. (1989) D’Odorico, S., di Serego Alighieri, S., Pettini, M., et al. 1989, A&A, 215, 21
- Fan et al. (2015) Fan, Y.-F., Bai, J.-M., Zhang, J.-J., et al. 2015, Research in Astronomy and Astrophysics, 15, 918
- Fisher et al. (1997) Fisher, A., Branch, D., Nugent, P., & Baron, E. 1997, ApJ, 481, L89
- Flaugher et al. (2015) Flaugher, B., Diehl, H. T., Honscheid, K., et al. 2015, AJ, 150, 150
- Flewelling et al. (2016) Flewelling, H. A., Magnier, E. A., Chambers, K. C., et al. 2016, arXiv:1612.05243
- Folatelli et al. (2012) Folatelli, G., Phillips, M. M., Morrell, N., et al. 2012, ApJ, 745, 74
- Foley & Kasen (2011) Foley, R. J., & Kasen, D. 2011, ApJ, 729, 55
- Foley et al. (2011) Foley, R. J., Sanders, N. E., & Kirshner, R. P. 2011, ApJ, 742, 89
- Foley (2012) Foley, R. J. 2012, ApJ, 748, 127
- Galbany et al. (2014) Galbany, L., Stanishev, V., Mourão, A. M., et al. 2014, A&A, 572, A38
- Ganeshalingam et al. (2012) Ganeshalingam, M., Li, W., Filippenko, A. V., et al. 2012, ApJ, 751, 142
- Garavini et al. (2007) Garavini, G., Nobili, S., Taubenberger, S., et al. 2007, A&A, 471, 527
- Gehrels et al. (2004) Gehrels, N., Chincarini, G., Giommi, P., et al. 2004, ApJ, 611, 1005
- González Hernández et al. (2012) González Hernández, J. I., Ruiz-Lapuente, P., Tabernero, H. M., et al. 2012, Nature, 489, 533
- González Delgado et al. (2015) González Delgado, R. M., García-Benito, R., Pérez, E., et al. 2015, A&A, 581, A103
- Guy et al. (2010) Guy, J., Sullivan, M., Conley, A., et al. 2010, A&A, 523, A7
- Haas et al. (2010) Haas, M. R., Batalha, N. M., Bryson, S. T., et al. 2010, ApJ, 713, L115
- Hamuy et al. (2003) Hamuy, M., Phillips, M. M., Suntzeff, N. B., et al. 2003, Nature, 424, 651
- Heringer et al. (2017) Heringer, E., van Kerkwijk, M. H., Sim, S. A., & Kerzendorf, W. E. 2017, ApJ, 846, 15
- Hoeflich et al. (1996) Hoeflich, P., Khokhlov, A., Wheeler, J. C., et al. 1996, ApJ, 472, L81
- Honscheid et al. (2008) Honscheid, K., DePoy, D. L., & for the DES Collaboration 2008, arXiv:0810.3600
- Hosseinzadeh et al. (2017) Hosseinzadeh, G., Sand, D. J., Valenti, S., et al. 2017, ApJ, 845, L11
- Huang et al. (2012) Huang, F., Li, J.-Z., Wang, X.-F., et al. 2012, Research in Astronomy and Astrophysics, 12, 1585
- Howell et al. (2006) Howell, D. A., Sullivan, M., Nugent, P. E., et al. 2006, Nature, 443, 308
- Iben & Tutukov (1984) Iben, I., Jr., & Tutukov, A. V. 1984, ApJS, 54, 335
- Iben & Tutukov (1984) Iben, I., Jr., & Tutukov, A. V. 1984, ApJS, 54, 335
- Jha et al. (2007) Jha, S., Riess, A. G., & Kirshner, R. P. 2007, ApJ, 659, 122
- Jiang et al. (2017) Jiang, J.-A., Doi, M., Maeda, K., et al. 2017, Nature, 550, 80
- Johnson et al. (1966) Johnson, H. L., Mitchell, R. I., Iriarte, B., & Wisniewski, W. Z. 1966, Communications of the Lunar and Planetary Laboratory, 4, 99
- Jordan et al. (2008) Jordan, G. C., IV, Fisher, R. T., Townsley, D. M., et al. 2008, ApJ, 681, 1448
- Kasen & Plewa (2007) Kasen, D., & Plewa, T. 2007, ApJ, 662, 459
- Kasen (2010) Kasen, D. 2010, ApJ, 708, 1025
- Krisciunas et al. (2017) Krisciunas, K., Contreras, C., Burns, C. R., et al. 2017, AJ, 154, 211
- Landolt (1992) Landolt, A. U. 1992, AJ, 104, 340
- Leadbeater (2018) Leadbeater, R. 2018, Transient Name Server Classification Report, 159,
- Leonard (2007) Leonard, D. C. 2007, ApJ, 670, 1275
- Li et al. (2011) Li, W., Bloom, J. S., Podsiadlowski, P., et al. 2011, Nature, 480, 348
- Lira et al. (1998) Lira, P., Suntzeff, N. B., Phillips, M. M., et al. 1998, AJ, 115, 234
- Maeda et al. (2010) Maeda, K., Benetti, S., Stritzinger, M., et al. 2010, Nature, 466, 82
- Maeda et al. (2018) Maeda, K., Jiang, J.-a., Shigeyama, T., & Doi, M. 2018, ApJ, 861, 78
- Magnier et al. (2016) Magnier, E. A., Schlafly, E. F., Finkbeiner, D. P., et al. 2016, arXiv:1612.05242
- Maguire et al. (2013) Maguire, K., Sullivan, M., Patat, F., et al. 2013, MNRAS, 436, 222
- Maguire et al. (2014) Maguire, K., Sullivan, M., Pan, Y.-C., et al. 2014, MNRAS, 444, 3258
- Maguire et al. (2016) Maguire, K., Taubenberger, S., Sullivan, M., & Mazzali, P. A. 2016, MNRAS, 457, 3254
- Mandel et al. (2014) Mandel, K. S., Foley, R. J., & Kirshner, R. P. 2014, ApJ, 797, 75
- Maoz et al. (2014) Maoz, D., Mannucci, F., & Nelemans, G. 2014, ARA&A, 52, 107
- Maraston (2005) Maraston, C. 2005, MNRAS, 362, 799
- Maraston et al. (2009) Maraston, C., Strömbäck, G., Thomas, D., Wake, D. A., & Nichol, R. C. 2009, MNRAS, 394, L107
- Maraston et al. (2013) Maraston, C., Pforr, J., Henriques, B. M., et al. 2013, MNRAS, 435, 2764
- Marion et al. (2016) Marion, G. H., Brown, P. J., Vinkó, J., et al. 2016, ApJ, 820, 92
- Matheson et al. (2012) Matheson, T., Joyce, R. R., Allen, L. E., et al. 2012, ApJ, 754, 19
- Mattila et al. (2005) Mattila, S., Lundqvist, P., Sollerman, J., et al. 2005, A&A, 443, 649
- Maund et al. (2010) Maund, J. R., Höflich, P., Patat, F., et al. 2010, ApJ, 725, L167
- Mazzali et al. (2014) Mazzali, P. A., Sullivan, M., Hachinger, S., et al. 2014, MNRAS, 439, 1959
- Mennekens et al. (2010) Mennekens, N., Vanbeveren, D., De Greve, J. P., & De Donder, E. 2010, A&A, 515, A89
- Milne et al. (2013) Milne, P. A., Brown, P. J., Roming, P. W. A., Bufano, F., & Gehrels, N. 2013, ApJ, 779, 23
- Miller & Stone (1993) Miller, J. S. and Stone, R. P. S. 1993, Lick Obs. Tech. Rep. 66. Lick Obs., Santa Cruz
- Miller et al. (2018) Miller, A. A., Cao, Y., Piro, A. L., et al. 2018, ApJ, 852, 100
- Molnár et al. (2015) Molnár, L., Pál, A., Plachy, E., et al. 2015, ApJ, 812, 2
- Mulligan & Wheeler (2017) Mulligan, B. W., & Wheeler, J. C. 2017, MNRAS, 467, 778
- Mulligan & Wheeler (2018) Mulligan, B. W., & Wheeler, J. C. 2018, MNRAS, 476, 1299
- Munari et al. (2013) Munari, U., Henden, A., Belligoli, R., et al. 2013, New A, 20, 30
- Noebauer et al. (2017) Noebauer, U. M., Kromer, M., Taubenberger, S., et al. 2017, MNRAS, 472, 2787
- Nomoto (1982) Nomoto, K. 1982, ApJ, 253, 798
- Nomoto et al. (1997) Nomoto, K., Iwamoto, K., & Kishimoto, N. 1997, Science, 276, 1378
- Nugent et al. (1995) Nugent, P., Phillips, M., Baron, E., Branch, D., & Hauschildt, P. 1995, ApJ, 455, L147
- Olling et al. (2015) Olling, R. P., Mushotzky, R., Shaya, E. J., et al. 2015, Nature, 521, 332
- Pan et al. (2015) Pan, Y.-C., Foley, R. J., Kromer, M., et al. 2015, MNRAS, 452, 4307
- Parrent et al. (2011) Parrent, J. T., Thomas, R. C., Fesen, R. A., et al. 2011, ApJ, 732, 30
- Patat et al. (2007) Patat, F., Chandra, P., Chevalier, R., et al. 2007, Science, 317, 924
- Pál (2012) Pál, A. 2012, MNRAS, 421, 1825
- Pál et al. (2015) Pál, A., Szabó, R., Szabó, G. M., et al. 2015, ApJ, 804, L45
- Perlmutter et al. (1999) Perlmutter, S., Aldering, G., Goldhaber, G., et al. 1999, ApJ, 517, 565
- Pettini & Pagel (2004) Pettini, M., & Pagel, B. E. J. 2004, MNRAS, 348, L59
- Phillips et al. (1999) Phillips, M. M., Lira, P., Suntzeff, N. B., et al. 1999, AJ, 118, 1766
- Phillips et al. (2013) Phillips, M. M., Simon, J. D., Morrell, N., et al. 2013, ApJ, 779, 38
- Piro & Nakar (2013) Piro, A. L., & Nakar, E. 2013, ApJ, 769, 67
- Piro & Nakar (2014) Piro, A. L., & Nakar, E. 2014, ApJ, 784, 85
- Piro & Morozova (2016) Piro, A. L., & Morozova, V. S. 2016, ApJ, 826, 96
- Plewa et al. (2004) Plewa, T., Calder, A. C., & Lamb, D. Q. 2004, ApJ, 612, L37
- Poole et al. (2008) Poole, T. S., Breeveld, A. A., Page, M. J., et al. 2008, MNRAS, 383, 627
- Rest et al. (2005) Rest, A., Stubbs, C., Becker, A. C., et al. 2005, ApJ, 634, 1103
- Rest et al. (2014) Rest, A., Scolnic, D., Foley, R. J., et al. 2014, ApJ, 795, 44
- Riess et al. (1998) Riess, A. G., Filippenko, A. V., Challis, P., et al. 1998, AJ, 116, 1009
- Riess et al. (2016) Riess, A. G., Macri, L. M., Hoffmann, S. L., et al. 2016, ApJ, 826, 56
- Riess et al. (2018) Riess, A. G., Casertano, S., Yuan, W., et al. 2018, ApJ, 855, 136
- Roming et al. (2005) Roming, P. W. A., Kennedy, T. E., Mason, K. O., et al. 2005, Space Sci. Rev., 120, 95
- Sand et al. (2018) Sand, D. J., Graham, M. L., Botyánszki, J., et al. 2018, arXiv:1804.03666
- Scalzo et al. (2010) Scalzo, R. A., Aldering, G., Antilogus, P., et al. 2010, ApJ, 713, 1073
- Scalzo et al. (2014a) Scalzo, R., Aldering, G., Antilogus, P., et al. 2014, MNRAS, 440, 1498
- Scalzo et al. (2014b) Scalzo, R. A., Ruiter, A. J., & Sim, S. A. 2014, MNRAS, 445, 2535
- Schaefer & Pagnotta (2012) Schaefer, B. E., & Pagnotta, A. 2012, Nature, 481, 164
- Schlafly & Finkbeiner (2011) Schlafly, E. F., & Finkbeiner, D. P. 2011, ApJ, 737, 103
- Scolnic et al. (2015) Scolnic, D., Casertano, S., Riess, A., et al. 2015, ApJ, 815, 117
- Seitenzahl et al. (2016) Seitenzahl, I. R., Kromer, M., Ohlmann, S. T., et al. 2016, A&A, 592, A57
- Shappee et al. (2013) Shappee, B. J., Stanek, K. Z., Pogge, R. W., & Garnavich, P. M. 2013, ApJ, 762, L5
- Shappee et al. (2014) Shappee, B. J., Prieto, J. L., Grupe, D., et al. 2014, ApJ, 788, 48
- Shappee et al. (2018a) Shappee, B. J., Piro, A. L., Stanek, K. Z., et al. 2018, ApJ, 855, 6
- Shappee et al. (2018b) Shappee, B. J., Holoinen, T. W.-S., Drout, M. R. et al. 2018, submitted
- Silverman et al. (2011) Silverman, J. M., Ganeshalingam, M., Li, W., et al. 2011, MNRAS, 410, 585
- Silverman et al. (2012) Silverman, J. M., Ganeshalingam, M., Cenko, S. B., et al. 2012, ApJ, 756, L7
- Silverman & Filippenko (2012) Silverman, J. M., & Filippenko, A. V. 2012, MNRAS, 425, 1917
- Silverman et al. (2013) Silverman, J. M., Nugent, P. E., Gal-Yam, A., et al. 2013, ApJS, 207, 3
- Silverman et al. (2015) Silverman, J. M., Vinkó, J., Marion, G. H., et al. 2015, MNRAS, 451, 1973
- Smartt et al. (2015) Smartt, S. J., Valenti, S., Fraser, M., et al. 2015, A&A, 579, A40
- Sollerman et al. (2005) Sollerman, J., Cox, N., Mattila, S., et al. 2005, A&A, 429, 559
- Stanishev et al. (2007) Stanishev, V., Goobar, A., Benetti, S., et al. 2007, A&A, 469, 645
- Sternberg et al. (2011) Sternberg, A., Gal-Yam, A., Simon, J. D., et al. 2011, Science, 333, 856
- Stritzinger & Leibundgut (2005) Stritzinger, M., & Leibundgut, B. 2005, A&A, 431, 423
- Stritzinger et al. (2018) Stritzinger, M. D., Shappee, B. J., Piro, A. L., et al. 2018, ApJ, 864, L35
- Taubenberger et al. (2011) Taubenberger, S., Benetti, S., Childress, M., et al. 2011, MNRAS, 412, 2735
- Thomas et al. (2007) Thomas, R. C., Aldering, G., Antilogus, P., et al. 2007, ApJ, 654, L53
- Thomas et al. (2011) Thomas, R. C., Aldering, G., Antilogus, P., et al. 2011, ApJ, 743, 27
- Tody (1986) Tody, D. 1986, Proc. SPIE, 627, 733
- Tody (1993) Tody, D. 1993, Astronomical Data Analysis Software and Systems II, 52, 173
- Toonen et al. (2012) Toonen, S., Nelemans, G., & Portegies Zwart, S. 2012, A&A, 546, A70
- Tremonti et al. (2004) Tremonti, C. A., Heckman, T. M., Kauffmann, G., et al. 2004, ApJ, 613, 898
- Valenti et al. (2008) Valenti, S., Benetti, S., Cappellaro, E., et al. 2008, MNRAS, 383, 1485
- Villanueva et al. (2018) Villanueva, S., Jr., Gaudi, B. S., Pogge, R. W., et al. 2018, PASP, 130, 015001
- Vinko et al. (2018) Vinko, J, Ordasi, A., Szalai, T. et al. 2018, PASP, 130:064101
- Waters et al. (2016) Waters, C. Z., Magnier, E. A., Price, P. A., et al. 2016, arXiv:1612.05245
- Wang et al. (2009a) Wang, X., Li, W., Filippenko, A. V., et al. 2009, ApJ, 697, 380
- Wang et al. (2009b) Wang, X., Filippenko, A. V., Ganeshalingam, M., et al. 2009b, ApJ, 699, L139
- Wang et al. (2008) Wang, X., Li, W., Filippenko, A. V., et al. 2008, ApJ, 675, 626
- Wang et al. (2013) Wang, X., Wang, L., Filippenko, A. V., Zhang, T., and Zhao, X. 2013, Science, 340, 170
- Webbink (1984) Webbink, R. F. 1984, ApJ, 277, 355
- Welty et al. (2014) Welty, D. E., Ritchey, A. M., Dahlstrom, J. A., & York, D. G. 2014, ApJ, 792, 106
- Wheeler et al. (2015) Wheeler, J. C., Johnson, V., & Clocchiatti, A. 2015, MNRAS, 450, 1295
- Whelan & Iben (1973) Whelan, J., & Iben, I., Jr. 1973, ApJ, 186, 1007
- Williams et al. (2008) Williams, G. G., Milne, P. A., Park, H. S., et al. 2008, American Institute of Physics Conference Series, 1000, 535
- Yaron & Gal-Yam (2012) Yaron, O., & Gal-Yam, A. 2012, PASP, 124, 668
- Zhai et al. (2016) Zhai, Q., Zhang, J.-J., Wang, X.-F., et al. 2016, AJ, 151, 125
- Zhang et al. (2016) Zhang, K., Wang, X., Zhang, J., et al. 2016, ApJ, 820, 67
- Zhang et al. (2018) Zhang, J., Xin, Y., Li, W., et al. 2018, The Astronomer’s Telegram, 11267,
- Zhao et al. (2015) Zhao, X., Wang, X., Maeda, K., et al. 2015, ApJS, 220, 20
- Zhao et al. (2016) Zhao, X., Maeda, K., Wang, X., et al. 2016, ApJ, 826, 211
- Zheng et al. (2013) Zheng, W., Silverman, J. M., Filippenko, A. V., et al. 2013, ApJ, 778, L15
| Num. | (J2000) | (J2000) | U (mag) | B (mag) | V (mag) | g (mag) | r (mag) | i (mag) |
|---|---|---|---|---|---|---|---|---|
| 1 | +19∘15’08”.52 | 17.207(045) | 16.391(156) | 15.528(022) | 15.839(004) | 15.111(003) | 14.839(001) | |
| 2 | +19∘20’47”.95 | 17.495(234) | 17.294(136) | 16.594(018) | 16.787(004) | 16.278(003) | 16.091(004) | |
| 3 | +19∘25’11”.44 | 14.466(128) | 14.265(012) | 13.785(036) | ||||
| 4 | +19∘22’59”.74 | 16.876(225) | 16.411(136) | 15.682(063) | 15.889(002) | 15.377(002) | 15.189(003) | |
| 5 | +19∘15’21”.30 | 18.374(121) | 17.322(161) | 16.094(030) | 16.637(005) | 15.538(001) | 14.899(003) | |
| 6 | +19∘23’45”.24 | 14.683(130) | 14.562(093) | 14.089(051) | 14.177(003) | 13.877(001) | 13.754(007) | |
| 7 | +19∘19’47”.43 | 16.944(205) | 16.190(108) | 15.371(027) | 15.612(002) | 14.998(003) | 14.777(002) | |
| 8 | +19∘26’37”.72 | 14.249(157) | 14.085(119) | 13.530(051) | ||||
| 9 | +19∘23’57”.47 | 14.049(117) | 13.876(117) | 13.336(045) | ||||
| 10 | +19∘21’59”.41 | 15.101(122) | 14.207(142) | 13.265(037) | ||||
| 11 | +19∘21’11”.78 | 15.624(116) | 15.034(140) | 14.300(037) | 14.504(001) | 13.989(004) | 13.794(002) | |
| 12 | +19∘11’53”.84 | 17.049(003) | 15.857(003) | 15.206(003) | ||||
| 13 | +19∘27’45”.26 | 11.120(005) | ||||||
| 14 | +19∘26’07”.39 | 13.991(002) | 13.547(003) | 13.401(006) | ||||
| 15 | +19∘13’37”.27 | 16.763(165) | 16.324(098) | 15.654(029) | 15.818(004) | 15.371(001) | 15.213(001) | |
| 16 | +19∘19’50”.03 | 15.225(002) | 14.559(003) | 14.305(001) | ||||
| 17 | +19∘24’27”.41 | 16.777(175) | 16.659(117) | 16.120(051) | 16.227(003) | 15.886(003) | 15.760(005) | |
| 18 | +19∘17’54”.94 | 12.832(012) | ||||||
| 19 | +19∘28’33”.32 | 17.113(179) | 16.248(103) | 15.445(076) | 15.663(001) | 15.028(003) | 14.773(003) | |
| 20 | +19∘21’52”.39 | 15.806(063) | 15.085(130) | 14.215(028) | 14.485(003) | 13.851(004) | 13.586(003) | |
| 21 | +19∘17’03”.74 | 16.377(162) | 15.671(110) | 14.867(012) | 15.112(002) | 14.537(003) | 14.315(003) | |
| 22 | +19∘29’46”.26 | 14.544(113) | 14.470(059) | 13.949(071) | 14.067(002) | 13.711(005) | 13.562(001) | |
| 23 | +19∘20’27”.46 | 15.631(135) | 15.244(108) | 14.606(016) | 14.765(005) | 14.329(001) | 14.183(001) | |
| 24 | +19∘25’33”.84 | 15.742(079) | 15.395(123) | 14.760(056) | 14.929(002) | 14.502(002) | 14.373(001) | |
| 25 | +19∘17’04”.92 | 15.781(157) | 15.318(070) | 14.615(037) | 14.813(001) | 14.324(004) | 14.141(002) | |
| 26 | +19∘13’56”.17 | 14.501(06) | 14.504(082) | 13.928(016) | 14.065(002) | 13.715(005) | 13.563(002) | |
| 27 | +19∘11’57”.18 | 16.723(122) | 16.773(002) | 16.411(003) | 16.269(003) | |||
| 28 | +19∘25’28”.07 | 14.718(118) | 14.603(097) | 14.087(052) | 14.204(002) | 13.886(002) | 13.766(008) | |
| 29 | +19∘18’13”.19 | 15.555(151) | 15.226(058) | 14.562(022) | 14.766(003) | 14.322(003) | 14.139(004) | |
| 30 | +19∘13’56”.25 | 16.208(156) | 16.047(051) | 15.389(018) | 15.557(001) | 15.158(001) | 15.009(004) | |
| 31 | +19∘17’23”.35 | 14.296(083) | 14.237(081) | 13.623(007) | ||||
| 32 | +19∘13’50”.62 | 14.784(190) | 14.403(054) | 13.763(021) | 13.936(001) | 13.561(002) | 13.432(007) | |
| 33 | +19∘15’58”.14 | 16.385(141) | 16.251(074) | 15.469(014) | 15.713(001) | 15.173(002) | 14.914(003) | |
| 34 | +19∘17’49”.82 | 15.334(171) | 14.481(074) | 13.531(009) | ||||
| 35 | +19∘26’20”.07 | 12.647(039) | ||||||
| 36 | +19∘21’05”.62 | 14.992(097) | 14.878(071) | 14.288(034) | 14.441(003) | 14.103(006) | 13.984(008) | |
| 37 | +19∘21’50”.56 | 15.357(002) | 14.823(003) | 14.621(005) | ||||
| 38 | +19∘23’49”.99 | 16.216(221) | 16.153(062) | 15.558(018) | 15.742(003) | 15.394(003) | 15.264(003) | |
| 39 | +19∘15’09”.73 | 15.603(164) | 15.536(026) | 14.904(038) | 15.106(001) | 14.756(002) | 14.639(002) |
| Num. | (J2000) | (J2000) | B (mag) | V (mag) | R (mag) | I (mag) |
|---|---|---|---|---|---|---|
| 1 | +19∘18’22”.43 | 16.553(032) | 15.932(012) | 15.567(015) | 15.189(017) | |
| 2 | +19∘20’24”.12 | 19.686(033) | 18.143(014) | 17.237(015) | 16.027(018) | |
| 3 | +19∘21’32”.98 | 18.460(032) | 17.350(012) | 16.706(015) | 16.151(018) | |
| 4 | +19∘20’26”.91 | 18.413(032) | 17.563(013) | 17.070(016) | 16.572(017) | |
| 5 | +19∘19’41”.32 | 17.908(032) | 17.173(012) | 16.746(015) | 16.309(017) | |
| 6 | +19∘15’40”.78 | 17.785(032) | 17.189(013) | 16.837(015) | 16.464(017) | |
| 7 | +19∘14’56”.71 | 17.990(032) | 17.170(012) | 16.693(015) | 16.204(017) | |
| 8 | +19∘23’16”.27 | 17.654(032) | 16.772(012) | 16.261(015) | 15.777(017) | |
| 9 | +19∘18’52”.05 | 19.857(033) | 18.292(014) | 17.372(015) | 16.333(018) | |
| 10 | +19∘22’45”.08 | 19.367(033) | 18.039(013) | 17.265(016) | 16.581(018) | |
| 11 | +19∘14’10”.11 | 19.765(032) | 18.286(013) | 17.418(015) | 16.608(018) | |
| 12 | +19∘20’53”.67 | 17.617(032) | 16.848(012) | 16.400(015) | 15.973(017) | |
| 13 | +19∘13’22”.90 | 18.832(033) | 17.281(013) | 16.370(015) | 15.384(017) | |
| 14 | +19∘22’17”.41 | 17.490(032) | 16.434(012) | 15.822(015) | 15.235(017) |
| Date | aaDays relative to the B-banx maximum on 2018-02-13.7 (JD 2458163.2).Epoch | U (mag) | B (mag) | V (mag) | R (mag) | I (mag) | g (mag) | r (mag) | i (mag) | Telescope |
|---|---|---|---|---|---|---|---|---|---|---|
| 2018-01-26.6 | -18.1 | 20.852(223) | 21.025(269) | PS1 | ||||||
| 2018-01-27.2 | -17.5 | 19.039(009) | Decam | |||||||
| 2018-01-27.3 | -17.4 | 18.957(008) | Decam | |||||||
| 2018-02-03.1 | -10.6 | 15.500(010) | ASAS-SN | |||||||
| 2018-02-03.3 | -10.4 | 15.671(004) | PS1 | |||||||
| 2018-02-04.3 | -9.4 | 15.446(004) | PS1 | |||||||
| 2018-02-04.5 | -9.2 | 15.389(003) | PS1 | |||||||
| 2018-02-05.1 | -8.6 | 14.982(025) | 15.085(025) | 14.988(017) | 15.305(025) | DEMONEXT | ||||
| 2018-02-05.2 | -8.5 | 14.940(026) | 15.067(025) | 15.005(013) | 15.262(024) | PONM | ||||
| 2018-02-05.2 | -8.5 | 14.915(005) | 14.832(006) | 14.879(007) | slotis | |||||
| 2018-02-05.4 | -8.3 | 15.264(010) | PS1 | |||||||
| 2018-02-05.8 | -7.9 | 14.818(031) | 14.931(011) | 14.707(005) | 14.872(007) | 15.089(009) | TNT | |||
| 2018-02-05.9 | -7.8 | 14.883(006) | 15.142(008) | LCO | ||||||
| 2018-02-06.2 | -7.5 | 14.789(031) | 14.879(013) | 14.803(007) | 15.101(006) | PONM | ||||
| 2018-02-06.2 | -7.5 | 15.615(013) | 14.762(012) | 14.722(010) | 14.711(010) | 14.835(008) | 15.149(009) | Swope | ||
| 2018-02-06.2 | -7.5 | 14.771(005) | 14.709(006) | 14.774(006) | slotis | |||||
| 2018-02-06.5 | -7.2 | 14.758(027) | 14.857(024) | 14.789(016) | 15.085(022) | DEMONEXT | ||||
| 2018-02-06.6 | -7.1 | 14.285(027) | 14.723(016) | 14.799(014) | 14.610(003) | 14.798(003) | 15.089(006) | LCO | ||
| 2018-02-06.8 | -6.9 | 14.213(062) | 14.691(043) | 14.818(015) | 14.660(041) | 14.662(029) | LJT | |||
| 2018-02-06.8 | -6.9 | 14.703(072) | 14.724(027) | 14.609(032) | 14.637(035) | Konkoly | ||||
| 2018-02-07.2 | -6.5 | 14.666(022) | 14.783(016) | 14.688(013) | 14.972(019) | DEMONEXT | ||||
| 2018-02-07.2 | -6.5 | 14.681(034) | 14.797(014) | 14.725(004) | 15.010(007) | PONM | ||||
| 2018-02-07.2 | -6.5 | 15.345(035) | 14.600(012) | 14.584(011) | 14.531(010) | 14.635(008) | 14.985(009) | Swope | ||
| 2018-02-07.2 | -6.5 | 14.668(006) | 14.569(006) | 14.650(006) | slotis | |||||
| 2018-02-07.5 | -6.2 | 14.173(026) | 14.618(015) | 14.697(014) | 14.494(002) | 14.702(003) | 14.987(006) | LCO | ||
| 2018-02-07.7 | -6.0 | 14.578(034) | 14.701(020) | 14.499(016) | 14.713(018) | 15.003(013) | TNT | |||
| 2018-02-08.2 | -5.5 | 15.291(032) | 14.469(011) | 14.471(010) | 14.408(010) | 14.557(008) | 14.926(008) | Swope | ||
| 2018-02-08.3 | -5.4 | 14.609(009) | Gemini | |||||||
| 2018-02-08.4 | -5.3 | 14.483(002) | 14.613(002) | PS1 | ||||||
| 2018-02-08.5 | -5.2 | 14.082(027) | 14.529(015) | 14.608(014) | 14.409(002) | 14.614(003) | 14.947(006) | LCO | ||
| 2018-02-08.7 | -5.0 | 14.514(030) | 14.622(010) | 14.421(003) | 14.646(004) | 14.963(006) | TNT | |||
| 2018-02-09.1 | -4.6 | 14.521(025) | 14.584(022) | 14.550(014) | 14.940(026) | DEMONEXT | ||||
| 2018-02-09.2 | -4.5 | 14.030(027) | 14.509(015) | 14.549(013) | 14.382(001) | 14.551(002) | 14.904(003) | LCO | ||
| 2018-02-09.2 | -4.5 | 14.487(033) | 14.591(012) | 14.540(004) | 14.887(005) | PONM | ||||
| 2018-02-09.2 | -4.5 | 14.450(004) | 14.397(005) | 14.555(006) | slotis | |||||
| 2018-02-09.3 | -4.4 | 14.342(018) | 14.556(019) | Gemini | ||||||
| 2018-02-09.5 | -4.2 | 14.359(002) | 14.926(003) | PS1 | ||||||
| 2018-02-09.7 | -4.0 | 14.411(030) | 14.505(010) | 14.327(003) | 14.543(004) | TNT | ||||
| 2018-02-10.3 | -3.4 | 14.266(008) | 14.471(012) | Gemini | ||||||
| 2018-02-10.5 | -3.2 | 14.307(002) | 14.476(002) | PS1 | ||||||
| 2018-02-10.5 | -3.2 | 14.426(032) | 14.520(032) | 14.511(027) | DEMONEXT | |||||
| 2018-02-10.7 | -3.0 | 14.375(031) | 14.483(010) | 14.287(005) | 14.528(008) | 14.949(010) | TNT | |||
| 2018-02-10.9 | -2.8 | 13.950(026) | 14.323(015) | 14.443(013) | 14.493(010) | LCO | ||||
| 2018-02-10.9 | -2.8 | 14.499(005) | 14.936(007) | LCO | ||||||
| 2018-02-11.2 | -2.5 | 14.383(022) | 14.476(022) | 14.449(013) | 14.905(024) | DEMONEXT | ||||
| 2018-02-11.2 | -2.5 | 14.352(028) | 14.438(010) | 14.441(005) | 14.884(007) | PONM | ||||
| 2018-02-11.3 | -2.3 | 14.273(002) | 14.961(003) | PS1 | ||||||
| 2018-02-11.3 | -2.4 | 14.235(014) | 14.446(013) | Gemini | ||||||
| 2018-02-11.7 | -2.0 | 14.331(031) | 14.435(010) | 14.241(004) | 14.498(005) | 14.957(008) | TNT | |||
| 2018-02-11.9 | -1.8 | 14.305(050) | 14.406(045) | 14.236(028) | 14.453(030) | Konkoly | ||||
| 2018-02-12.1 | -1.6 | 13.967(028) | 14.389(022) | 14.391(014) | 14.231(001) | 14.427(002) | 14.920(004) | LCO | ||
| 2018-02-12.2 | -1.5 | 15.215(010) | 14.337(011) | 14.281(010) | 14.572(018) | 14.398(008) | 14.968(009) | Swope | ||
| 2018-02-12.3 | -1.4 | 14.242(002) | 14.402(002) | PS1 | ||||||
| 2018-02-12.3 | -1.4 | 14.203(013) | 14.424(024) | Gemini | ||||||
| 2018-02-12.4 | -1.3 | 14.333(022) | 14.430(023) | 14.388(013) | 14.897(020) | DEMONEXT | ||||
| 2018-02-12.8 | -0.9 | 14.300(030) | 14.393(012) | 14.220(003) | 14.465(004) | 14.982(004) | TNT | |||
| 2018-02-13.2 | -0.5 | 13.973(028) | 14.353(015) | 14.338(014) | 14.210(002) | 14.378(002) | LCO | |||
| 2018-02-13.2 | -0.5 | 14.320(025) | 14.388(018) | 14.383(016) | 14.967(019) | DEMONEXT | ||||
| 2018-02-13.2 | -0.4 | 15.243(025) | 14.287(011) | 14.255(010) | Swope | |||||
| 2018-02-13.3 | -0.4 | 14.196(012) | 14.398(009) | Gemini | ||||||
| 2018-02-13.5 | -0.2 | 14.309(025) | 14.385(012) | 14.400(008) | 14.944(010) | PONM | ||||
| 2018-02-13.6 | -0.1 | 14.252(002) | 15.002(003) | PS1 | ||||||
| 2018-02-13.7 | +0.0 | 14.293(030) | 14.376(009) | 14.201(003) | 14.450(003) | 15.008(005) | TNT | |||
| 2018-02-14.3 | +0.6 | 15.296(061) | 14.345(011) | 14.258(010) | 14.215(012) | 14.390(008) | 15.059(010) | Swope | ||
| 2018-02-14.5 | +0.8 | 14.225(002) | PS1 | |||||||
| 2018-02-15.0 | +2.3 | 14.081(027) | 14.319(015) | 14.383(014) | 14.184(002) | 14.422(003) | 15.085(007) | LCO | ||
| 2018-02-15.2 | +1.5 | 15.317(010) | 14.354(011) | 14.275(009) | 14.256(008) | 14.383(008) | Swope | |||
| 2018-02-16.2 | +2.5 | 15.410(023) | 14.382(011) | 14.290(009) | 14.259(009) | 14.392(008) | 15.136(009) | Swope | ||
| 2018-02-16.3 | +2.6 | 14.367(025) | 14.413(010) | 14.400(007) | 15.066(010) | PONM | ||||
| 2018-02-16.9 | +3.2 | 14.157(027) | 14.364(016) | 14.398(013) | 14.200(002) | 14.425(004) | 15.106(009) | LCO | ||
| 2018-02-16.9 | +3.2 | 14.457(009) | 15.152(009) | LCO | ||||||
| 2018-02-16.9 | +3.2 | 14.400(104) | 14.279(030) | 14.608(054) | Konkoly | |||||
| 2018-02-17.2 | +3.5 | 14.230(031) | 14.451(016) | 14.411(013) | 14.293(002) | 14.437(002) | 15.127(006) | LCO | ||
| 2018-02-17.2 | +3.5 | 15.455(013) | 14.380(011) | 14.279(009) | 14.272(009) | 14.367(008) | 15.149(010) | Swope | ||
| 2018-02-17.7 | +4.0 | 14.400(042) | 14.439(013) | 14.293(009) | 14.429(013) | 15.129(027) | LJT | |||
| 2018-02-18.3 | +4.6 | 14.448(029) | 14.476(013) | 14.453(007) | 15.146(016) | PONM | ||||
| 2018-02-18.5 | +4.8 | 14.450(002) | PS1 | |||||||
| 2018-02-18.8 | +5.2 | 14.439(052) | 14.424(025) | 14.284(029) | 14.708(030) | Konkoly | ||||
| 2018-02-18.9 | +5.2 | 14.487(004) | 15.193(009) | LCO | ||||||
| 2018-02-19.1 | +5.4 | 14.326(027) | 14.465(015) | 14.455(013) | 14.280(002) | 14.489(003) | 15.205(008) | LCO | ||
| 2018-02-19.6 | +5.9 | 14.514(035) | 14.507(011) | 14.382(005) | 14.506(004) | 15.243(023) | LJT | |||
| 2018-02-20.2 | +6.5 | 14.552(029) | 14.540(014) | 14.549(015) | 15.253(022) | PONM | ||||
| 2018-02-20.2 | +6.5 | 15.720(023) | 14.516(011) | 14.382(009) | 14.423(008) | 14.495(007) | 15.320(008) | Swope | ||
| 2018-02-20.3 | +6.6 | 14.418(002) | 14.532(002) | PS1 | ||||||
| 2018-02-21.0 | +8.3 | 14.619(004) | T50 | |||||||
| 2018-02-21.2 | +7.5 | 14.524(029) | 14.646(016) | 14.550(014) | 14.450(002) | 14.592(002) | 15.345(005) | LCO | ||
| 2018-02-21.2 | +7.5 | 15.862(126) | 14.592(010) | 14.432(008) | 14.487(008) | 14.585(007) | Swope | |||
| 2018-02-21.3 | +7.6 | 14.414(012) | 14.594(026) | Gemini | ||||||
| 2018-02-21.5 | +7.8 | 14.472(002) | PS1 | |||||||
| 2018-02-21.8 | +8.1 | 14.637(049) | 14.597(015) | 14.490(009) | 14.655(014) | 15.420(028) | LJT | |||
| 2018-02-22.2 | +8.5 | 14.641(027) | 14.721(015) | 14.599(014) | 14.503(002) | 14.668(002) | 15.393(007) | LCO | ||
| 2018-02-22.2 | +8.5 | 15.959(017) | 14.627(011) | 14.465(009) | 14.522(008) | 14.619(007) | 15.453(009) | Swope | ||
| 2018-02-22.3 | +8.6 | 14.467(028) | Gemini | |||||||
| 2018-02-22.7 | +9.0 | 14.724(032) | 14.635(016) | 14.524(006) | 14.759(008) | 15.483(012) | TNT | |||
| 2018-02-23.2 | +9.5 | 14.765(032) | 14.689(012) | 14.727(004) | 15.465(009) | PONM | ||||
| 2018-02-23.2 | +9.5 | 16.051(017) | 14.700(011) | 14.507(009) | 14.544(008) | 14.678(008) | 15.532(009) | Swope | ||
| 2018-02-23.3 | +9.6 | 14.516(011) | 14.727(033) | Gemini | ||||||
| 2018-02-23.4 | +9.7 | 14.803(025) | 14.660(026) | 14.735(019) | 15.535(032) | DEMONEXT | ||||
| 2018-02-23.7 | +10.0 | 14.774(031) | 14.648(010) | 14.556(003) | 14.785(005) | TNT | ||||
| 2018-02-23.9 | +10.2 | 14.829(009) | T50 | |||||||
| 2018-02-24.2 | +10.5 | 14.793(027) | 14.821(016) | 14.726(015) | 14.588(003) | 14.820(007) | 15.600(014) | LCO | ||
| 2018-02-24.3 | +10.6 | 14.854(024) | 14.745(019) | 14.773(016) | 15.583(029) | DEMONEXT | ||||
| 2018-02-24.6 | +10.9 | 14.887(032) | 14.758(012) | 14.646(004) | 14.899(006) | 15.643(010) | TNT | |||
| 2018-02-24.9 | +11.2 | 14.649(126) | 14.695(081) | 15.102(039) | Konkoly | |||||
| 2018-02-25.2 | +11.5 | 16.307(027) | 14.866(012) | 14.618(010) | 14.652(009) | 14.794(008) | 15.686(009) | Swope | ||
| 2018-02-25.4 | +11.7 | 14.885(032) | 14.903(018) | 14.769(017) | 14.683(004) | 14.947(008) | LCO | |||
| 2018-02-25.8 | +12.1 | 14.944(010) | 15.684(017) | LCO | ||||||
| 2018-02-25.8 | +12.1 | 14.809(076) | 14.767(076) | 15.171(035) | Konkoly | |||||
| 2018-02-26.1 | +12.4 | 15.034(024) | 14.841(026) | 14.956(023) | 15.765(028) | DEMONEXT | ||||
| 2018-02-26.2 | +12.5 | 15.028(031) | 14.856(013) | 14.969(006) | 15.757(011) | PONM | ||||
| 2018-02-26.2 | +12.5 | 16.489(036) | 14.973(013) | 14.711(011) | 14.791(010) | 14.940(009) | 15.847(011) | Swope | ||
| 2018-02-26.6 | +12.9 | 15.070(032) | 14.860(011) | 14.780(006) | 15.055(007) | 15.827(012) | TNT | |||
| 2018-02-27.2 | +13.5 | 15.088(027) | 14.872(026) | 14.998(018) | 15.742(030) | DEMONEXT | ||||
| 2018-02-27.2 | +13.5 | 16.564(035) | 15.061(016) | 14.790(013) | 14.879(012) | 15.019(012) | 15.913(016) | Swope | ||
| 2018-02-27.3 | +13.6 | 14.992(013) | Gemini | |||||||
| 2018-02-27.7 | +14.0 | 15.159(045) | 14.963(022) | 14.964(014) | 15.932(056) | LJT | ||||
| 2018-03-01.6 | +15.9 | 15.323(038) | 15.058(016) | 15.025(012) | 15.235(012) | 15.941(020) | TNT | |||
| 2018-03-01.7 | +16.0 | 15.312(043) | 14.977(015) | 15.062(013) | 15.164(010) | LJT | ||||
| 2018-03-02.1 | +16.4 | 15.489(054) | 15.451(028) | 15.035(021) | 15.067(013) | 15.201(015) | 15.902(029) | LCO | ||
| 2018-03-02.2 | +16.5 | 15.425(034) | 15.062(034) | 15.157(028) | 15.859(052) | DEMONEXT | ||||
| 2018-03-02.3 | +16.6 | 15.033(011) | 15.189(017) | Gemini | ||||||
| 2018-03-02.5 | +16.8 | 15.590(089) | TNT | |||||||
| 2018-03-02.5 | +16.8 | 15.210(012) | 15.897(016) | LCO | ||||||
| 2018-03-03.2 | +17.5 | 15.499(032) | 15.113(031) | 15.169(021) | 15.874(031) | DEMONEXT | ||||
| 2018-03-03.2 | +17.5 | 15.126(009) | 15.202(018) | Gemini | ||||||
| 2018-03-03.9 | +18.2 | 15.213(008) | 15.850(013) | LCO | ||||||
| 2018-03-04.2 | +18.5 | 15.195(009) | 15.221(012) | Gemini | ||||||
| 2018-03-04.7 | +19.0 | 15.706(036) | 15.161(013) | 15.228(008) | 15.220(007) | 15.827(013) | TNT | |||
| 2018-03-04.8 | +19.1 | 15.708(068) | 15.127(068) | 15.025(025) | 15.180(031) | Konkoly | ||||
| 2018-03-05.2 | +19.5 | 15.739(026) | 15.137(043) | 15.185(023) | 15.764(039) | DEMONEXT | ||||
| 2018-03-05.2 | +19.5 | 15.782(033) | 15.216(023) | 15.244(010) | 15.850(020) | PONM | ||||
| 2018-03-05.2 | +19.5 | 15.265(012) | 15.232(020) | Gemini | ||||||
| 2018-03-05.5 | +19.8 | 15.767(032) | 15.196(011) | 15.286(005) | 15.219(007) | 15.768(011) | TNT | |||
| 2018-03-05.9 | +20.2 | 15.244(007) | 15.817(012) | LCO | ||||||
| 2018-03-06.2 | +20.5 | 15.356(020) | 15.249(022) | Gemini | ||||||
| 2018-03-06.2 | +20.5 | 15.156(008) | 15.108(009) | 15.226(013) | slotis | |||||
| 2018-03-06.4 | +20.7 | 15.859(040) | 15.180(039) | 15.150(017) | 15.726(031) | DEMONEXT | ||||
| 2018-03-07.2 | +21.5 | 15.945(032) | 15.233(041) | 15.200(015) | 15.736(031) | DEMONEXT | ||||
| 2018-03-07.2 | +21.5 | 15.970(029) | 15.287(033) | 15.255(012) | 15.749(017) | PONM | ||||
| 2018-03-07.2 | +21.5 | 15.437(012) | 15.253(019) | Gemini | ||||||
| 2018-03-07.2 | +21.5 | 15.200(006) | 15.122(007) | 15.253(008) | slotis | |||||
| 2018-03-07.8 | +22.1 | 15.915(069) | 15.236(041) | 14.967(075) | 15.106(059) | Konkoly | ||||
| 2018-03-08.1 | +22.4 | 17.766(037) | 15.984(014) | 15.228(010) | 15.577(010) | 15.184(009) | 15.761(010) | Swope | ||
| 2018-03-08.5 | +22.8 | 16.113(032) | 15.350(011) | 15.566(004) | 15.270(005) | 15.780(007) | TNT | |||
| 2018-03-08.8 | +23.1 | 15.289(007) | 15.753(010) | LCO | ||||||
| 2018-03-08.9 | +23.2 | 16.398(032) | 16.143(019) | 15.361(015) | 15.637(005) | 15.275(006) | 15.725(019) | LCO | ||
| 2018-03-08.9 | +23.2 | 16.083(100) | 15.303(035) | 15.041(033) | 15.070(041) | Konkoly | ||||
| 2018-03-09.1 | +23.4 | 17.813(033) | 16.144(014) | 15.304(010) | 15.680(010) | 15.216(008) | 15.770(009) | Swope | ||
| 2018-03-09.2 | +23.5 | 16.126(031) | 15.375(035) | 15.297(024) | 15.694(043) | PONM | ||||
| 2018-03-09.2 | +23.5 | 15.297(008) | 15.156(009) | 15.206(009) | slotis | |||||
| 2018-03-09.6 | +23.9 | 16.192(032) | 15.379(011) | 15.629(006) | 15.262(005) | 15.701(008) | TNT | |||
| 2018-03-10.2 | +24.5 | 16.165(036) | 15.372(045) | 15.242(024) | 15.620(026) | DEMONEXT | ||||
| 2018-03-10.2 | +24.5 | 15.338(016) | 15.163(024) | 15.206(023) | slotis | |||||
| 2018-03-10.7 | +25.0 | 16.330(033) | 15.444(011) | 15.744(005) | 15.311(005) | 15.720(007) | TNT | |||
| 2018-03-11.8 | +26.1 | 16.368(051) | 15.473(016) | 15.880(043) | 15.287(010) | 15.656(027) | LJT | |||
| 2018-03-11.9 | +26.2 | 16.765(045) | 16.452(031) | LCO | ||||||
| 2018-03-12.1 | +26.4 | 16.389(037) | 15.504(055) | 15.282(020) | 15.641(036) | DEMONEXT | ||||
| 2018-03-12.2 | +26.5 | 17.965(116) | 16.406(016) | 15.486(010) | 15.949(010) | 15.267(008) | 15.734(009) | Swope | ||
| 2018-03-12.6 | +26.9 | 16.349(045) | TNT | |||||||
| 2018-03-12.7 | +27.0 | 16.452(046) | 15.549(016) | 15.964(011) | 15.306(013) | 15.647(029) | LJT | |||
| 2018-03-12.8 | +27.1 | 15.482(103) | 15.155(064) | 15.117(072) | Konkoly | |||||
| 2018-03-13.1 | +27.4 | 18.174(058) | 16.468(018) | 15.477(011) | 15.965(011) | 15.314(009) | 15.641(010) | Swope | ||
| 2018-03-13.2 | +27.5 | 16.774(031) | 16.472(018) | 15.549(015) | 16.001(005) | 15.365(005) | 15.633(011) | LCO | ||
| 2018-03-13.3 | +27.6 | 15.481(009) | 15.167(009) | 15.075(009) | slotis | |||||
| 2018-03-13.4 | +27.7 | 15.373(008) | 15.616(014) | LCO | ||||||
| 2018-03-13.8 | +28.2 | 16.559(075) | 15.529(023) | 15.134(044) | 14.995(036) | Konkoly | ||||
| 2018-03-14.1 | +28.4 | 18.259(055) | 16.503(016) | 15.561(011) | 16.094(010) | 15.335(008) | 15.662(009) | Swope | ||
| 2018-03-14.2 | +28.5 | slotis | ||||||||
| 2018-03-14.7 | +29.0 | 16.634(054) | 15.666(026) | 16.118(014) | 15.357(020) | 15.603(036) | LJT | |||
| 2018-03-14.8 | +29.1 | 16.612(051) | 15.572(035) | 15.161(045) | 14.998(041) | Konkoly | ||||
| 2018-03-15.1 | +29.4 | 18.335(059) | 16.591(018) | 15.600(011) | 16.159(010) | 15.353(009) | 15.645(009) | Swope | ||
| 2018-03-15.6 | +29.9 | 16.650(034) | 15.673(015) | 16.092(009) | 15.411(011) | 15.635(017) | TNT | |||
| 2018-03-16.1 | +30.4 | 16.902(081) | 16.724(018) | 15.718(015) | 16.245(005) | 15.446(004) | 15.621(007) | LCO | ||
| 2018-03-16.1 | +30.4 | 18.300(054) | 16.650(016) | 15.672(012) | 16.214(011) | 15.411(009) | 15.621(009) | Swope | ||
| 2018-03-16.3 | +30.6 | 15.601(013) | slotis | |||||||
| 2018-03-17.1 | +31.4 | 18.478(064) | 16.754(018) | 15.768(012) | 16.314(011) | 15.437(009) | 15.642(009) | Swope | ||
| 2018-03-18.1 | +32.4 | 18.632(107) | 16.832(018) | 15.847(012) | 16.395(011) | 15.502(008) | 15.722(009) | Swope | ||
| 2018-03-18.5 | +32.8 | 16.973(039) | 15.876(015) | 16.350(008) | 15.599(013) | 15.746(014) | TNT | |||
| 2018-03-19.1 | +33.4 | 16.919(022) | 15.878(015) | 16.436(007) | 15.605(006) | 15.706(009) | LCO | |||
| 2018-03-19.1 | +33.4 | 18.615(148) | 16.910(018) | 16.383(011) | 15.534(008) | 15.684(009) | Swope | |||
| 2018-03-19.5 | +33.8 | 16.996(036) | 15.941(014) | 16.385(012) | 15.660(009) | 15.804(016) | TNT | |||
| 2018-03-20.1 | +34.4 | 18.770(153) | 16.984(018) | 15.868(013) | 16.535(011) | 15.644(008) | Swope | |||
| 2018-03-20.1 | +34.4 | 16.983(015) | 15.866(010) | 16.540(008) | 15.649(005) | Konkoly | ||||
| 2018-03-21.0 | +35.3 | 18.759(154) | 17.012(018) | 15.968(012) | 16.542(012) | 15.656(009) | 15.820(009) | Swope | ||
| 2018-03-21.3 | +35.6 | 15.884(011) | 15.539(012) | 15.267(013) | slotis | |||||
| 2018-03-21.6 | +35.9 | 17.114(039) | 16.047(021) | 16.496(018) | 15.823(037) | 15.926(069) | TNT | |||
| 2018-03-22.5 | +36.8 | 17.128(035) | 16.068(013) | 16.528(008) | 15.831(008) | 15.930(011) | TNT | |||
| 2018-03-23.1 | +37.4 | 19.104(161) | 17.196(020) | Swope | ||||||
| 2018-03-23.6 | +37.9 | 17.123(037) | 16.137(018) | 16.583(013) | 15.907(012) | 16.017(016) | TNT | |||
| 2018-03-24.1 | +38.4 | 17.359(131) | 17.170(133) | 16.152(021) | 16.687(016) | 15.882(011) | 15.964(017) | LCO | ||
| 2018-03-24.1 | +38.4 | 19.102(168) | 17.149(023) | 16.117(013) | 16.679(015) | 15.870(010) | 16.002(011) | Swope | ||
| 2018-03-24.3 | +38.6 | 15.414(306) | slotis | |||||||
| 2018-03-24.7 | +39.0 | 16.635(012) | 15.957(010) | 16.074(015) | TNT | |||||
| 2018-03-25.1 | +39.4 | 17.266(025) | 16.205(015) | 16.681(016) | 15.948(011) | 16.054(012) | Swope | |||
| 2018-03-26.1 | +40.4 | 19.129(157) | 17.190(025) | 16.239(015) | 16.804(016) | 16.011(011) | Swope | |||
| 2018-03-27.1 | +41.4 | 16.794(048) | 15.984(034) | 16.269(044) | Swope | |||||
| 2018-03-29.1 | +43.4 | 17.372(135) | 17.140(079) | 16.272(051) | 16.983(055) | 16.159(041) | 16.293(061) | LCO | ||
| 2018-03-29.3 | +43.6 | 16.276(021) | 15.926(023) | 15.721(022) | slotis | |||||
| 2018-03-31.3 | +45.6 | 16.298(054) | 16.037(073) | slotis | ||||||
| 2018-04-01.7 | +47.0 | 17.283(049) | 16.459(019) | 16.864(015) | 16.257(015) | 16.467(030) | LJT | |||
| 2018-04-02.7 | +48.0 | 17.296(063) | 16.507(028) | 16.936(020) | 16.346(035) | LJT | ||||
| 2018-04-03.7 | +49.0 | 17.404(047) | 16.584(028) | 16.912(017) | 16.358(016) | 16.544(032) | LJT | |||
| 2018-04-04.1 | +49.4 | 17.502(093) | 16.482(028) | 16.912(026) | 16.321(019) | 16.541(028) | LCO | |||
| 2018-04-04.2 | +49.5 | slotis | ||||||||
| 2018-04-05.3 | +50.6 | 16.445(016) | 16.229(017) | 16.021(018) | slotis | |||||
| 2018-04-07.0 | +52.3 | 16.885(002) | 16.819(002) | Decam | ||||||
| 2018-04-07.1 | +52.4 | 19.186(284) | 17.438(018) | 16.593(013) | 17.001(011) | 16.451(010) | 16.700(013) | Swope | ||
| 2018-04-07.6 | +52.9 | 16.396(221) | TNT | |||||||
| 2018-04-08.6 | +53.9 | 16.989(009) | 16.553(010) | 16.779(013) | TNT | |||||
| 2018-04-10.6 | +55.9 | 16.992(008) | 16.590(008) | 16.820(010) | TNT | |||||
| 2018-04-12.0 | +57.3 | 19.274(126) | 17.541(014) | 16.761(011) | 17.159(011) | 16.649(009) | 16.937(012) | Swope | ||
| 2018-04-12.7 | +58.0 | 17.473(056) | 16.831(101) | 17.043(048) | 16.861(340) | LJT | ||||
| 2018-04-13.0 | +58.3 | 19.290(240) | 17.518(015) | 16.759(012) | 17.100(010) | 16.653(009) | 16.915(011) | Swope | ||
| 2018-04-14.0 | +59.3 | 16.978(002) | 17.09(001) | Decam | ||||||
| 2018-04-14.1 | +59.4 | 17.570(015) | 16.768(011) | 17.149(010) | 16.660(009) | 16.978(011) | Swope | |||
| 2018-04-15.1 | +60.4 | 19.439(167) | 17.537(015) | 16.731(011) | 17.108(010) | 16.654(009) | 16.926(011) | Swope | ||
| 2018-04-15.5 | +60.8 | 17.133(011) | 16.814(016) | 17.080(017) | TNT | |||||
| 2018-04-16.0 | +61.3 | 19.431(274) | 17.678(016) | 16.826(013) | 17.513(031) | 16.808(011) | 17.097(016) | Swope | ||
| 2018-04-16.6 | +61.9 | 17.143(015) | 16.829(017) | 17.106(015) | TNT | |||||
| 2018-04-17.0 | +62.3 | 19.540(264) | 17.495(028) | 16.857(024) | 17.173(015) | 16.696(016) | Swope | |||
| 2018-04-17.0 | +63.3 | 17.087(002) | 17.243(002) | Decam | ||||||
| 2018-04-17.6 | +62.9 | 17.133(017) | 16.841(014) | 17.073(018) | TNT | |||||
| 2018-04-18.0 | +63.3 | 19.553(246) | 17.686(022) | 16.933(016) | 17.297(015) | 16.823(015) | 17.129(027) | Swope | ||
| 2018-04-20.5 | +65.8 | 17.536(069) | 16.908(039) | 17.119(040) | 16.835(023) | 17.040(043) | TNT | |||
| 2018-04-23.5 | +68.8 | 17.802(114) | TNT | |||||||
| 2018-04-24.0 | +70.3 | 17.229(002) | 17.519(002) | Decam | ||||||
| 2018-04-25.0 | +70.3 | 19.518(266) | 17.711(030) | 17.030(019) | 17.401(019) | 17.022(015) | 17.438(020) | Swope | ||
| 2018-04-25.6 | +70.9 | 17.687(079) | 17.054(041) | 17.271(049) | 17.070(042) | 17.384(084) | TNT | |||
| 2018-04-26.5 | +71.8 | 17.122(039) | 17.271(040) | 17.157(035) | 17.430(063) | TNT | ||||
| 2018-04-28.5 | +73.8 | 17.674(150) | 17.115(127) | 17.336(108) | 17.042(076) | 17.268(114) | TNT | |||
| 2018-05-02.0 | +78.3 | 17.797(004) | Decam | |||||||
| 2018-05-03.0 | +79.3 | 17.279(011) | 17.477(011) | 17.296(010) | 17.703(016) | Swope | ||||
| 2018-05-04.5 | +79.8 | 17.747(051) | 17.282(039) | 17.388(034) | 17.331(029) | 17.593(055) | TNT | |||
| 2018-05-06.0 | +81.3 | 19.837(241) | 17.944(019) | 17.326(016) | 17.538(013) | 17.382(013) | 17.775(022) | Swope | ||
| 2018-05-07.0 | +83.3 | 17.473(004) | 18.028(01) | Decam | ||||||
| 2018-05-07.0 | +83.3 | 17.495(009) | 18.042(016) | Decam | ||||||
| 2018-05-08.5 | +83.8 | 17.840(047) | 17.384(042) | 17.378(032) | 17.483(066) | 17.497(045) | TNT | |||
| 2018-05-09.0 | +84.3 | 17.921(017) | 17.332(014) | 17.528(012) | 17.448(015) | 17.855(020) | Swope | |||
| 2018-05-10.0 | +86.3 | 19.585(252) | 17.976(021) | 17.398(016) | 17.601(014) | 17.525(019) | 17.906(029) | Swope | ||
| 2018-05-12.0 | +88.3 | 19.440(359) | 18.126(019) | 17.545(017) | 17.699(013) | 17.672(016) | 18.018(027) | Swope | ||
| 2018-05-17.0 | +92.3 | 19.717(242) | 18.111(016) | 17.587(016) | 17.721(011) | 17.719(012) | 18.176(022) | Swope | ||
| 2018-05-18.6 | +93.9 | 17.818(063) | 17.550(056) | TNT | ||||||
| 2018-05-19.0 | +95.3 | 18.196(018) | 17.827(014) | Swope | ||||||
| 2018-05-20.0 | +95.3 | 19.922(271) | Swope | |||||||
| 2018-05-22.0 | +98.3 | 20.149(316) | 18.259(017) | 17.911(013) | 18.325(019) | Swope | ||||
| 2018-05-24.5 | +99.8 | 17.938(174) | 17.739(080) | 17.714(060) | 17.813(050) | 18.131(108) | TNT | |||
| 2018-05-25.0 | +100.3 | 17.897(013) | 17.962(013) | 18.402(017) | Swope | |||||
| 2018-06-03.0 | +110.3 | 19.680(241) | 18.386(012) | 17.921(010) | 18.000(010) | 18.260(018) | 18.664(030) | Swope | ||
| 2018-06-06.9 | +113.3 | 20.098(306) | 18.326(016) | 18.011(015) | Swope | |||||
| 2018-06-07.0 | +114.3 | 18.014(010) | 18.325(013) | 18.677(025) | Swope |
| Date | aaDays relative to B-band maximum on 2018-02-13.7 (JD 2458163.2).Epoch | (mag) | (mag) | (mag) | (mag) |
|---|---|---|---|---|---|
| 2018-02-07.2 | 6.5 | 15.571(051) | 14.900(061) | 15.196(111) | |
| 2018-02-09.2 | 4.5 | 15.442(049) | 14.767(061) | 15.215(121) | |
| 2018-02-13.2 | 0.5 | 15.778(047) | 14.891(058) | 15.208(100) | |
| 2018-02-15.2 | +1.5 | 15.032(055) | 15.361(124) | ||
| 2018-02-16.2 | +2.5 | 16.136(069) | 15.106(067) | 15.581(159) | |
| 2018-02-17.2 | +3.5 | 15.177(051) | 15.347(070) | 14.986(098) | |
| 2018-02-18.2 | +4.5 | 16.344(079) | 15.385(074) | 15.715(156) | |
| 2018-02-20.1 | +6.4 | 16.627(108) | 15.600(079) | 15.488(114) | |
| 2018-02-21.1 | +7.4 | 15.603(052) | 15.424(070) | 15.234(098) | |
| 2018-02-23.2 | +9.5 | 16.570(099) | 16.026(100) | 15.562(147) | |
| 2018-02-25.1 | +11.4 | 16.848(099) | 16.607(112) | 15.648(113) | |
| 2018-03-03.2 | +17.5 | 16.757(110) | 16.854(163) | 15.597(111) | |
| 2018-03-05.1 | +19.4 | 16.428(090) | 16.883(194) | 15.481(125) | |
| 2018-03-08.1 | +22.4 | 16.195(054) | 16.462(134) | 15.152(108) | |
| 2018-03-09.1 | +23.4 | 16.340(054) | 15.164(071) | 15.086(098) | |
| 2018-03-11.1 | +25.4 | 15.856(041) | 16.564(120) | 15.175(098) | |
| 2018-03-27.1 | +41.4 | 16.380(057) | 15.651(071) | 15.757(100) | |
| 2018-04-08.0 | +53.3 | 17.258(059) | 16.234(073) | 16.238(102) |
| Date | aaDays relative to B-band maximum on 2018-02-13.7 (JD 2458163.2).Epoch | uvw2 (mag) | uvm2 (mag) | uvw1 (mag) | U (mag) | B (mag) | V (mag) |
|---|---|---|---|---|---|---|---|
| 2018-02-05.4 | 8.3 | 17.117(092) | 18.04(146) | 15.783(065) | 14.228(045) | 14.784(045) | 14.804(061) |
| 2018-02-06.8 | 6.9 | 16.889(087) | 17.981(116) | 15.499(066) | 13.955(044) | 14.611(044) | 14.688(063) |
| 2018-02-07.5 | 6.2 | 16.967(096) | 17.98(135) | 15.394(069) | 13.912(044) | 14.501(044) | 14.675(067) |
| 2018-02-10.4 | 3.3 | 16.647(086) | 17.73(116) | 15.295(066) | 13.714(043) | 14.305(043) | 14.247(054) |
| 2018-02-17.0 | +4.3 | 16.848(102) | 17.708(132) | 15.678(078) | 14.147(047) | 14.36(043) | 14.251(056) |
| 2018-02-19.4 | +5.7 | 17.042(083) | 17.805(1) | 15.784(066) | 14.291(046) | 14.4(043) | 14.4(057) |
| 2018-02-22.7 | +9.0 | 17.448(11) | 16.279(076) | 14.735(052) | 14.66(044) | ||
| 2018-02-26.4 | +12.7 | 17.586(098) | 18.003(107) | 16.498(077) | 15.153(058) | 14.911(046) | 14.719(06) |
| 2018-03-11.5 | +25.8 | 18.374(117) | 18.645(121) | 17.595(099) | 16.792(082) | 16.332(063) | 15.416(064) |
| 2018-03-17.1 | +31.4 | 18.351(125) | 18.55(133) | 17.861(119) | 16.887(091) | 16.719(07) | 15.663(071) |
| UT Date | MJD | Epocha | Range (Å) | Res. (Å) | Inst. |
|---|---|---|---|---|---|
| 2018-02-05.2 | 58154.2 | 8.5 | 3640-10298 | 4.0 | HET |
| 2018-02-05.2 | 58154.2 | 8.5 | 3640-5220 | 2.0 | SOAR |
| 2018-02-05.5 | 58154.5 | 8.2 | 3300-10000 | 10.0 | Las Cumbres |
| 2018-02-06.2 | 58155.2 | 7.5 | 3380-10320 | 15.8 | NTT |
| 2018-02-06.7 | 58155.7 | 7.0 | 3498-9173 | 25.0 | LJT |
| 2018-02-07.2 | 58156.2 | 6.5 | 3190-10914 | 7.0 | Shane |
| 2018-02-07.3 | 58156.3 | 6.4 | 3640-7977 | 10.0 | Bok |
| 2018-02-07.3 | 58156.3 | 6.4 | 3685-9315 | 21.2 | NTT |
| 2018-02-08.2 | 58157.2 | 5.5 | 3640-10298 | 4.0 | HET |
| 2018-02-08.3 | 58157.3 | 5.4 | 3180-11252 | 7.0 | Shane |
| 2018-02-09.4 | 58158.4 | 4.3 | 3250-10000 | 10.0 | Las Cumbres |
| 2018-02-09.5 | 58158.5 | 4.2 | 3986-8834 | 15.0 | XLT |
| 2018-02-10.1 | 58159.1 | 3.6 | 3640-5220 | 2.8 | SOAR |
| 2018-02-10.3 | 58159.3 | 3.4 | 3799-9627 | 15.0 | APO |
| 2018-02-11.7 | 58160.7 | 2.0 | 3976-8830 | 15.0 | XLT |
| 2018-02-13.6 | 58162.6 | 0.1 | 3966-8816 | 15.0 | XLT |
| 2018-02-14.2 | 58163.2 | +0.5 | 3380-10320 | 15.8 | NTT |
| 2018-02-14.2 | 58163.2 | +0.5 | 3640-5220 | 2.8 | SOAR |
| 2018-02-14.6 | 58163.6 | +0.9 | 3249-10000 | 10.0 | Las Cumbres |
| 2018-02-15.5 | 58164.5 | +1.8 | 3976-8831 | 2.8 | XLT |
| 2018-02-16.3 | 58165.3 | +2.6 | 3380-7520 | 15.8 | NTT |
| 2018-02-16.6 | 58165.6 | +2.9 | 3975-8831 | 15.0 | XLT |
| 2018-02-18.7 | 58167.7 | +5.0 | 3958-8812 | 15.0 | XLT |
| 2018-02-19.2 | 58168.2 | +5.5 | 3380-7520 | 15.8 | NTT |
| 2018-02-19.5 | 58168.5 | +5.8 | 3959-8816 | 15.0 | XLT |
| 2018-02-20.5 | 58169.5 | +6.8 | 3400-10000 | 10.0 | Las Cumbres |
| 2018-02-21.7 | 58170.7 | +8.0 | 3981-8835 | 15.0 | XLT |
| 2018-02-22.2 | 58171.2 | +8.5 | 3380-7520 | 15.8 | NTT |
| 2018-02-27.7 | 58176.7 | +14.0 | 3501-9166 | 25.0 | LJT |
| 2018-03-01.7 | 58178.7 | +16.0 | 3501-9155 | 25.0 | LJT |
| 2018-03-06.2 | 58183.2 | +20.5 | 5601-6905 | 1.5 | MMT |
| 2018-03-07.4 | 58184.4 | +21.7 | 3250-10000 | 10.0 | Las Cumbres |
| 2018-03-08.2 | 58185.2 | +22.5 | 3380-10320 | 15.8 | NTT |
| 2018-03-09.6 | 58186.6 | +23.9 | 3961-8815 | 15.0 | XLT |
| 2018-03-11.6 | 58188.6 | +25.9 | 3899-9299 | 10.0 | Las Cumbres |
| 2018-03-12.7 | 58189.7 | +27.0 | 3497-9166 | 25.0 | LJT |
| 2018-03-14.2 | 58191.2 | +28.5 | 3752-9208 | 2.0 | Magellan |
| 2018-03-15.6 | 58192.6 | +29.9 | 3600-9999 | 10.0 | Las Cumbres |
| 2018-03-19.4 | 58196.4 | +33.7 | 3249-9999 | 10.0 | Las Cumbres |
| 2018-03-19.7 | 58196.7 | +34.0 | 3503-9165 | 25.0 | LJT |
| 2018-03-22.1 | 58199.1 | +36.4 | 3500-9040 | 6.0 | SOAR |
| 2018-03-23.5 | 58200.5 | +37.8 | 3965-8822 | 15.0 | XLT |
| 2018-03-23.7 | 58200.7 | +38.0 | 3492-9160 | 25.0 | LJT |
| 2018-03-24.1 | 58201.1 | +38.4 | 3380-10320 | 15.8 | NTT |
| 2018-03-25.0 | 58202.0 | +39.3 | 3966-8822 | 15.0 | XLT |
| 2018-04-06.1 | 58214.1 | +51.4 | 3715-8061 | 10.0 | Bok |
| 2018-04-06.1 | 58214.1 | +51.4 | 3380-10320 | 15.8 | NTT |
| 2018-04-07.5 | 58215.5 | +52.8 | 3966-8822 | 15.0 | XLT |
| 2018-04-21.0 | 58229.0 | +66.3 | 3560-8948 | 6.0 | SOAR |
| 2018-04-21.0 | 58229.0 | +66.3 | 3380-10320 | 15.8 | NTT |
| 2018-04-25.0 | 58233.0 | +70.3 | 3180-11252 | 7.0 | Shane |
| 2018-04-27.6 | 58235.6 | +72.9 | 3966-8822 | 15.0 | XLT |
| 2018-04-27.6 | 58235.6 | +72.9 | 3492-9160 | 25.0 | LJT |
| 2018-05-02.6 | 58240.6 | +77.9 | 3966-8822 | 15.0 | XLT |
| 2018-05-08.0 | 58246.0 | +83.3 | 3180-11252 | 7.0 | Shane |
| 2018-05-08.5 | 58246.5 | +83.8 | 3966-8822 | 15.0 | XLT |
| Band | (Å) | (MJD) | (mag) | (mag) |
|---|---|---|---|---|
| uvw2 | 2030 | 58161.2 0.2 | 16.67 0.07 | 1.08 0.49 |
| uvm2 | 2228 | 58164.1 0.8 | 17.71 0.05 | 0.49 0.46 |
| uvw1 | 2589 | 58160.5 0.1 | 15.31 0.07 | 1.32 0.45 |
| 3663 | 58161.1 0.1 | 13.98 0.01 | 1.19 0.12 | |
| 4360 | 58162.9 0.1 | 14.32 0.01 | 0.96 0.02 | |
| 5446 | 58164.1 0.1 | 14.37 0.01 | 0.63 0.06 | |
| 6414 | 58163.7 0.2 | 14.21 0.01 | 0.69 0.09 | |
| 7979 | 58161.7 0.2 | 14.47 0.02 | 0.64 0.15 | |
| 4640 | 58163.6 0.2 | 14.22 0.01 | 0.82 0.07 | |
| 6122 | 58163.3 0.1 | 14.38 0.01 | 0.70 0.08 | |
| 7440 | 58160.4 0.1 | 14.91 0.01 | 0.85 0.07 |
| Parameter | SALT2.4 | SNooPy2 | MLCS2k2 |
|---|---|---|---|
| (MJD) | 58163.34 (0.02) | 58162.67 (0.05) | 58162.70 (0.02) |
| 0.038 (0.001) | – | – | |
| 0.879 (0.012) | – | – | |
| (0.010) | – | – | |
| – | 0.00 (0.01) | 0.00 (0.01) | |
| – | 0.865 (0.060) | – | |
| – | – | -0.100 (0.08) | |
| (mag) | 33.614 (0.05) | 33.62 (0.22) | 33.57 (0.06) |
| Phase | Tbb | Si II 6355 (HV) | Si II 6355 | C II 6580 | Ca II 8498 (HV) | Ca II 8498 | S II 5454 | O I 7774 | Fe III 5129 | Fe III 4404 |
|---|---|---|---|---|---|---|---|---|---|---|
| (d) | (kK) | ( km/s) | ( km/s) | ( km/s) | ( km/s) | ( km/s) | ( km/s) | ( km/s) | ( km/s) | ( km/s) |
| 8.0 | 10.20 | 14.13 | 11.90 | 14.00 | 19.25 | 12.56 | 10.40 | 10.69 | 10.29 | 9.81 |
| 5.5 | 11.20 | 14.49 | 11.80 | 14.00 | 18.36 | 11.12 | 10.34 | 11.16 | 10.18 | 9.81 |
| 3.0 | 11.81 | 13.77 | 11.95 | 14.50 | 18.65 | 11.86 | 9.63 | 9.77 | 9.88 | 10.15 |
| +0.0 | 10.45 | 12.28 | 11.10 | 12.00 | 18.76 | 10.64 | 9.52 | 9.37 | 10.06 | 10.08 |
| +5.0 | 9.79 | 12.60 | 9.75 | 10.00 | 19.59 | 12.17 | 9.57 | 10.68 | 10.18 | 9.67 |
| +8.0 | 9.41 | 12.61 | 9.42 | 9.67 | 19.48 | 11.32 | 9,79 | 10.58 | 10.12 | 10.15 |
| +14.0 | 9.43 | 10.15 | 8.16 | 12.43 | 9.74 | 10.69 | 10.06 | 9.54 |
| Parameter | Value |
|---|---|
| Photometric | |
| 14.320.01 mag | |
| 0.090.02 mag | |
| 0.000.04 mag | |
| 0.960.03 mag | |
| () | 58162.70.3 day |
| 58144.370.04 day | |
| 18.30.3 day | |
| 1.49 erg s-1 | |
| 0.550.04 | |
| Spectroscopic | |
| (Si II) | 10,300300 km s-1 |
| (Si II) | 694 km s-1 d-1 |
| (Si II) | 0.150.04 |