Thermonuclear X-ray bursts in rapid succession in 4U 1636-536 with AstroSat-LAXPC
Abstract
We present results from an observation of the Low Mass X-ray Binary 4U 1636–536 obtained with the LAXPC instrument aboard AstroSat. The observations of 4U 1636–536 made during the performance verification phase of AstroSat showed seven thermonuclear X-ray bursts in a total exposure of 65 ks over a period of about two consecutive days. Moreover, the light curve of 4U 1636–536 revealed the presence of a rare triplet of X-ray bursts, having a wait time of about 5.5 minutes between second and the third bursts. We also present results from time-resolved spectroscopy performed during these seven X-ray bursts. In addition, we have also detected a transient Quasi-periodic oscillation (QPO) at 5 Hz. However, we did not find any evidence of kilo-hertz QPOs and/or X-ray burst oscillations, perhaps due to the hard spectral state of the source during this observation.
keywords:
accretion, stars: neutron, X-rays: binaries, X-rays: bursts, individual: 4U 1636–5361 Introduction
Thermonuclear X-ray bursts (also known as Type-I X-ray bursts) are eruptions in X-rays that can be observed from neutron star (NS) low mass X-ray binaries (LMXBs). These are triggered in the NS envelope due to unstable thermonuclear burning of hydrogen and helium accreted from a low-mass stellar companion (e.g., Woosley & Taam, 1976; Schatz et al., 1998). During thermonuclear X-ray bursts, the X-ray luminosity increases many times of the persistent level (for reviews, see Lewin et al., 1993; Strohmayer & Bildsten, 2006; Galloway et al., 2008). Within a few tens of seconds ergs of energy is released. We do not discuss herein long bursts and superbursts that are comparatively more energetic, ergs (for details refer., in ’t Zand, 2011).
It is believed that most of the accreted fuel is burned during a burst. Therefore,
the atmosphere must be completely replaced before a new burst can ignite (see e.g., Woosley
et al., 2004; Fisker
et al., 2008).
X-ray bursts with a recurrence time of hours to days have been
detected from over 100 sources in our Galaxy 111https://www.sron.nl/ jeanz/bursterlist.html
(see e.g., Lewin
et al., 1993; Strohmayer &
Bildsten, 2006; Galloway et al., 2008).
However, bursts having short recurrence times varying between 3 to 45 minutes have been observed from
15 sources (see Keek et al., 2010, for details).
A large fraction of X-ray burst studies have been done with the
Proportional Counter Array (PCA) aboard Rossi X-ray Timing Explorer (RXTE)
(see e.g., Galloway et al., 2008).
The shortest recurrence time reported by Galloway et al. (2008) in RXTE-PCA light curves
is 6.4 minutes. Linares
et al. (2009) later, reported a short recurrence time of
5.4 minutes using RXTE observations of 4U 1636–536.
Keek et al. (2010) reported the shortest recurrence time between X-ray bursts
from 4U 1705–44 to be 3.8 minutes.
There also exist an exceptional source, IGR J17480–2446
that showed large number of recurring X-ray bursts during its outburst in 2010.
During this outburst, X-ray bursts with recurrence time as short as 3.3 minutes were also
observed (Motta
et al., 2011; Linares et al., 2012).
A study carried out by Boirin
et al. (2007) using a long X-ray observation of EXO 0748–676 with the XMM-Newton observatory
discovered short recurrence time (8-20 minutes) bursts.
The same authors showed that short recurrence time bursts are less energetic compared
to the “normal” recurrence times (few hours).
They also found that short recurrence time bursts have
peak temperature lower compared to the “normal” recurrence times
bursts and the profiles
of such bursts lack 50 - 100 s long tail.
An extensive study carried out by Galloway et al. (2008) using RXTE
data of 48 accreting neutron stars revealed that the short recurrence time bursts in many other sources also showed a behaviour
that is similar to that observed by Boirin
et al. (2007).
Several possibilities have been discussed to explain short recurrence time
X-ray bursts. For instance, Fisker et al. (2004)
suggested a waiting point in the chain of nuclear reaction network. Very recently Keek &
Heger (2017)
proposed an alternative model that show that
there are left overs of the accreted material after the previous X-ray event
and these are transported by convection to the ignition depth, producing short recurrence time burst.
The Large Area X-ray Proportional Counter (LAXPC) instrument on-board the Indian
multi-wavelength mission AstroSat has timing capabilities similar to that of PCA
aboard RXTE but has a larger effective area at higher energies (see next section for details).
Verdhan Chauhan
et al. (2017) and Bhattacharyya
et al. (2018) reported detections of thermonuclear X-ray bursts
in the LMXB 4U 1728–34. These authors also showed the presence of burst oscillations during the X-ray burst.
4U 1636-536, an extraordinary (most luminous) atoll source (Hasinger & van der Klis, 1989) which exhibits a wide variety of X-ray bursts such as double-peaked X-ray bursts (Sztajno et al., 1985; Bhattacharyya & Strohmayer, 2006), triple-peaked X-ray bursts (van Paradijs et al., 1986; Zhang et al., 2009), superbursts (Wijnands, 2001; Kuulkers et al., 2004), short recurrence time bursts (Keek et al., 2010) was observed with LAXPC as a part of the performance verification. In this work, we report results obtained from the observations of 4U 1636–536 with the LAXPC instrument. We found a total of seven thermonuclear X-ray bursts in these observations of 4U 1636–536 and in particular, we observed the presence of short recurrence time bursts (a rare triplet). We also present the results obtained from the time-resolved spectroscopy performed during X-ray bursts. This is a technique which is often employed for the measurement of neutron star parameters such as its radius (see e.g., Lewin et al., 1993; Galloway et al., 2008; Bhattacharyya, 2010, for details).
2 Observations
2.1 AstroSat-LAXPC
AstroSat is the first Indian multi-wavelength astronomical satellite launched on September 28, 2015. It has five instruments on-board (Agrawal, 2006; Paul, 2013). Large Area X-ray Proportional Counter (LAXPC) is one of the primary instruments aboard. LAXPC consists of three identical proportional counters with a total effective area of 6000 at 15 keV. The LAXPC detectors have a collimator with a field of view of about . Each LAXPC detector independently records the time of arrival of each photon with a time resolution of 10 s. The energy resolution at 30 keV is about 15, 12, 11 for LAXPC10, LAXPC20, LAXPC30 respectively (Yadav et al., 2016; Antia et al., 2017).
2.2 Data
LAXPC data was collected in two different modes: Broad Band Counting (BBC) and Event Analysis mode (EA). Data collected in the event mode of LAXPC contains information about the time, anodeID and Pulse Height (PHA) of each event. Therefore, we have used EA mode data for the timing and spectral analysis. As a part of the performance verification, AstroSat observed thermonuclear X-ray burst source 4U 1636–536 covering 22 orbits during 15-16 February 2016. Observation details are given in Table 1.
| Orbit Number | On-Source Exposure (s) |
|---|---|
| 02078 | 1925 |
| 02079 | 2769 |
| 02080 | 2764 |
| 02081 | 2776 |
| 02082 | 2771 |
| 02083 | 2764 |
| 02084 | 2392 |
| 02085 | 2815 |
| 02086 | 3239 |
| 02087 | 3662 |
| 02088 | 3851 |
| 02089 | 3741 |
| 02090 | 3303 |
| 02091 | 2779 |
| 02092 | 736 |
| 02093 | 2357 |
| 02094 | 2394 |
| 02095 | 2737 |
| 02096 | 2739 |
| 02097 | 2733 |
| 02098 | 2436 |
| 02099 | 2862 |
3 Results
3.1 Light Curves
2

2

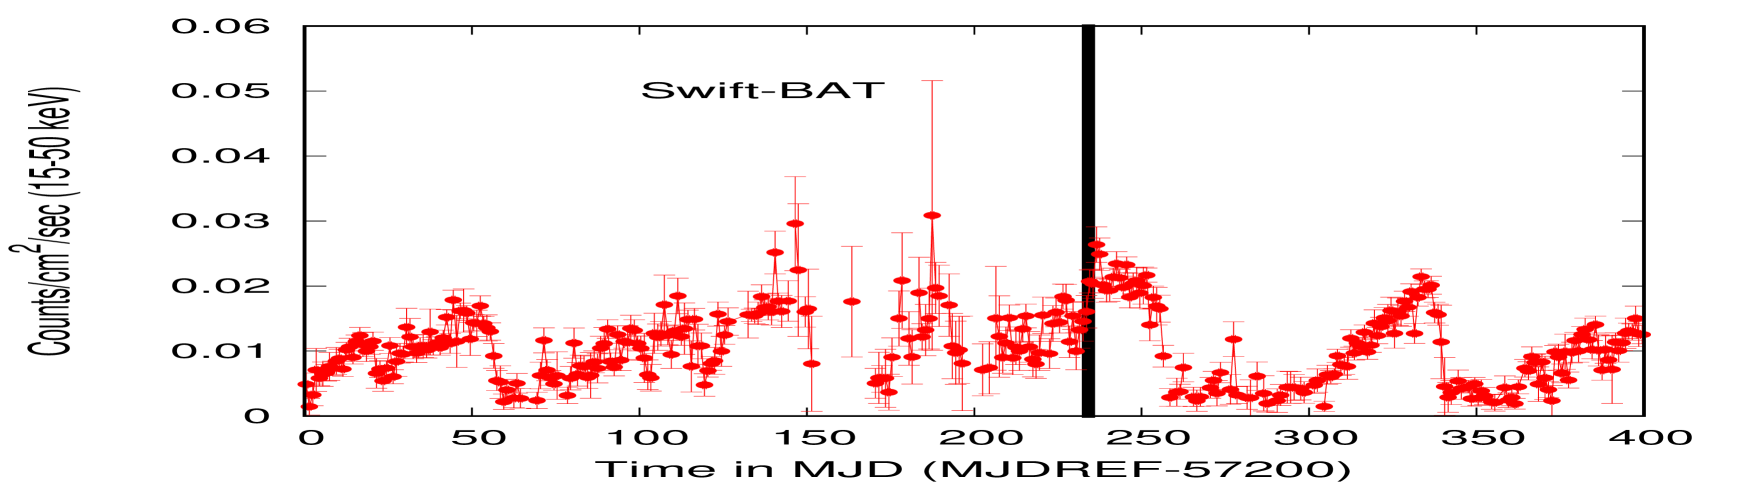
The Swift/Burst Alert Telescope (BAT)
is a hard X-ray transient monitor which observes
88 of the sky each day and provides
near real-time coverage of the X-ray sky in the energy range
15-50 keV (Krimm
et al., 2013). We have used
Swift-BAT light curve of 4U 1636–536
to determine the spectral
state of this source (see Figure 1).
The BAT light curve of 4U 1636–536 has been binned with a binsize of 1 day.
The BAT light curve of 4U 1636–536 shows
the long-term variability of about 40 days
from 2015 March to 2016 November.
Since BAT is a hard X-ray monitor therefore
the peak of the light curve (high value of flux in 15-50 keV band)
would suggest the hard spectral state of a source.
Figure 2 shows 3-80 keV light curve of 4U 1636–536 obtained using the data of LAXPC. We plot light curve of each detector separately to demonstrate the identical nature of light curves in the three detectors of LAXPC.
For creating the light curve of 4U 1636-536 with LAXPC, we have used data from all the layers of all the three proportional counter units of LAXPC. Good time intervals (GTI) based on the following filtering criteria: elevation angle from Earth horizon greater than 2 degrees, Charged Particle Monitor (CPM; Rao et al., 2017) count rate less than 12 counts s-1 and angle offset less than 0.22 degrees were used to create the source light curves. We have used the LAXPC tool task ‘lxplc’ for the extraction of light curve. lxplc tool allows selection of events based on layers and energy channels. We have used channels ranging from 25-611 of each layer for the extraction of light curves of LAXPC10, channels 27-646 for LAXPC30 while we have used channels 20-484 for the extraction of light curve using data from LAXPC20 (which has lower gain compared to LAXPC10, LAXPC30 (Antia et al., 2017). The light curves were binned with a binsize of 1 second. Light curve of each proportional counter unit consists of a persistent emission separated by data gaps and seven thermonuclear X-ray bursts. Data gaps in the observation corresponds to times during the Earth occultation and the satellite passing through the South Atlantic Anomaly (SAA) region. The light curves show nearly a constant total count-rate of about 414 counts/s, 320 counts/s, 327 counts/s over the entire duration in LAXPC10, LAXPC20, LAXPC30 respectively except during the seven thermonuclear X-ray bursts observed. The average count-rate in LAXPC10, LAXPC20, LAXPC30 measured during the earth occultation is 221 counts/s, 147 counts/s, 137 counts/s respectively, which accounts for most of the background.
The X-ray bursts observed were found in the data of orbits, viz. 02084, 02087, 02091, 02094 and 02099. The zoomed-in version of these X-ray bursts in each LAXPC unit is shown in the Appendix (Appendix A).
3.2 A triplet of X-ray Bursts
We have found a very rare triplet of X-ray bursts in the light curve (see Figure 3). This triplet was seen in the last orbit of the observation. To estimate the time difference or the wait time between two X-ray events in a triplet, we followed the definition of Boirin et al. (2007). These authors defined wait time of a burst as the separation between its peak time and the peak time of the previous burst. The wait time between two X-ray bursts namely, burst 1 and burst 2 of the triplet is 7 minutes while the wait time between the last and the second burst (burst 3 and burst 2 of the triplet) is about 5.5 minutes.
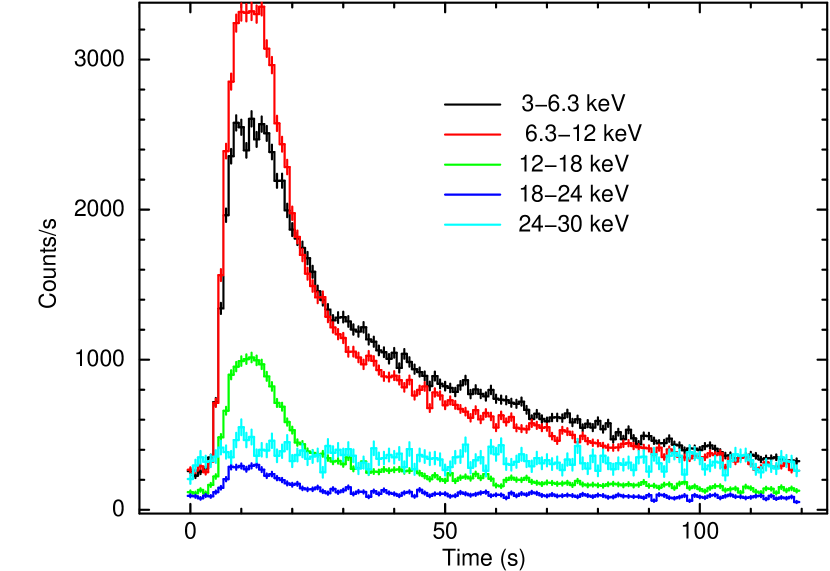
3.3 Energy-Resolved Burst Profiles
To observe the energy dependence of these X-ray bursts, we created light curves during an X-ray burst in five different narrow energy bands namely, 3-6 keV, 6-12 keV, 12-18 keV, 18-24 keV and 24-30 keV. The light curves were created using data from all layers of three counters of LAXPC and with a binsize of 1 second. Figure 4 shows an energy resolved light curve of the burst 1 seen in the observation of 4U 1636–536. For the light curve in the 24-30 keV band, the count-rates have been multiplied by a factor 5 for the visual clarity. This figures indicates that bursts are detected upto 30 keV. We extracted light curves above 30 keV to investigate the effect of bursts on the light curves at higher energies. Light curves created in the 30-80 keV band showed the presence of a dip. The dip observed in the light curves was similar to the some reports of dip observed in hard X-rays during bursts in other sources (Maccarone & Coppi, 2003; Chen et al., 2013; Kajava et al., 2017). However, dip observed in the LAXPC light curves could also be due to the deadtime effect and to investigate this we corrected hard X-ray light curve for the total count rate in each detector. The count rates were scaled by applying appropriate deadtime correction222http://www.rri.res.in/ rripoc/. We observed after applying this correction the dip disappeared (see Figure 5).
We also noticed the energy dependence of the burst duration in Figure 4. Therefore, we measured the energy dependence of the burst duration in all the seven X-ray bursts. To measure the exponential decay times during each energy resolved burst profile we fitted the burst profiles with the QDP model ’burs’. We found that there is a gradual decrease in the decay time with an increase in energy. Decay time of an X-ray burst varied between 28 seconds and 10 seconds (Figure 6). A gradual decrease in the temperature due to cooling of burning ashes along the burst decay is the cause of observed energy dependence of burst duration (see e.g., Degenaar et al., 2016).
3.4 Time-Resolved Spectroscopy
We observed from the energy-resolved light curves that X-ray bursts are detected only upto 30 keV (see Figure 4).
In LAXPC, the soft and medium energy X-rays do not reach the bottom layers of the detectors.
Therefore, we have performed time-resolved spectroscopy using
single events from the top layer (L1, L2) of each detector of LAXPC. This was done to
minimize the background.
Each proportional counter has a different energy response file
based on various factors gain, quantum efficiency, energy resolution etc.
The gain of the LAXPC detector may vary from observation
to observation, therefore we first estimated the gain of each detector of LAXPC
using the tool k-events-spec’.
We found that during the entire observations the value of gain compared to ground calibration data was
1.0, 0.99, 1.05 for LAXPC10, LAXPC20, LAXPC30 respectively.
Based on all these necessary checks we selected an appropriate response file
needed while performing spectroscopy. Additional care was taken about the deadtime correction.
We modified the value of backscal’ keyword
of each time-resolved spectra.
The value was calculated using , where is the count-rate and is
measured deadtime ( 42.3 microseconds).
In order to investigate spectral evolution during X-ray bursts,
the spectra during X-ray bursts were extracted
using a time interval of 1 second.
For each burst, we extracted the spectrum
using 16 seconds of data preceding the burst.
This was subtracted for all burst intervals as the underlying
accretion emission and background.
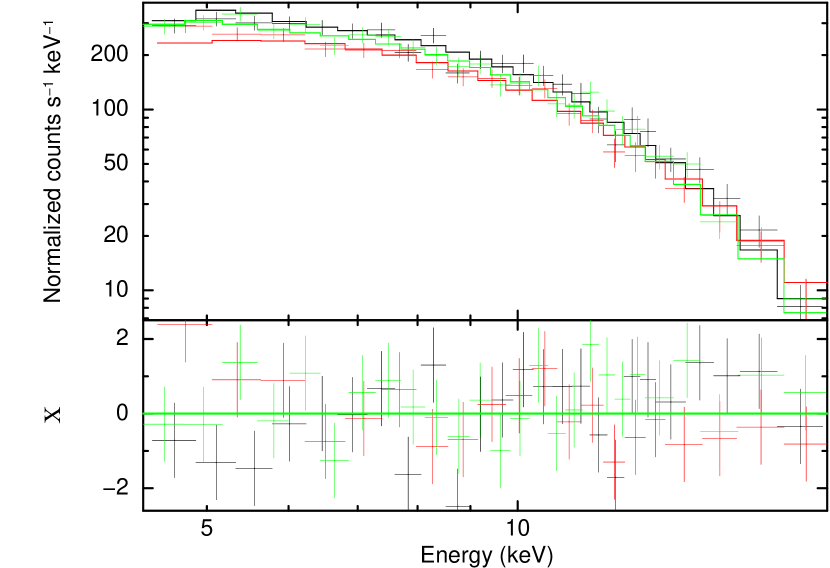
The net burst spectra in 4-20 keV band were fitted in XSPEC (Arnaud, 1996),
using a blackbody model ‘BBODYRAD’ consisting
of two parameters, a temperature () and a normalization
(), where is the blackbody radius
and is the source distance in units of 10 kpc. To account
for interstellar extinction, we used the ’TBABS’ model
component (Wilms
et al., 2000). Since Hydrogen column density is not well constrained
in the LAXPC energy band, therefore we fixed (Galloway et al., 2008).
Figure 7 shows an example count-rate
spectrum fitted with a blackbody model attenuated
with an interstellar absorption component.
While performing the spectral fitting we have also added a
systematic error of to the time-resolved spectra.
In Figure 8, we show the best-fit parameters obtained after performing time-resolved spectroscopy of the seven bursts. The top panel of each plot shows count-rate during an X-ray burst, the second panel shows the temperature evolution and the third panel shows the blackbody normalization during each short segment of an X-ray burst. Flux estimated in 4-20 keV band is shown in the fourth panel of each plot while the fifth and the sixth panels show the reduced chi-squared obtained from each spectral fitting and the radius measured from the values of blackbody normalization respectively. We have not applied the correction factors such as color correction factor for the measurement of a real value of neutron star radius. The maximum temperature observed in an X-ray burst 1 is keV. The emission radii inferred from the blackbody normalization spectral fit suggests that it is a Photospheric radius Expansion X-ray burst. Nearly same value of maximum temperature was also seen in burst 2, 3, 4 and 5. However, we notice a lower value of maximum temperature (1.7 keV) in last two bursts of the triplet.


of the burst 4, the plot in the middle is for the burst 5 while the right plot is for burst 6.
(Third Panel): Best-fit parameters obtained after performing time-resolved spectroscopy of the burst 7.


3.5 Power Density Spectrum
We have added light curves from all the three detectors of LAXPC to generate the power density spectra of 4U 1636–536. To have a high ratio of the source to the background count rate, we have used data from the top two layers and restricted the light curves to 3-25 keV band333http://www.rri.res.in/ rripoc/. We searched for both low frequency and high frequency QPOs in the light curves excluding X-ray bursts. For the case of low frequency QPOs we used the light curves binned with a binsize 1 ms while for the high frequency QPO search we used light curves having binsize of 0.1 ms. The light curves were divided into segments each with 8192 bins. PDS from all the segments were averaged to produce the final PDS. Figure 9 shows the presence of a weak low frequency QPO-like feature around 5 Hz observed in the light curve of one of the orbit (02079). However, the Q-factor of this QPO-like feature is low 1.2. We also searched for the presence of milli-hertz QPOs in the light curves of each orbit separately, however, we did not find the presence of any such feature in the PDS. On the right hand side of Figure 9, we show the PDS obtained after using light curves from all the orbits. This covers wide range of frequency 1-5000 Hz. We also attempted to search for burst oscillations using light curves during the X-ray bursts, however, we did not find any burst oscillations around the previously observed burst oscillation feature at 580 Hz (Strohmayer & Markwardt, 2002).
4 Discussions
In this work, we have used a long LAXPC observation of 4U 1636–536.
The light curve of 4U 1636–536
revealed the presence of seven X-ray bursts.
Last orbit of the observation
showed a triplet of X-ray bursts. Triplet of
X-ray bursts are rare events.
Therefore, we searched the literature and found that a total of 19
triplets of X-ray bursts have been observed so far from sources other than 4U 1636–536.
The wait time between the three bursts of these X-ray triplets
is less then 30 minutes (Table 2). In particular, EXO 0748–676
showed X-ray bursts having
wait times of 12 minutes between the three bursts of triplets (Boirin
et al., 2007).
| Observation ID | Wait Times | Wait Times |
|---|---|---|
| (minutes) | (minutes) | |
| First & second burst | Second & third burst | |
| 60032-05-07-01 | 8.4 | 11.6 |
| 93087-01-42-10 | 13.8 | 7.4 |
4.1 Burst Catalog
Multi-INstrument Burst ARchive (MINBAR) is a collection of Type I bursts that are observed with different X-ray observatories (RXTE, BeppoSAX, INTEGRAL), and that are all analyzed in a uniform way. Currently, it contains information on 6987 Type I X-ray bursts from 84 burst sources (MINBAR version 0.9)444http://burst.sci.monash.edu/minbar. MINBAR was used to locate RXTE-PCA observations of 4U 1636-536 that shows bursts with recurrence times of less than 30 minutes. Table 3 shows the X-ray burst triplets observed in the RXTE-PCA light curves and that were not included in Keek et al. (2010). We found two additional triplet of X-ray bursts in 4U 1636-536 which were not reported by Keek et al. (2010). The shortest wait time observed between second and the third burst of a triplet of X-ray bursts in the RXTE-PCA light curves is 7.4 minutes. However, the shortest wait time observed between first and the second burst of a triplet in the PCA light curves is 8 minutes. We thus, notice that the LAXPC observation of 4U 1636–536 revealed one of the shortest triplet among all the known triplet of X-ray bursts (Table 2) and also the shortest time difference ( 5.5 minutes) among the triplet of bursts observed in this source (Table 3). Similar wait time was also reported by Linares et al. (2009) during the doublet of X-ray bursts of 4U 1636–536. Several models have been proposed to explain the occurence of short recurrence bursts. Very recently, Keek & Heger (2017) proposed one-dimensional multi-zone model that reproduce short recurrence bursts on the observed timescale of minutes. Their simulations are based on the convective mixing driven by opacity. The authors proposed that bursts that ignite in a relatively hot neutron star envelope leave a substantial fraction of unburnt fuel and convective mixing bring this fuel down to the ignition depth on the observed timescale of minutes. We compared our observational results with that predicted by Keek & Heger (2017). We observe that although the recurrence timescales matches with that obtained by Keek & Heger (2017) but the profile of triple X-ray bursts obtained by these authors do not match the one observed with LAXPC. The authors predicted intermediate bumps between the X-ray bursts which are caused by convection, however, we do not seen such bumps in the light curves. Moreover, the X-ray burst in the middle of the triplet is much fainter compared to the other two X-ray bursts in the triplet. This is again not consistent with that predicted by Keek & Heger (2017). Grebenev & Chelovekov (2017) recently studied short recurrence X-ray bursts using the data of INTEGRAL. The authors found the profile of triple X-ray bursts similar to that has been observed in 4U 1636-536 using the data of LAXPC. The authors explained these short recurrence bursts based on the model of a spreading layer of accreting matter over the neutron star surface. However, these authors believe that further refinement in the model is required for the complete understanding of the existence of triple X-ray bursts.
The large effective area of the LAXPC instrument at
higher energies allowed us to create the energy resolved burst profiles.
We found that bursts were detected upto 30 keV.
Above 30 keV, the raw light curves of LAXPC detectors showed a dip similar to those
reported in some other sources (Maccarone &
Coppi, 2003; Kajava et al., 2017).
However, after a deadtime correction,
the hard X-ray light curve during the burst was found to be consistent with the pre-burst emission.
We observe a strong energy dependence of burst decay times.
Decrease in the burst decay times with the increase in energy
suggests the cooling of burning ashes.
Time-resolved spectroscopy during X-ray bursts was performed
using spectra with 1 second time interval. From the time
resolved spectroscopy we found that
the maximum temperature measured is keV.
The power density spectral analysis showed the presence of a
QPO around 5 Hz. The low frequency QPO is observed
in black holes and in accreting neutron stars as well
as in non-pulsating neutron stars. The low frequency QPO covers a wide range
between 0.1 and 50 Hz (see Altamirano
et al., 2008b, and references therein).
Moreover, these authors suggest that the range of low frequency covered
in a source is not related to spin
frequency, angular momentum or luminosity of the
object.
We did not detect any Kilo-hertz QPOs
in this observation of 4U 1636–536.
This again suggests hard spectral state of the source
as high frequency QPOs are often observed during the
soft spectral state of this source (Belloni et al., 2007). This is well supported by the
fact that the Swift-BAT light curve suggested
that this observation of 4U 1636–536 was
made near the peak of its light curve in 15-50 keV band.
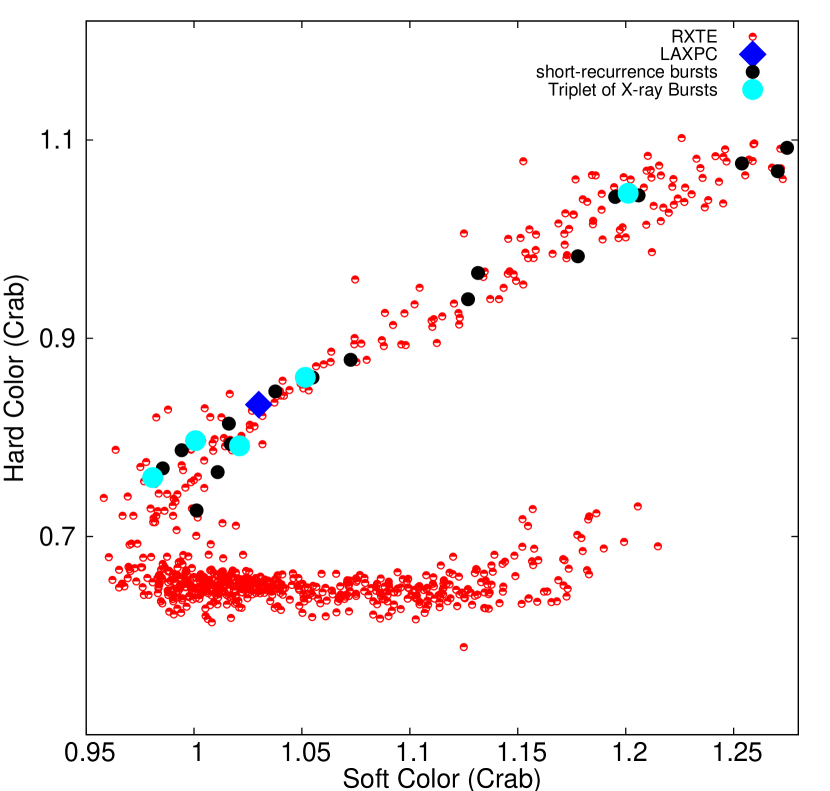
The Atoll sources are known to display three main tracks in the color-color diagram.
These three spectral states are: the extreme island state (EIS),
the island state (IS) and the banana branch (BB) (Hasinger &
van der Klis, 1989).
Altamirano (2008) have described in detail the characteristics of each
of these states. To confirm the hard (island) spectral state
of the present LAXPC observation,
we have used the color-color diagram of 4U 1636–536 (Figure 1 of Altamirano et al. (2008a)).
The authors defined soft and hard colors as
the ratio of count-rates in 3.5-6.0 keV / 2.0-3.5 keV
and 9.7-16.0 keV/6.0-9.7 keV respectively.
They also normalized the colors by the corresponding
Crab Nebula color values that are closest in time to
correct for the gain changes as well as for the differences in
the effective area between different proportional counters of RXTE.
We have adapted the same technique to estimate the colors of the LAXPC
observation, however, we have used slightly different energy bands for the estimation of colors.
For the soft and the hard colors, we used the ratios of count-rates in 6.0-9.7 keV / 3.0-6.0 keV and
16.0-25.0 keV / 9.7-16.0 keV respectively.
It is quite interesting to notice that the LAXPC observation falls on the island branch
which corresponds to the hard spectral state (see Figure 10).
We also noticed that all the previous known short recurrence bursts
from this source (see e.g., Keek et al., 2010) lie on the island branch of the color-color diagram.
The observations performed with RXTE that exhibit triplets of X-ray bursts (shown in cyan color in Figure 10)
also lie close to this observation performed with LAXPC.
(Altamirano et al., 2008a) showed that close to the transition between the island
and the banana state, 4U 1636–536 exhibits millihertz quasi-periodic oscillations (mHz QPOs)
(see Figures 1 & 2 of their paper). We did not detect any milli-hertz oscillations
in the power density spectrum created using the LAXPC observation.
The non-detection of mHz QPOs further supports the fact that the current
observation does not lie close to the transition region between the island
and the banana state.
It is proposed that mHz QPOs are the consequence of marginally stable
burning on the neutron star surface (Heger et al., 2007).
The non-detection of mHz QPOs in the LAXPC observation
suggests that the accreted fuel is not available for the
stable burning (Altamirano et al., 2008a). This is well supported by the fact that we observe
seven consecutive bursts in almost day long observation.
To summarize, we present the results obtained with the study of seven thermonuclear X-ray bursts observed with AsroSat-LAXPC. The short recurrence time bursts (a rare triplet) in the LMXB 4U 1636–536 have been detected for the first time with AsroSat-LAXPC. We have shown the energy dependence of burst profiles and have also discussed the caveats due to the background at higher energies. This paper along with two other papers on thermonuclear X-ray bursts observed with LAXPC (Verdhan Chauhan et al., 2017; Bhattacharyya et al., 2018) demonstrates the sensitivity of the LAXPC instrument to detect and study thermonuclear X-ray bursts.
Acknowledgments
A.B. & M.P. gratefully acknowledge the Royal Society and SERB (Science Engineering Research Board, India) for financial support through Newton-Bhabha Fund. A.B thanks Dr. Diego Altamirano for providing the RXTE data for Figure 10, and for useful discussions. We acknowledge strong support from Indian Space Research Organization (ISRO) in various aspect of LAXPC instrument building, testing, software development and mission operation during payload verification phase. This paper uses preliminary analysis results from the Multi-INstrument Burst ARchive (MINBAR), which is supported under the Australian Academy of Science’s Scientific Visits to Europe program, and the Australian Research Council’s Discovery Projects and Future Fellowship funding schemes. We also thank Dr. Laurens Keek for providing information on bursts that were not included in their paper (Keek et al., 2010).
References
- Agrawal (2006) Agrawal P. C., 2006, Advances in Space Research, 38, 2989
- Altamirano (2008) Altamirano D., 2008, PhD thesis, Sterrenkundig Instituut “Anton Pannekoek” University of Amsterdam
- Altamirano et al. (2008a) Altamirano D., van der Klis M., Wijnands R., Cumming A., 2008a, ApJ, 673, L35
- Altamirano et al. (2008b) Altamirano D., van der Klis M., Méndez M., Jonker P. G., Klein-Wolt M., Lewin W. H. G., 2008b, ApJ, 685, 436
- Antia et al. (2017) Antia H. M., et al., 2017, ApJS, 231, 10
- Arnaud (1996) Arnaud K. A., 1996, in Jacoby G. H., Barnes J., eds, Astronomical Society of the Pacific Conference Series Vol. 101, Astronomical Data Analysis Software and Systems V. p. 17
- Belloni et al. (2007) Belloni T., Homan J., Motta S., Ratti E., Méndez M., 2007, MNRAS, 379, 247
- Bhattacharyya (2010) Bhattacharyya S., 2010, Advances in Space Research, 45, 949
- Bhattacharyya & Strohmayer (2006) Bhattacharyya S., Strohmayer T. E., 2006, ApJ, 636, L121
- Bhattacharyya et al. (2018) Bhattacharyya S., et al., 2018, ApJ, 860, 88
- Boirin et al. (2007) Boirin L., Keek L., Méndez M., Cumming A., in’t Zand J. J. M., Cottam J., Paerels F., Lewin W. H. G., 2007, A&A, 465, 559
- Chen et al. (2013) Chen Y.-P., Zhang S., Zhang S.-N., Ji L., Torres D. F., Kretschmar P., Li J., Wang J.-M., 2013, ApJ, 777, L9
- Degenaar et al. (2016) Degenaar N., Koljonen K. I. I., Chakrabarty D., Kara E., Altamirano D., Miller J. M., Fabian A. C., 2016, MNRAS, 456, 4256
- Fisker et al. (2004) Fisker J. L., Thielemann F.-K., Wiescher M., 2004, ApJ, 608, L61
- Fisker et al. (2008) Fisker J. L., Schatz H., Thielemann F.-K., 2008, ApJS, 174, 261
- Galloway et al. (2008) Galloway D. K., Muno M. P., Hartman J. M., Psaltis D., Chakrabarty D., 2008, ApJS, 179, 360
- Grebenev & Chelovekov (2017) Grebenev S. A., Chelovekov I. V., 2017, Astronomy Letters, 43, 583
- Hasinger & van der Klis (1989) Hasinger G., van der Klis M., 1989, A&A, 225, 79
- Heger et al. (2007) Heger A., Cumming A., Galloway D. K., Woosley S. E., 2007, ApJ, 671, L141
- Kajava et al. (2017) Kajava J. J. E., Sánchez-Fernández C., Kuulkers E., Poutanen J., 2017, A&A, 599, A89
- Keek & Heger (2017) Keek L., Heger A., 2017, ApJ, 842, 113
- Keek et al. (2010) Keek L., Galloway D. K., in’t Zand J. J. M., Heger A., 2010, ApJ, 718, 292
- Krimm et al. (2013) Krimm H. A., et al., 2013, ApJS, 209, 14
- Kuulkers et al. (2004) Kuulkers E., in’t Zand J., Homan J., van Straaten S., Altamirano D., van der Klis M., 2004, in Kaaret P., Lamb F. K., Swank J. H., eds, American Institute of Physics Conference Series Vol. 714, X-ray Timing 2003: Rossi and Beyond. pp 257–260 (arXiv:astro-ph/0402076), doi:10.1063/1.1781037
- Lewin et al. (1993) Lewin W. H. G., van Paradijs J., Taam R. E., 1993, Space Sci. Rev., 62, 223
- Linares et al. (2009) Linares M., et al., 2009, The Astronomer’s Telegram, 1979
- Linares et al. (2012) Linares M., Altamirano D., Chakrabarty D., Cumming A., Keek L., 2012, ApJ, 748, 82
- Maccarone & Coppi (2003) Maccarone T. J., Coppi P. S., 2003, A&A, 399, 1151
- Motta et al. (2011) Motta S., et al., 2011, MNRAS, 414, 1508
- Paul (2013) Paul B., 2013, International Journal of Modern Physics D, 22, 1341009
- Rao et al. (2017) Rao A. R., et al., 2017, Journal of Astrophysics and Astronomy, 38, 33
- Schatz et al. (1998) Schatz H., et al., 1998, Phys. Rep., 294
- Strohmayer & Bildsten (2006) Strohmayer T., Bildsten L., 2006, New views of thermonuclear bursts. pp 113–156
- Strohmayer & Markwardt (2002) Strohmayer T. E., Markwardt C. B., 2002, ApJ, 577, 337
- Sztajno et al. (1985) Sztajno M., van Paradijs J., Lewin W. H. G., Trumper J., Stollman G., Pietsch W., van der Klis M., 1985, ApJ, 299, 487
- Verdhan Chauhan et al. (2017) Verdhan Chauhan J., et al., 2017, ApJ, 841, 41
- Wijnands (2001) Wijnands R., 2001, ApJ, 554, L59
- Wilms et al. (2000) Wilms J., Allen A., McCray R., 2000, ApJ, 542, 914
- Woosley & Taam (1976) Woosley S. E., Taam R. E., 1976, Nature, 263, 101
- Woosley et al. (2004) Woosley S. E., et al., 2004, ApJS, 151, 75
- Yadav et al. (2016) Yadav J. S., et al., 2016, Proc. SPIE, 9905, 99051D
- Zhang et al. (2009) Zhang G., Méndez M., Altamirano D., Belloni T. M., Homan J., 2009, MNRAS, 398, 368
- in ’t Zand (2011) in ’t Zand J., 2011, preprint, (arXiv:1102.3345)
- van Paradijs et al. (1986) van Paradijs J., Sztajno M., Lewin W. H. G., Trumper J., Vacca W. D., van der Klis M., 1986, MNRAS, 221, 617
Appendix A Thermonuclear X-ray Bursts as seen in three proportional counter units of LAXPC
Here, we show burst profiles as seen in different proportional counters of LAXPC. The light curves were binned with a binsize of 1 second. The count-rates and profile shapes are consistent in all the detectors.


