Lagrangian study of the final warming in the southern stratosphere during 2002: Part II. 3D structure.
Abstract
This two-part paper aims to provide a Lagrangian perspective of the final southern warming in spring of 2002, during which the stratospheric polar vortex (SPV) experienced a unique splitting. We approach the subject from a dynamical systems viewpoint and search for Lagrangian coherent structures using a Lagrangian descriptor that is applied to reanalysis data. Part I presents our methodology and focuses by means of a kinematic model, on the understanding of fundamental processes for filamentation and ultimately for vortex splitting on an isentropic surface in the middle stratosphere. The present Part II discusses the three dimensional (3D) evolution of the flow during the selected event. For this, we apply concepts developed in Part I concerning a definition of the vortex boundary that helps in the selection of trajectories to illuminate the evolving flow structures, and a criterion that allows to justify why at an isentropic level a pinched vortex will split in later times. Lagrangian structures identified include surfaces that are several kilometers deep, and which a particle trajectory analysis confirms as barriers to the flow. The role of Lagrangian structures in determining the fate of particles during the SPV splitting is discussed.
. Keywords: Stratospheric warming, Lagrangian transport structures, normally hyperbolic invariant manifold (NHIM), filamentation, vortex split, links between troposphere and stratosphere
| 22 Septiembre | 24 September 2002 | 26 September 2002 | |
|---|---|---|---|
|
40 km |
 |
 |
 |
|
30 km |
 |
 |
 |
|
16 km |
 |
 |
 |
|
14 km |
 |
 |
 |
|
12 km |
 |
 |
 |
1 Introduction
Advances in data gathering and processing systems have allowed for the assembly of a pictorial view in three dimensions (3D), including air motions and composition, during stratospheric sudden warmings. Notably, [1] (see also references therein) used the European Centre for Medium-Range Weather Forecasts (ECMWF) Re-Analysis (ERA-40) to investigate the evolution of the observed major midwinter stratospheric sudden warmings in the northern Hemisphere for the period 1957-2002. They considered separately vortex-displacement and vortex-splitting events, and documented the differences between their evolving vertical structures. [2] used data from six different reanalysis products to produce a sudden stratospheric warming compendium for a region that extends from the surface to the stratosphere, as the importance of stratospheric-tropospheric connections have become increasingly apparent.
Evidence from 3D numerical simulations with high resolution points to the existence of complex flow structures during the warmings. For example, [3] simulated the evolution in the stratosphere of the event during February 1979 with a 3D primitive equation model of the stratosphere. They found that strong vertical velocities can develop both in the lower and upper stratosphere during the events. Most studies such as those referenced above have been performed in a Eulerian context. Progress in dynamical systems, especially over the last 15 years, is offering the possibility of studying complex 3D flows following a Lagrangian approach. This is particularly appropriate for the stratosphere, where transport is of paramount importance.
The present two-part paper follows a Lagrangian approach to study the stratospheric polar vortex (SPV) in the southern hemisphere during the final warming in spring of 2002, when it experienced a unique splitting at upper levels in late September. In Part I we present our methodology and focus on the description of the processes at work for filamentation and vortex splitting on an isentropic surface in the middle stratosphere. Part I also includes an Annex with a concise review of the Lagrangian concepts we use. In this Part II we examine the three-dimensional (3D) evolution of the event with special emphasis on (i) vortex splitting, and (ii) formation of barriers to transport in the 3D flow as introduced by [4] (referred to as JC17).
The analysis reveals a SPV over the polar region with a columnar two-lobe structure extending and branching unevenly upwards, and a distinct subtropical jet stream in the troposphere. The role of Lagrangian structures in determining the fate of parcels in reference to their organization in either one or two vortices is discussed in detail. We find compelling evidence of deep 3D barriers to transport in the stratosphere that from the mathematical point of view can be identified with the Normally Hyperbolic Invariant Manifolds (NHIM) described in JC17.

Our principal analysis tool is the Lagrangian descriptor known as the function . This is defined in Part I, where we review its properties in the context of 2D flows. In Part II we also use the ERA-Interim reanalysis dataset produced by the European Centre for Medium-Range Weather Forecasts (ECMWF; [5]).
JC17 presents a methodology to compute from 3D velocity fields in the ERA Interim reanalysis. The first step consists of obtaining the parcel trajectories. A special feature of our calculation procedure is that, on z-constant surfaces and in order to bypass singularities at the pole with the spherical coordinates, parcels are advanced on a cartesian coordinate system with a Runge-Kutta Method that used a time step of 1 hour. The vertical velocity used to advance parcels in the vertical is calculated from (Pa/s), temperature and specific humidity provided by ERA-Interim. Once the trajectories are computed, M is obtained on a spatial grid of 600x500 points. Next, the principal issue is the interpretation of the Lagrangian descriptor features in terms of hyperbolic trajectories and their invariant manifolds. This interpretation issue is not fully resolved at the moment for the 3D context because it requires theoretical guidance that needs further development. Some help in our case is provided by the fact that on appropriate time scales, stratospheric flows are quasi 2D in the sense that the magnitude of the vertical velocity component is much smaller than the horizontal velocity. For such flows, JC17 exploited the concept of normally hyperbolic invariant manifold (NHIM), which we will use in this Part II.
| (a) on 24 September 2002 00:00:00 | (b) on 24 September 2002 18:00:00 |
|---|---|
 |
 |
| (c) on 24 September 2002 00:00:00 | (d) on 24 September 2002 18:00:00 |
 |
 |
We give a simple illustration of the NHIM concept as follows. Let us consider the 2D flow in the neighborhood of a hyperbolic point (x0, y0) fixed in time together with its associated unstable and stable manifolds. A flow in the 3D space can be defined by “stacking up” the 2D surfaces in the z direction. In this flow, the hyperbolic points form a line in the z direction and the manifolds form vertical surfaces and act as 2D barriers to the particles. This is an idealization of the NHIM concept. Since NHIMs persist under perturbation (i.e. both horizontal and vertical perturbations) [6, 7], the application of this concept to stratospheric flows is relevant since the vertical component of velocity is significantly smaller than the horizontal component. Consequently this approach allows us to conclude the existence of similar structures in the reanalysis data. Hints of the NHIMs are given in the paper by [8], who performed a trajectory analysis of a large wavebreaking event in the northern polar vortex during 1992-1994 and found that such filaments have a deep vertical structure.
The recent paper by [9] represents an advance in the interpretation of the NHIM and its structures in 3D vector fields for which analytic solutions are known or can be obtained by exact calculations. The results of this paper, as well as others currently in preparation, give us confidence in working with such structures as detected by our Lagrangian descriptor.
| (a) 9 September 2002 00:00:00 | (b) 24 September 2002 09:00:00 |
 |
 |
| (c) 25 September 2002 01:00:00 | (d) 26 September 2002 05:00:00 |
 |
 |
Part II is organized as follows. Section 2 presents the Lagrangian descriptor at several constant height levels from the upper troposphere to the stratosphere. Section 3 details the particle evolution in the middle stratosphere during the SPV splitting. Section 4 describes the vertical structure of the flow during the event. Section 5 consists of a summary and a list of conclusions.
2 The southern troposphere-stratosphere in spring 2002
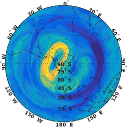
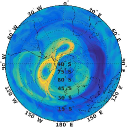
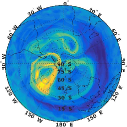
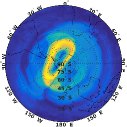
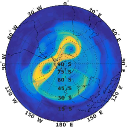
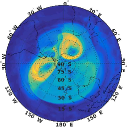
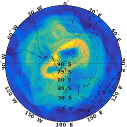
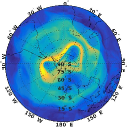
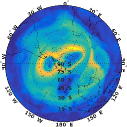
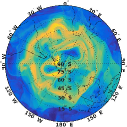
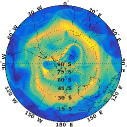
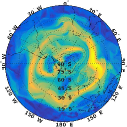
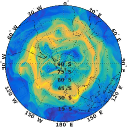
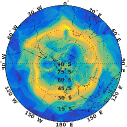
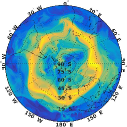
The values of on 22, 24, and 26 September at different levels in the vertical are presented in Figure 1. The figure corresponding to Figure 1 at constant potential temperature levels is in the supplementary material from which similarities are visible specially at upper levels. In the present paper, we use the z-coordinate when we wish to emphasize geometric structures in 3D, such as those are probed by remote sounding devices. We work in isentropic coordinates when our focus is on the behavior of trajectories in reference to the edge of the polar vortex. This is done because the vertical displacements of parcels from horizontal surfaces can be much larger than from isentropic surface and hence trajectories in the latter system are more representative than in the former. In plots of , bright yellow and dark blue colors are assigned to the highest and lowest values, respectively.
Figure 1 shows a meandering yellow band in the high latitudes at and above 14 km. This is the signature of the SPV. On 22 September, the SPV has started to pinch at 16 km. This process continues on 24 September, and by 26 September the SPV has clearly split above 16 km and two distinct vortices have formed. Also at all times, we can see the signature of the subtropical jet stream at and below 14 km as another meandering, bright yellow band at around 30oS. The jet stream break just west of South America resembles the Rossby wave breaking in the Double Downstream case of [10]. In such a case, air with low PV intrudes poleward along the western flank of South America, contributing to define a cyclonic region in the southeastern Pacific.
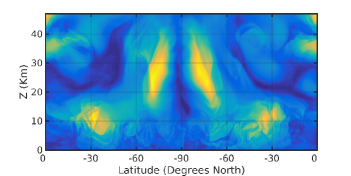
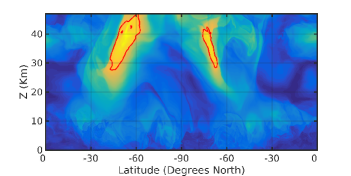
Figure 2 shows the vertical Lagrangian structure of the troposphere and stratosphere once the SPV partially recovered in the upper stratosphere after the splitting at the end of September. The function has been computed with days on the 15 October 2002 on the vertical cross section W and E. The strongest values of correspond to the subtropical jet stream centered at about S, 10 km height, and the SPV extending almost vertically at higher levels around the pole at about S.
3 The SPV split in September 2002
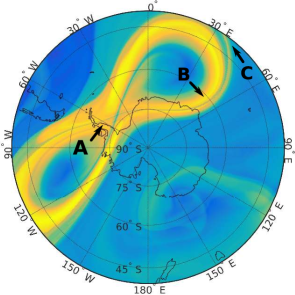
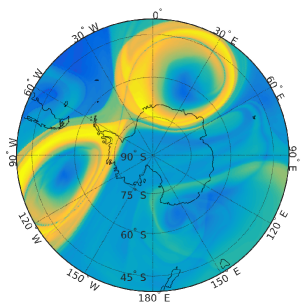
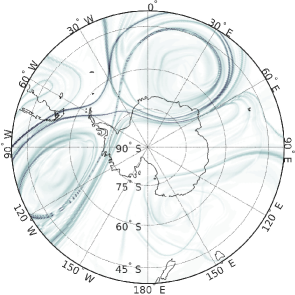
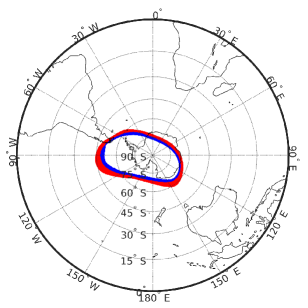
Figures 3(a) and (b) show the function computed with =5 day at 850K ( km) just before and after the vortex split at that level, respectively. Figures 3(c) and (d) display the corresponding plots for , which help in the visualization of strong contrasts in the Lagrangian descriptor as those expected along the manifolds. Note that according to Part I, the structure of unstable and stable manifolds intersecting at the hyperbolic trajectory and indicated in panels (c) and (d) of these figures by the red and blue arrows, respectively, anticipates the vortex splitting at this level.
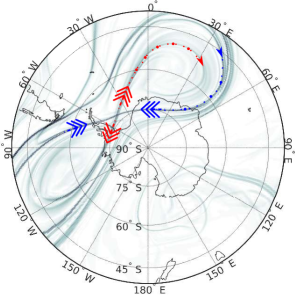
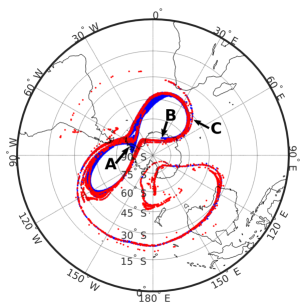
To visualize the process of filamentation and organization of the flow around the manifolds during the splitting, we look at the trajectories of particles within the kinematic vortex boundary in instances before and after the event. In Part I, we justify our procedure to identify this boundary using the PDF of , and argue why we expect useful information from differentiating the behaviour of particles between the regions of the kinematic vortex boundary that are outside and inside the curve of maximum for each longitude. Accordingly, in this case, we estimate the vortex boundary using the PDF of with on 9 September 2002 00:00:00 at 850K. In Figure 4(a), the particles within the boundary are drawn in either blue or red according to their location inside and outside the curve defined by the maximum of values of for each longitude, respectively. Such a separation helps us to capture the origin of the filaments as particles in the boundary that approach a hyperbolic trajectory after time period is equal to or longer than the used to calculate .
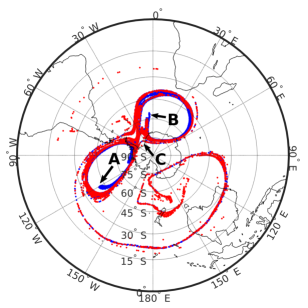
Figure 4 shows that in times preceding the vortex splitting, starting around 24 September 2002 09:00:00, some particles, mainly those with red colour, have been eroded from the vortex forming a long filament that extends across the south Pacific and Australia (see Figure 3(b)). On this day, we label selected sets of particles with capital letters in order to facilitate the description of their behaviour.

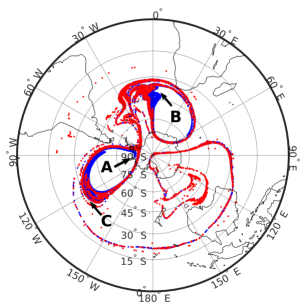
We next inspect the role played by those manifolds highlighted by coloured arrows in Figure 3 on the particle evolution during the vortex splitting. At this time, particles (A) over the jet approach the hyperbolic trajectory through the stable manifold (see Figs. 3(a),(c)). Particles (B) and (C) are over the vortex over the South Atlantic and Indian Ocean, and both sets also approach the hyperbolic trajectory through the stable manifold (see Figs. 3(a),(c)). At later times, particles (A) move away from the hyperbolic trajectory following the branch of the unstable manifold that keeps them circling into the vortex over the South Pacific (see Figs.4(b)-(d)). Particles (B) and (C) also move away from the hyperbolic trajectory following different branches of the unstable manifold. In this way, the set of particles (B) remains in the same vortex and the set of particles (C) swaps to the other one (see Figs. 4(b)-(d)). The parcel behavior just described confirms that the thin singular lines visible in Figure 3 act as material barriers to transport. Additional information on the particle evolutions in 2D is found in movie S2 of the supplementary material.
| (a) | (b) |
 |
 |
| (c) | (d) |
 |
 |
4 Vertical structure of the flow in the stratosphere
To examine the vertical structure of the flow during the SPV splitting, we first extend the definition of vortex boundary from an isentropic surface as in Part I to a range of heights. For this, we select a representative height and compute the PDF of in order to obtain the value that delimits the fat tail of the distribution. We will use the same value of for the heights within the range under consideration. For example, from inspection of the PDF of with for 9 September 2002 00:00:00 at 31.3km height, we find the normalized value , which is then used for other heights. Figure 5 shows the kinematic vortex boundary in a vertical cross-section of the function where the red lines bound the locations with normalized values larger than 0.92. The vortex boundary is several kilometers deep, extending from 27 to 42km. The particles inside these regions produce no, or at least minimal, filamentation during the time interval centered on 9 September 2002. Below 27 km the vortex is weaker and no clear boundary region is obtained from the procedure.
| (a) | (b) |
 |
 |
On 24 September 2002, during the SPV pinching displayed in Figure 3(a) at 850K, the unstable and stable manifolds intersect at the hyperbolic trajectory. As explained in Section 2, this hyperbolic trajectory exists at different levels conforming the normally hyperbolic invariant curve. To show the structure of the manifolds associated with the NHIM to which this hyperbolic trajectory belongs, we look at cross sections of at different heights. Figure 6 shows an analogue to Figure 3(c) at different potential temperature levels. It is clear from the figure that the hyperbolic trajectory persist throughout all those.
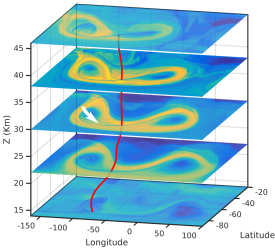
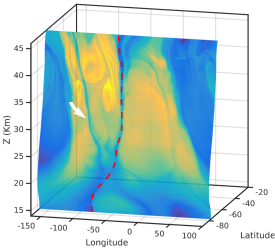
A 3D pictorial representation of the NHIM and associated manifolds is challenging because they consist of a curve and surfaces in the 3D space, respectively. Figure 7 is an attempt at such a representation. Panel 7(a) plots in perspective horizontal cross-sections of at km, on which the stable and unstable manifolds are clearly seen. The intersections between these manifolds at each level define the NHIM. This Lagrangian structure is indicated by the red line in all panels. Next we define a 3D surface formed by horizontal lines of constant latitude at each point of the NHIM (see figure 7(b))
The bright yellow colors of in panels 7(a) and 7(b) capture the SPV. Accordingly, the NHIM extends throughout a deep layer of the stratosphere (18 km - 45 km). The white arrows emphasize the unstable manifold in the different panels. Note in panel 7(b) that the barrier to transport formed by the unstable manifold extends several kilometers with the vertical.
Figure 7 indicates that the hyperbolic trajectory can be found in a region of the stratosphere that is several km deep, i.e. the pinching event occurs in a wide range of heights, however the splitting does not develop at all levels but only at those in which the criterion developed in Part I is satisfied. Let us now concentrate on the manifold structures below 850 K on 24 September 2002. Figure 6 presents at 700K, 600K, 530K, and 470K on 24 September 2002 00:00:00 with days. According to Part I, the structures of unstable and stable manifolds intersecting at the hyperbolic trajectory and marked by the red and blue arrows are consistent with an evolution leading to vortex splitting only above , which agrees with the observation. The consistency is indicated by the way in which the separation between lines that contain the small blue and red arrows in Figure 6 changes in height. We can verify the applicability of our criterion by inspecting the trajectory of particles during the SPV splitting at different levels. The similarity of patterns between at different levels implies that the manifolds found are intersections of quasi-vertical surfaces. These 2D surfaces act as dynamical barriers in the 3D flow and prevent transport between the emerging vortices, as confirmed in Section 4 using particles trajectories analysis.
Although the NHIM (and hence the pinching) extends between 18 km - 45 km (Figure 7(b)), the vortex splitting only occurs from above 600K ( 25 Km) as it can be seen by combining the information given by Figures 1 and 6. This is consistent with the configuration of stable and unstable manifolds at each level in Figure 7(a) according to the splitting criteria in Part I, Figure 10. We have also verified by computing parcel trajectories from different initial conditions that the unstable manifold shown in Figure 7 acts as a 2D barrier to the flow.
5 Summary and Conclusions
We examine in this two-part paper the behaviour of the stratospheric polar vortex (SPV) in the southern stratosphere during the final warming in the spring of 2002. Our analysis is performed in the context of dynamical systems theory and the search for Lagrangian coherent structures: (i) hyperbolic trajectories and their stable and unstable manifolds, (ii) 2-tori, and (iii) the normally hyperbolic invariant manifolds (NHIM) recently identified in the stratospheric context. Part I presents our methodology and focuses on the understanding of fundamental processes for filamentation and ultimately for vortex splitting on an isentropic surface in the middle stratosphere. Part II discusses the 3D evolution of the event. In this discussion, we apply concepts developed in Part I concerning a definition of the vortex boundary that helps in the selection of trajectories to illuminate the evolving flow structures, and a criterion that allows to anticipate at an isentropic level whereas a pinched vortex would split as it evolves in time.
From the Lagrangian viewpoint, we have emphasized the evolution of unstable and stable manifolds, which were crucial to the vortex splitting and essential components of a NHIM. Based on illustrations of the function in different cross sections we argued how the hyperbolic trajectories and intersecting manifolds could be thought as forming a curve and surfaces in the 3D space. A trajectory analysis confirms that such surfaces represent barriers to the flow at least during the time corresponding to the selected for calculation of . We also confirmed the consistency of the criterion based on the structure of manifolds on an isentropic surface developed in Part I for vortex splitting at later times and its absence below .
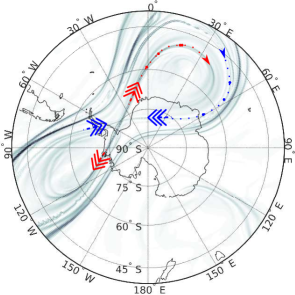
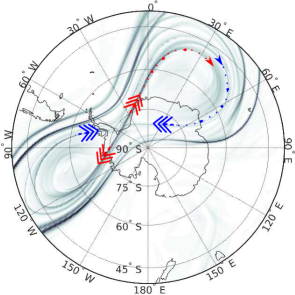
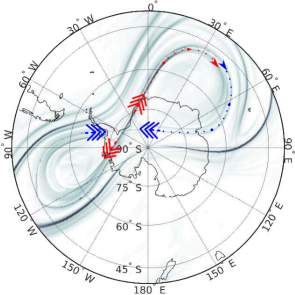
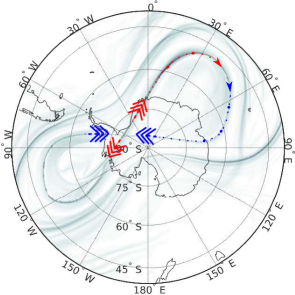
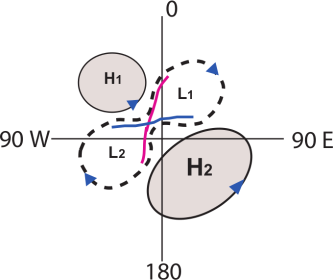
The 3D structure of the function shows vortex features in the upper stratosphere during the splitting in September 2002 that could be traced down to the troposphere. Figure 8 is a schematic of such features in the upper stratosphere. At the start of the second half of the September, the SPV was displaced from a polar position by the intensification of a quasi-stationary anticyclone south of Australia (H2), which is an element of the typical evolution of southern final warmings that generally occurs one month later in the season [11, 12, 13, 14]. The displaced SPV was pinched as another deep anticyclone developed over the southern Atlantic (H1) in association with a blocking system in the troposphere, and further elongated (L1) as the cyclonic component of the blocking extended and tilted vertically from about in the troposphere to the south of Africa at 850K. Another lobe of the SPV (L2) became more sharply defined in the southeastern Pacific at 850K as Rossby wave breaking developed in the upper troposphere west of South America. Starting around September 24, the elongated SPV split above approximately 600K. The lobe over the southeastern Pacific (L2) intensified with height, while that to the south of Africa (L1) weakened with height. After these events in late September 2002, the lobe over the western Pacific dissipated while the other lobe weakened and eventually became an equivalent barotropic cyclonic circulation above the South Pole in October.
These considerations suggest that the papers by [15] and [16] on the mechanisms for generation of the SPV splitting that occurred during the final southern warming of 2002 could complement each other in the following way. [15] argued that the double-lobe structure of the SPV extending upwards at high latitudes in mid September 2002 (see Figure 1) resulted from the effects of a blocking system that developed in the troposphere over the southern Atlantic possibly in association with energy propagating horizontally from a burst of convection in the tropics. [14] and [16] argued that pinching lead to vortex splitting due to vertical propagation of a disturbance that generated under one of the lobes of the pinched SPV. This disturbance can be the cyclonic circulation that formed over the southeastern Pacific in association with Rossby wave breaking in the troposphere over the southeastern Pacific.
Acknowledgements
J. Curbelo and A. M. Mancho are supported by MINECO grant MTM2014-56392-R. A. M. Mancho is supported by ONR. grant No. N00014-17-1-3003. C. R. Mechoso was supported by the U.S. NSF grant AGS-1245069. The research of S. Wiggins is supported by ONR grant No. N00014-01-1-0769.
References
- [1] N. J. Matthewman, J. G. Esler, A. J. Charlton-Perez, and L. M. Polvani. A new look at stratospheric sudden warmings. Part III: Polar vortex evolution and vertical structure. Journal of Climate, 22(6):1566–1585, 2009.
- [2] A. H. Butler, J. P. Sjoberg, D. J. Seidel, and K. H. Rosenlof. A sudden stratospheric warming compendium. Earth System Science Data, 9(1):63–76, 2017.
- [3] G. L. Manney, J. D. Farrara, and C. R. Mechoso. Simulations of the february 1979 stratospheric sudden warming: Model comparisons and three-dimensional evolution. Monthly Weather Review, 122(6):1115–1140, 1994.
- [4] J. Curbelo, V. J. García-Garrido, C. R. Mechoso, A. M. Mancho, S. Wiggins, and C. Niang. Insights into the three-dimensional lagrangian geometry of the antarctic polar vortex. Nonlinear Processes in Geophysics, 24(3):379–392, 2017.
- [5] A. Simmons, S. Uppala, D. Dee, and Kobayashi S. ERA-Interim: New ECMWF reanalysis products from 1989 onwards. ECMWF Newsletter, 110:25–35, 2007.
- [6] S. Wiggins. Normally hyperbolic invariant manifolds in dynamical systems. Springer-Verlag, New York, 1994.
- [7] I. Mezić and S. Wiggins. On the integrability and perturbation of three-dimensional fluid flows with symmetry. Journal of Nonlinear Science, 4(1):157–194, Dec 1994.
- [8] M. R. Schoeberl and P. A. Newman. A multiple-level trajectory analysis of vortex filaments. Journal of Geophysical Research: Atmospheres, 100(D12):25801–25815, 1995.
- [9] V. J. García Garrido, J. Curbelo, A. M. Mancho, S. Wiggins, and C. R. Mechoso. The application of lagrangian descriptors to 3d vector fields, regular and chaotic dynamics. Regular and Chaotic Dynamics, 23:551–568, 2018.
- [10] D. Peters and D. W. Waugh. Rossby wave breaking in the southern hemisphere wintertime upper troposphere. Monthly Weather Review, 131(11):2623–2634, 2003.
- [11] C. R. Mechoso, A. O’Neill, V. D. Pope, and J. D. Farrara. A study of the stratospheric final warming of 1982 in the Southern Hemisphere. Quart. J. R. Meteor. Soc., 114:1365–1384, 1988.
- [12] A. I. Quintanar and C. R. Mechoso. Quasi-stationary waves in the southern hemisphere. part i: Observational data. J. Climate, 4:2659–2672, 1995.
- [13] G. L. Manney, J. D. Farrara, and C. R. Mechoso. The behavior of wave 2 in the southern hemisphere stratosphere during late winter and early spring. J. Atmos. Sci., 48:976–998, 1991.
- [14] A. J. Charlton, A. O’Neill, W. A. Lahoz, and P. Berrisford. The splitting of the stratospheric polar vortex in the southern hemisphere, september 2002: Dynamical evolution. J. Atmos. Sci., 66:590–602, 2005.
- [15] Kazuakiand Nishii and Hisashi Nakamura. Tropospheric influence on the diminished antarctic ozone hole in september 2002. Geophysical Research Letters, 31:L16103, 2004.
- [16] A. O’Neill, C. L. Oatley, A. J. Charlton-Perez, D. M. Mitchell, and T. Jung. Vortex splitting on a planetary scale in the stratosphere by cyclogenesis on a subplanetary scale in the troposphere. Quarterly Journal of the Royal Meteorological Society, 143(703):691–705, 2017.
| Jezabel Curbelo |
| Departamento de Matemáticas |
| Universidad Autónoma de Madrid |
| Instituto de Ciencias Matemáticas |
| Campus de Cantoblanco UAM, 28049 Madrid, Spain. |
| Email: jezabel.curbelo@uam.es |
| Carlos R. Mechoso |
| Department of Atmospheric and Oceanic Sciences, |
| University of California, Los Angeles, USA. |
| Ana M. Mancho |
| Instituto de Ciencias Matemáticas, CSIC-UAM-UC3M-UCM. |
| Campus de Cantoblanco UAM, 28049 Madrid, Spain. |
| Stephen Wiggins |
| School of Mathematics, University of Bristol. |
| Bristol BS8 1TW, UK. |