Supporting Information for: On-the-fly ab initio semiclassical evaluation of time-resolved electronic spectra
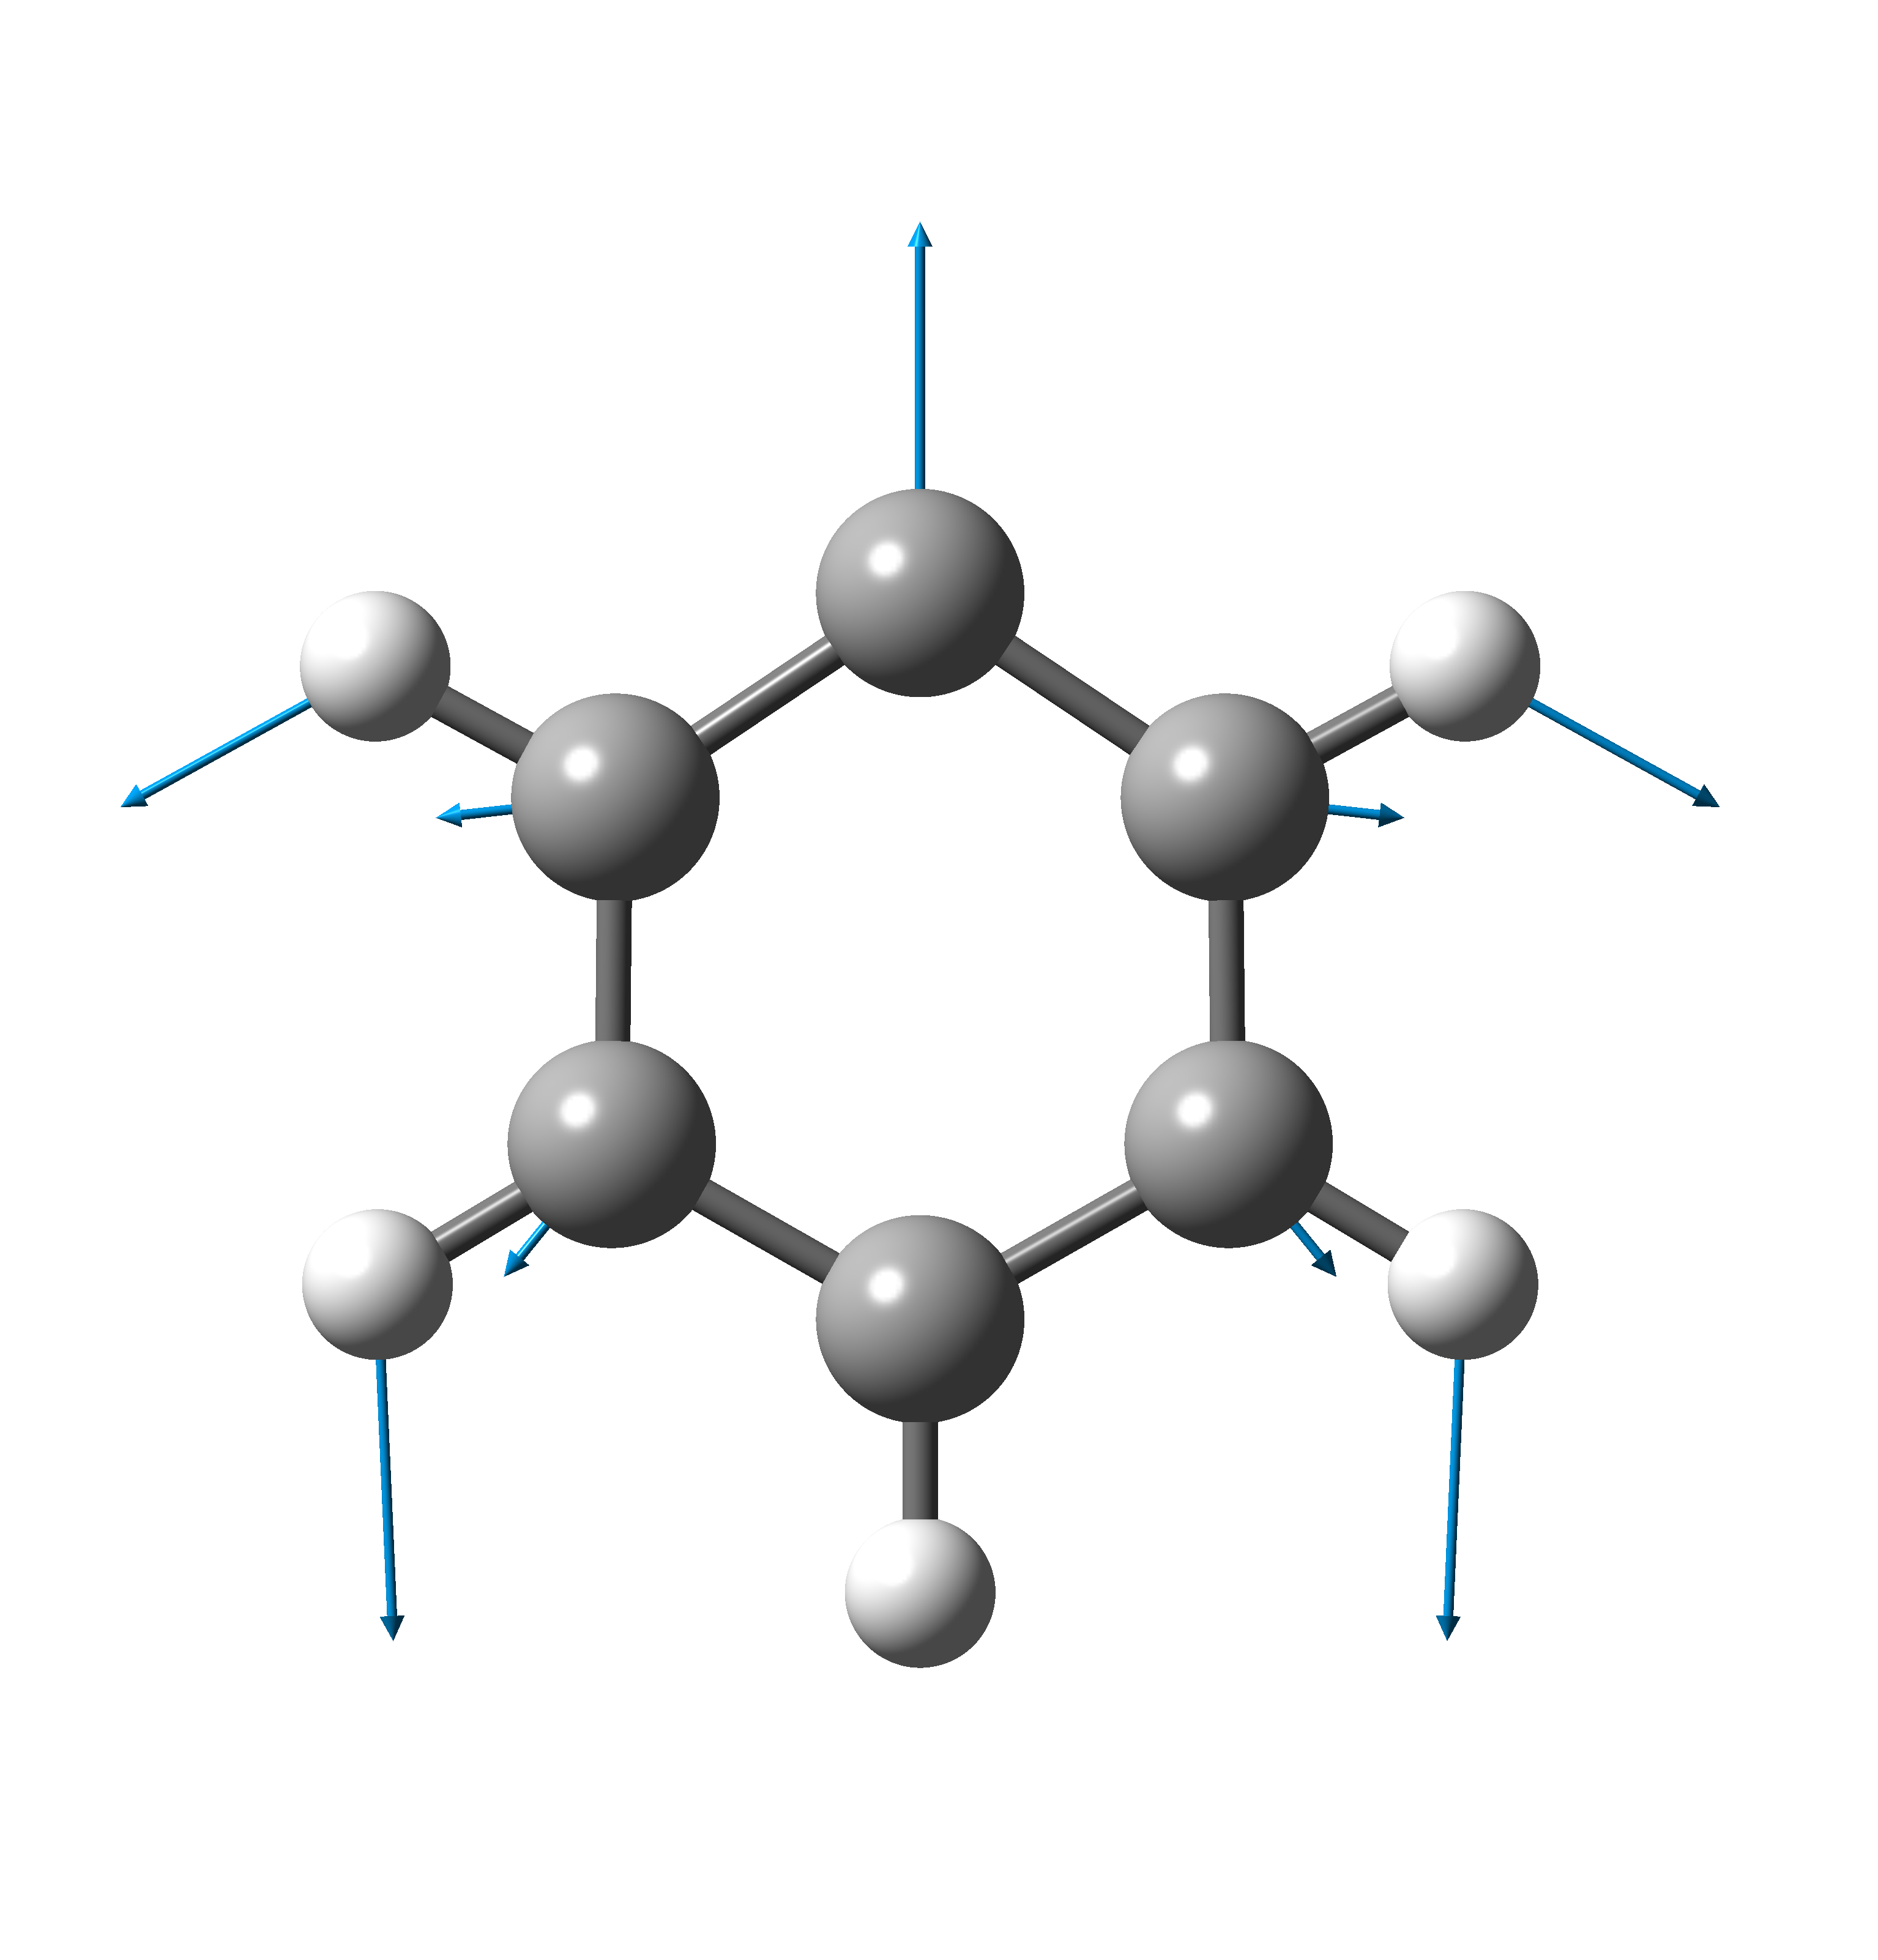
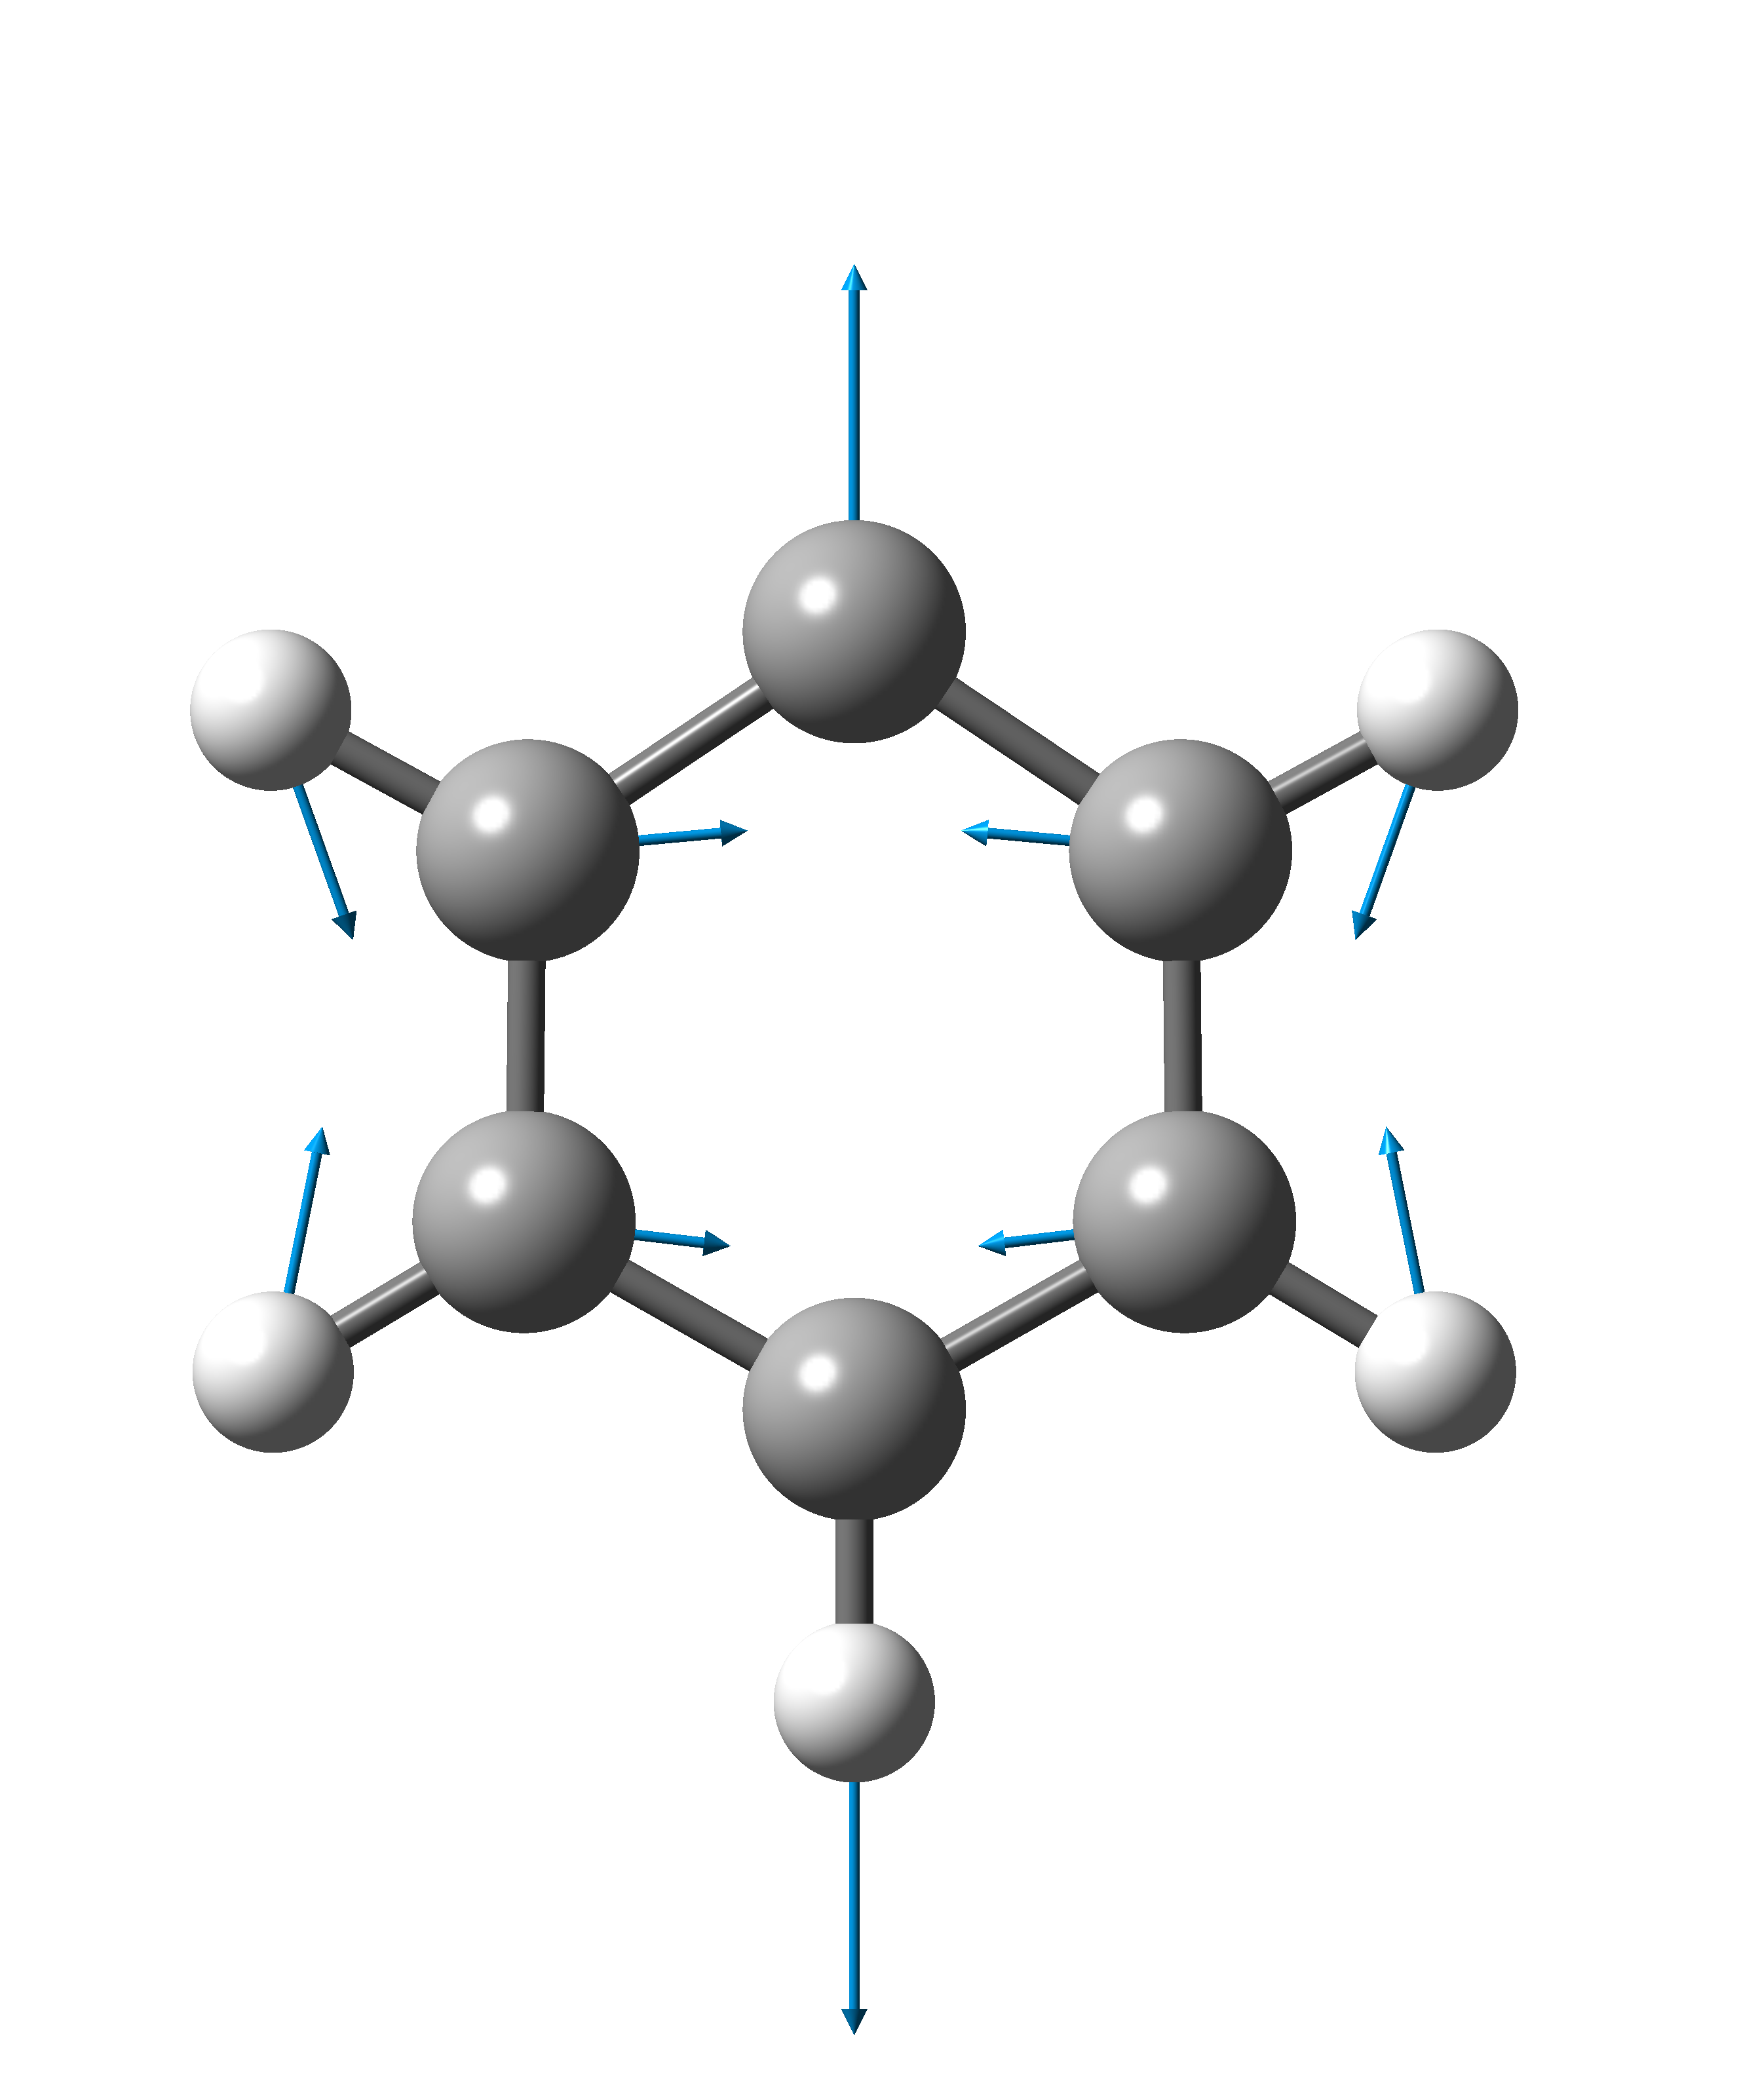
I Most displaced modes of the phenyl radical


II A one-dimensional ab initio model: details of the potential fit and exact quantum dynamics calculations
For the model, we chose the excited-state vibrational mode of frequency 924 cm-1. The ab initio data was obtained by computing the ground- and excited-state potentials at the geometries displaced from the excited-state minimum along the vibrational mode of interest. Then, the data was fitted to a Morse potential
| (1) |
The fitting parameters for the two states are given in Table 1 and the potentials are shown in Fig. 2.
The initial state was obtained as the ground vibrational state of the harmonic fit to the ground-state Morse potential, i.e., it was a Gaussian with the initial position corresponding to the ground-state minimum (ground-state in Table 1), zero initial momentum, and standard deviation (in atomic units).
| Ground state | -231.57171 | -31.47 | 0.003215 | 1.11757 | ||||
| Excited state | -231.49832 | 0.03757 | 0.003173 | 0.88029 |

We note that the vibrational modes experience significant coupling and that the chosen coordinate is not a vibrational mode of the ground-state potential; a multi-dimensional model would be required to accurately describe the dynamics of the phenyl radical. Therefore, the initial wavepacket discussed here, which is obtained from a harmonic fit to the ground-state model potential, is not physical, i.e., it does not correspond to any of the degrees of freedom of the full-dimensional initial wavepacket. Nevertheless, the goal of this calculation was to present the accuracy of the thawed Gaussian approximation in moderately anharmonic systems by comparing it to the exact dynamics—we did not aim to recover the spectrum of the phenyl radical. Yet, our model was based on the ab initio data, and so has a realistic extent of anharmonicity.
Exact quantum dynamics was performed using the second-order split-operator method; the same time step and total propagation times were used as for the thawed Gaussian propagation (see Section III. of the main text). The spatial grid consisted of equidistant points between -200 and 160 atomic units.
III Excited-state wavepacket and absorption spectrum of the Morse model


IV Time-resolved spectra, excited-state wavepacket, and absorption spectrum of the model with increased anharmonicity
Here, we compare the thawed Gaussian approximation with the exact result for a more challenging Morse potential, which is constructed from the ab initio model described in the Supporting Information Section II by increasing the anharmonicity. This is accomplished by modifying the and parameters so that the product , equal to the force constant of the global harmonic approximation at the minimum of the true potential, remains unchanged. In this example, we multiply the ground- and excited-state parameters by 2 and divide the parameters by 4 (the original parameters are given in Table 1).


References
- Patoz, Begušić, and Vaníček (2018) A. Patoz, T. Begušić, and J. Vaníček, J. Phys. Chem. Lett. 9, 2367 (2018).