The shape of Fe K line emitted from
relativistic accretion disc around AGN black holes
Abstract
The relativistically broadened Fe K line, originating from the accretion disc in a vicinity of a super massive black hole, is observed in only less than 50% of type 1 Active Galactic Nuclei (AGN). In this study we investigate could this lack of detections be explained by the effects of certain parameters of the accretion disc and black hole, such as the inclination, the inner and outer radius of disc and emissivity index. In order to determine how these parameters affect the Fe K line shape, we simulated about 60,000 Fe K line profiles emitted from the relativistic disc.
Based on simulated line profiles, we conclude that the lack of the Fe K line detection in type 1 AGN could, be caused by the specific emitting disc parameters, but also by the limits in the spectral resolution and sensitivity of the X-ray detectors.
keywords:
Active Galactic Nuclei; Fe K line; simulation.PACS numbers:
1 Introduction
Active galaxies are galaxies that have a small core of emission embedded at the center of an otherwise typical galaxy. This core is typically highly variable and very bright compared to the rest of the galaxy. Active galaxies most likely represent one phase in galaxy evolution. Their cores, Active Galactic Nuclei (AGN), are one of the powerful radiation sources in the universe. The luminosity of typical AGN is in the range of . The enormous amount of radiation is coming from an accretion disc that surrounding a Supermassive Black Hole (SMBH) that is supposed to be in the centre of an AGN.
The structure off all AGN seems to be similar: the central SMBH is surrounded by a optically thick and geometrically thin accretion disc that emits in a wide wavelength range from the X-ray to the optical spectral band, mostly in the continuum. The X-ray and UV radiation of the disc is ionizing the gas in so called the Broad Line Region (BLR) that emits broad emission lines. BLR is surrounded by a cold gas in the form of a torus, that emits in the infrared spectral band, and can obscure the BLR (and the accretion disc) emission. Therefore, we observe AGN with the broad lines (unobscured by the torus, so called type 1 AGN), and without broad emission lines (obscured AGN, so called type 2 AGN) [1].
As we noted above, the accretion disc emits mostly in the continuum, but the inner part of the accretion disc (beside the X-ray continuum) emits X-ray lines, among them Fe K spectral line at 6.4 keV. The line usually has an asymmetric shape with narrow bright blue and wide faint red peak. Since this line is produced close to the first marginally stable orbit, it is an important indicator of accreting flows around SMBH, as well as of the spacetime geometry in these regions [2, 3].
The first results from satellite ASCA showed that Fe K line is very common in spectra of the type 1 AGN and statistical evidence of broadening was found in of sample [4, 5]. However, more recent studies of the same type of AGN showed that there is relativistic line broadening in only of the sample, and only around require the line to originate from the vicinity of the SMBH [6].
In this paper we study influence of disc outer radius on the shape of Fe K spectral line for different disc parameters.
2 The Fe K line and SMBHs of AGN
The relativistic component of the Fe K line was discovered by Tanaka et al. in 1999. They obtained the first convincing proof for the existence of the Fe K line in AGN spectra after four-day observations of Seyfert 1 galaxy MCG-6-30-15 [7]. The Fe K in this object has a pretty broad profile. If the line originated from an arbitrary radius of a nonrelativistic (Keplerian) accretion disc it would have a symmetrical profile (due to Doppler effect) with two peaks: a ”blue” one which is produced by emitting material from the approaching side of the disc in respect to an observer, and a ”red” one which corresponds to emitting material from the receding side of the disc (Fig. 1). The widest parts of the Fe K line arise from the innermost regions of the disc, where the rotation of emitting material is the fastest. It was found that, in case of 14 Seyfert 1 galaxies, Full-Widths at Half-Maximum (FWHM) of their Fe K lines correspond to velocities of km/s, however in some special cases (like Seyfert 1 galaxy MCG-6-30-15) FWHM corresponds to the velocity of 30% of the speed of linght [6]. It means that in the vicinity of the central black hole, orbital velocities of the emitting material are relativistic, causing the enhancement of the Fe K line ”blue” peak in regard to its ”red” peak.

In the case of the line that originates from a relativistically rotating acration disc of an AGN the resulting profile of the Fe K is a composition of three different effects [2]:
-
•
Doppler shift due to rotation of emitting material, which is responsible for occurrence of two peaks;
-
•
Special relativistic effect - the relativistic beaming, which is responsible for enhancement of the blue peak with respect to the red one;
-
•
General relativistic effect - the gravitational redshift, which is responsible for smearing of the line profile.
These characteristics of the observed Fe K line profiles represent a fundamental tool for investigating the plasma conditions and the spacetime geometry in the vicinity of the SMBH of AGN.
3 Numerical simulations
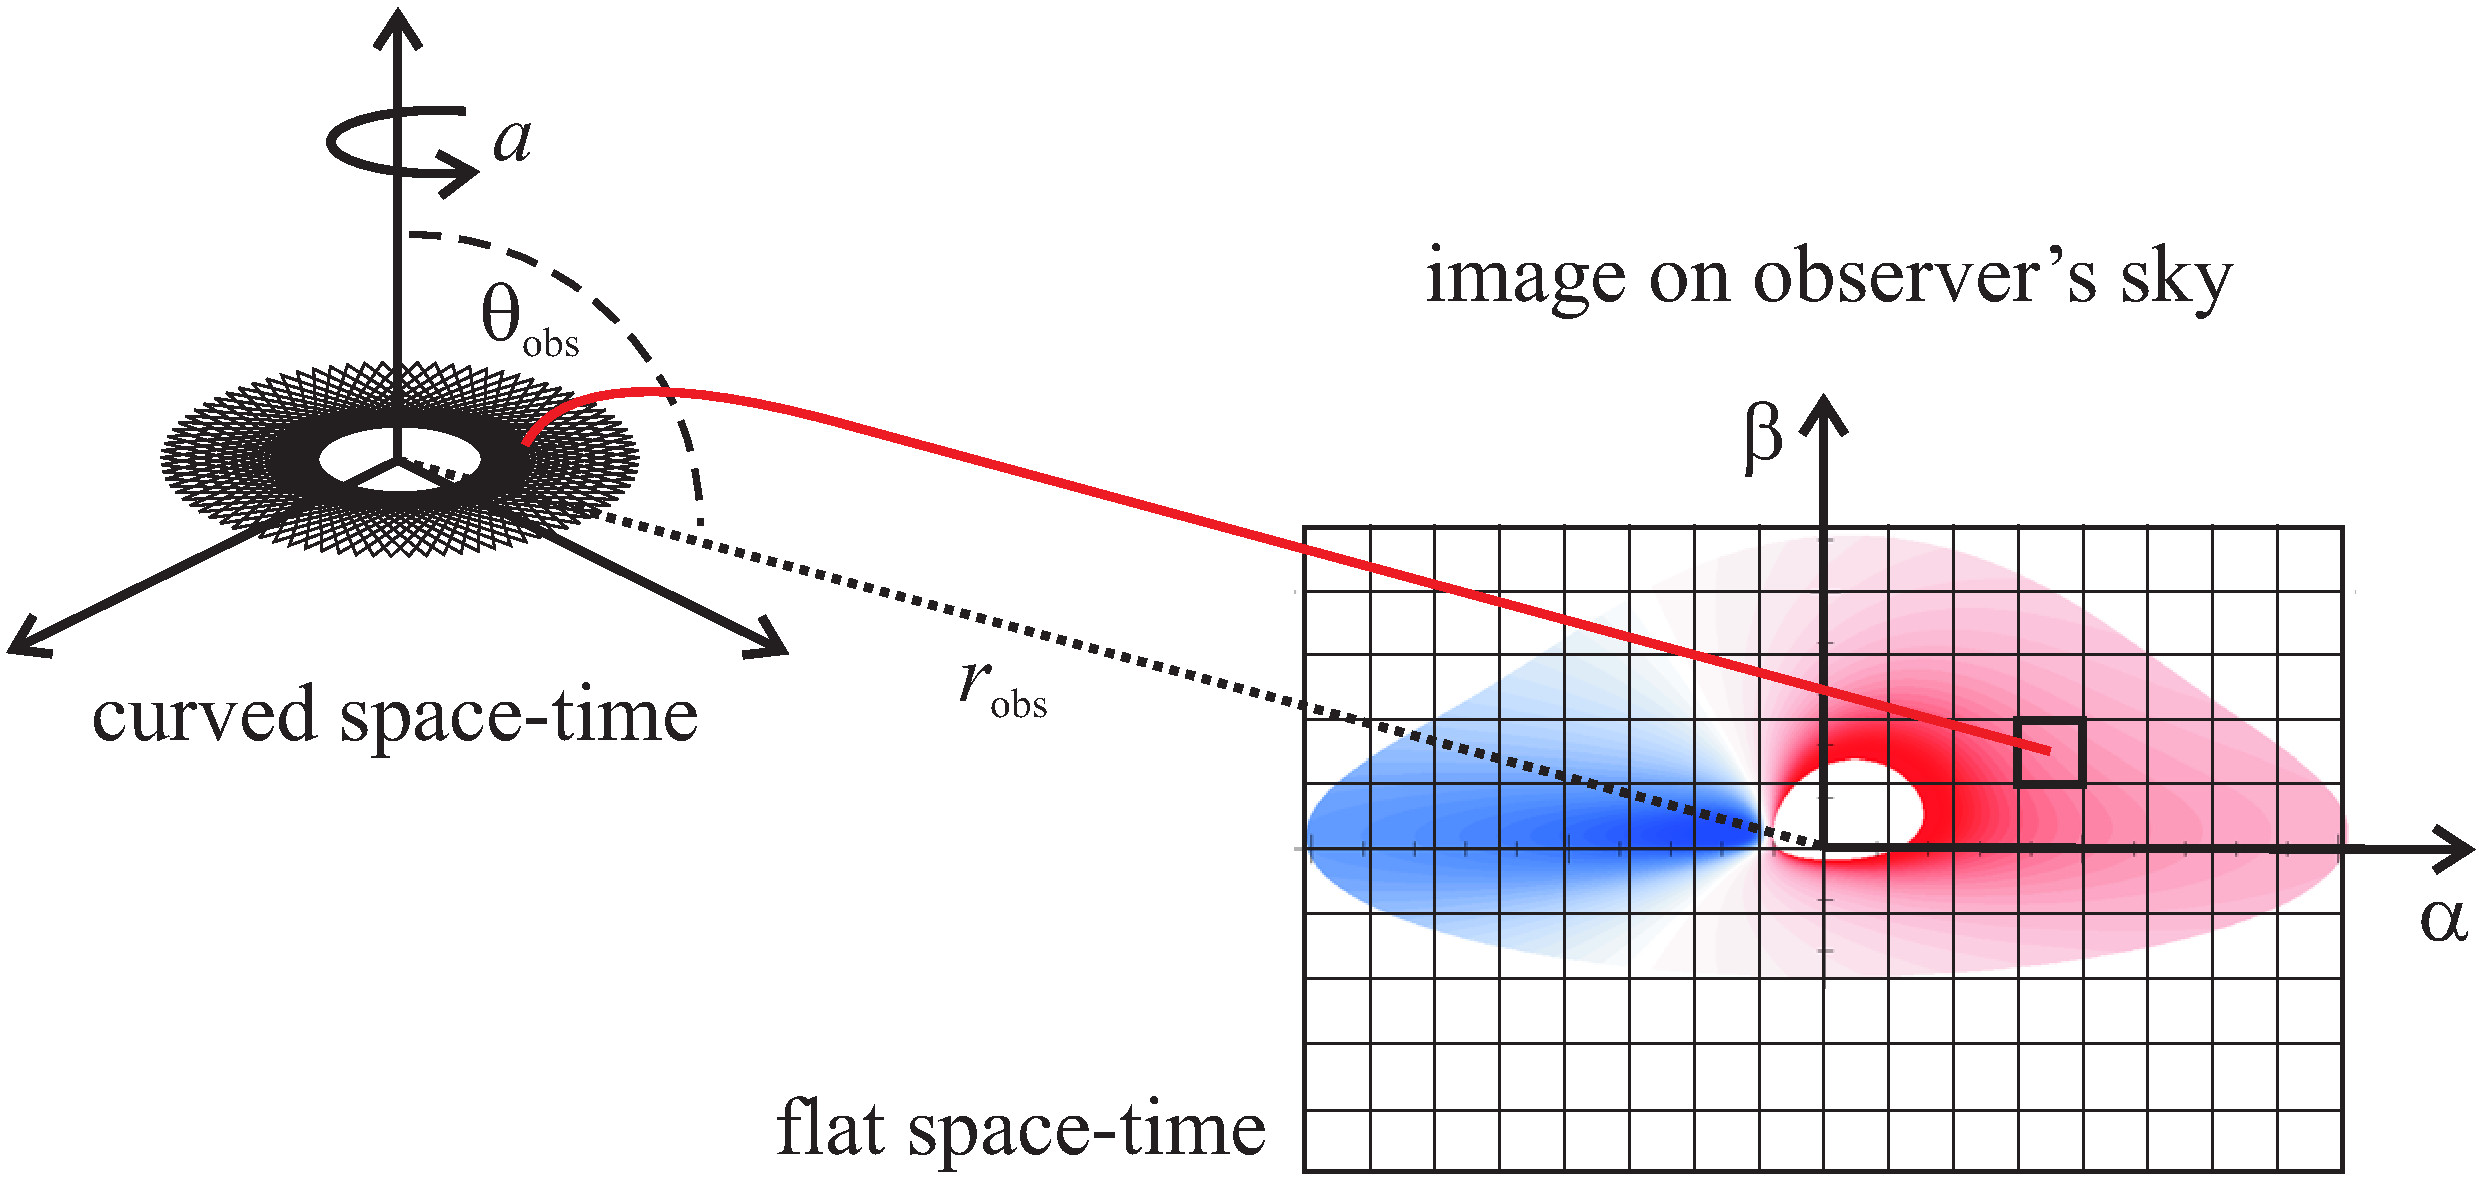
The disc emission can be analyzed by numerical simulations taking into account only photon trajectories reaching the observer’s sky plane. This method is based on so called ray-tracing method in Kerr metric [8, 9, 10, 11]. The image of the disc on the observer’s sky is divided into a number of small elements (pixels). The color images of the accretion disc which a distant observer would see by a high resolution telescope can be obtained in the following way: for each pixel of the image the photon is traced backward from the observer by following the geodesics in a Kerr space-time, until it crosses the plane of the disc. Then, the flux density of the radiation emitted by the disc at that point, as well as the redshift factor of the photon are calculated. The simulated line profiles can be calculated taking into account the intensities and received photon energies of all pixels of the corresponding disc image.
The method used in simulations is based on the pseudo-analytical integration of the geodesic equations which describe the photon trajectories in the general case of a rotating BH having some angular momentum , which gravitational field is therefore described by the Kerr metric [11, 12]:
| (1) |
where are the usual Boyer-Lindquist coordinates, with and , , and .
The Kerr metric depends on the angular momentum normalized to the mass of black hole: , .
A photon trajectory in the Kerr metric can be described by three constants of motion (the energy at infinity and two constants related to the angular momentum, respectively) which, in natural units , have the following forms [11, 12]:
| (2) |
where is the 4-momentum.
Now, two dimensionless parameters and can be introdced to express the trajectory of the photon, because it is independent on energy of the photon. Parameters and are related to the two impact parameters and which describe the apparent position on the observer’s celestial sphere:
| (3) |
where the sign of is determined by .
The solution of integral equation [11]:
| (4) |
| (5) |
provide the photon trajectories (null geodesics) which originate in the accretion disc at some emission radius and reach the observer at infinity. The integral Equation (4) can be solved in terms of Jacobian elliptic functions, and therefore it is a pseudo-analytical integration.
Photons emitted at frequency will reach infinity at frequency because of relativistc effects. Their ratio determines the shift due to these effects. The total observed flux at the observed energy is given by [10]:
| (6) |
where is the disc emissivity, is the solid angle subtended by the disc in the observer’s sky and is the rest energy.
Image of a simulated accretion disc is obtained in the following way [12]
-
1.
values of the input parameters are specified: inner () and outer () radii of the disc, angular momentum of the central BH, disc inclination (observer’s viewing angle) (also, denoted by ) and parameters defining the disc emissivity
-
2.
constants of motion and are calculated for each pair of impact parameters and (i.e. for each pixel on imaginary observer’s photographic plate)
-
3.
geodesic Equation (4) is integrated for each pair of and
-
4.
values of shift due to relativistic effects and observed flux are calculated
-
5.
pixels on imaginary observer’s photographic plate are colored according to the value of shift and a simulated disc image is obtained.
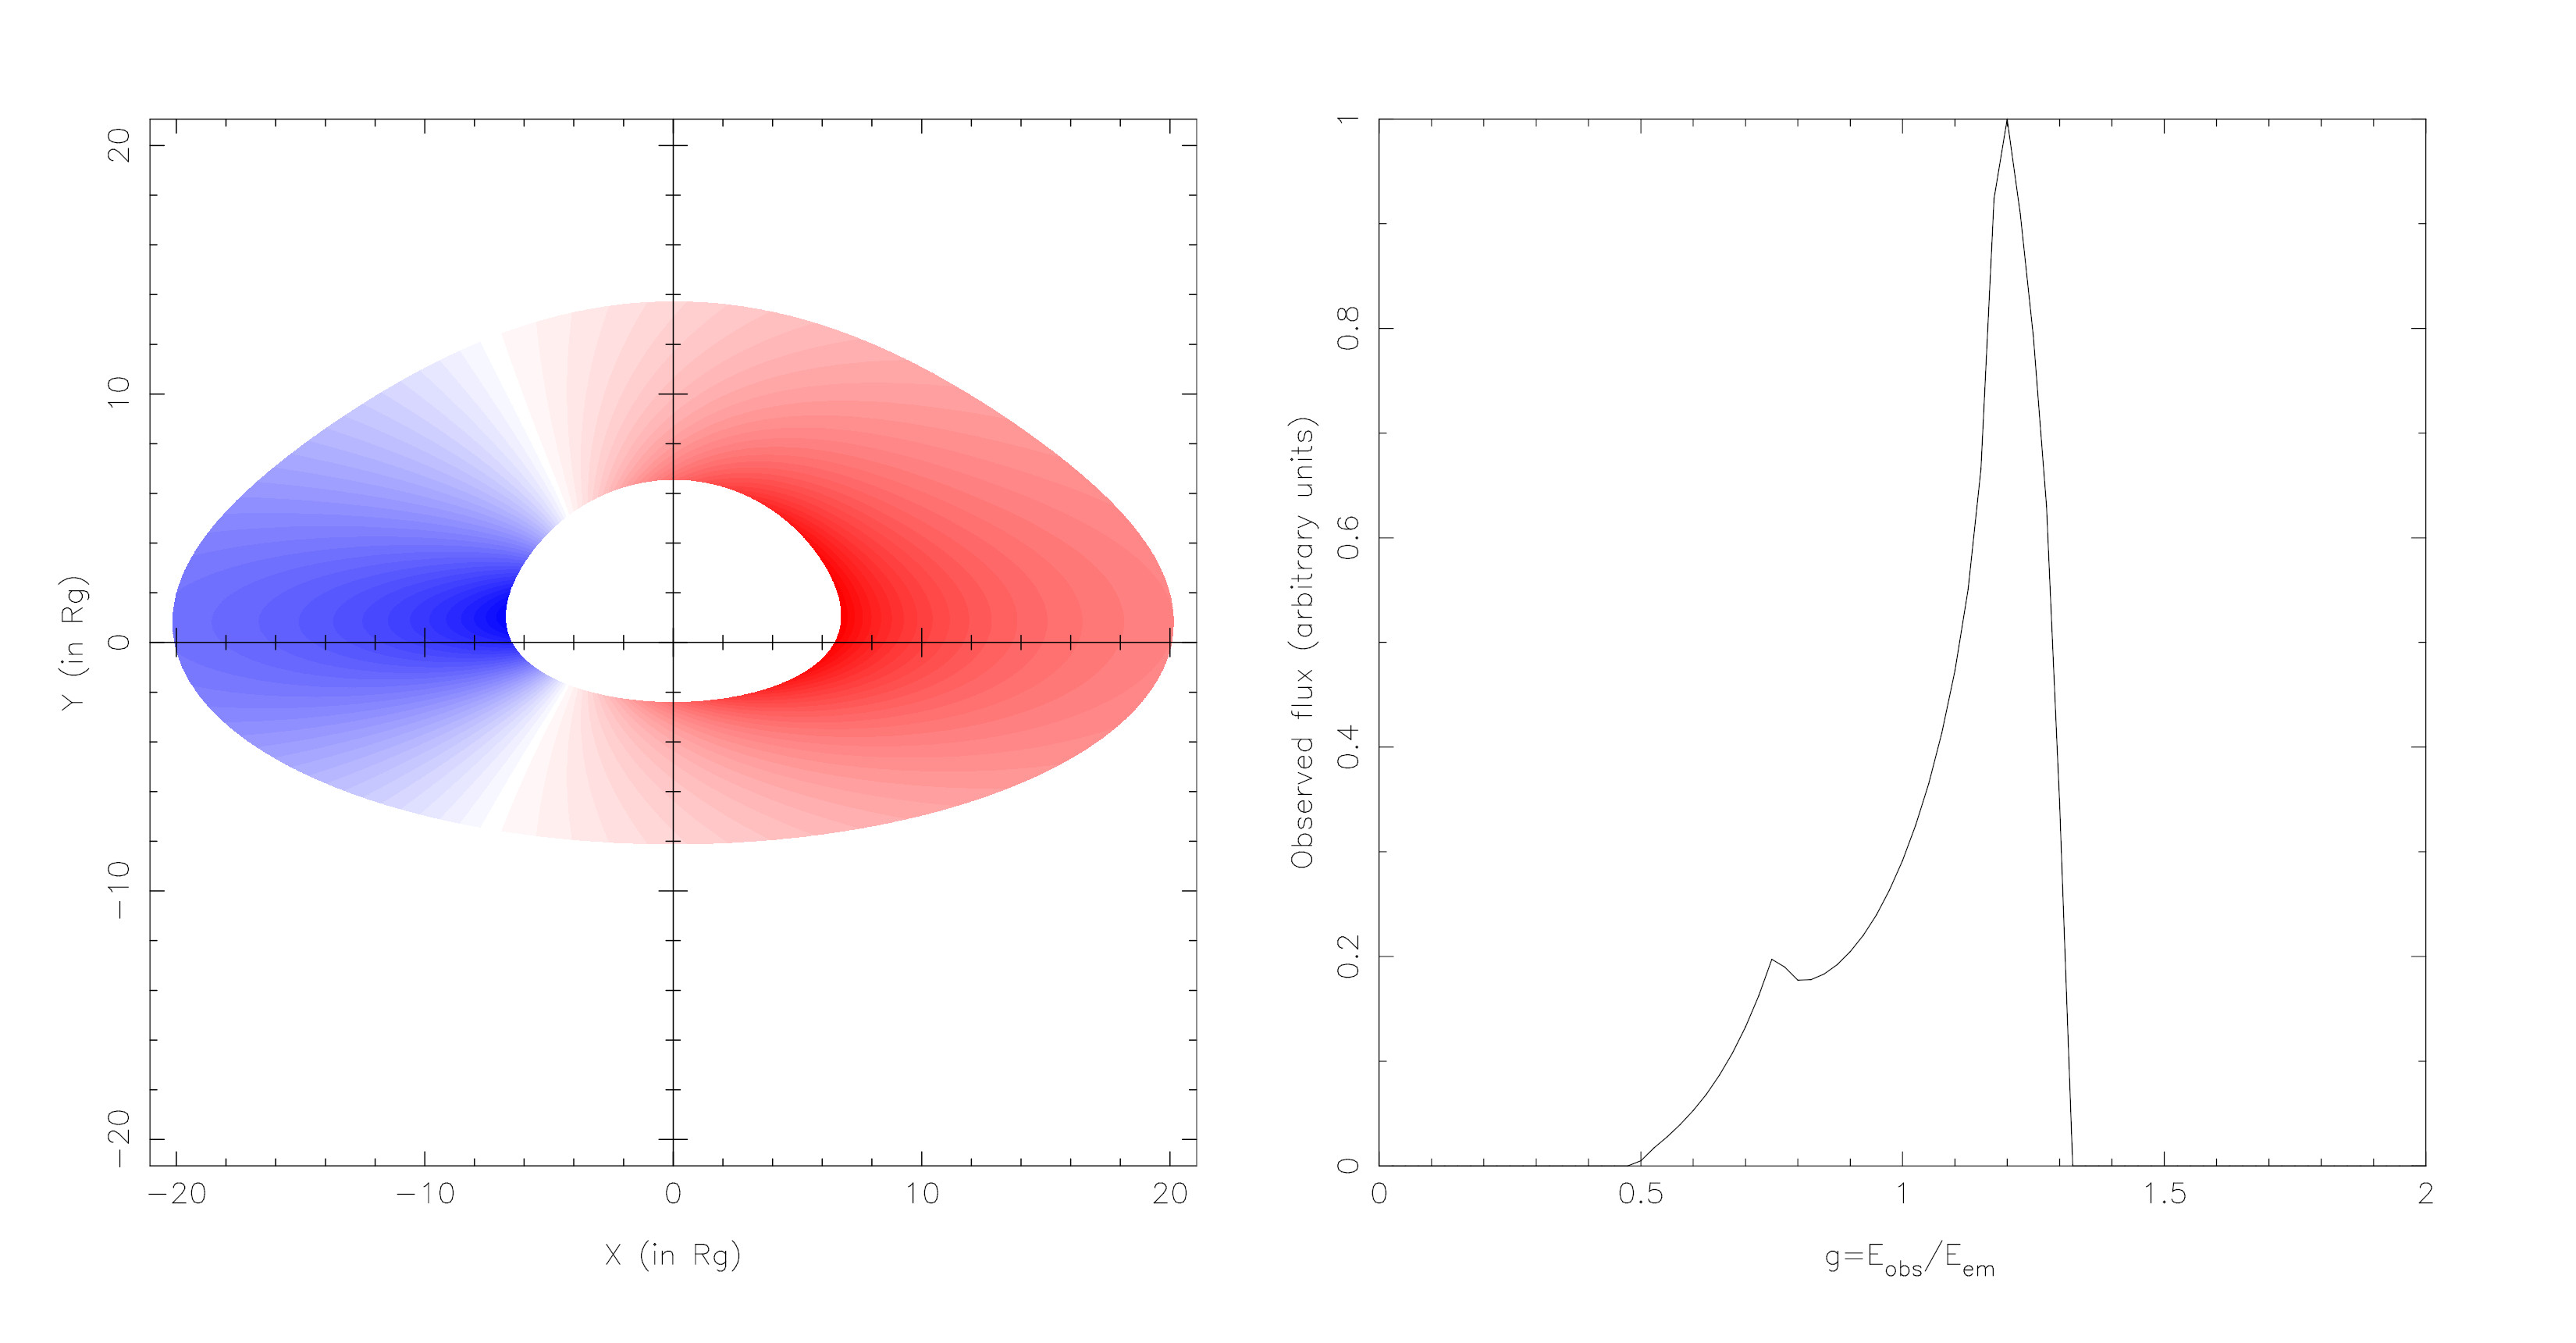
From the corresponding disc images the simulated line profiles can be calculated by binning the observed flux at all pixels over the bins of shift . In left panels of Fig. 3 the examples of simulated disc images obtained in such way are presented. The corresponding simulated line profiles are presented in the right panels of the same figure.
3.1 Disc parameters
All simulated line profiles are done using the ray-tracing method discribed in previous section and proposed by A. Čadež et al. [11]. About 60,000 accretion discs and corresponding Fe K lines were simulated for various set of parameters (Table 3.1). We varied values of the emissivity index , the inclination , the outer radius of the disc and the spin of BH.
The emissivity index defines the emissivity profile of the disc with radius according to the law . Inclination ranges from to and the spin of the BH from almost non-rotating () up to maximally rotating Kerr BH (). The inner radius was determined as the innermost stable orbit around the SMBH, also known as the marginally stable orbit, . The values are for and for .
The parameter ranges of the simulated accretion discs. Parameter Values Description 2, 2.5, 3, 4 Emissivity indices (∘) 5-80 (5) Inclinations () Inner disc radii () 10, 20, 30, 50, 70, 100 Outer disc radii 0.05-0.998 (0.1) The BH spins with step 0.1 1000, 3000, 5000 Number of bins 50, 70, 80, 100 number of photons No. 55296 The total number of simulations
4 Results
4.1 The effects of the spectral and spatial resolutions of the disc
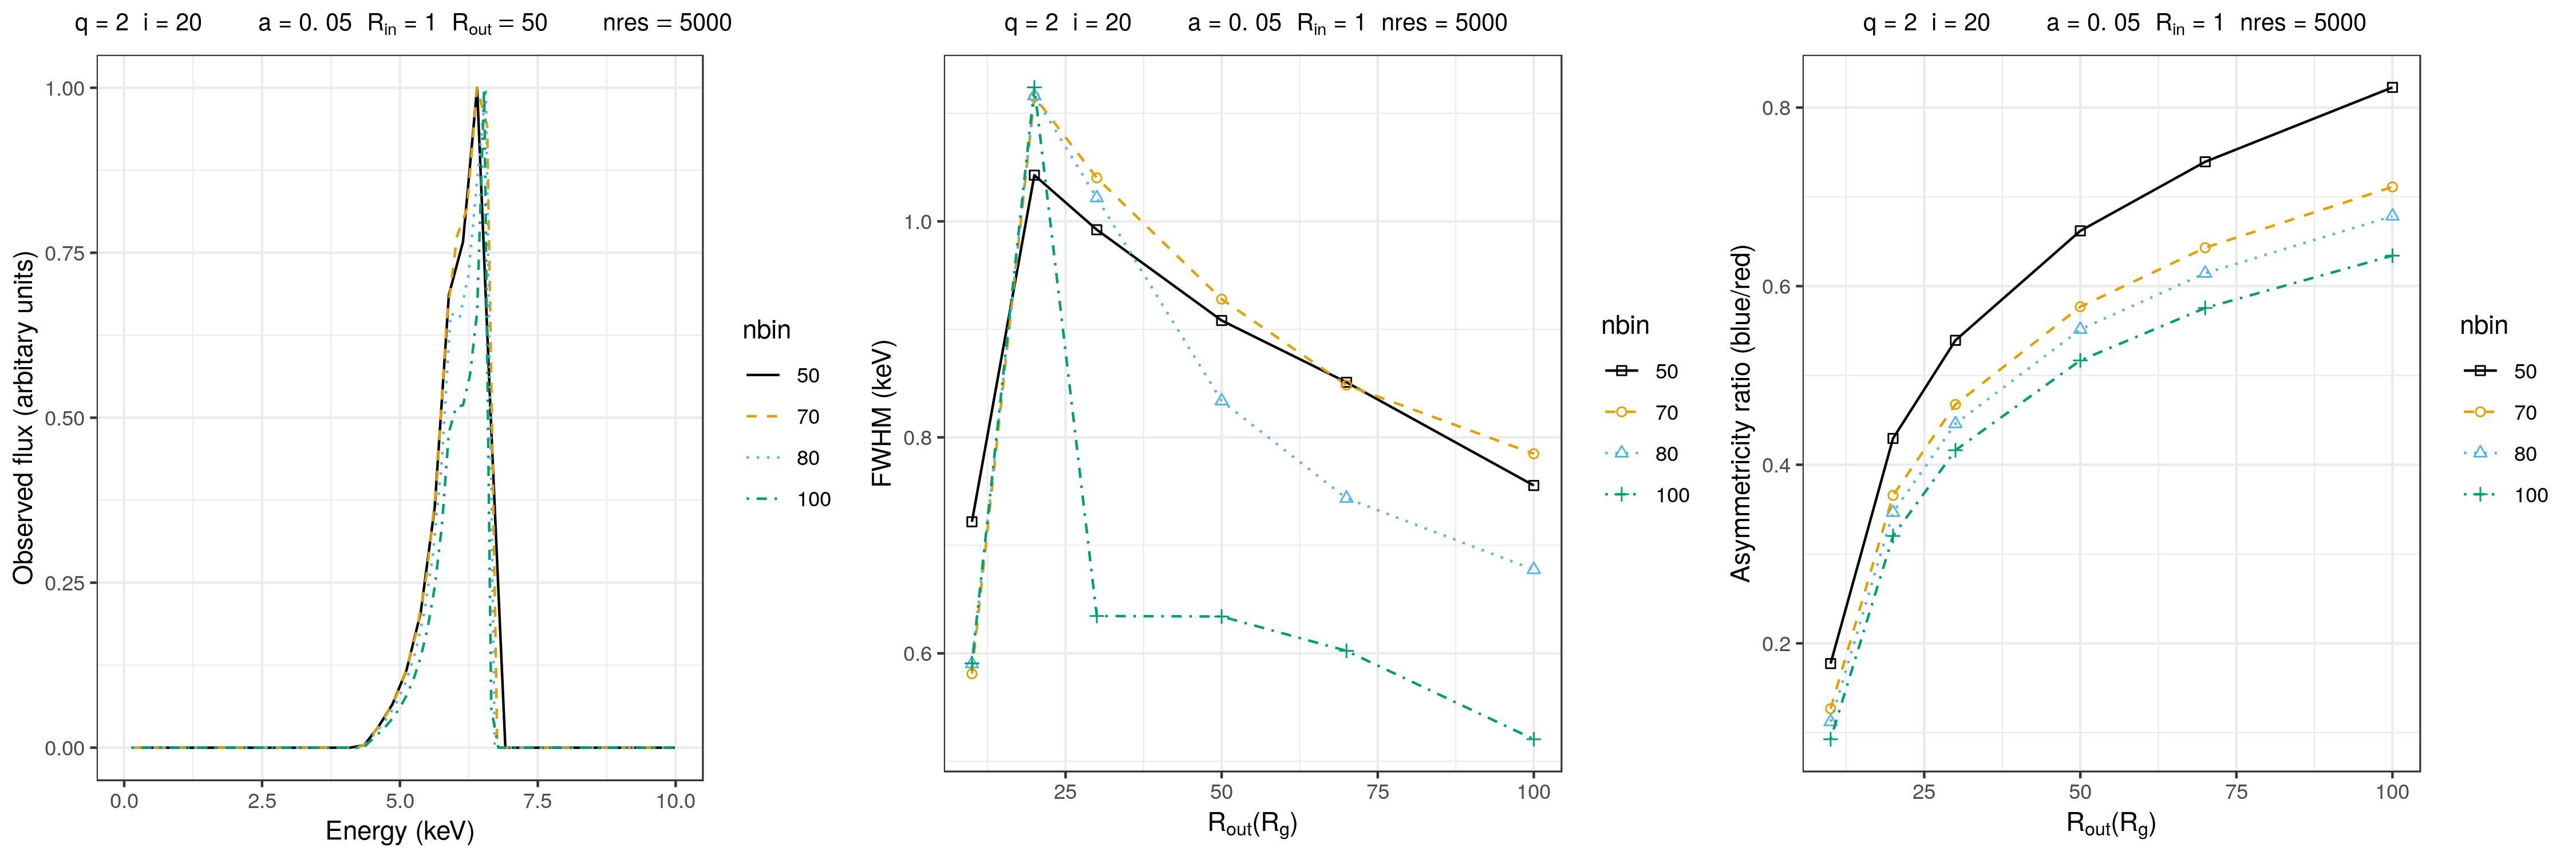
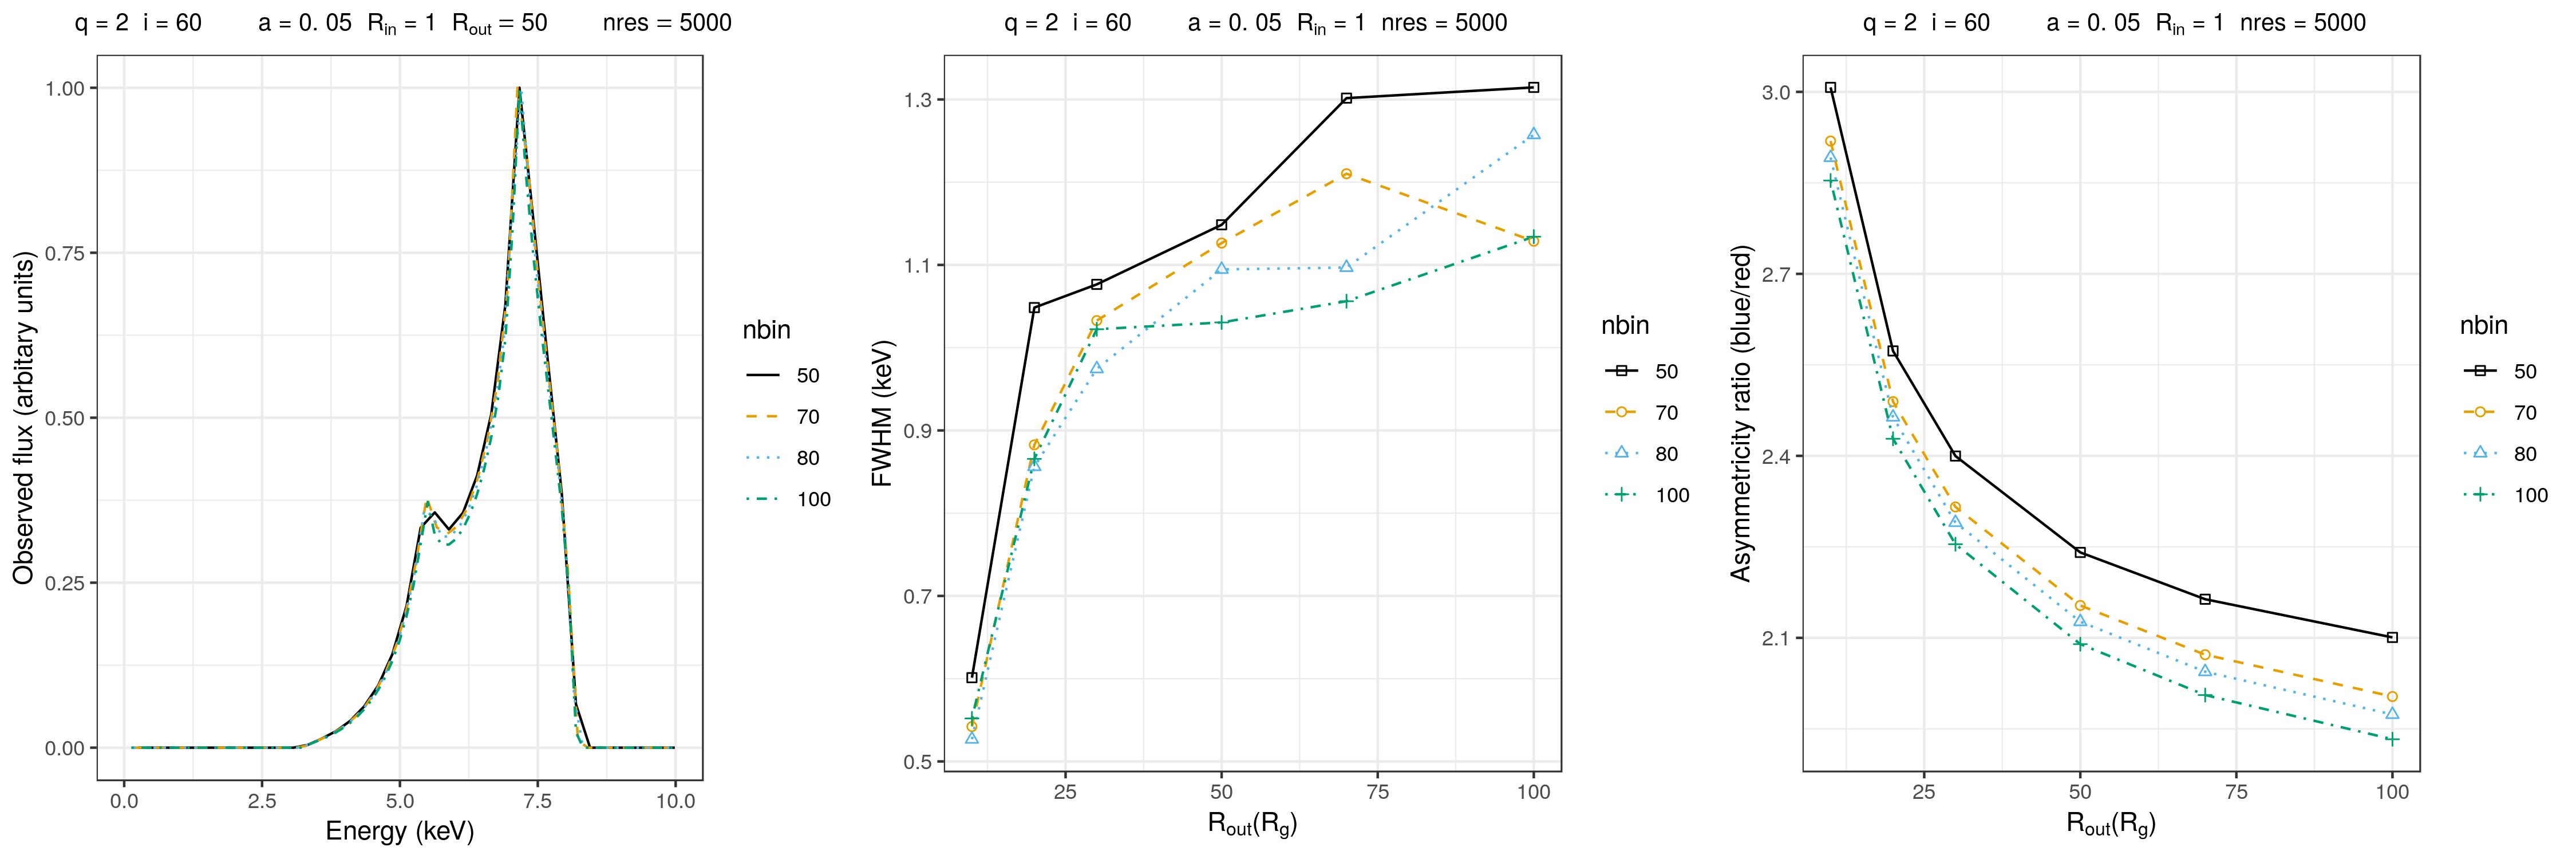
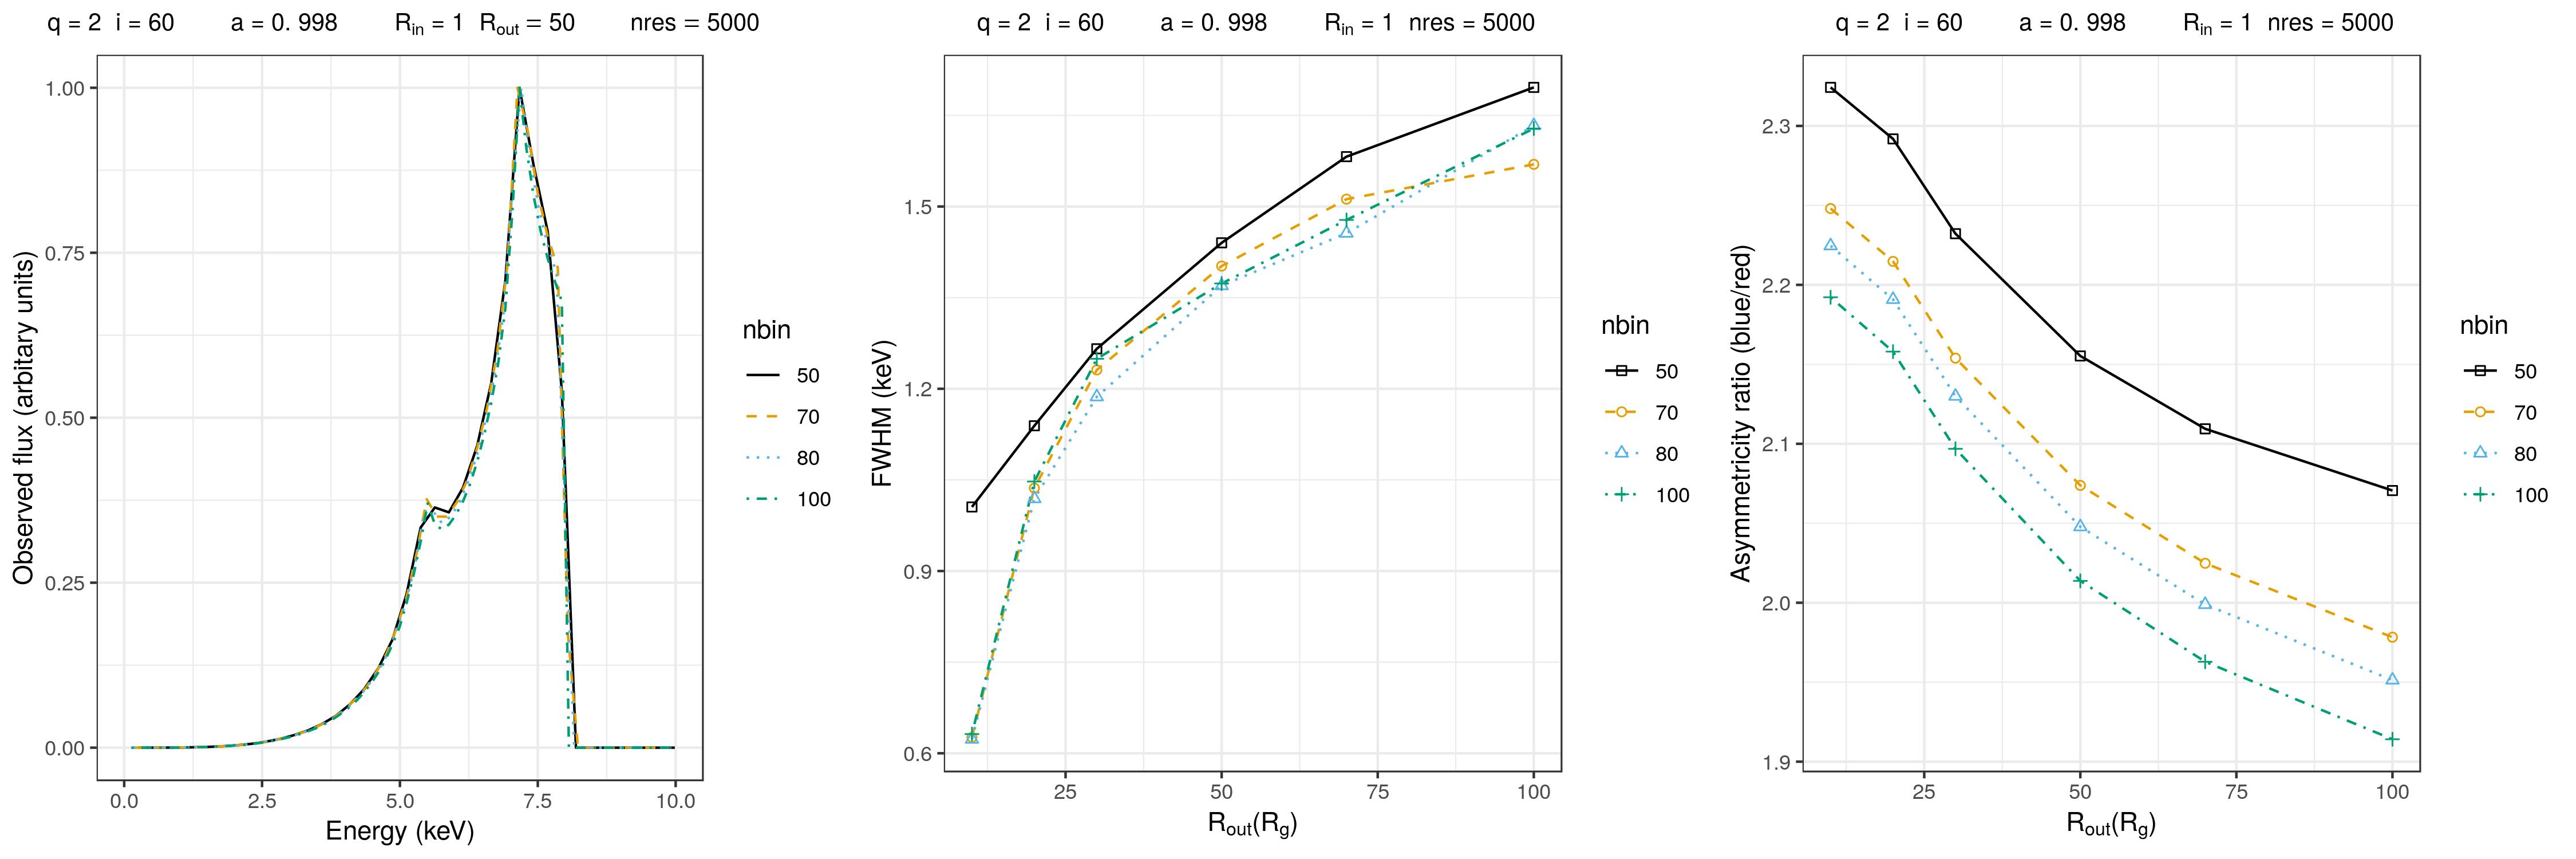
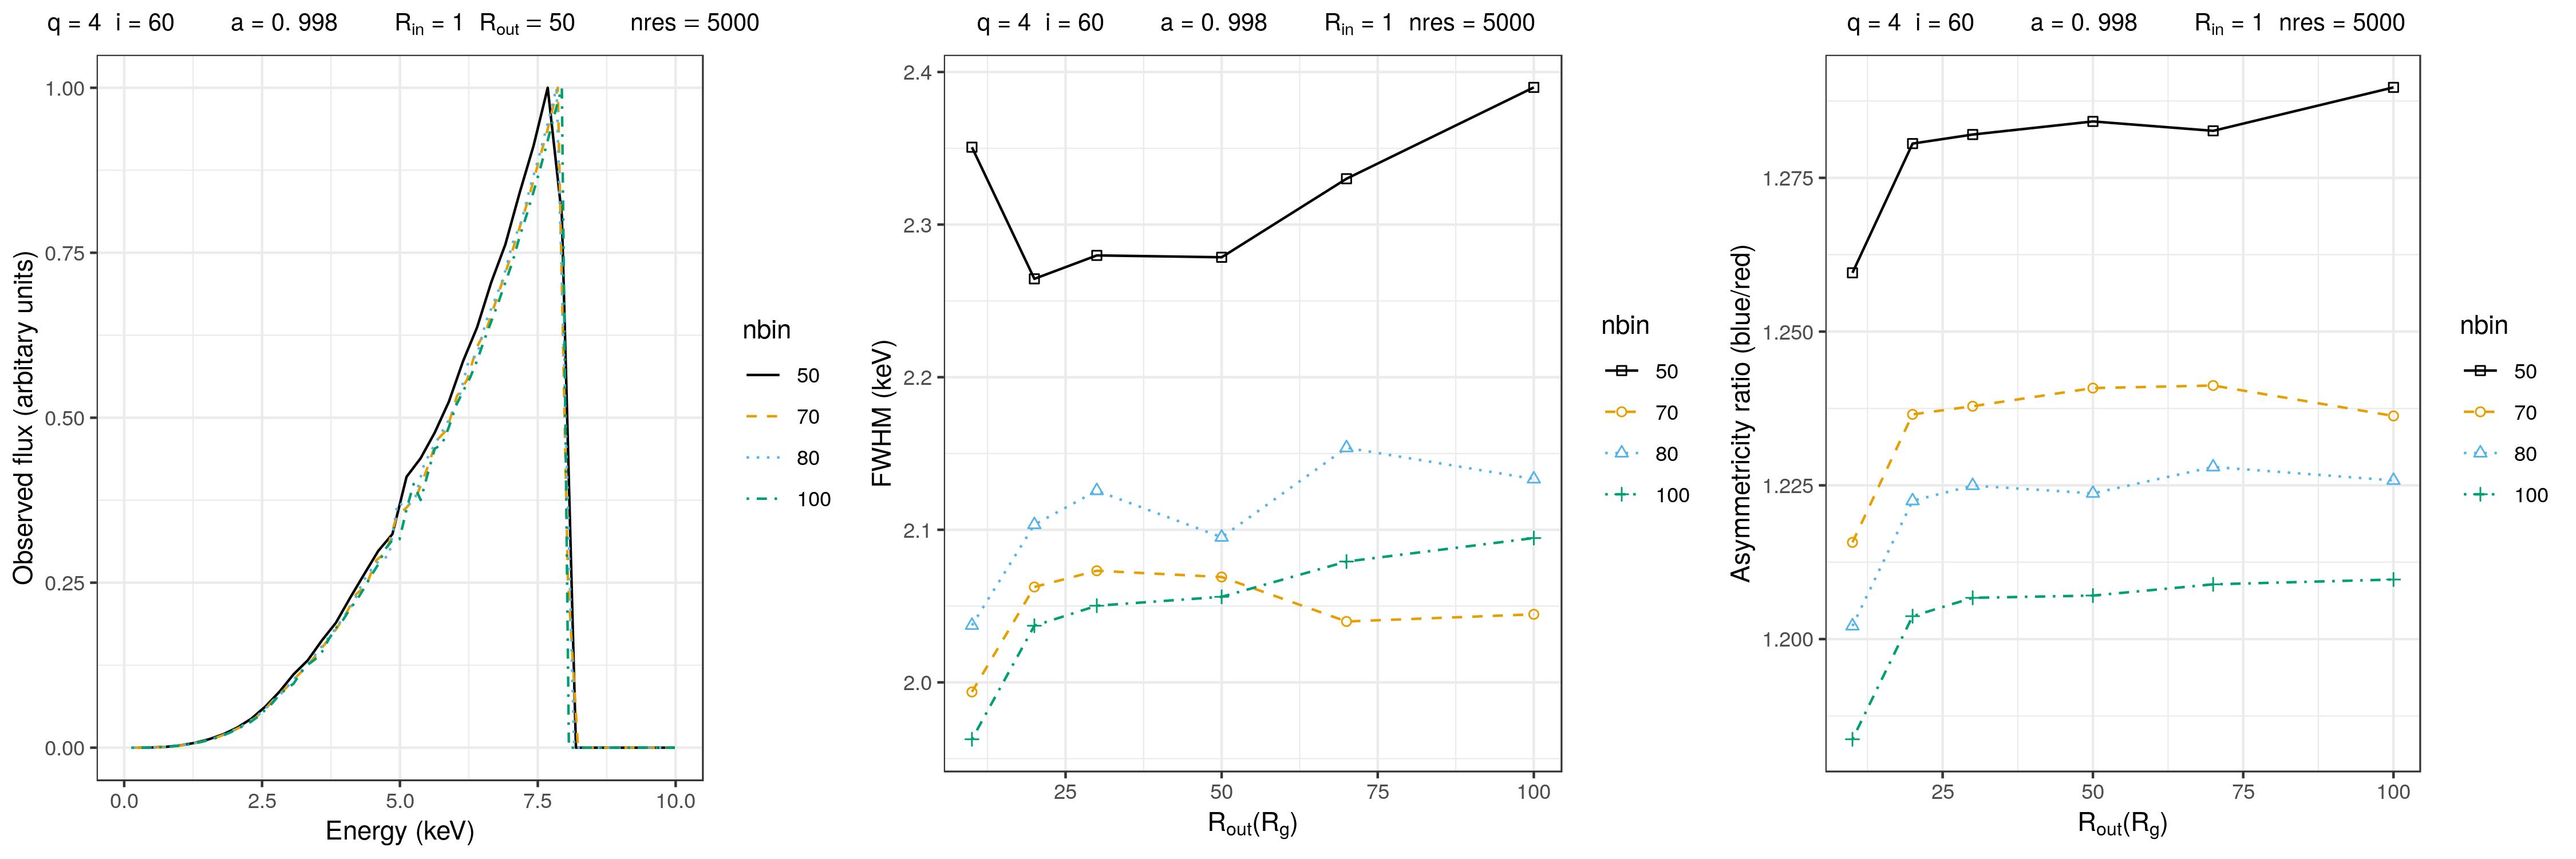
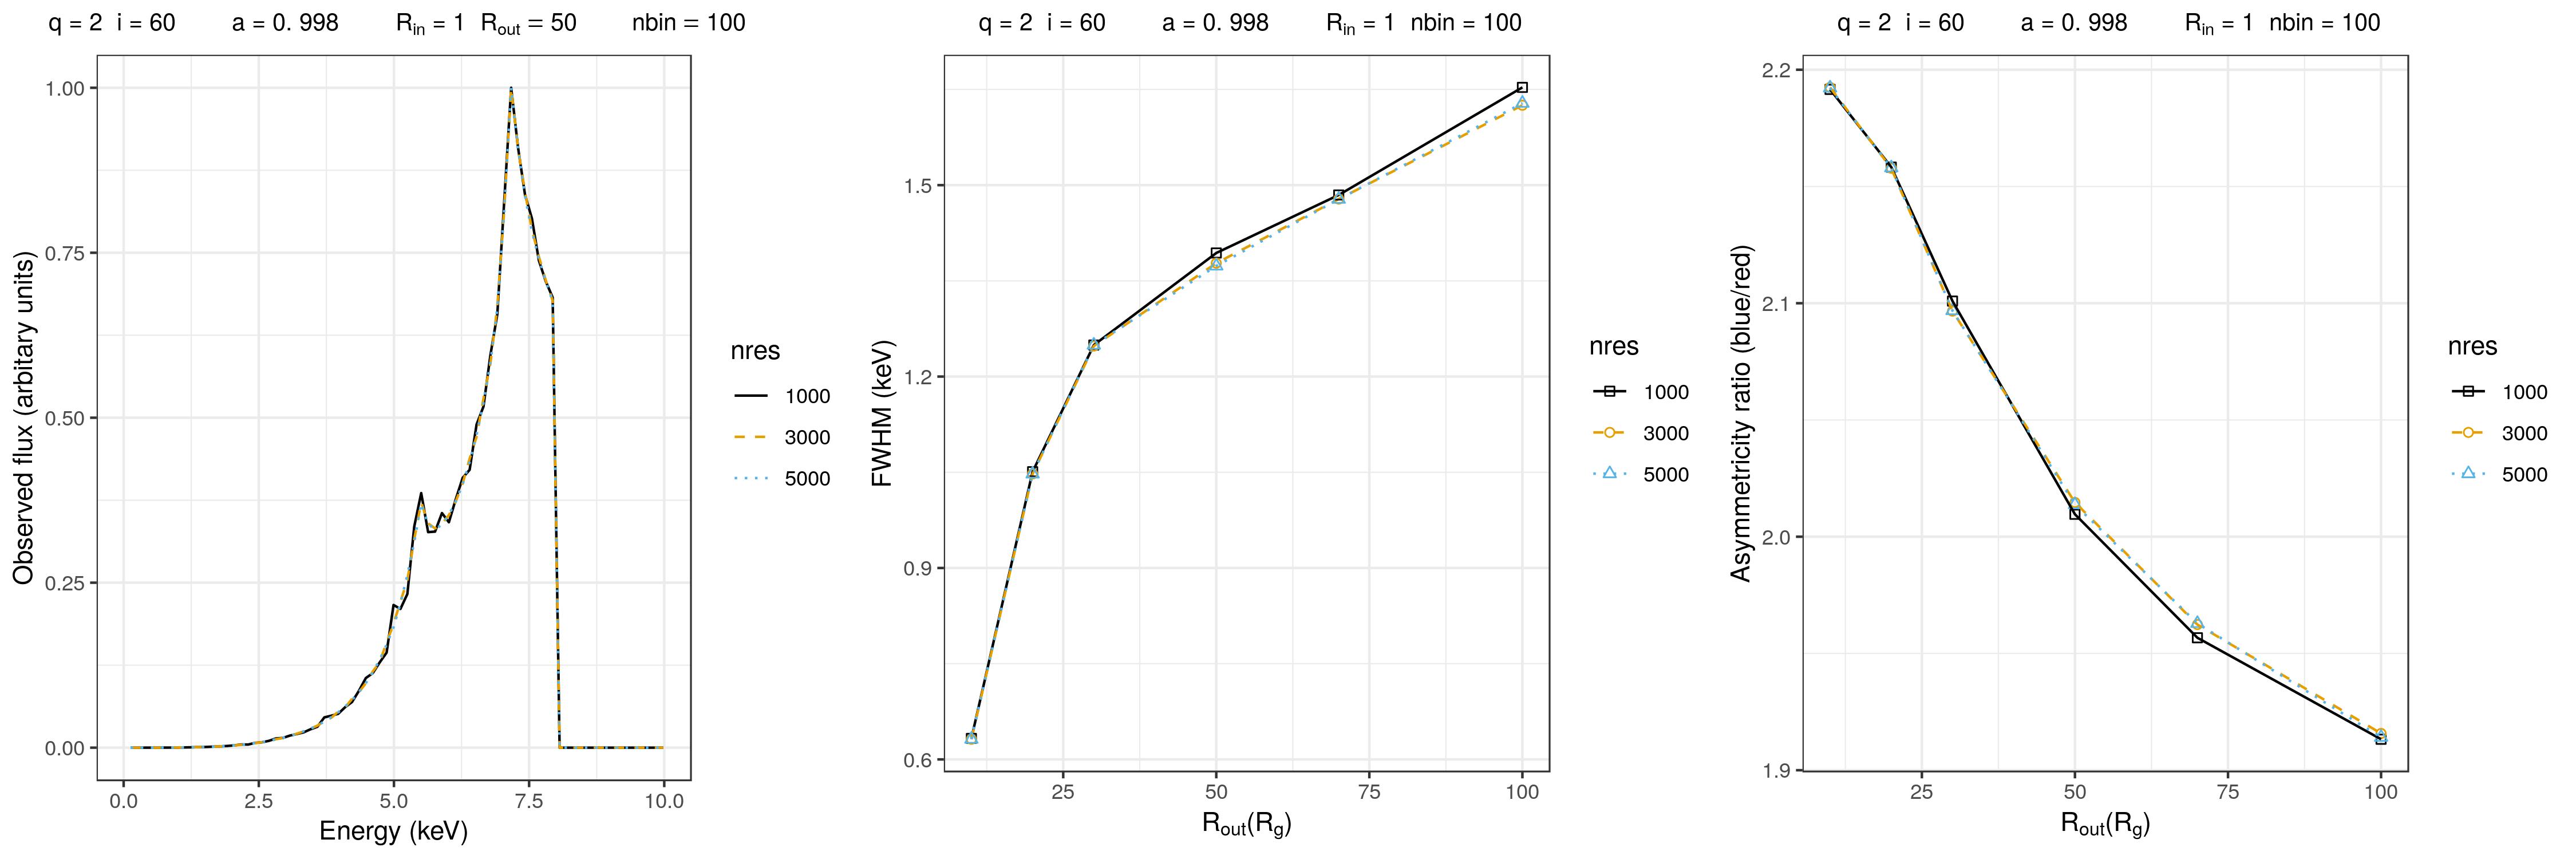
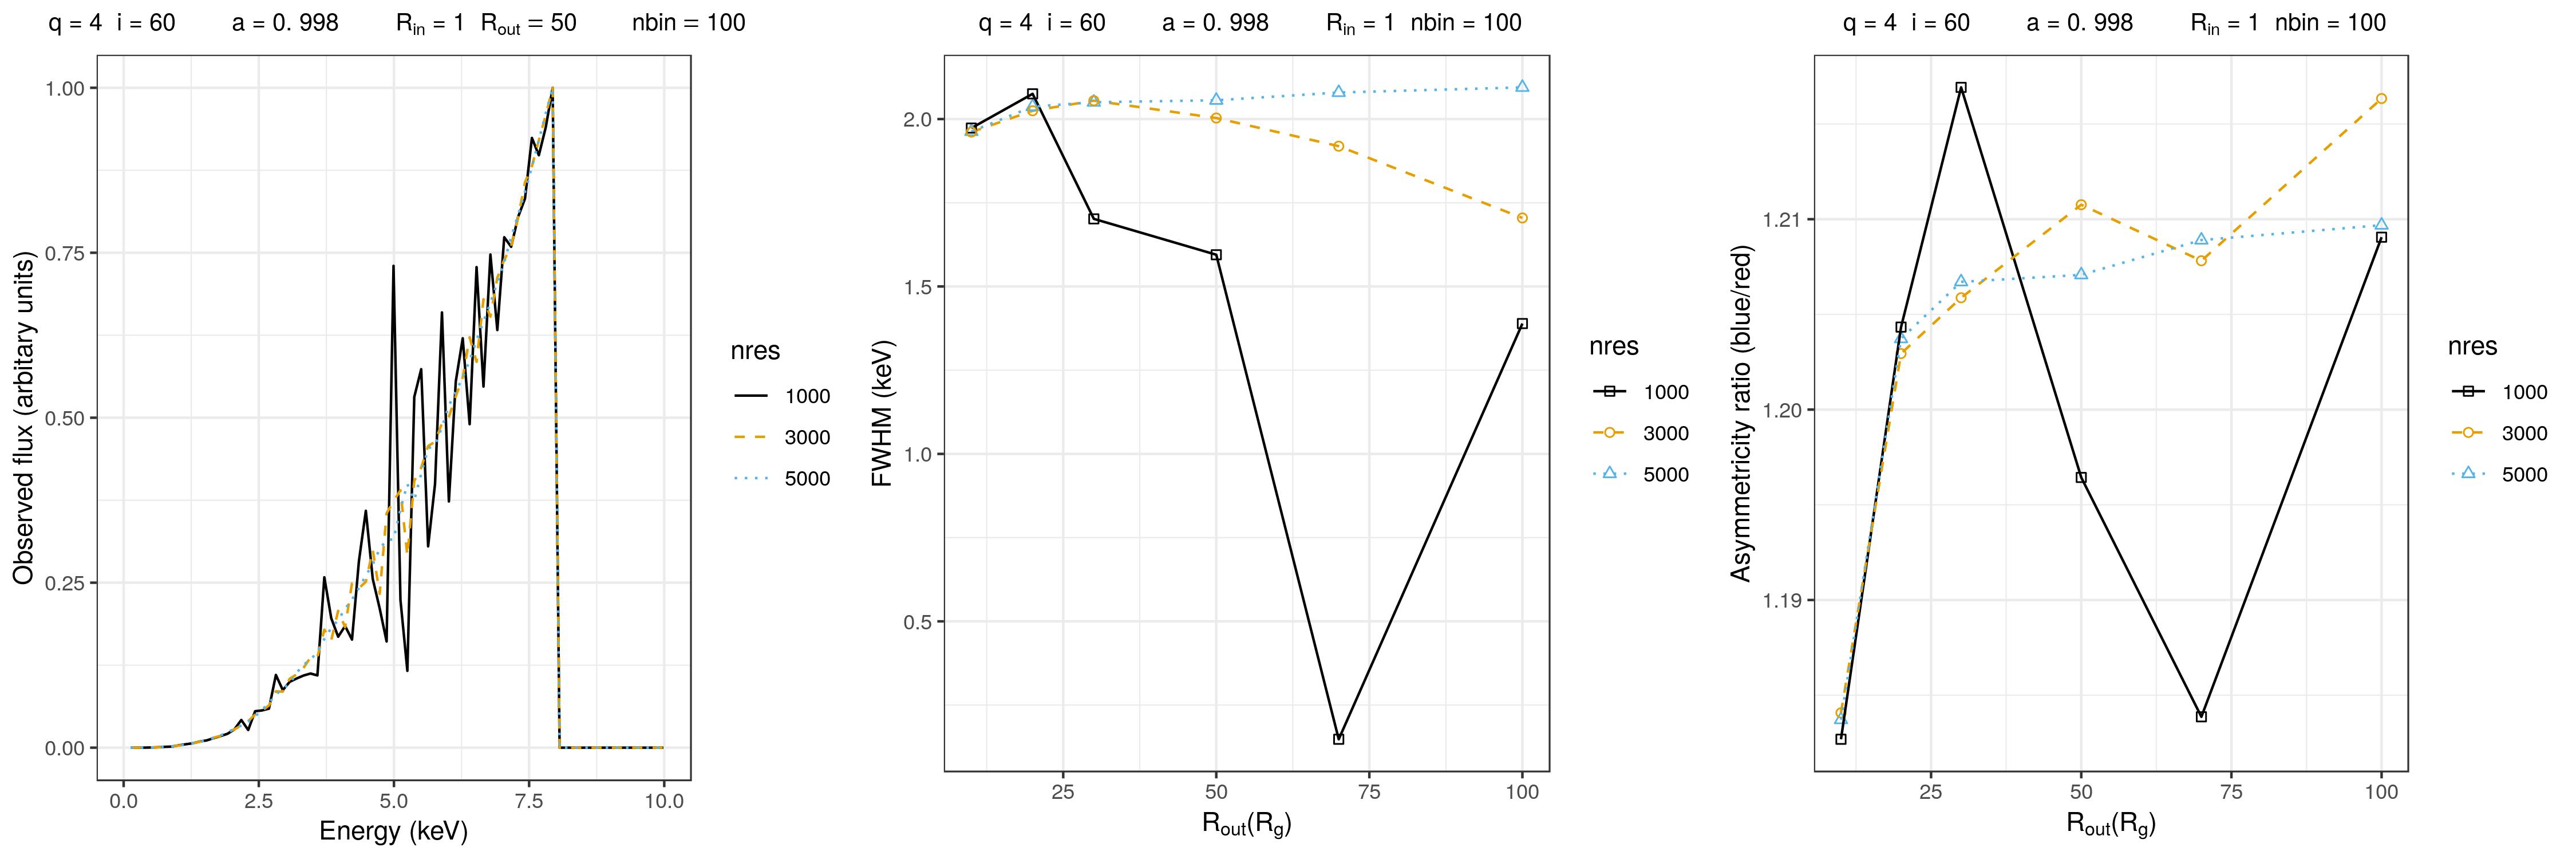
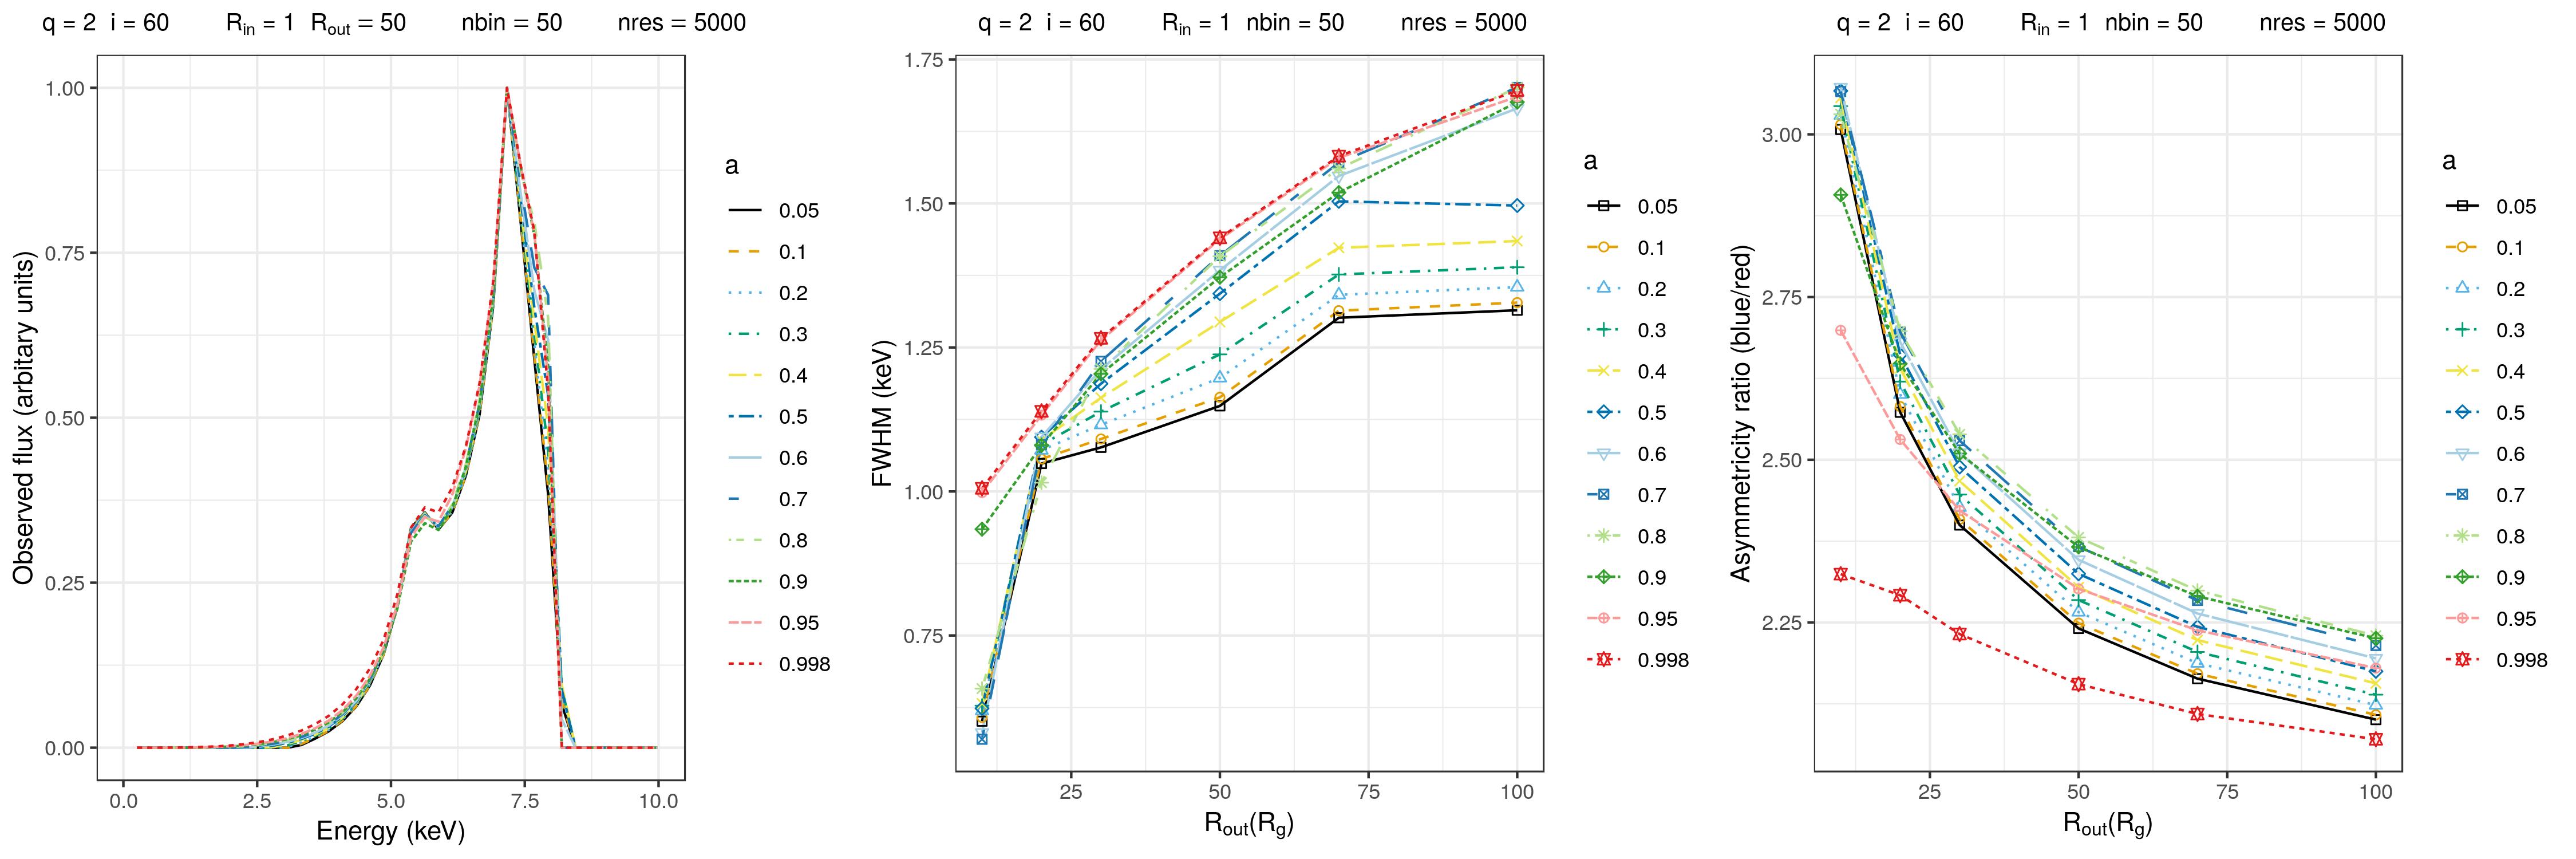
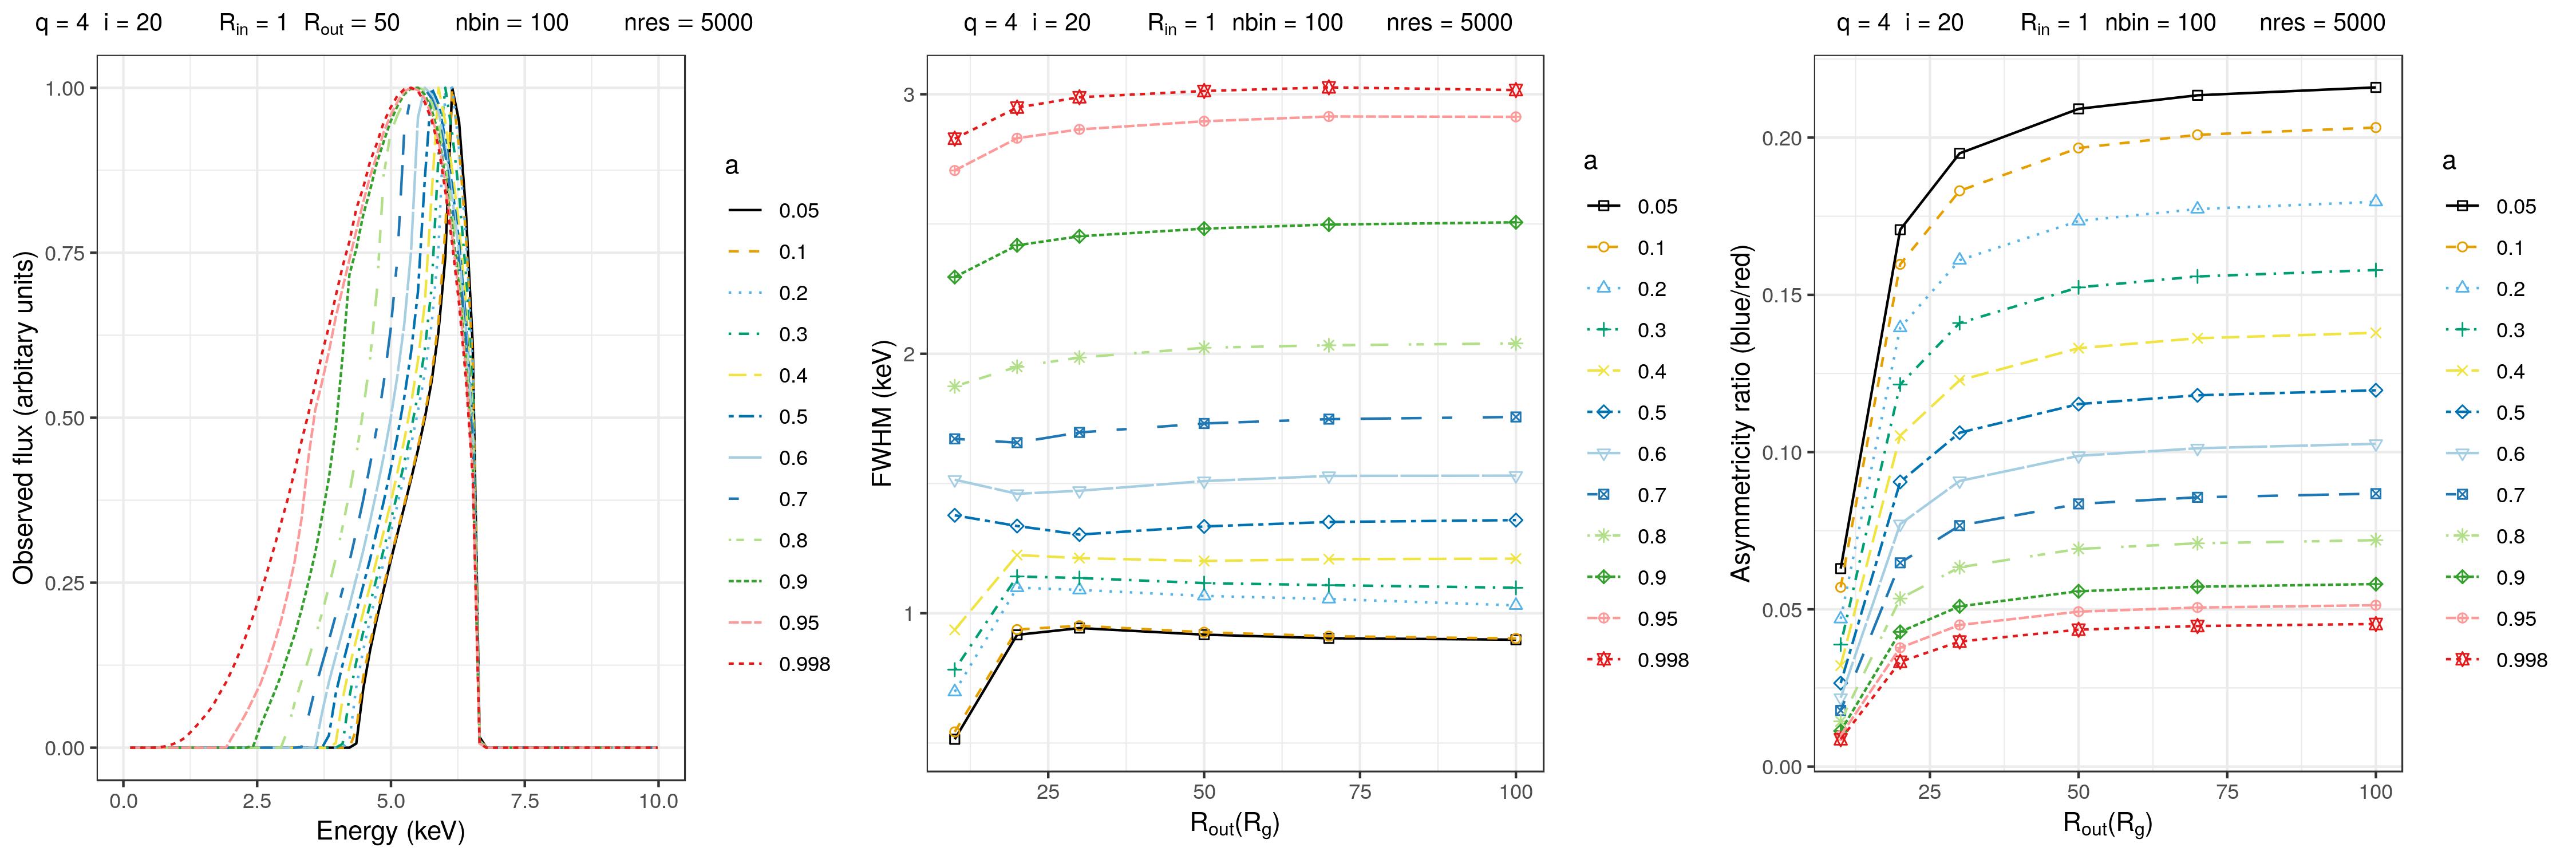
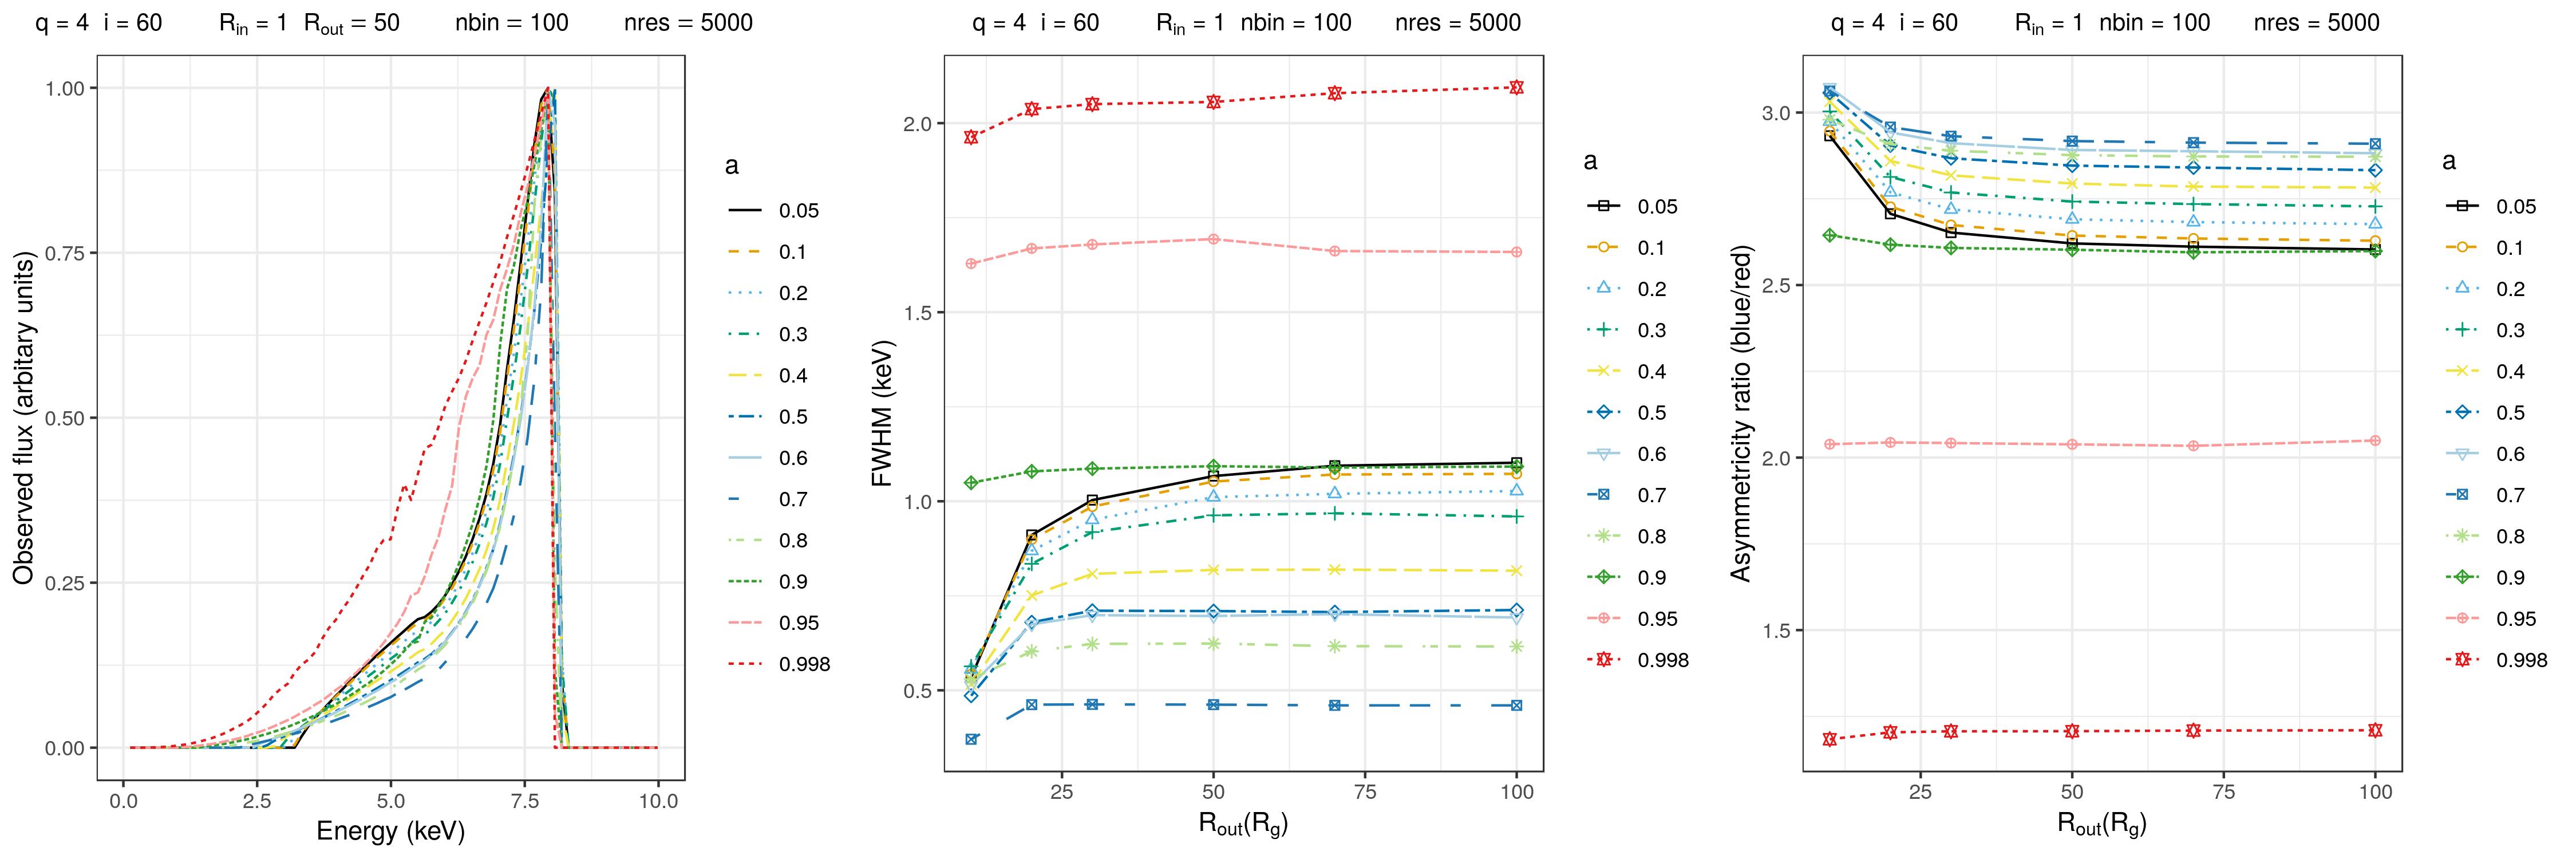
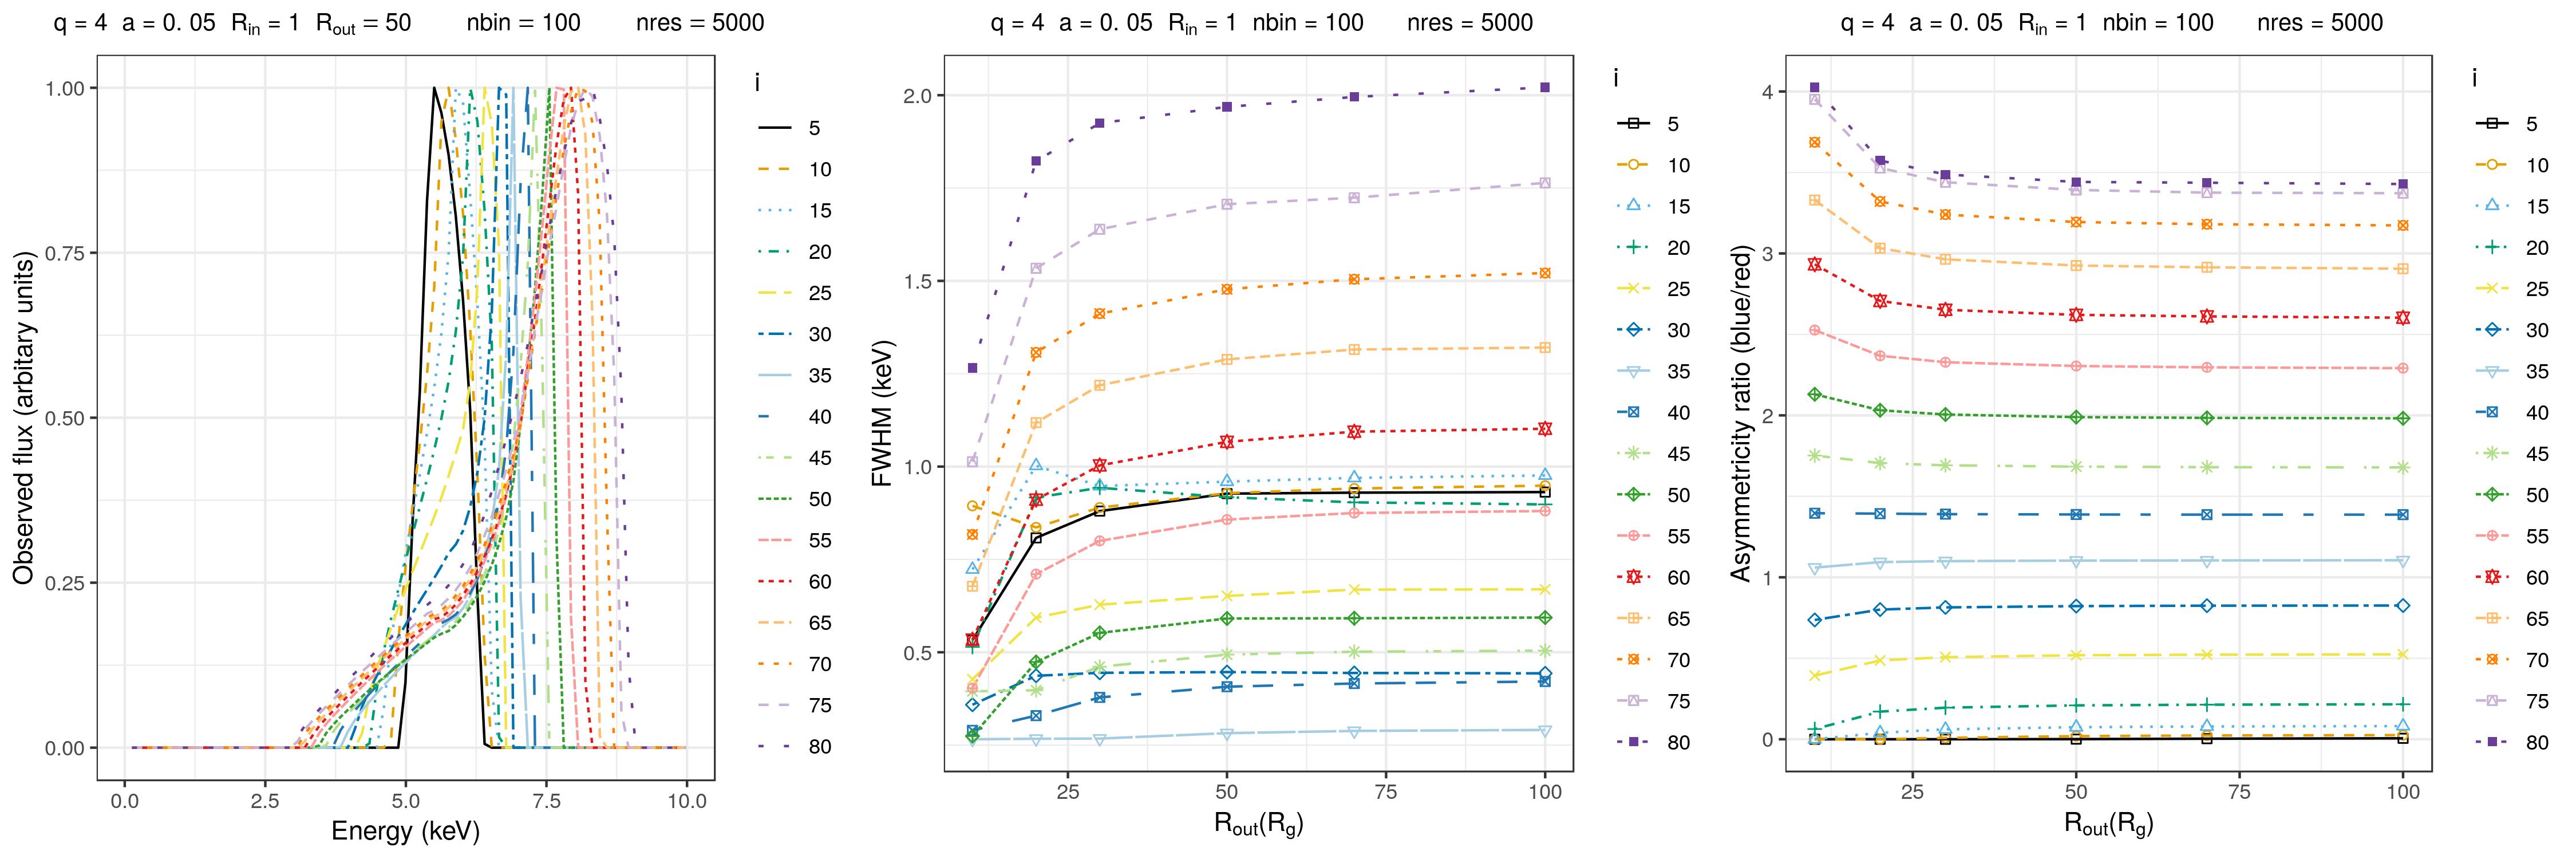
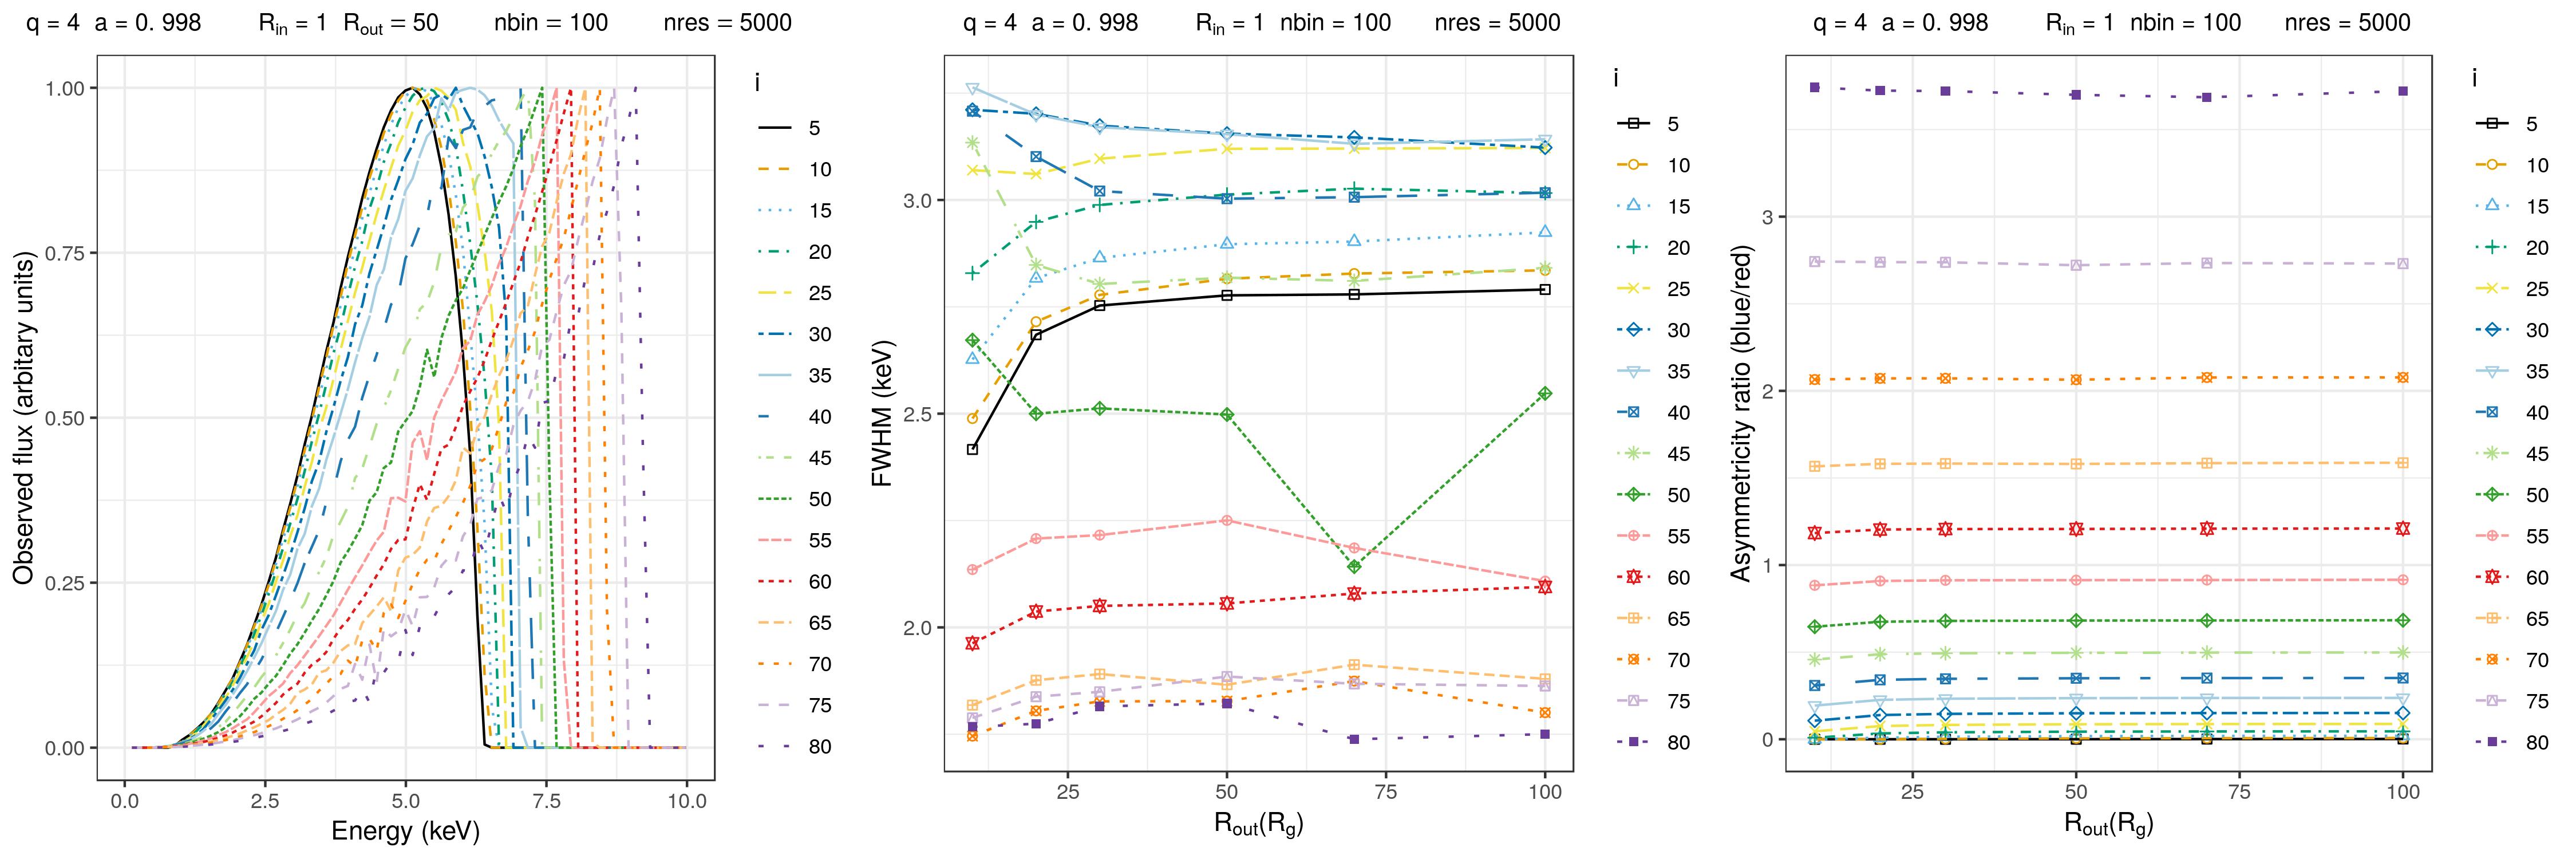
The obtained results show that during binning procedure one has to assume an appropriate number of line bins, since they could have significant effect on the resulting simulated line profiles. Namely, too small number of line bins will smooth the line profiles, and potentially hide some of the line’s important features, such as its red peak (as demonstrated in the top left panel of Fig. 4 for number of the bins less than ). Even in the case of highly inclined discs, when read peak is relatively strong (see second row of Fig. 4), its intensity and position could be affected by such smoothing. Besides, this smoothing can artificially increase asymmetricity ratio of the line profile (see the right panels of Fig. 4), and induce inaccuracies in its FWHM estimates (see the midle panels of the same figure), depending also on the spin of the central SMBH (as it can be seen by comparing the corresponding panels in the second and third row of Fig. 4). These effects are especially emphasized for higher values of emissivity index, since in this case it could also have significant influence on intensity and position of the blue peak (see the bottom row of Fig. 4).
The results obtained by simulation can be compared with the properties of the past, current and future X-ray detectors. It is known that the cameras of the XMM-Newton provide spectral resolving power [13, 14]. The energy resolution of Suzaku satellite was 10 eV at 6 keV, and it provided a spectral resolving power [15, 16]. For the future X-ray Integral Field Unit (X-IFU), that will be a part of the Athena X-ray Observatory planned energy resolution is in 0.2 - 12 keV range [17].
In our simulation the energy resolution is taken to be in the range of the XMM-Newton. The energy resolution at 6.4 keV used in simulation is 25, 35, 40 and 50, for 50, 70, 80 and 100, respectively.
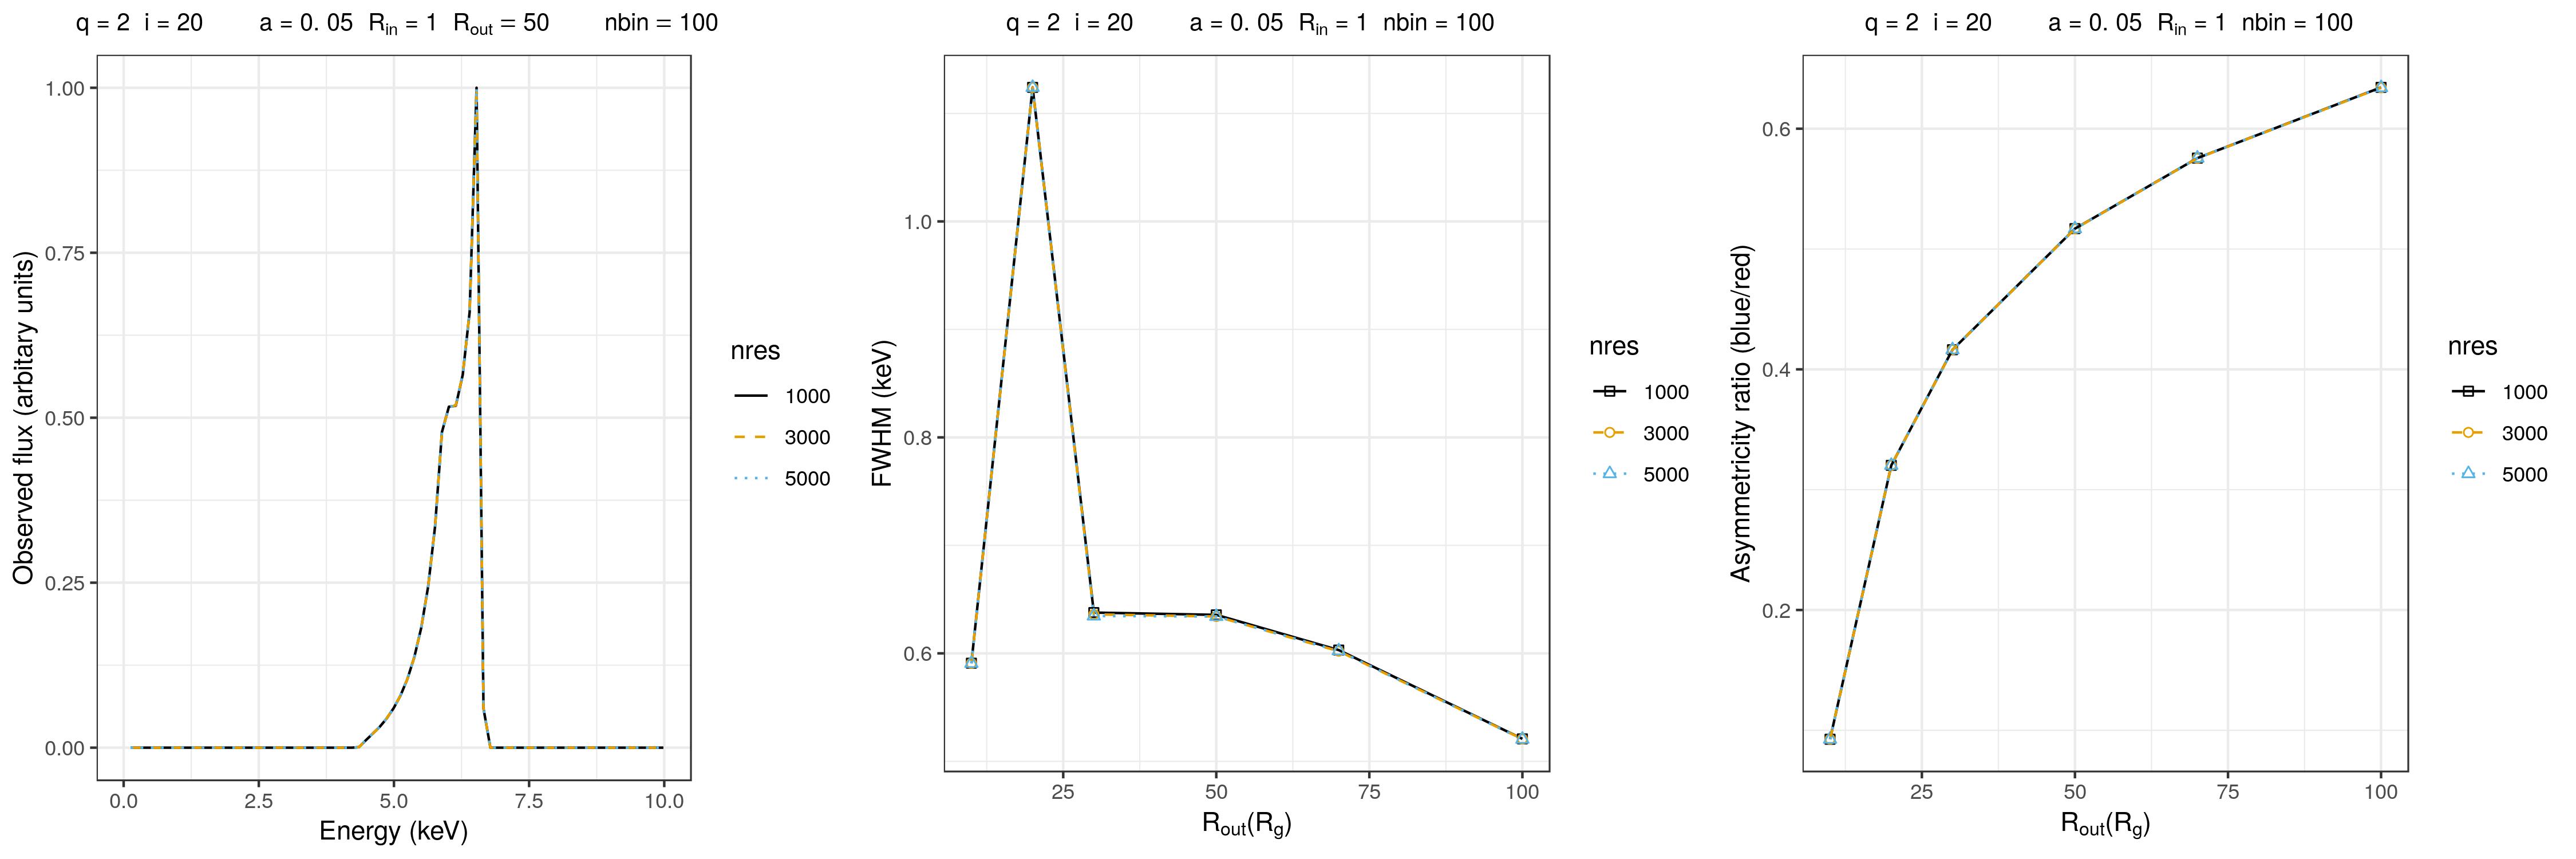
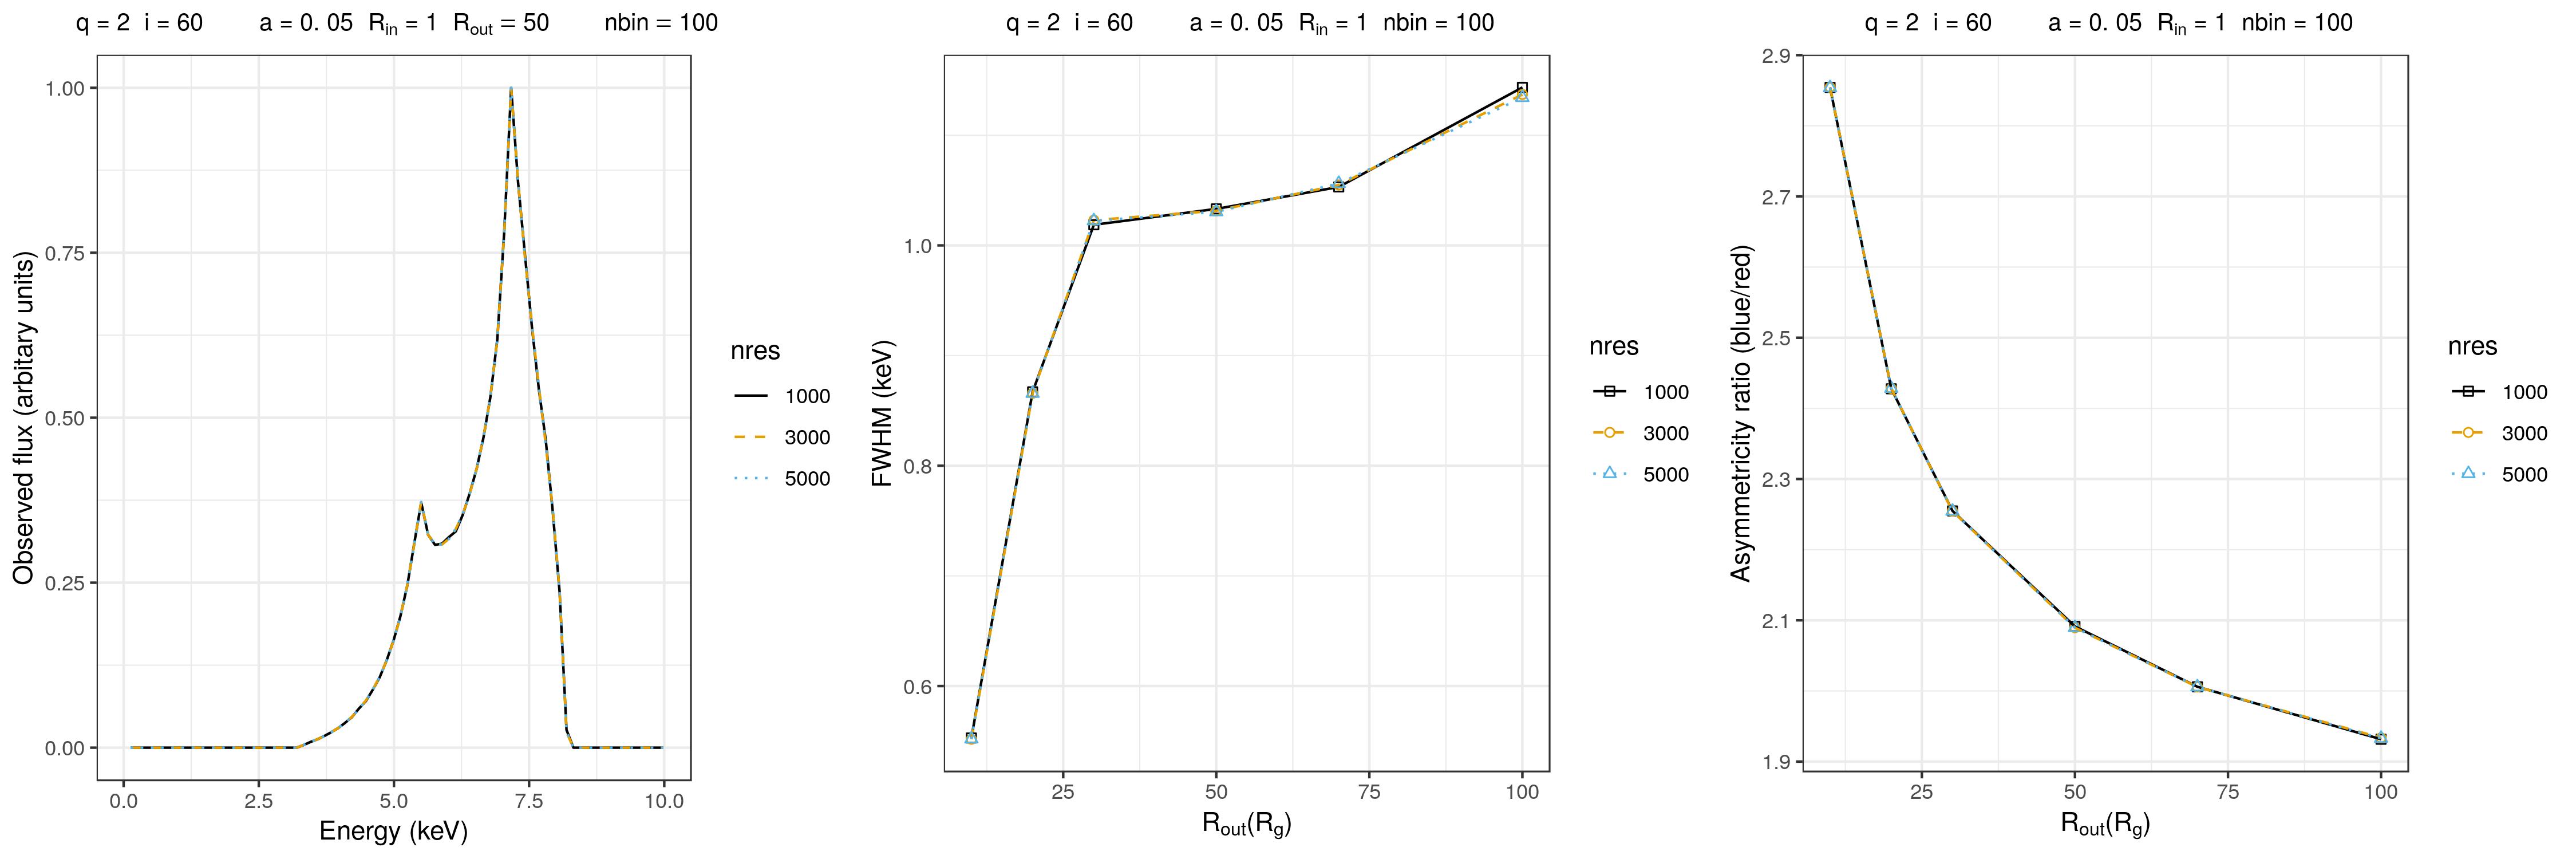
Regarding the number of photons received from the accretion disc (), in most cases it is sufficient to take , i.e. to collect of them in order to obtain the simulated Fe K line profiles of with resonable quality, as it can be seen in the Fig. 5. Only in the case of high emissivity index (see the bottom row of Fig. 5) it is necessary to significantly increase the number of photons (i.e. the ”spatial resolution” of the disc) in order to achieve this goal.
The above results clearly demonstrate that both spectral and spatial resolutions of the X-ray detectors are of crucial significance for accurate measurements of FWHM and asymmetricity ratio in the observed Fe K line profiles, and thus, for potential identification of these line profiles as relativistically broadened. In this paper we assumed spectral resolution which is similar to XMM-Newton resolution and investigated the influence of spectral resolution on the detection of relativistic Fe K line in order to explore the ability of current detectors to observe (or not observe) this line. However, next generation of X-ray observatories (as e.g. ATHENA) will provide a higher spectral resolution (around 100 times better than current missions), and it is a task that we are going to explore (investigate) in a following paper.
4.2 The effects of other disc parameters and SMBH spin
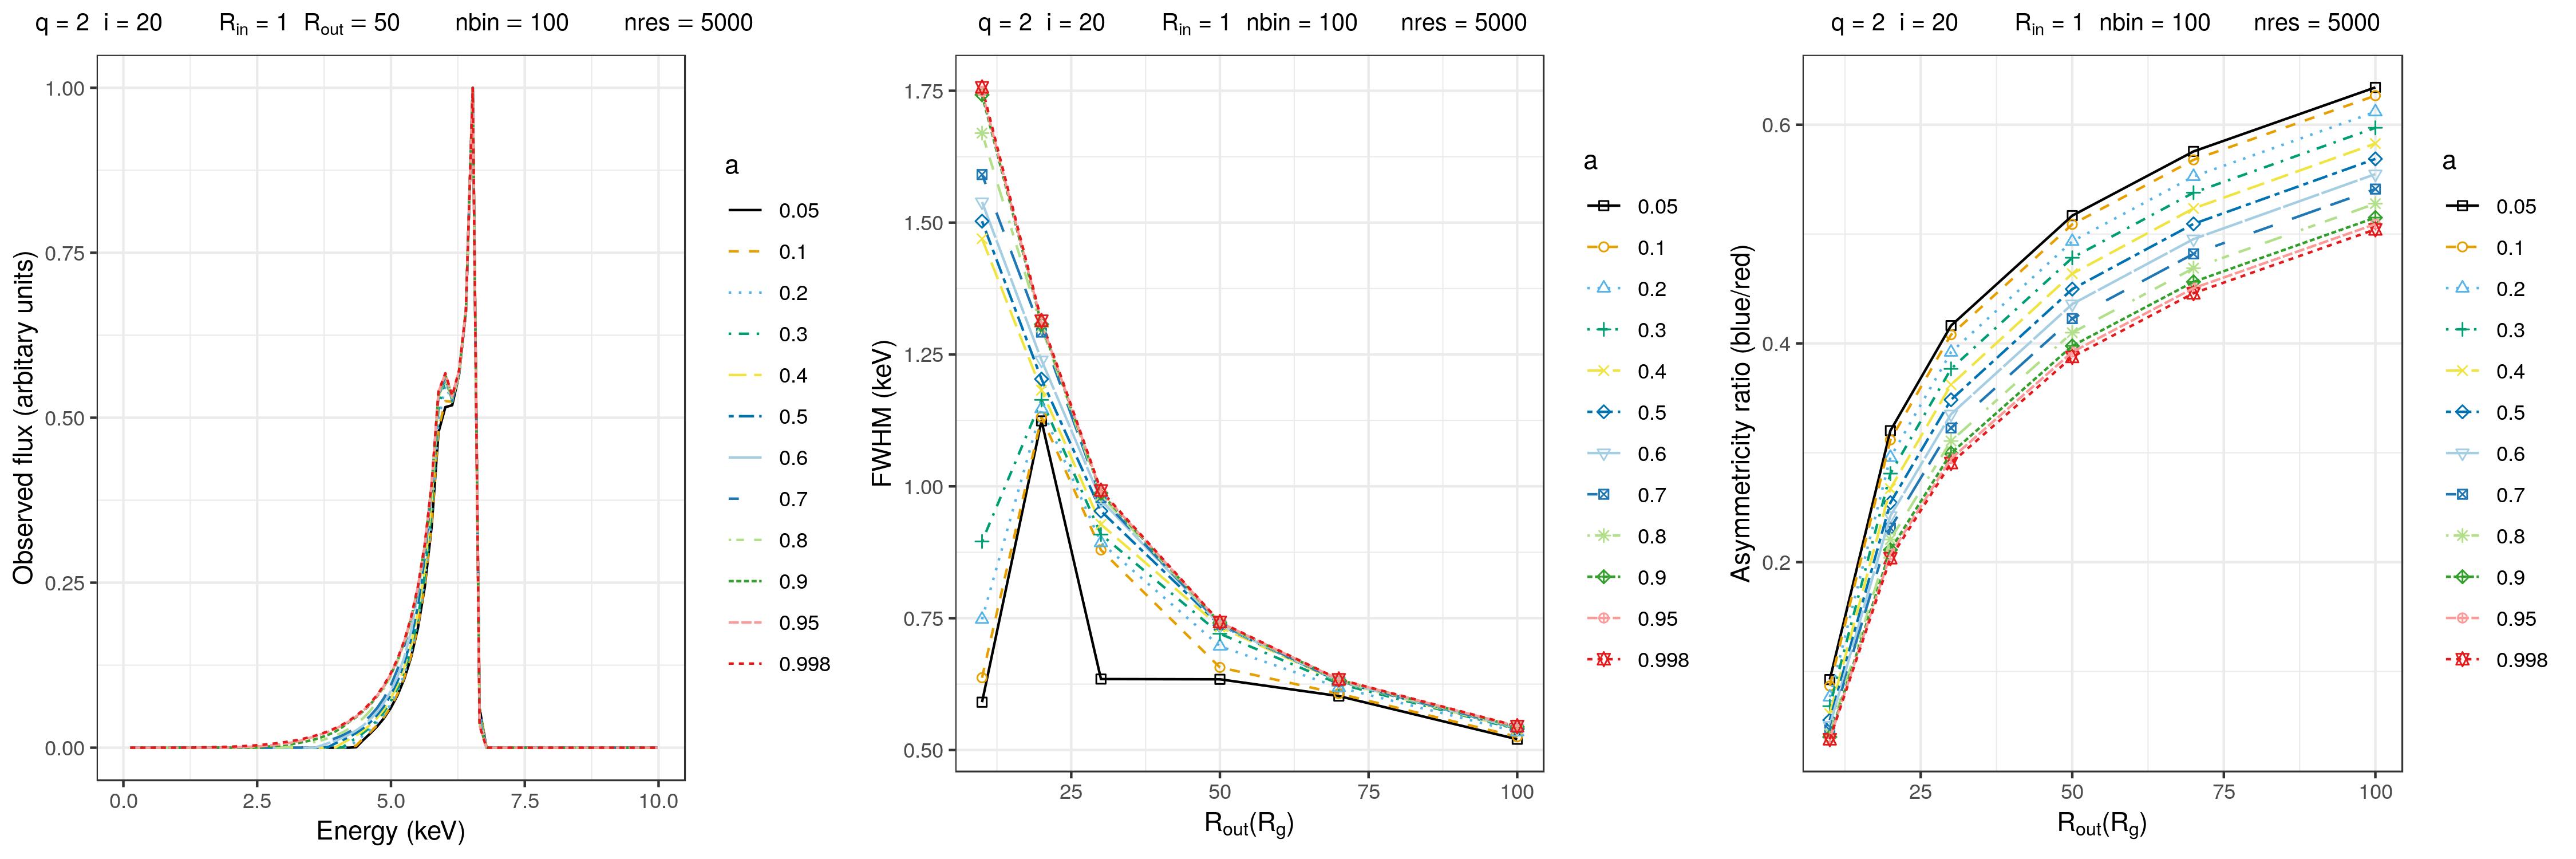
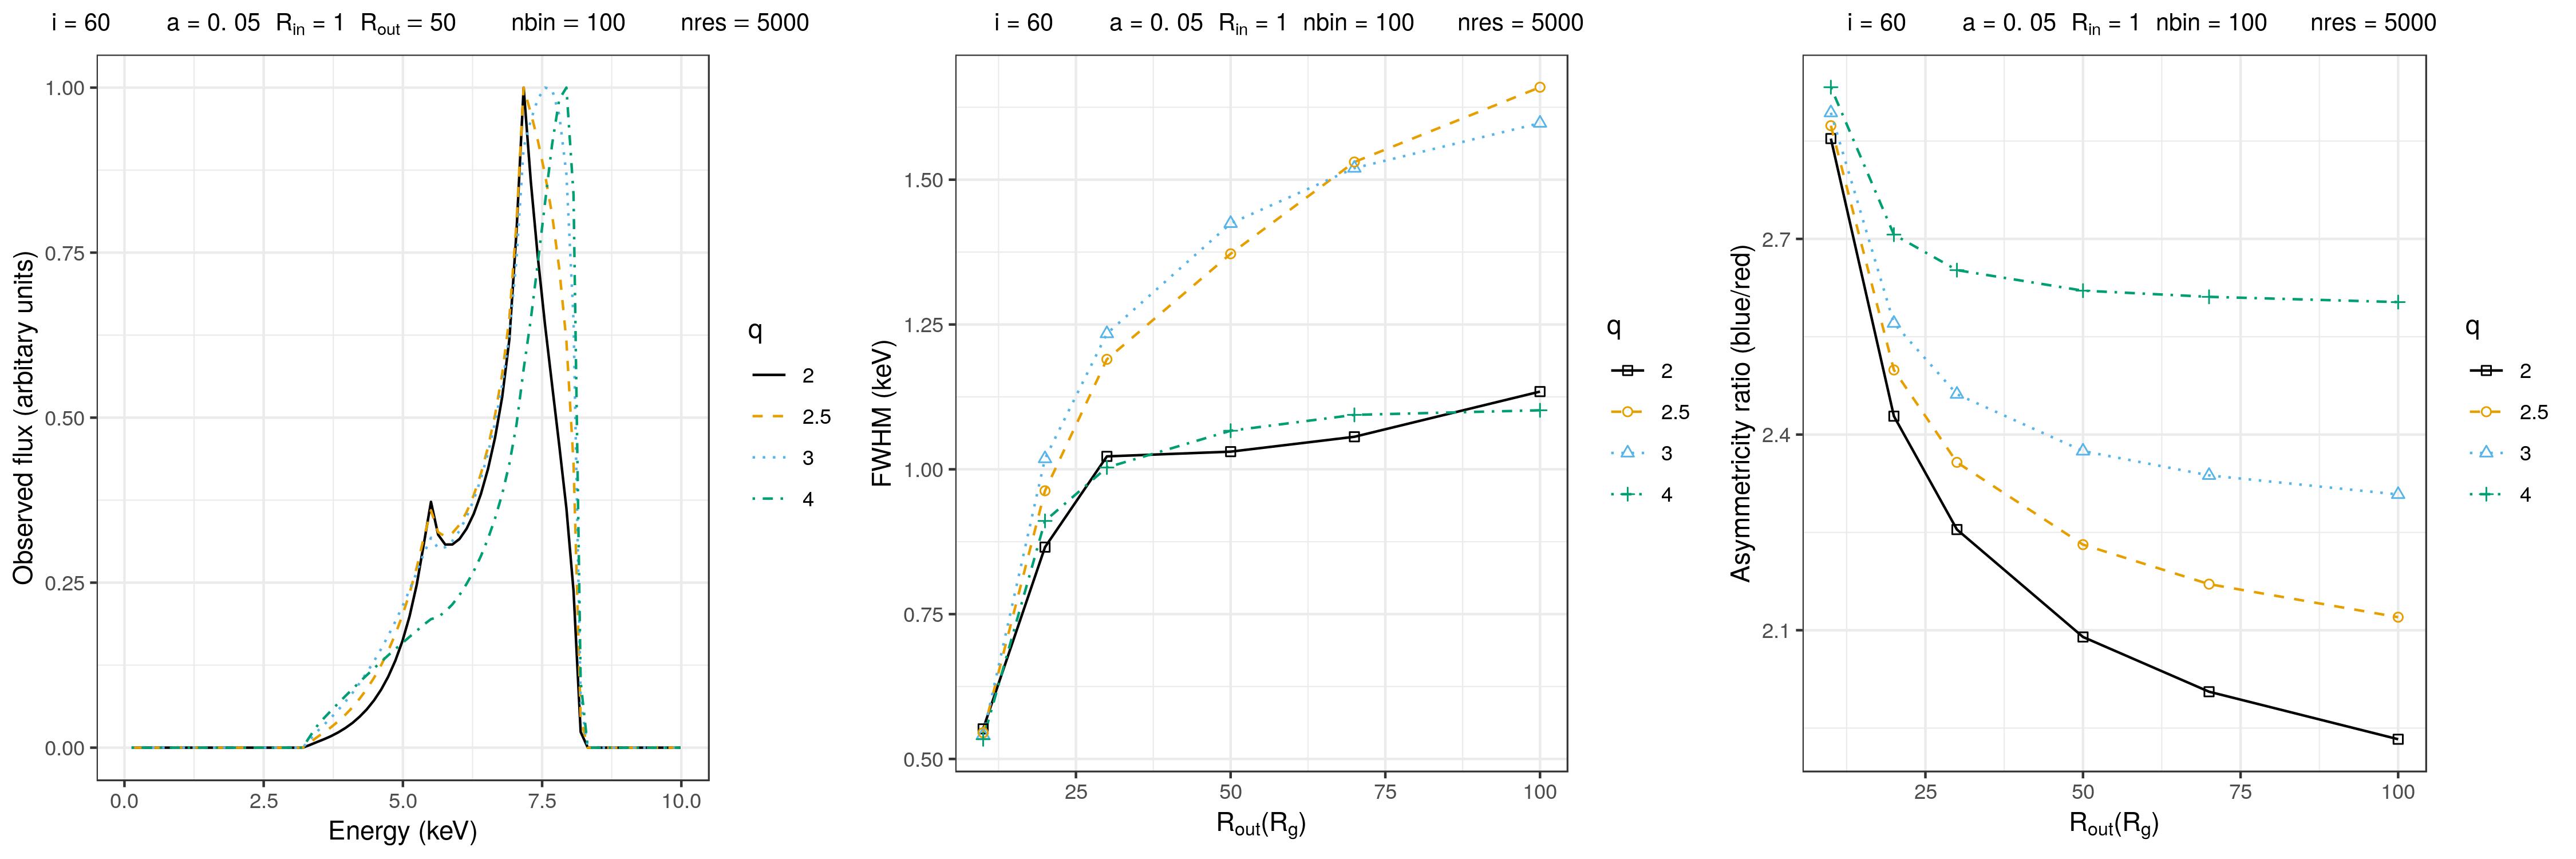
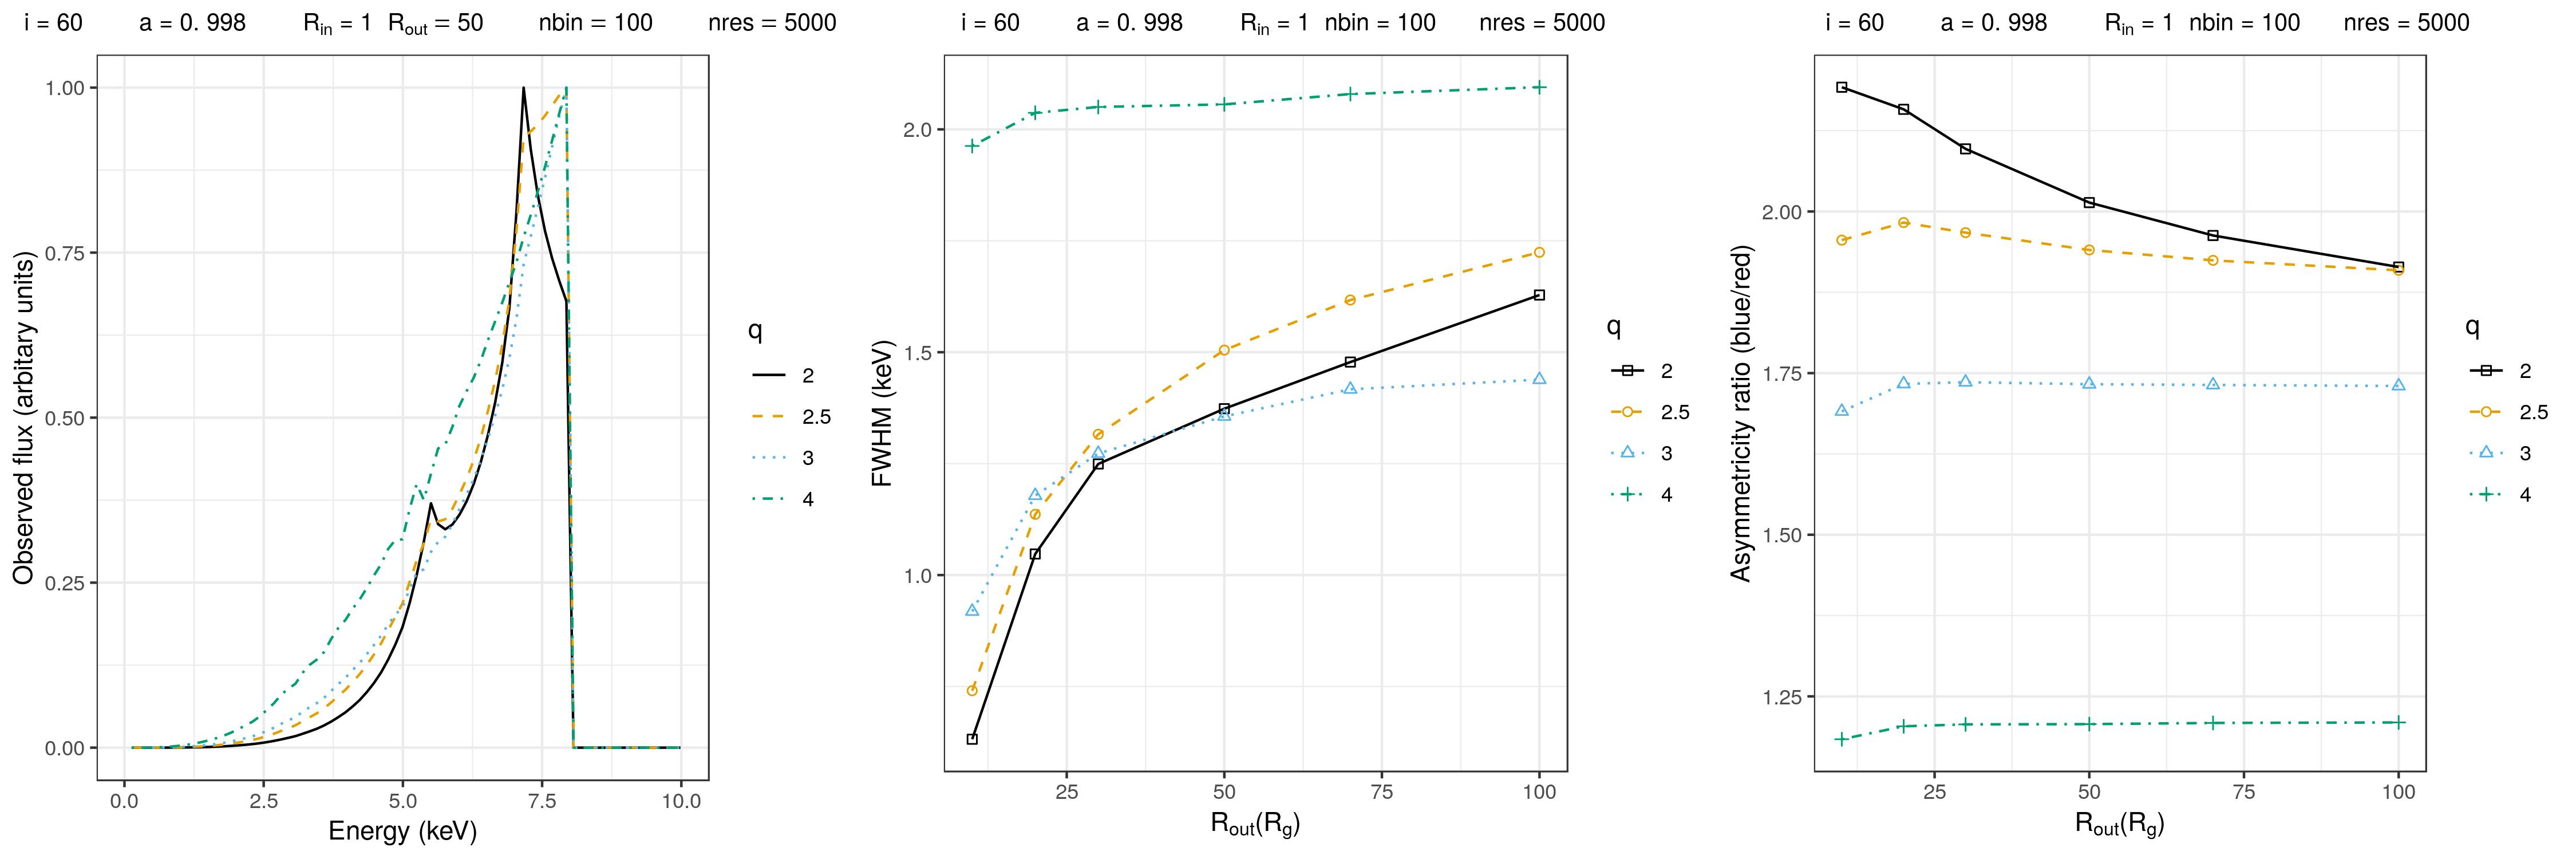
Additionally, we show that the FWHM and asymmetry ratio of the observed Fe K line profiles could be used for investigating the physics and geometry in the vicinity of SMBHs even with spectral resolution of current X-ray telescopes, and for this purpose we simulated the effects of the disc parameters and SMBH spin on these two quantities. The effects of SMBH spin on the simulated profiles of the Fe K line, its FWHM and asymmetricity ratio are presented in Fig. 6. As it can be seen in Fig. 6, the asymmetricity ratio increases, at first rapidly, with for the low disc inclination (). For high disc inclination () asymmetricity ratio decrease with (see the right panel in the first and the second row, respectively). In the case of low emissivity index (), asymmetricity ratio increase with and for the higher is almost constant, especially for high BH spin (). For a high emissivity index (), asymmetricity ratio decreses at first () and after that it is constant as increases. In this case the asymmetricity ratio is almost constant for all values of for high BH spin (). For the low disc inclination (), FWHM decreses with for and increses for lower spins. In all cases FWHM for and starts to decrese for higher (see plot in the middle, first row). For higher inclinations FWHM increses with . FWHM increses for , independently of emissivity indexes, and becomes nearly constant for higher . In the cases of hight BH spins (), FWHM is nearly constant with .
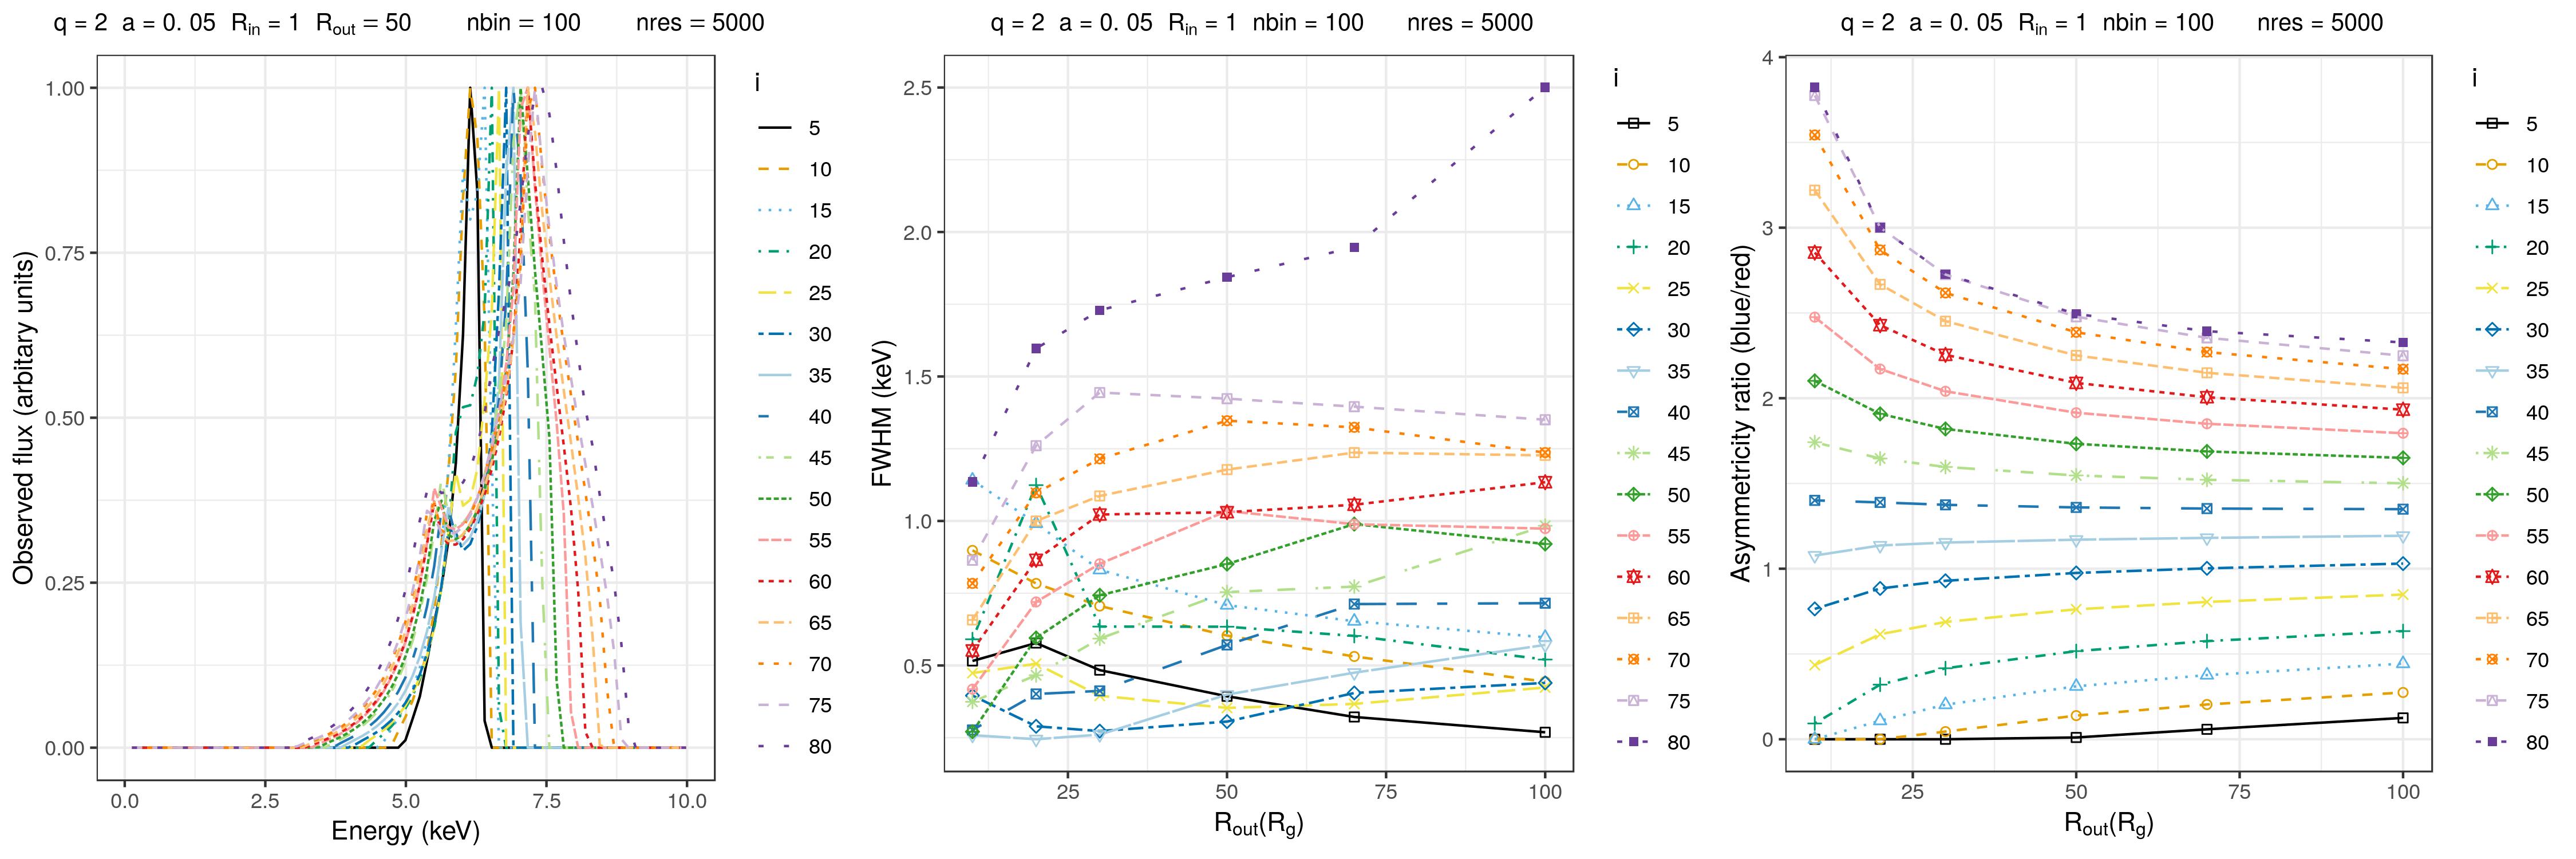
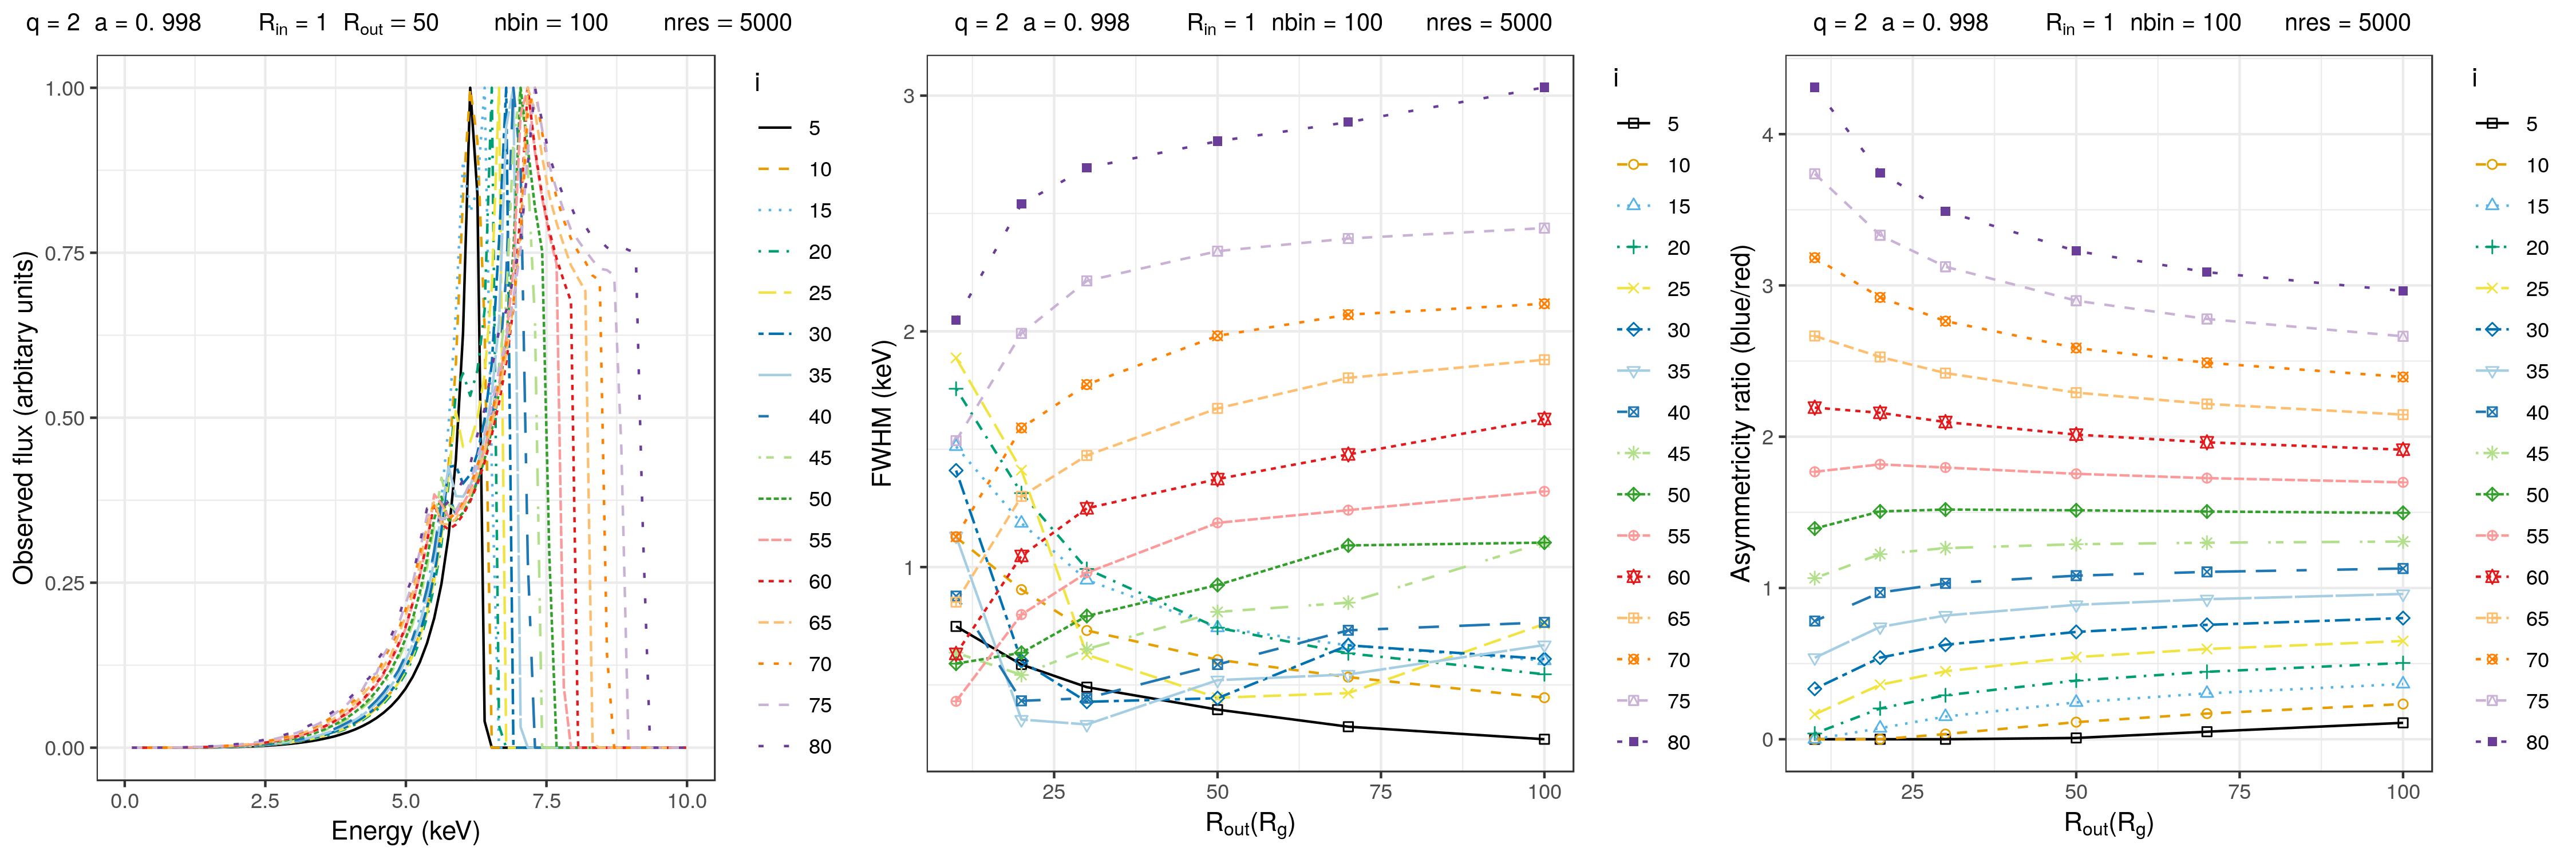
Fig. 7 shows influence of the disc inclination (i.e. viewing angle ) on the line profile, FWHM and asymmetricity ratio. The presented results indicate that for lower disc inclinations () asymmetricity ratio increases with (see the right panels of Fig. 7), for it becomes nearly constant (especially for larger outer radii ), while for highly inclined discs () it decreases with . This result implicates that asymmetricity ratio of the Fe K line could be used for determining the outer radius of the line emitting region.
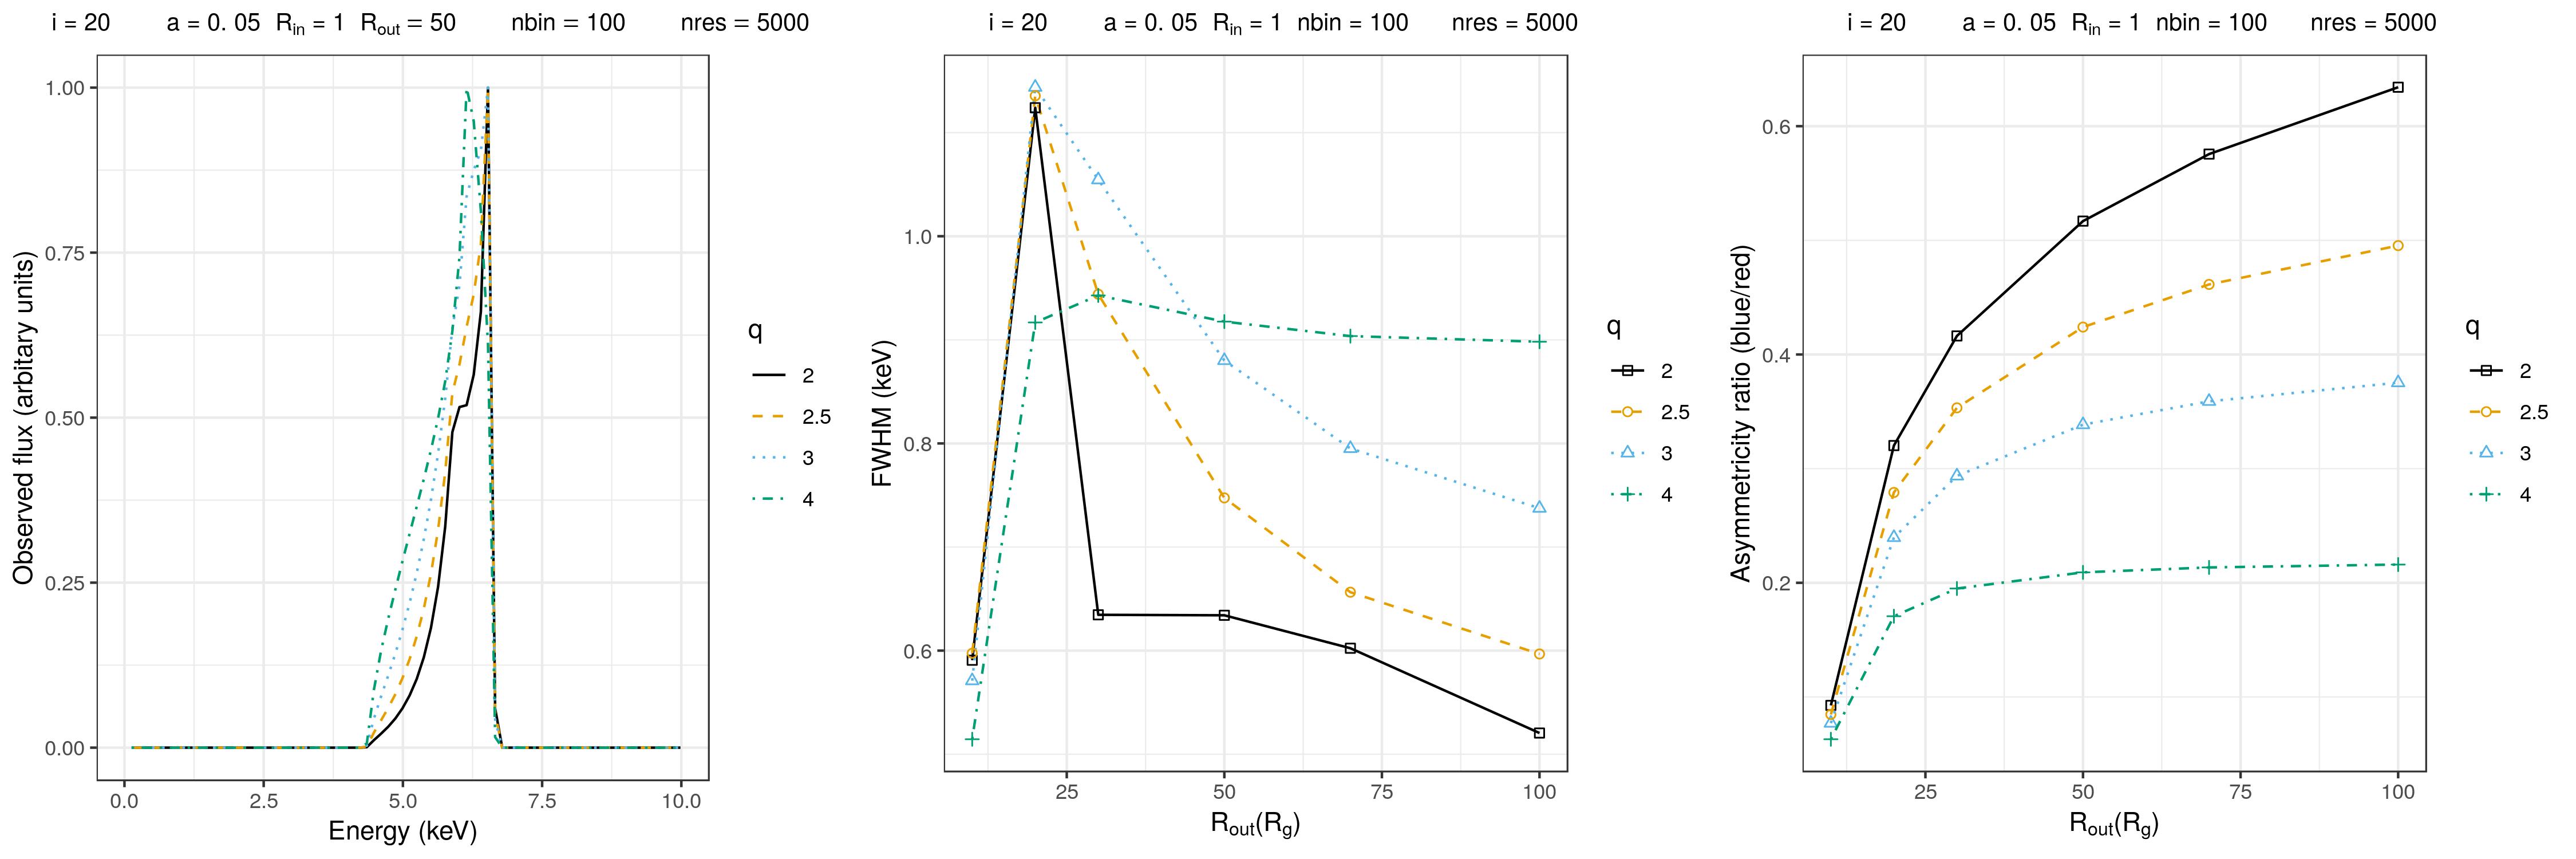
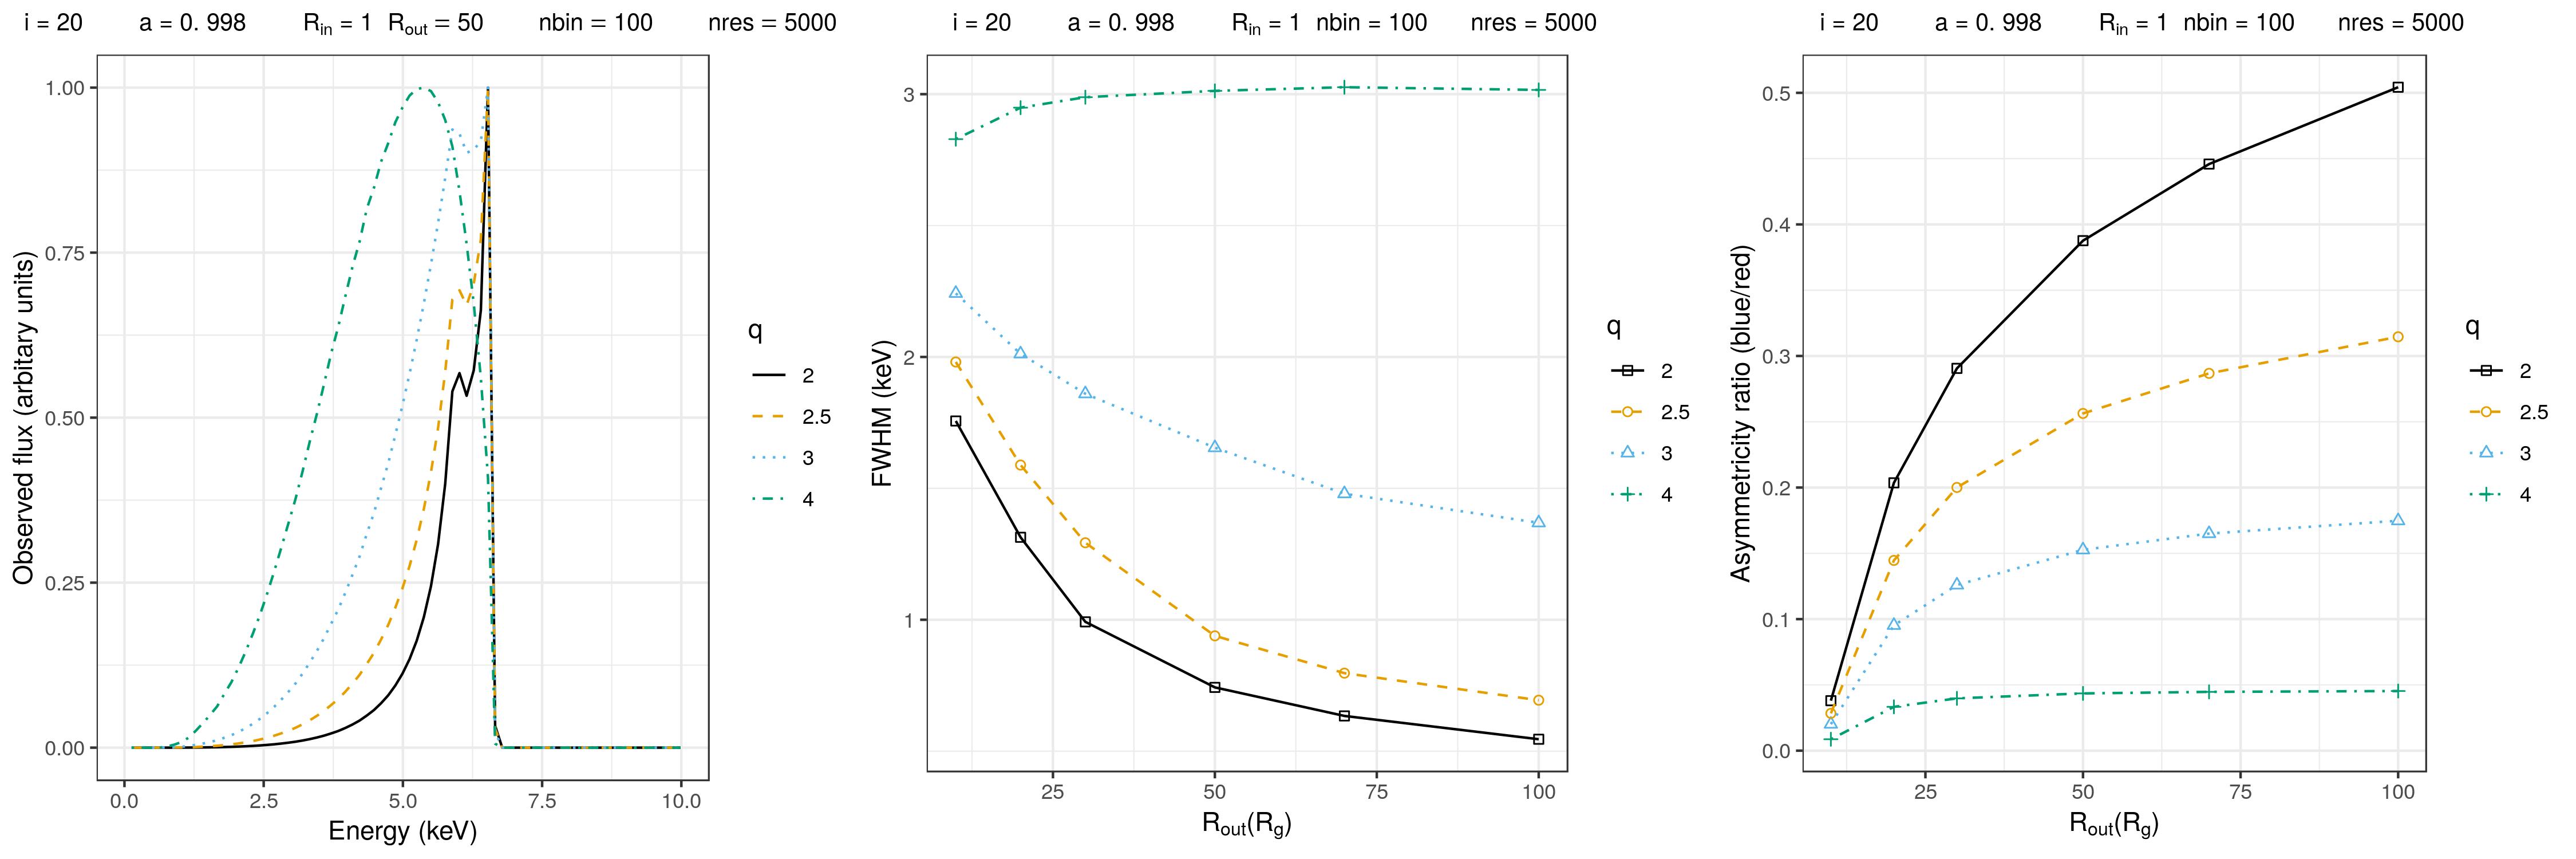
Influence of power law emissivity index on the simulated line profiles, its FWHM and the asymmetricity ratio is presened in Fig. 8, from which it can be seen that for all disc inclinations asymmetricity ratio increases, at first rapidly, with . For high emissivity indexes () asymmetricity ratio becomes nearly constant for . The asymmetricity ratio is affected by SMBH spins in such a way that in the case of a non-rotating Schwarzschild SMBH () the asymmetricity ratio is decresing with . However, in the case of a rapidly rotating Kerr SMBH () the asymmetricity ratio is nearly constant with for emissivity indexes . For the inclination , FWHM increases rapidly for . In tha cases of emissivity indexes , FWHM reaches the maximum at and decreases as increases; however, for FWHM becomes almost constant for .
5 Conclusions
We developed a model of an accretion disc around SMBH hole using numerical simulations based on a ray-tracing method in the Kerr metric
This model allows us to study the radiation which originates in the vicinity of SMBHs. The shape of the emitted broad Fe K line is strongly affected by three types of shifts: classical Doppler shift - causing double-peaked profile, special relativistic transverse Doppler shift and relativistic beaming - enhancing blue peak relative to red one and general relativistic gravitational redshift - smearing blue emission into red one.
Comparisons between the modelled and observed Fe K line profiles allow us to determine the parameters of the line emitting region as well as to study plasma physics and spacetime metrics in vicinity of SMBHs. Two of them are of an especial importance for the strong gravitational field investigation in AGN, i.e. the mass of central BH and its angular momentum. Other parameters can give us information about the plasma conditions in vicinity of the central BH of the AGN.
From our simulations, we find that number of line bins and photons taken in calculations are of crucial significance for obtain the correct Fe K line profiles, especially in the case of higher the disc emissivity index. Also, the lack of observed Fe K line can be caused by the low resolution (our bin simulation) and sensitivity (our number of photon simulation) of the X-ray detectors. In addition, we conclude that in most cases the FWHM and the asymmetricity ratio of the Fe K line strongly depends on the parameters of the disc, especially the outer radius and inclination.
Acknowledgments
This study is part of projects ”Astrophysical Spectroscopy of Extragalactic Objects” (No. 176001), ”Gravitation and the large scale structure of the Universe” (No. 176003) and ”Visible and Invisible Matter in Nearby Galaxies: Theory and Observations” (No. 176021) supported by the Ministry of Education, Science and Technological development of Serbia. The work is partially supported by ICTP — SEENET-MTP project NT-03 ”Cosmology - Classical and Quantum Challenges”.
References
- [1] B. M. B. M. Peterson, An introduction to active galactic nuclei (Cambridge University Press, 1997).
- [2] P. Jovanović, New Astronomy Reviews 56, 37 (2012).
- [3] P. Jovanovic, Serbian Astronomical Journal 185, 1 (2012).
- [4] A. C. Fabian, M. J. Rees, L. Stella and N. E. White, Monthly Notices of the Royal Astronomical Society 238, 729 (1989).
- [5] K. Nandra, I. M. George, R. F. Mushotzky, T. J. Turner and T. Yaqoob, The Astrophysical Journal 477, 602 (1997).
- [6] K. Nandra, P. M. O’Neill, I. M. George and J. N. Reeves, Monthly Notices of the Royal Astronomical Society 382, 194 (2007).
- [7] Y. Tanaka, K. Nandra, A. C. Fabian, H. Inoue, C. Otani, T. Dotani, K. Hayashida, K. Iwasawa, T. Kii, H. Kunieda, F. Makino and M. Matsuoka, Nature 375, 659 (1995).
- [8] G. Bao, P. Hadrava and E. Ostgaard, The Astrophysical Journal 435, 55 (1994).
- [9] B. C. Bromley, K. Chen and W. A. Miller, The Astrophysical Journal 475, 57 (1997).
- [10] C. Fanton, M. Calvani, F. de Felice and A. Čadež, Publications of the Astronomical Society of Japan 49, 159 (1997).
- [11] A. Čadež, C. Fanton and M. Calvani, New Astronomy 3, 647 (1998).
- [12] P. Jovanović and L. Č. Popović (2009), arXiv:0903.0978.
- [13] M. J. L. Turner et al, Astronomy & Astrophysics 365 L27–L35 (2001).
- [14] L. Strüder et al, Astronomy & Astrophysics 365, L18–L26 (2001).
- [15] J. E. Trümper, G. Hasinger (Eds.), The Universe in X-Rays. (Springer-Verlag Berlin Heidelberg, 2008).
- [16] K. Mitsuda et al, Publications of the Astronomical Society of Japan 59, S1–S7 (2007).
- [17] Barret, D. et al. Space Telescopes and Instrumentation 2016: Ultraviolet to Gamma Ray 9905 99052F (2016).