, ,
Effect of intrinsic defects on the thermal conductivity of PbTe from classical molecular dynamics simulations
Abstract
Despite being the archetypal thermoelectric material, still today some of the most exciting advances in the efficiency of these materials are being achieved by tuning the properties of PbTe. Its inherently low lattice thermal conductivity can be lowered to its fundamental limit by designing a structure capable of scattering phonons over a wide range of length scales. Intrinsic defects, such as vacancies or grain boundaries, can and do play the role of these scattering sites. Here we assess the effect of these defects by means of molecular dynamics simulations. For this we purposely parametrize a Buckingham potential that provides an excellent description of the thermal conductivity of this material over a wide temperature range. Our results show that intrinsic point defects and grain boundaries can reduce the lattice conductivity of PbTe down to a quarter of its bulk value. By studying the size dependence we also show that typical defect concentrations and grain sizes realized in experiments normally correspond to the bulk lattice conductivity of pristine PbTe.
Keywords: PbTe, thermal conductivity, molecular dynamics, grain boundaries, vacancy, interstitial.
1 Introduction
The utilization of a temperature gradient to create an electrical current through the Seebeck effect has long been seen as a potentially revolutionary way of producing energy. Nowadays, efforts to improve the performance of thermoelectric materials are mostly motivated by the possibility of using them to convert waste heat into usable energy [1]. Unfortunately the efficiency of currently available thermoelectric materials is typically too low for any but a handful of real-life niche applications as recently reviewed by Champier [2]. They are ideal as compact and robust solid state generators for applications requiring very high reliability, such as space satellites and probes [3].
The thermodynamic efficiency of a thermoelectric is measured by its dimensionless figure of merit, , defined as
| (1) |
where is the Seebeck coefficient, is the electrical conductivity, is the absolute temperature and is the thermal conductivity due to both electrons and phonons. For any practical application it is typically considered that must be close to or larger than 1, with reports of considered as breakthroughs in the field.
One of the most studied and used materials for thermoelectric applications is lead telluride, PbTe. This small gap semiconductor possesses a remarkable figure of merit at intermediate temperatures even in its pristine form ( at 700 K)[4]. The high performance of PbTe is largely due to its low lattice thermal conductivity, with Wm-1K-1 at 300 K [4], which in turn stems from peculiarities in the phonon dispersion and scattering properties of the material. Inelastic neutron scattering experiments [5] as well as first principles calculations [6, 7, 8] have shown that the lattice dynamics of this material is characterized by a strong anharmonic coupling between the longitudinal acoustic (LA) and transverse optical (TO) branches. This coupling leads to an anomalously large dependence of the TO mode frequency on the volume [6] and, more importantly, to a strong damping and lowering of the LA branch [5, 7]. This, together with the relatively low group velocity of transverse acoustic (TA) modes [9], are two of the main reasons behind the characteristically low values of of PbTe.
Efforts to increase the intrinsic thermoelectric performance of PbTe-based materials have led to record-high values of the figure of merit. Strategies oriented towards tuning the electronic structure of the system have produced samples with values in excess of 2. Such strategies include populating the high-multiplicity hole pockets via Na-doping [10], introducing resonant defect levels by Tl-doping[11], or using a combination of alloying with SeTe and Na doping in order to align the and hole-pockets [12]. An alternative approach is to tackle the lattice contribution to the thermal conductivity. The preferred approach in this case has typically been the use of nanostructuring [13, 14, 15] as a means to scatter phonons over a wide range of length scales. Recently the possibility of driving the material closer to the ferroelectric phase transition by alloying with GeTe has been proposed as a method to enhance the LA-TO scattering rates [16, 17].
Despite the great attention devoted to PbTe, the role of intrinsic defects on its thermal transport properties has been scarcely investigated. Experimentally, this is partly due to the difficulty in controlling and estimating the concentrations of neutral and stoichiometric point defects which, according to calculations [18] and experiments [19], may actually be the most common in the pure material. First-principles simulation studies, on the other hand, have addressed the energetics [20, 21] and electronic properties [18, 21] of point defects, but their influence on the lattice dynamics as well as the role of other types of intrinsic defects such as grain boundaries are still difficult to tackle within this framework. The difficulty in minimizing the lattice contribution to the thermal conductivity lies in the very wide range of time and length scales of the processes involved. As such, one of the essential theoretical tools to investigate these materials is molecular dynamics (MD) simulation. Classical MD simulations have been used before to explore thermal transport in PbTe and the effect of different strategies aimed at reducing the lattice conductivity. In [22], an effective Coulomb potential fitted to reproduce experimental lattice parameters was employed to study the effect of alloying PbTe with the ferroelectric materials SnTe and GeTe, showing a remarkable decrease in lattice thermal conductivity. This result is in agreement with later density functional theory (DFT) calculations which showed that the decrease was the result of the softening of the TO modes of the material and the consequent enhanced scattering of acoustic phonons [16]. A Coulomb-Buckingham potential developed by Qiu et al., which was fitted to reproduce the Murnhagan equation of state of bulk PbTe obtained with DFT, shows a significant reduction of when relatively large concentrations of vacancies () are introduced in the system [23]. The same potential was also utilized to investigate the effect of twin boundaries on the thermal transport in PbTe [24]. In [25], a combination of classical and ab initio MD was used to determine the effect of the strong anharmonicity of vibrations in PbTe on the electronic structure of the material and therefore on its thermoelectric figure of merit. The anomalous lattice dynamics observed in neutron diffraction experiments [26] was also interpreted as the result of a very large anharmonicity in short-range interactions [7, 27]. This investigation was carried out using MD simulations with interatomic force constants (IFC) computed with DFT. The same methodology was used to investigate thermal conductivity in PbTe, PbSe and PbTe1-xSex [7, 28]. However, even ab initio methods have difficulties, arising from the non-trivial temperature dependence of the potential energy surface, to quantitatively predict the thermal properties of these materials from zero-temperature IFC, as pointed out by Romero et al.[29] using a more sophisticated method, consisting in the sampling of the temperature-dependent IFC through fully ab initio MD simulations.
Despite their important contributions to the understanding of lattice thermal conductivity in PbTe, all currently available classical potentials [22, 30, 25] tend to overestimate the lattice thermal conductivity of the bulk material (see section 2) and therefore lack quantitative predictive power. This overestimation has been attributed to the extra scattering provided by defects and grains boundaries in experimental samples [23]. However, the calculation of the contribution arising from these mechanisms for realistic defect concentrations has never been tackled and, therefore, remains at the level of speculation.
Available force fields have been fitted to reproduce the structure and some mechanical properties of the material. Instead, we develop a Coulomb-Buckingham potential that reproduces also features of the phonon dispersion of PbTe, hence improving the values of thermal conductivity. We then use this potential to study, via MD simulations, the influence of defects on the thermal conductivity of PbTe under realistic conditions. We consider vacancies, interstitial atoms and grain boundaries.
2 Molecular dynamics simulations of bulk lead telluride
Various classical interatomic potentials have been proposed for this material at intermediate temperatures [23, 25, 22]. They were all obtained by fitting structural properties and, when the size of the simulation box is converged, they all tend to overestimate the lattice thermal conductivity by . More sophisticated methods such as ab initio MD or dynamics based on ab initio interatomic force constants usually perform better, but at a much larger computational cost that prevents the simulation of materials with realistic defects.
Here we propose a new parametrization of a Coulomb-Buckingham potential fitted to reproduce a selection of phonon frequencies, structural, and mechanical properties of PbTe. This choice is dictated by our aim of improving on thermal transport properties over currently available models. The expression of the Coulomb-Buckingham potential is
| (2) |
where the parameters are the effective ionic charges, and control the hardness of the repulsive barrier and modifies the short-range attractive part. Note that this potential, best suited for ionic systems, is repulsive between equal chemical species, whereas the interaction is attractive between different atom types, as expected. This is largely thanks to the presence of the Coulomb term, in which the charges were included as fitting parameters in the model. The fitting procedure was performed using the Broyden-Fletcher-Goldfarb-Shanno (BFGS) method in the GULP code [31, 32].
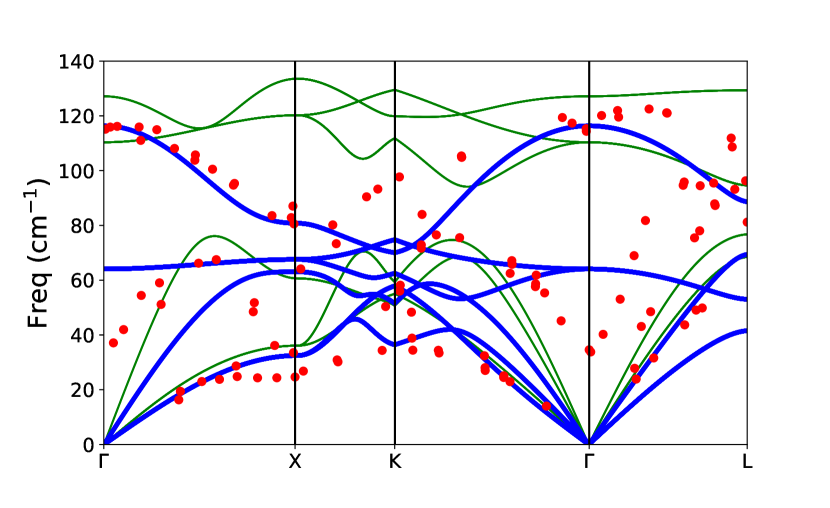
We used the optical phonon frequencies in order to capture the anomalous behavior of TO modes and to restrict the frequency range of the phonon dispersion. Since this type of potential does not account for the polarizability of the electronic cloud, the LO-TO splitting of materials with large dynamical charges, such as PbTe, is not expected to be accurately reproduced [33, 34]. Therefore we chose the frequencies at the X-point in the Brillouin zone (zone boundary) as a reference, instead of those at the -point. For relatively simple interatomic potentials, the choice of fitting phonon frequencies has the undesired effect of a loss of accuracy in the elastic properties, and vice versa [35]. Therefore, both phonon frequencies and elastic properties cannot be fitted simultaneously and a compromise needs to be made. While fitting to elastic properties is suitable if the force field is to be used solely for structural relaxation, the use of phonon frequencies is more suitable for the study of thermal properties due to their link to the acoustic modes and sound velocities. Structural and mechanical properties were taken from experiment, while the phonon frequencies were obtained from density functional perturbation calculations as implemented in the Quantum Espresso package [36] and experiment. DFT simulations were performed using PBEsol, a Ry cutoff for the basis of plane waves, a Monkhorst-Pack sampling of the Brillouin zone [37] and norm-conserving pseudpotentials. Spin-orbit coupling was switched on.
The parameters of the resulting potential are listed in table 1. The potential is benchmarked against a selection of fitted and non-fitted phonon frequencies and structural and mechanical properties in table 2. As expected, a good agreement was obtained for the fitted physical properties. More importantly, the restriction of the frequency range of the phonon dispersion at X leads to a remarkable improvement in the acoustic modes and the Debye temperature. Phonon dispersion relations were compared with Qiu’s [23] and experimental dispersions [9] and show a noticeable improvement (see figure 1).
-
(kcalmol-1) (Å) C (kcalÅmol-1) Pb-Pb 715 0.279 8.51 Pb-Te 86695 0.313 3.83 Te-Te 2966 9.25 36.3
-
Ref. values Potential Lattice constant, (Å) 4.569* 4.552 Bulk modulus (GPa) 39.8 17.5 Shear modulus (GPa) 21.4 10.5 Thermal expansion ( K-1) 20 41 Phonons at (cm-1) TO 32 64 LO 114 116 Phonons at X (cm-1) TA 24 30 LA 30 61 TO 69* 68 LO 81* 81 Elastic constants (GPa) 105 37 7.0* 7.6 13.2* 7.6 Debye temperature (K) 177 168 Sound velocities (km/s) 2.98 2.6 1.74 1.7 Vacancy formation energy (eV) Schottky dimer 1.21 1.40 Schottky pair 1.68 2.40
Lattice thermal conductivities of bulk PbTe were calculated using the Green-Kubo method applied to equilibrium MD simulations [41, 42], except for the simulations of single grain boundaries (see section 3.2). MD simulations were carried out using the LAMMPS code [43, 44] for a simulation box, using an integration time step of fs at 500 K, which was suitable to converge time correlation functions (different time steps were used in the simulations but maintaining the same correlation time of 100 ps). The structure was first simulated in the NVT ensemble for ps to ensure equilibration, and then the heat current was extracted from the following ns. Correlation time and simulation box size were increased for simulation cells including defects in order to ensure convergence. A typical heat current autocorrelation function is shown in figure S4 of the supplementary material, together with details of the MD simulations.
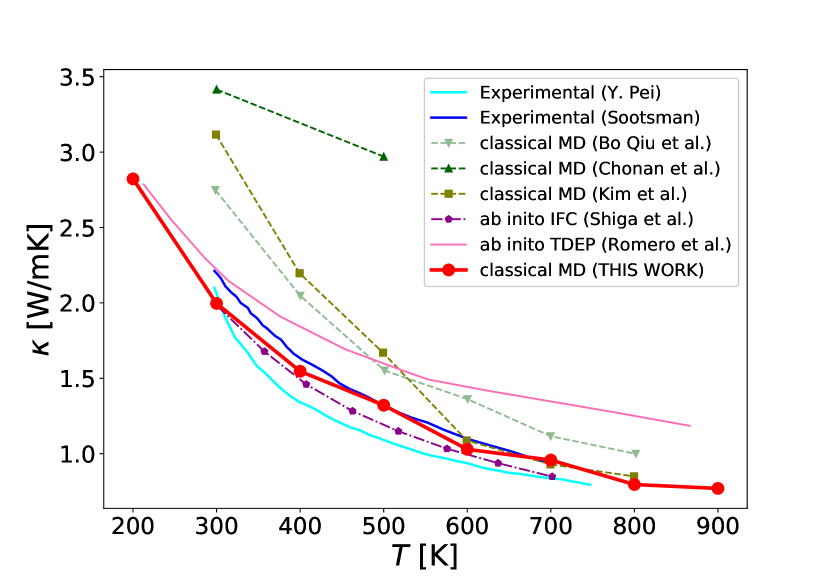
As shown in figure 2 we obtained thermal conductivities in excellent agreement with experiments for the temperature interval 300-800K, which is the range of interest for this material. Our parametrization clearly improves over the previously available classical potentials, producing a curve as good as the one obtained with more sophisticated methods, such as the MD based on ab initio IFC by Shiga et al. [7, 27]. It is important to remark that the two sets of experimental thermal conductivities reported in figure 2 (blue and cyan lines) [12, 45] agree within 10-20%. The values obtained using the present model (red line) fall comfortably within this range.
Another benchmark can be made against the Grüneisen parameter, . At high temperature it can be assumed than anharmonic phonon-phonon interactions dominate phonon scattering, and hence the lattice thermal conductivity can be expressed as [46, 47]
| (3) |
where is the average atomic mass, is the Debye temperature, is the number of atoms in the primitive cell and is equal to , where is the lattice constant of the fcc unit cell. When is expressed in atomic mass units, in Å and the thermal conductivity in W m, the constant [46] takes the value . Fitting the red curve in figure 2 with the expression (3) we obtain a Grüneisen parameter , close to the experimental value of 2 [48], thus confirming the good performance of this new potential in reproducing the lattice thermal properties of bulk PbTe over a wide range of temperatures. Further benchmarks that verify the suitability of the model, including the quality of the forces, comparison of energies between different strutures and dispersion relations for the Grüneisen parameters, are presented in Sec. IA and IB of the supplementary material.
3 Strategies to reduce the lattice thermal conductivity
Since the seminal works of Dresselhaus and coworkers [49, 50], nanostructuring has been the preferred strategy to enhance the scattering of phonons and hence decrease the lattice thermal conductivity, thus providing an effective strategy to improve the figure of merit of thermoelectric materials. Refinements of this approach, in which defects of different length scales are introduced in order to scatter phonons with a wide range of mean free paths, have led to record high values of up to 2 [14, 15]. Interestingly, this was achieved by controlling vacancy concentration and grain size. These two are defects that, under control or not, are always present in the sample. In the following sections we report on simulations carried out with the present model to determine the effect of defects on the lattice thermal conductivity. Notice that from here on we will focus exclusively on the lattice contribution to the thermal conductivity and therefore we will drop the subscript and denote it simply as , which should not to be confused with the total lattice thermal conductivity, including also the electronic contribution.
3.1 Point defects
Here we examine the effect of point defects on the thermal conductivity in bulk crystalline PbTe using MD simulations and the potential introduced in section 2. Intrinsic point defects in a crystal can be vacancies, interstitials or a combination of these (e.g. Frenkel defects). In PbTe, a relatively small deviation from stoichiometry would result in large concentrations of free charge carriers, something that would be detrimental for the thermoelectric efficiency, and is known to produce aggregates of the excess element in a nearly stoichiometric matrix [19]. Therefore stoichiometric defects are probably the most abundant in this material [19, 18], and we decided to focus our attention on these. According to this potential, the vacancy formation energies of Schottky defects are in good agreement with first-principles calculations and improve considerably the values obtained in [23]: and eV for Schottky dimers and pairs respectively (see table 2).
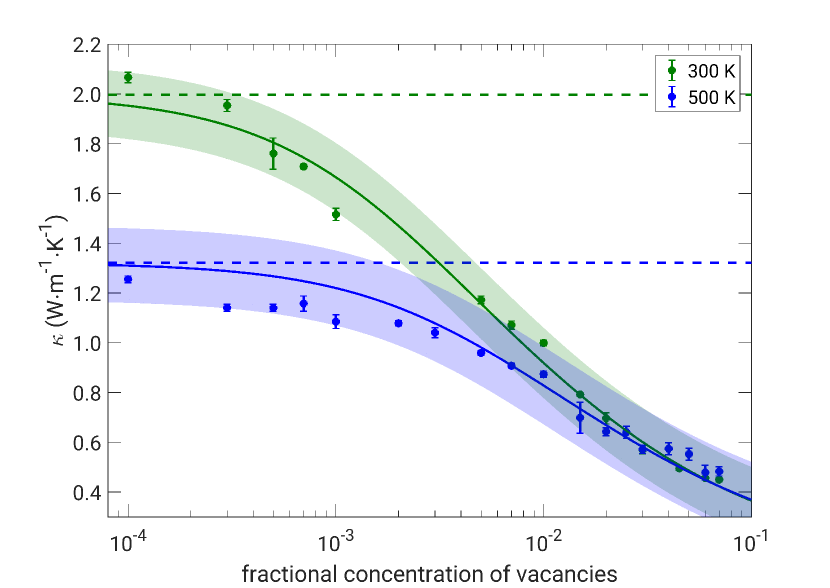
We first analyze the effect of vacancies by removing atoms from random positions while preserving the stoichiometry of the crystal. The dependence of the lattice conductivity with the concentration of these defects can be seen in figure 3. We observe that at relatively high temperatures (500 K) the conductivity remains approximately constant over a wide range of vacancy concentrations and it only starts decreasing for concentrations larger than . When this happens though, the decrease in conductivity is very pronounced, dropping by for a concentration of . Conversely, at lower temperatures such as room , we find that the effect of vacancies kicks in at much lower concentrations. These results can be compared with the predictions of the analytical model for a Debye solid [51]. According to the model described in [52] the conductivity of a crystal in presence of point defects should follow the law
| (4) |
where is the conductivity of the pristine crystal, is the Debye temperature, is the average volume per atom and is the average sound velocity. The effect of defect concentration enters in (4) through the disorder scaling parameter , which in presence of point defects may have two contributions, and , due to mass and strain disorder respectively [53]. For the case of vacancies, the mass disorder rescaling parameter takes the form [52]:
| (5) |
where the superscript sums over the two superlattices of Pb and Te atoms, is the atomic mass of species , is the concentration of vacancies in the corresponding sublattice, is the mean atomic mass of sublattice and is the atomic mass of the material averaged over all atomic sites. Similarly, the strain disorder parameter can be expressed as
| (6) |
with and where are the ionic radii. (6) contains an extra rescaling factor, , that is a measure of the anharmonicity of the bonds around the point defect [54]. Since for vacancies in the rock-salt structure all broken bonds are the same we assume a single value of for both sublattices.
Expressions (4)–(6) have been used to fit the data in figure 3 using only as a fitting parameter; the other parameters have been obtained using the classical potential presented here and are reported in table 2 and the supplementary material. The fitted curves in figure 3 (solid lines) show that the observed behavior is fully accounted for by the model and that the convergence of curves for different temperatures is the result of scattering by defects becoming the dominant mechanism for thermal resistivity at high defect concentration [51]. The values of that we obtain from the fittings, and for 300 K and 500 K respectively, are similar to values obtained experimentally for traditional semiconductor alloys [54], indicating that the presence of vacancies do not significantly contribute to the anharmonicity of the material.
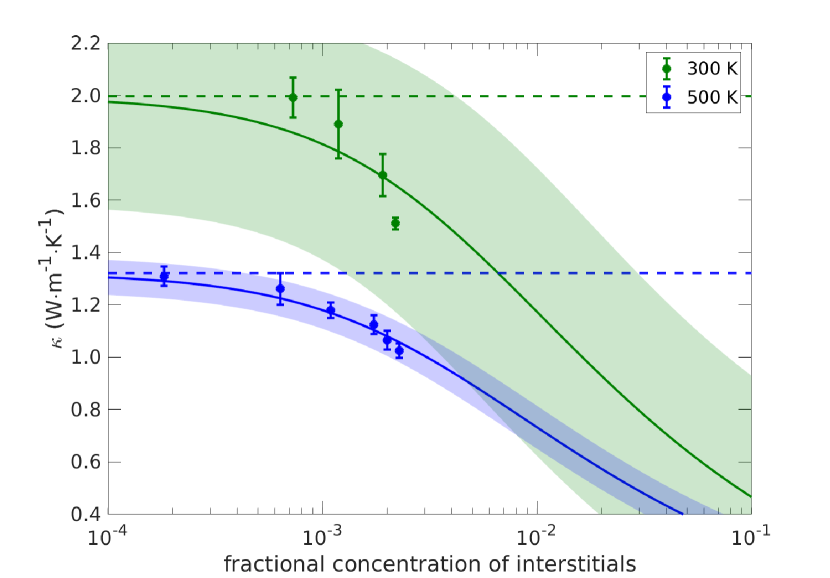
We also explored the effect of interstitial defects, shown in figure 4. In this case we also maintain the stoichiometry of the material, adding an equal number of Pb and Te atoms. For the same concentration of interstitial defects as in the case of vacancies, the model described by (4) predicts a similar decrease in thermal conductivity. This is expected since in both cases, for , we have . However, we find that in our MD simulations we cannot reach concentrations of interstitial defects large enough to see the dramatic drop in conductivity observed in the case of vacancies. In reality, large concentrations of interstitials are not expected anyway, since their formation energy is significantly larger than that of other kinds of defects [18].
We used again (4) to fit the thermal conductivity in presence of interstitials, in this case considering only the strain disorder. The fittings plotted in figure 4 as solid lines show that the model is also able to reproduce the trend in the lattice conductivity obtained from molecular dynamics simulations, although in this case the smaller number of data points results in a large uncertainty of the fitting parameter thus preventing any quantitative conclusion.
3.2 Grain boundaries
Another common type of defect always present in a real sample are grain boundaries. These planar defects act by scattering phonons of much longer mean free paths, thus complementing the effect of point defects at the shorter scales. In fact, controlling the size of the grains is one of the strategies exploited in the multiscale approach to decreasing the lattice thermal conductivity in PbTe and related materials [14, 15]. Despite reaching thermal conductivities with , nanostructuring also has its downfalls. Under operation, ageing leads to grain coarsening with the consequent decrease in conductivity [55]. It is therefore useful to determine the region of grain sizes for which the bulk thermal conductivity is recovered.
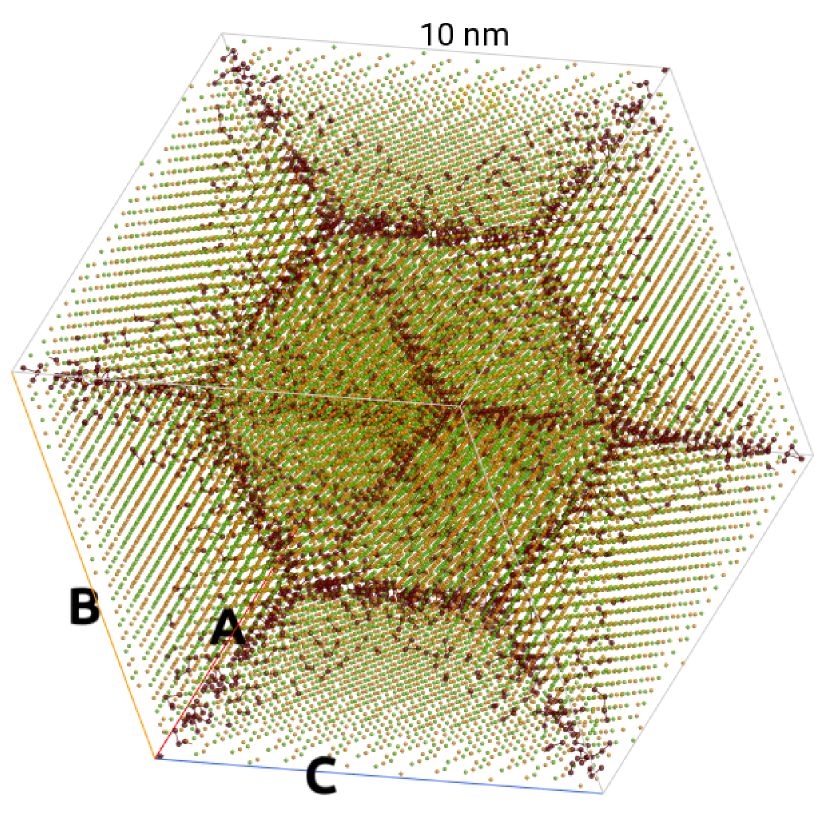
In this section, we report on simulations of polycrystalline PbTe carried out in order to assess the effectiveness of phonon scattering by grain boundaries. Polycrystalline simulation cells are generated by placing equally spaced grain seeds on the surface of the simulation box using the ATK-ForceField toolkit [56]. Then fcc lattices with the orientations of the seeds are grown towards the center of the box, leading to grains of homogeneous size and allowing for a compact packing of these grains. Total charge is conserved. An example of the resulting structure can be seen in figure 5. We have studied samples with a number of atoms ranging from 18 182 to 1 016 167, corresponding to grain sizes between 2.68 and 20.47 nm. For the largest samples we have considered , while for the smaller ones we used simulation cells with a number of grains between 4 and 32. We also conducted simulations with the same number of grains but different grain size, by varying the volume of the sample.
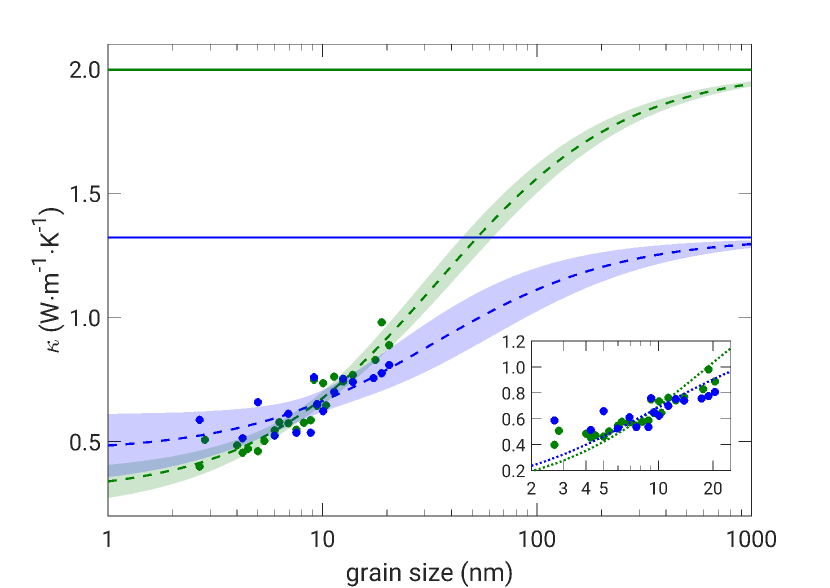
The conductivity of the polycrystalline simulation cells as a function of the grain size is displayed in figure 6 for room temperature and 500 K. The plot shows how the conductivity of the polycrystaline material is drastically reduced with respect to the bulk value in the range of grain sizes considered in our simulations (up to a million atoms).
These data have been fitted to a simple serial model [57], which considers the thermal transport across a series of grains of average size and internal bulk conductivity , separated by boundaries characterized by a Kapitza-type interface resistance ,
| (7) |
The reduction of the thermal conductivity in polycrystals can be attributed not only to the presence of grain boundaries which hinder the heat transport among grains, but also to the phonon confinement inside individual grains. All phonons with mean free paths greater than the dimensions of the grain will scatter at the boundary and will have a limited contribution to heat transport. The effect of this confinement can be accounted for by considering an effective mean free path of , where is the bulk effective mean free path and is a measure of the transparency of the boundary. Despite being sometimes referred to as transmission coefficient [58] it should be noted that values of this parameter are not necessarily bounded between 0 and 1, instead a perfectly transparent boundary is given by , while yields the completely opaque limit. The assumption is often used, corresponding to the case in which all phonons with mean free path larger than the grain size are truncated [59, 58]. Under this assumption of phonon confinement one obtains the following expression for the effective conductivity of the polycrystaline material [58],
| (8) |
It is important to note that both (7) and (8) are formally equivalent and capture in practice the same effects, simply giving a different interpretation to the same phenomenon. The relation between the fundamental parameters of each model can be obtained as
| (9) |
Here we extend the expression in (7) to incorporate the finite width of the grain boundary, , which had been neglected in previous works, in order to recover the correct limit as the size of the grains tend to zero:
| (10) |
It is worth noting that since we are sampling precisely the range of sizes in which boundaries become the dominant scattering mechanism, including the finite size of the interfaces proved necessary to obtain a reasonable fit. By neglecting this contribution one misses the plateauing of the conductivity at very small sizes, as shown in the inset of figure 6.
From the fits shown in figure 6 we obtain values of m2K/W and m2K/W for the interface resistance at 300 K and 500 K, respectively. Despite the large uncertainty of these values, the fit suggests that the interface resistance does not depend very strongly on temperature, a result that is supported by the simulations of single grain boundaries described below. Using (9), the values of obtained from the fittings in figure 6 and the values of nm and 5.10 nm for 300 K and 500 K, respectively, obtained from bulk calculations using the direct method [60] (see below), we obtain values of and 0.16 for 300 K and 500 K, respectively. These values are notably lower than those obtained for nanocrystaline silicon [58], and deviates very significantly from the common assumption of .
Due to the relatively large spread of points in figure 6 the error for the effective width of the boundaries is quite large, with values of nm and nm for 300 K and 500 K respectively. From the fits to the model one can extrapolate that the conductivity of the polycrystalline material starts drifting away from the bulk value for grains with m at 300 K and nm at 500 K. On the other end, for small grain sizes, with nm, our simulations suggest that the conductivity saturates at a value of W m-1 K-1, independently of temperature.
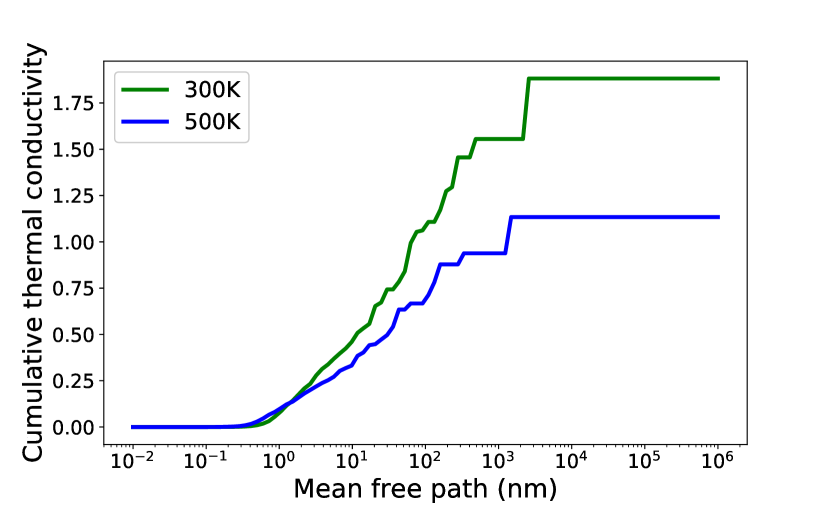
The validity of phonon confinement interpretation can be tested by comparing our results on the polycrystal with the contribution of phonons to thermal conductivity as a function of their mean free path. This has been calculated solving the Boltzmann transport equation using the ShengBTE code [61] with a supercell and a grid. The method predicts a bulk thermal conductivity of W/m K at 300 K and W/m K at 500 K, which are 6% and 14% smaller than the value predicted with the Green-Kubo method but within the margin of error usually found in the comparison between both methods. The accumulated thermal conductivity with respect to phonon mean free path in PbTe bulk at 300 and 500 K is presented in figure 7. It is observed that not more than 25% of the thermal conductivity of PbTe is contributed by phonon modes with MFP less than 10 nm at 300K, consistently with the results shown in figure 6, in which is seen to approach the saturation value of 0.5 W/m K for decreasing size.
In order to gain additional insight into the thermal transport properties of the grain boundary we also performed simulations of a single interface between two grains. In this case we used the direct method [60] to calculate the lattice thermal conductivity along the direction perpendicular to the boundary between two fcc regions. In the direct method, the thermal conductivity is computed by determining the steady-state temperature gradient at a fixed external heat current between a heat source and heat sink of finite width, defined within the simulation cell. Using an MD time step of fs, the system was first equilibrated in the NVT ensemble for 200 ps and then under NVE conditions for ps. At this point the heat source and sink were switched on and the MD simulation continued in the NVE ensemble for ns, depending on the cell size, until reaching a stable temperature profile. A typical temperature profile in the presence of a grain boundary is shown in figure S5 of the supplementary material. The process was repeated for different box lengths ranging up to nm.
The scattering processes at the heat source and sink are expected to contribute very significantly to the thermal conductivity. This effect could be ignored if the simulation cell is longer that the phonon mean free path, but this is often not the case. Fortunately, the fact that the finite-size simulation cell acts independently from other scattering mechanisms allows us to consider the dependency of the conductivity on the cell length, , according to [60]:
| (11) |
where is the lattice thermal conductivity in bulk and is the mean free path in bulk. Performing simulations for various cell lengths and using (11) allows us to estimate the bulk conductivity and mean free path, with values W m-1 K-1 and nm at K and W m-1 K-1 and nm at K. In the presence of a grain boundary, a temperature jump at the interface is present and this formula needs to be modified as
| (12) |
Using the values of and calculated in the bulk simulation with the direct method, the magnitude of the interface thermal resistance can be extracted from calculations at various lengths of the simulation cell. The finite-size scaling is shown in figure S6 of the supplementary material. In addition to (12), the interface thermal resistance can be computed from the temperature drop at the boundary, as [62]
| (13) |
where is the constant heat flux imposed between the heat source and sink. We have confirmed that both methods yield the same value of (within error bars).
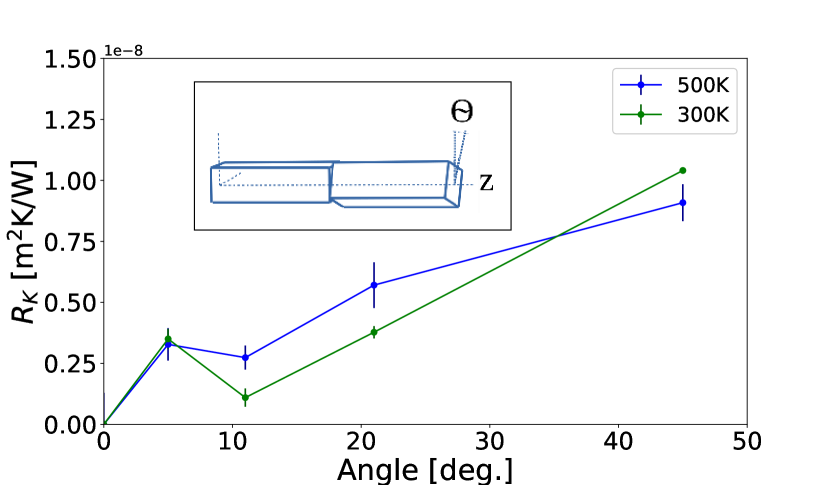
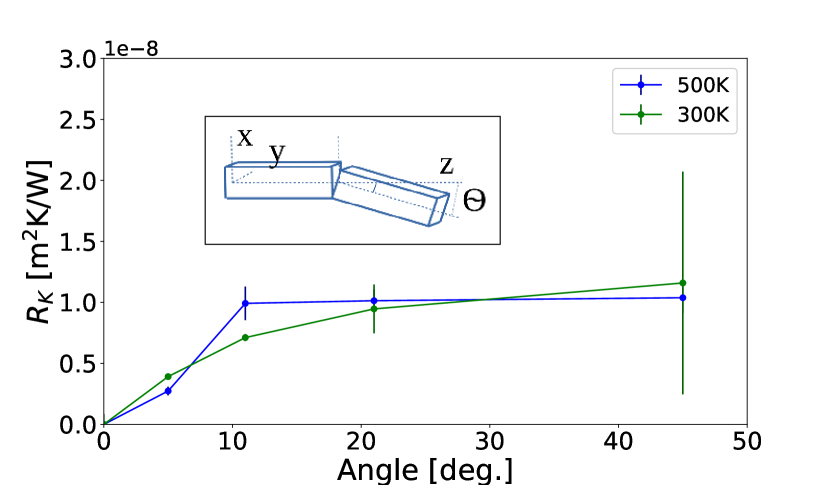
We have performed calculations to obtain the grain boundary resistance as a function of the tilting between the two bulk regions. One of the regions is terminated on a [100] surface, which according to density functional theory calculations is the most stable surface in PbTe [63]. The crystal structure in the other grain is rotated with respect to the reference one around an axis either perpendicular to the interface (Figure 8) or parallel to it (Figure 9). The interface between the two regions is allowed to equilibrate before the non-equilibrium simulation is performed.
In figure 8 and 9 we plot the values of the thermal resistance of the boundary as a function of the angle for the two types of relative orientations. We observe that for a rotation around an axis perpendicular to the interface, grows almost linearly with the angle to a maximum value of m2K/W at . Instead, in the case of a tilting around an axis contained in the boundary plane, the interface resistance grows much more rapidly with the mismatch angle, and reaches the maximum value of, again, m2K/W for angles . In both cases we see a negligible difference between results at 300 and 500 K, in line with the results of the polycrystalline simulation. Moreover, a significant decrease in the resistance is observed in presence of small angles, what explains the rise of the thermal conductivity in bulk volume and the lower values in presence of boundaries (Figure 6). Despite the fact that these grain boundaries are not necessarily the same as those in the polycrystalline samples, and that the method for determining the thermal resistance is different, the values obtained for in these two situations are quite close.
4 Discussion
The concentration of intrinsic point defects can be estimated from electrical transport methods [19] and optical measurements [64]. Reported values in experimental samples typically range from to . It should be noted that is also roughly the limit of a deviation from stoichiometry that can be reached before precipitates of the excess element begin to form [65, 19, 20]. In view of our results in section 3.1, this suggests several observations. On the one hand, control over growth conditions should permit accessing the onset of the drop of conductivity playing with intrinsic defects alone. However, the benefits of this are limited to samples quenched at relatively low temperature applications, since at high temperatures this kind of defects would attain much lower equilibrium concentrations [20, 18]. On the other hand, dopants can be introduced in concentrations of up to few percent without disrupting the structure of PbTe [14, 10], and the reduction in lattice thermal conductivity obtained in figure 3 agrees well with the results reported for extrinsic dopants [14, 10, 15].
Our simulations of polycrystalline PbTe show that extremely low conductivity values can be reached for grain sizes in the range of the nanometers. Experimentally though, these grain sizes are very difficult to reach. In fact, it has been determined that down to a fraction of a micrometer the lattice thermal conductivity remains unaffected by grain size [66, 67], and that the effect of grain size starts to become noticeable for sizes of a few tens of nanometers [68, 69]. In macroscopic samples, smaller grains may not be able to survive the working temperatures of a thermoelectric material. However the regime we explore in section 3.2 can be accessed in polycrystalline thin films. Indeed, for Bi2Te3 thin films with grains down to 1 nm in size a drop in conductivity of about 80% has been measured [70].
Importantly, for future applications of the force field proposed here and for the development of future parameterizations, our results show that the intrinsic bulk conductivity of PbTe is accessible in experiments, despite de innevitable presence of intrinsic defects. The role of defects has been invoked sometimes to explain the disagreement between MD simulations and experimental results, but we have demonstrated here that the most common defects only play a role in extreme regimes and that most experimental reports of the bulk PbTe lattice conductivity do really probe the intrinsic bulk value.
5 Conclusions
We have calculated the lattice thermal conductivity of PbTe containing the most common types of intrinsic defects. For this we have presented a new parametrization of a Coulomb-Buckingham potential that reproduces very accurately the evolution of the lattice thermal conductivity over a wide range of temperatures. Using this potential we found that both the presence of vacancies and grain boundaries can separately reduce the value of the thermal conductivity to W/mK. In the regimes of high density of point or planar defects the conductivity becomes practically independent of temperature, as predicted by phenomenological models. Extrinsic defects, such as dopants or precipitates are know to have a similar effect, but they may interfere with the electronic properties of the system. Although this interference can sometimes be used to our advantage, the results of this work provide complementary strategies to optimize the performance of thermoelectric devices. Further improvements can be achieved by introducing extrinsic defects that drive the material close to a ferroelectric phase transition, e.g. by alloying with Ge, but this is outside the scope of the present study, which focuses on PbTe, rather than its alloys[16]. Finally, our study demonstrates that experimental values of the conductivity available in the literature do correspond to the bulk value, since the effect of imperfections only becomes noticeable at relatively high concentrations of point defects and grain boundaries. This highlights the importance of having a classical potential capable of reproducing accurately the conductivity of the bulk material, something that has to be taken into consideration when developing new parameterizations.
References
References
- [1] Schierning G 2018 Nature Energy 3 92–93 ISSN 20587546 URL http://dx.doi.org/10.1038/s41560-018-0093-4
- [2] Champier D 2017 Energy Conversion and Management 140 167–181 ISSN 01968904 URL http://dx.doi.org/10.1016/j.enconman.2017.02.070
- [3] Schmidt G R, Sutliff T J and Dudzinski L A 2009 60th International Astronautical Congress 2009, IAC 2009 8 6612–6633 ISSN AIAA 2008-5640 URL http://www.scopus.com/inward/record.url?eid=2-s2.0-77953523923{&}partnerID=tZOtx3y1
- [4] Snyder G J and Toberer E S 2008 Nature materials 7 105–114
- [5] Delaire O, Ma J, Marty K, May a F, McGuire M a, Du M H, Singh D J, Podlesnyak A, Ehlers G, Lumsden M D and Sales B C 2011 Nature Materials 10 614–619 ISSN 1476-1122 URL http://dx.doi.org/10.1038/nmat3035http://www.ncbi.nlm.nih.gov/pubmed/21642983{%}5Cnhttp://www.nature.com/doifinder/10.1038/nmat3035
- [6] An J, Subedi A and Singh D J 2008 Solid State Communications 148 417–419 ISSN 00381098 (Preprint 0806.2727) URL http://dx.doi.org/10.1016/j.ssc.2008.09.027
- [7] Shiga T, Shiomi J, Ma J, Delaire O, Radzynski T, Lusakowski A, Esfarjani K and Chen G 2012 Phys. Rev. B 85 155203 ISSN 10980121
- [8] Ju S, Shiga T, Feng L and Shiomi J 2018 Physical Review B 97 184305 ISSN 24699969
- [9] Cochran W, FRS, Cowley R A, Dolling G and Elcombe M M 1966 Proc. R. Soc. Lond. A 293 433 ISSN 1364-5021
- [10] Pei Y, LaLonde A, Iwanaga S and Snyder G J 2011 Energy & Environmental Science 4 2085 ISSN 1754-5692 URL http://xlink.rsc.org/?DOI=c0ee00456a
- [11] Heremans J P, Jovovic V, Toberer E S, Saramat A, Kurosaki K, Charoenphakdee A, Yamanaka S and Snyder G J 2008 Science 321 554–557 ISSN 0036-8075 URL http://www.sciencemag.org/content/321/5888/554.abstract{%}5Cnhttp://www.sciencemag.org/cgi/doi/10.1126/science.1159725
- [12] Pei Y, Shi X, LaLonde A, Wang H, Chen L and Snyder G J 2011 Nature 473 66–69 ISSN 0028-0836 URL http://www.nature.com/doifinder/10.1038/nature09996
- [13] Pei Y, Lensch-Falk J, Toberer E S, Medlin D L and Snyder G J 2011 Advanced Functional Materials 21 241–249 ISSN 1616301X
- [14] Biswas K, He J, Blum I D, Wu C I, Hogan T P, Seidman D N, Dravid V P and Kanatzidis M G 2012 Nature 489 414–8 ISSN 1476-4687 URL http://www.ncbi.nlm.nih.gov/pubmed/22996556
- [15] Zhao L D, Dravid V P and Kanatzidis M G 2014 Energy Environ. Sci. 7 251–268 ISSN 1754-5692 URL http://xlink.rsc.org/?DOI=C3EE43099E
- [16] Murphy R M, Murray E D, Fahy S and Savic I 2016 Physical Review B 93 104304 ISSN 1550235X
- [17] Murphy R M, Murray É D, Fahy S and Savić I 2017 Physical Review B 95 144302 ISSN 2469-9950 URL http://link.aps.org/doi/10.1103/PhysRevB.95.144302
- [18] Li W F, Fang C M, Dijkstra M and Van Huis M A 2015 Journal of Physics Condensed Matter 27 355801 ISSN 1361648X
- [19] Schenk M, Berger H, Klimakow A, Mühlberg M and Wienecke M 1988 Crystal Research and Technology 23 77–84 ISSN 15214079
- [20] Bajaj S, Pomrehn G S, Doak J W, Gierlotka W, Wu H J, Chen S W, Wolverton C, Goddard W A and Jeffrey Snyder G 2015 Acta Materialia 92 72–80 ISSN 13596454 URL http://dx.doi.org/10.1016/j.actamat.2015.03.034
- [21] Goyal A, Gorai P, Toberer E S and Stevanović V 2017 npj Computational Materials 3 42 ISSN 20573960
- [22] Chonan T and Katayama S 2006 Journal of the Physical Society of Japan 75 064601 ISSN 0031-9015 URL http://journals.jps.jp/doi/abs/10.1143/JPSJ.75.064601
- [23] Qiu B, Bao H, Zhang G, Wu Y and Ruan X 2012 Computational Materials Science 53 278–285 ISSN 09270256 URL http://dx.doi.org/10.1016/j.commatsci.2011.08.016
- [24] Zhou Y, Yang J J y, Chen L, Hu M, Cheng L and Hu M 2018 Phys. Rev. B 97 085304
- [25] Kim H and Kaviany M 2012 Physical Review B 86 045213 ISSN 10980121
- [26] Božin E S, Malliakas C D, Souvatzis P, Proffen T, Spaldin N a, Kanatzidis M G and Billinge S J L 2010 Science 330 1660–3 ISSN 1095-9203 URL http://www.ncbi.nlm.nih.gov/pubmed/21164012http://www.ncbi.nlm.nih.gov/pubmed/21164012{%}5Cnhttp://www.sciencemag.org/content/330/6011/1660
- [27] Shiga T, Murakami T, Hori T, Delaire O and Shiomi J 2014 Applied Physics Express 7
- [28] Tian Z, Garg J, Esfarjani K, Shiga T, Shiomi J and Chen G 2012 Physical Review B 85 184303
- [29] Romero A H, Gross E K U, Verstraete M J and Hellman O 2015 Physical Review B 91 214310
- [30] Qiu B, Bao H and Ruan X 2008 Multiscale Simulations of Thermoelectric Properties of PbTe ASME2008 3rd Energy Nanotechnology International Conference pp 45–60 URL http://proceedings.asmedigitalcollection.asme.org/proceeding.aspx?articleid=1626940
- [31] Gale J D 1997 JCS Faraday Trans. 93 629
- [32] Gale J D and Rohl A L 2003 Mol. Simul. 29 291
- [33] Zhang Y, Ke X, Kent P, Yang J and Chen C 2011 Physical Review Letters 107 175503 ISSN 0031-9007 URL http://link.aps.org/doi/10.1103/PhysRevLett.107.175503
- [34] Gonze X and Lee C 1997 Phy. Rev. B 55 10355
- [35] Powell D, Migliorato M A and Cullis A G 2006 Physica E: Low-Dimensional Systems and Nanostructures 32 270–272 ISSN 13869477
- [36] Giannozzi P, Baroni S, Bonini N, Calandra M, Car R, Cavazzoni C, Ceresoli D, Chiarotti G L, Cococcioni M, Dabo I, Dal Corso A, de Gironcoli S, Fabris S, Fratesi G, Gebauer R, Gerstmann U, Gougoussis C, Kokalj A, Lazzeri M, Martin-Samos L, Marzari N, Mauri F, Mazzarello R, Paolini S, Pasquarello A, Paulatto L, Sbraccia C, Scandolo S, Sclauzero G, Seitsonen A P, Smogunov A, Umari P and Wentzcovitch R M 2009 J. Phys.: Condens. Matter 21 395502 URL http://www.ncbi.nlm.nih.gov/pubmed/21832390
- [37] Monkhorst H and Pack J 1976 Physical Review B 13 5188–5192 URL http://www.if.pwr.wroc.pl/{~}scharoch/Abinitio/MonkhorstPack.pdf
- [38] and editors of the volumes III/17E-17F-41C C A Lead telluride (PbTe) crystal structure, lattice parameters, thermal expansion Non-Tetrahedrally Bonded Elements and Binary Compounds I vol 41C ed Madelung O, Rössler U and Schulz M (Berlin, Heidelberg: Springer Berlin Heidelberg) ISBN 978-3-540-31360-1 URL https://doi.org/10.1007/10681727{_}711
- [39] Miller A J, Saunders G A and Yogurtçu Y K 1981 J. Phys. C: Solid State Phys 14 1569
- [40] Wun-Fan Li Chang-Ming Fang M D and van Huis Soft M A 2015 J. Phys. Condens. Matter 27 355801
- [41] Zwanzig R 1964 Annu. Rev. Phys. Chem. 16 67–102 ISSN 0066-426X
- [42] Che J, Çağın T, Deng W and Goddard W A 2000 The Journal of Chemical Physics 113 6888–6900 ISSN 0021-9606 URL http://aip.scitation.org/doi/10.1063/1.1310223
- [43] Plimpton S 1995 J. Comp. Phys. 117 1
- [44] http://lammps.sandia.gov
- [45] Sootsman J R, He J, Dravid V P, Li C P, Uher C and Kanatzidis M G 2009 Journal of Applied Physics 105 083718 ISSN 00218979
- [46] Slack G A 1979 Solid State Physics 34 1–71
- [47] Morelli D T and Heremans J P 2002 Applied Physics Letters 81 5126–5128 ISSN 00036951
- [48] Zhang Y, Ke X, Chen C, Yang J and Kent P R C 2009 Physical Review B 80 024304
- [49] Hicks L D and Dresselhaus M S 1993 Phys. Rev. B 47 727–731
- [50] Dresselhaus M S, Chen G, Tang M, Yang R, Lee H, Wang D, Ren Z, Fleurial J p and Gogna P 2007 Advanced Materials 19 1043–1053
- [51] Klemens P 1960 Physical Review 119 507–509 ISSN 0031-899X URL http://link.aps.org/doi/10.1103/PhysRev.119.507
- [52] Yang J, Meisner G P and Chen L 2004 Applied Physics Letters 85 1140–1142 ISSN 0003-6951
- [53] Klemens P G 1955 Proceedings of the Physical Society. Section A 68 1113–1128 ISSN 03701298
- [54] Abeles B 1963 Physical Review 131 1906–1911 ISSN 0031899X
- [55] Grossfeld T, Sheskin A, Gelbstein Y and Amouyal Y 2017 Crystals 7 281 ISSN 2073-4352 URL http://www.mdpi.com/2073-4352/7/9/281
- [56] Schneider J, Hamaekers J, Chill S T, Smidstrup S, Bulin J, Thesen R, Blom A and Stokbro K 2017 Modelling Simul. Mater. Sci. Eng. 25 085007
- [57] Nan C W and Birringer R 1998 Physical Review B 57 8264–8268 ISSN 1550235X
- [58] Wang Z, Alaniz J E, Jang W, Garay J E and Dames C 2011 Nano Letters 11 2206–2213 ISSN 15306984
- [59] Parrott J E 1969 Journal of Physics C: Solid State Physics 2 147–151 ISSN 00223719
- [60] Schelling P K, Phillpot S R and Keblinski P 2002 Physical Review B 65 144306 ISSN 1550235X
- [61] Li W, Carrete J, Katcho N A and Mingo N 2014 Comp. Phys. Commun. 185 1747–1758
- [62] Crocombette J P and Gelebart L 2009 Journal of Applied Physics 106 083520 ISSN 0021-8979 URL http://aip.scitation.org/doi/10.1063/1.3240344
- [63] Deringer V L and Dronskowski R 2013 Journal of Physical Chemistry C 117 24455–24461 ISSN 19327447
- [64] Zhang B, Cai C, Jin S, Ye Z, Wu H and Qi Z 2014 Applied Physics Letters 105 022109 ISSN 00036951
- [65] Brebrick R F and Allgaier R S 1960 The Journal of Chemical Physics 32 1826–1831 ISSN 00219606
- [66] Yoneda S, Ohta E, Kaibe H T, Oshugi I J, Shiota I and Nishida I A 2001 Materials Transactions 42 329–335
- [67] Kishimoto K and Koyanagi T 2002 Journal of Applied Physics 92 2544–2549 ISSN 00218979
- [68] Kuo C H, Chien H S, Hwang C S, Chou Y W, Jeng M S and Yoshimura M 2011 Materials Transactions 52 795–801 ISSN 1345-9678 URL https://www.jstage.jst.go.jp/article/matertrans/52/4/52{_}M2010331/{_}article
- [69] Yoon S, Kwon O J, Ahn S, Kim J Y, Koo H, Bae S H, Cho J Y, Kim J S and Park C 2013 Journal of Electronic Materials 42 3390–3396 ISSN 0361-5235 URL http://link.springer.com/10.1007/s11664-013-2753-2
- [70] Takashiri M, Miyazaki K, Tanaka S, Kurosaki J, Nagai D and Tsukamoto H 2008 Journal of Applied Physics 104 084302 ISSN 00218979