Spectral observations of X Persei: Connection between and X-ray emission
We present spectroscopic observations of the Be/X-ray binary X Per obtained during the period 1999 - 2018. Using new and published data, we found that during ”disc-rise” the expansion velocity of the circumstellar disc is 0.4 - 0.7 km s-1. Our results suggest that the disc radius in recent decades show evidence of resonant truncation of the disc by resonances 10:1, 3:1, and 2:1, while the maximum disc size is larger than the Roche lobe of the primary and smaller than the closest approach of the neutron star. We find correlation between equivalent width of emission line () and the X-ray flux, which is visible when Å. The correlation is probably due to wind Roche lobe overflow.
Key Words.:
Stars: emission-line, Be – stars: winds, outflows – X-rays: binaries – Accretion, accretion discs – stars: individual: X Per1 Introduction
X Persei (HD 24534) is a relatively bright variable star, detected in X-rays with satellite and identified as the optical counterpart of the pulsating X-ray source 4U 0352+309 (Braes & Miley, 1972; van den Bergh, 1972). This object belongs to the class of Be/X-ray binaries which contains about 100 confirmed and suspected members in our Galaxy, see e.g. Apparao (1994) and Reig (2011). The main component of X Per is a hot massive rapidly rotating Be star. The secondary is a slowly spinning neutron star ( s) accreting matter from the wind of the primary component (Maitra et al., 2017). On the basis of data from Rossi X-Ray Timing Explorer, Delgado-Martí et al. (2001) determined the orbital period 250 d, orbital eccentricity = 0.11, and semi-major axis = 2.2 a.u. X Per is considered prototype of the class of Be/X-ray binaries with long orbital periods and near-circular orbits (Pfahl et al., 2002), also named ”low-e BeX” (Negueruela, 2004). The low orbital eccentricity may be explained by a supernova explosion at which the neutron star did not receive a large impulse, or “kick,” at the time of formation, and all induced eccentricity is due to mass loss. Knigge et al. (2011) suggested that it may be related to the type of the supernovae explosion which produced the neutron star, i.e. core-collapse or electron-capture supernova.
X Per is a low-luminosity persistent X-ray source and periodic X-ray outbursts are not obvious in its X-ray light curve. La Palombara & Mereghetti (2007) and Lutovinov et al. (2012) detected X-ray flares and variability in the X-ray light curve. Maitra et al. (2017) detected variability of the pulse profile and energy spectrum and suggested that it is a result of changes in the accretion geometry. X Per has an unusually hard X-ray spectrum (Worrall et al., 1981). It is confidently detected by INTEGRAL up to more than 100 keV, which can be explained as a result of the dynamical Comptonization in the accretion flow of photons emerging from the polar cap (Doroshenko et al., 2012).
In the last century, the visual magnitude of X Per varies in the range V= 6.8 to 6.2 mag. The brightness variations are accompanied by variations in the intensity of the emission lines. The optical spectrum of X Per shows strong emission in the Balmer lines, when it is brighter than 6.5 mag (Dorren et al., 1979; Telting et al., 1998). The brightness variability is probably connected with various disc-rise and disc-fade events. During the last 50 years, the star exhibited two low states - probably disc-less episodes during 1974-1977 and 1990-1991. Absence of emission lines in 1977 was noted by de Loore et al. (1979). Roche et al. (1993) identified that the low state was during 1974-1977. Dramatic changes were observed in 1990, when X Per lost the emission line, infrared excess, and circumstellar disc (Norton et al., 1991). The emission lines disappeared and the optical spectrum was dominated by absorption lines, which is typical for normal early-type star.
We present optical spectroscopic observations obtained in recent decades and discuss the radius of the circumstellar disc, outflowing velocity in the disc, disc truncation, and connection with X-ray emission.


2 Observations
The optical spectra of X Per were secured with the 2.0 m telescope of the Rozhen National Astronomical Observatory, Bulgaria and with the robotic 1.2 m TIGRE telescope located is the astronomical observatory La Luz in Mexico. The Rozhen spectra were obtained with the Coude spectrograph and with the Echelle spectrograph ESpeRo (Bonev et al., 2017). The Coude spectra have dispersion 0.1 Å px-1 or 0.2 Å px-1, while the Echelle spectra have 0.06 Å px-1 at 6560 Å and 0.04 Å px-1 at 4800 Å. The TIGRE spectra were obtained with the HEROS spectrograph, which provides a spectral resolution of 20000 over the visual spectral range from 3800 Å to 8800 Å (Schmitt et al., 2014). A few more spectra were downloaded from the ELODIE archive (Moultaka et al., 2004). These were obtained with the 1.93 m telescope of Observatoire de Haute-Provence.
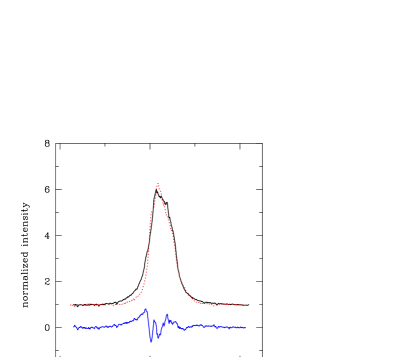
The measured parameters are given in Table 1. The variability of emission line of X Per is presented in Fig.1 (emission line profile), Fig.2 (distance between the peaks), Fig.3 (comparison between two high resolution profiles), Fig.4 (histogram of the disc size), and Fig.5 (long term behaviour). During the period 1992 - 2018, the equivalent of emission line () varies from 2 Å up to 40 Å. From Fig.1, it is visible that the emission line, which exhibits various profile shapes, in some cases is symmetric with two peaks that are well separated, single-peak, double-peak and asymmetric profiles indicating density inhomogeneities.
3 Primary component
3.1 Radius and mass of the primary
From IR observations, Taranova & Shenavrin (2017) obtained temperature K and radius R⊙ for the donor star, adopting distance to the system = 1300 pc. GAIA Data Release 2 (Gaia Collaboration et al., 2016, 2018) gives parallax 1.234 mas, which corresponds to a distance 810 pc. With the GAIA distance the results of Taranova & Shenavrin (2017) should give R⊙.
The B-V and U-B colours of X Per in low state should represent the colours of the primary component. During the period JD 2448545 (1991 October 15) - JD 2449046 (1993 February 27), the brightness of X Per was low , and the circumstellar disc was very small. At that time the average colours were and (Zamanov & Zamanova, 1995). Adopting interstellar extinction towards X Per (Viotti et al., 1982; Nikolov et al., 2017), we calculate dereddened colours and . Following Schmidt-Kaler (1982), these colours correspond to B1 III - V spectral type, which is about one spectral type later than B0 derived by Roche et al. (1997) and Lyubimkov et al. (1997), and O9.5III by Fabregat et al. (1992).
Using the well-known formula for the absolute V magnitude, we obtain . The bolometric magnitude is , where the bolometric correction is (Schmidt-Kaler, 1982; Nieva, 2013). Using the solar values K and , we calculate R⊙, which is similar to the above value from Taranova & Shenavrin (2017).
Hohle et al. (2010) give average masses for B0V and B1V stars 15.0 M⊙ and 12.0 M⊙, respectively. Hereafter for the primary of X Per, we adopt radius 9.2 R⊙ R⊙ ( R⊙) and mass 12.0 M⊙ M⊙ ( M⊙).
3.2 Rotation of the primary
Dachs et al. (1986) and Hanuschik (1989) established a relation between , full width at half maximum (FWHM), and of the emission line. To calculate , we use this relation in the form
| (1) |
where FWHM and are measured in km s-1, Wα is in [Å]. We measure FWHM and Wα on our spectra and obtain projected rotational velocity in the range km s-1with average km s-1. This value is close to that of Lyubimkov et al. (1997), who estimated projected rotational velocity = 215 10 km s-1 using HeI Å absorption line.

4 Be disc
In Fig. 2, we plot versus . The black open circles are data for Be stars taken from Andrillat (1983), Hanuschik (1986), Hanuschik et al. (1988), Dachs et al. (1992), Slettebak et al. (1992), and Catanzaro (2013). The blue plus signs are our measurements of X Per. Most of the data points of X Per are in the middle of the Be star populations. The exceptions are two points obtained on 19920903 and 19920905, when the disc was small. Because these points are above the population of other Be stars, following Sect. 5.2 of Hanuschik et al. (1988), this probably indicates that the disc of X Per was denser during the early stages of its development. Later, when the disc is larger, it follows the average behaviour of other Be stars. For X Per we have 15 spectra on which both and emission lines have two peaks (see Table 1). We calculate median value and average value .
The Balmer emission lines form primarily in the disc surrounding the Be star, and the total flux of the feature (measured as the line equivalent width) is closely related to the size of the disc. The discs of the Be stars are Keplerian supported by the rotation (e.g. Porter & Rivinius (2003) and references therein). For a Keplerian circumstellar disc the peak separation can be regarded as a measure of the outer radius () of the emitting disc,
| (2) |
where is the radius of the primary, is its projected rotational velocity. When the two peaks are visible in the emission lines, we can estimate the disc radius using Eq. 2. The disc size is also connected with ,
| (3) |
where is a dimensionless parameter, for which we adopt (see Zamanov et al. (2016), Sect. 4.3). This equation expresses the fact that grows as becomes larger (e.g. Grundstrom & Gies, 2006). A slightly different expression for the relation between and is used in Coe et al. (2006) and Monageng et al. (2017).
4.1 Radial outflow velocity
During the period JD 2448869 to JD 2450029 a steady increase of the H emission is visible (Fig.5). The equivalent width increased from W Å to -14.9 Å, and the distance between the peaks decreased from km s-1 to km s-1. Following Eq. 2 this corresponds to change of the disc radius from 13 R⊙ to 62 R⊙ and expansion velocity of disc km s-1. Using W and Eq. 3 this corresponds to change of the disc radius from 10 R⊙ to 108 R⊙ and expansion velocity of disc km s-1.
During the period JD 2452800 to JD 2455500 a steady increase of the H emission is also visible (Fig.5). The equivalent width increased from W Å to -37 Å. Using Eq. 3, this corresponds to km s-1.
We compared the high resolution emission line profiles obtained with the ESPERO spectrograph. An interesting result emerged when we compared the profiles obtained in December 2015 with that in March 2017 (see Fig. 3). It seems that during this period the material that was emitting in the wings of the emission moved to the outer parts of the disc and on the later spectrum this material emits in the central part of the line. Ring-like structures in Be discs are discussed for example by Struve (1931) and Rivinius et al. (2001). In X Per, Tarasov & Roche (1995) detected the appearance and development of an inner ring-like structure in the period 1993-1995, when the disc was starting to rebuilt after a disc-less phase.
Supposing that the variability seen on Fig. 3 represents a ring-like structure (a ring-like density enhancement) in the disc, we calculate that the ring initially emits at km s-1, and later at km s-1. Applying Eq.2 we obtain that the material moved from 40 R⊙ to 325 R⊙ for 447 days, having average outflow velocity 5.0 km s-1. This velocity is about eight times faster than the velocity we estimated from disc build-up, and might be an indication that once the disc is developed the material can move faster inside the disc.
4.2 Disc truncation
The tendency for the disc emission fluxes to cluster at specified levels is related to the truncation of the disc at specific disc radii by the orbiting compact object (e.g. Coe et al., 2006). Okazaki & Negueruela (2001) proposed that these limiting radii are defined by the closest approach of the companion in the high-eccentricity systems and by resonances between the orbital period and disc gas rotational periods in the low-eccentricity systems. The resonance radii are given by
| (4) |
where is the gravitational constant, is the integer number of disc gas rotational periods, and is the integer number of orbital periods. The important resonances are not only those with , but can as well be in general.
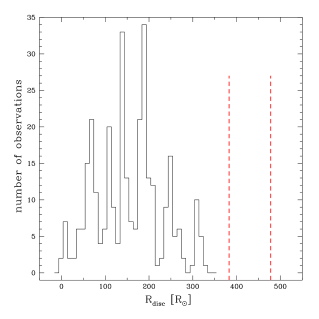
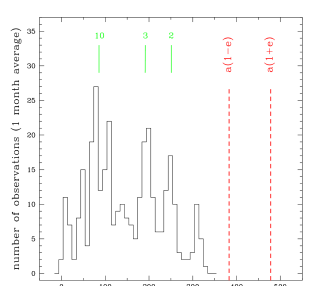
The histograms of disc size, , as calculated by Eq. 3, are plotted in Fig. 4. We use data for W from Reig et al. (2016), Grundstrom et al. (2007), and Li et al. (2014), as well as data from Table 1. Fig. 4 (the upper panel) is the histogram of the measured values of . This histogram is affected by the distribution of the observations, for example if we have many observations in one month it could produce a spurious peak in the histogram. To correct for this effect we calculate the average values for each 30 day. If there is no data for a given interval, we interpolate between the nearest values. The 30-day binned values are plotted in Fig. 4 (lower panel). The 30-day bin was used because we do not detect variability in on a timescale shorter than 10 days, but we do detect variability on 60 days. Binning with 20 and 40 days provide very similar results. The comparison between Fig. 4a and Fig. 4b shows that the spurious effects due to unequal distribution of the observations are removed.
Fig. 4 is based on data over the last 26 years from 1992 to 2018. We note that in three X-ray/-ray binaries (LSI+61 303, MWC 148, and MWC 656) the distribution of values has one very well-pronounced peak (Zamanov et al., 2016). In X Per we see a few peaks rather than a single peak. The most pronounced peaks correspond to 10:1, 3:1, and 2:1 resonances. In X Per it seems that in the beginning of the disc-rise the resonance 10:1 operates, after this more disc material appears, the disc grows, and the resonance 3:1 starts to operate, and later 2:1. A more or less similar situation is in the Be/X-ray binary V725 Tau / 1A 0535+262, where multiple resonances are discussed, i.e. 1:4, 1:5, and 1:7 (Coe et al., 2006). The orbital period of V725 Tau is 111.1 days (Finger et al., 1996). This similarity indicates that in such wide systems different resonances can operate probably depending on the mass loss of the primary and the development of its circumstellar disc.
Following Yatabe et al. (2018), we adopt d and mass of the neutron star M⊙. For the primary we assume M⊙ (see Sect. 3). With these values we calculate mass ratio and semi-major axis of the orbit R⊙. Using the formula by Eggleton (1983), we estimate the Roche lobe size of the primary R⊙. The orbital eccentricity of the system is low (Delgado-Martí et al., 2001). The distance between components at periastron is R⊙ and at apastron is R⊙.
The maximum disc size observed in our data is R⊙, which is smaller than the closest approach of the neutron star. However, it is larger than the size of the Roche lobe of the Be star, i.e. .
The Be/X-ray binaries present different states of X-ray activity (Stella et al., 1986; Negueruela, 1998). X Per does not show periodic Type I outbursts, which are common feature in the classical Be/X-ray binaries and occur when a neutron star moving along an eccentric orbit crosses the Be circumstellar disc during the periastron passage. The result that demonstrates that the neutron star does not pass through the disc of the donor star even at the maximum disc size observed during the last 30 years. Periodic Type I outbursts in X Per can be expected if achieves the level of about 45 Å or above it.
4.3 Be disc –¿ X-ray flux
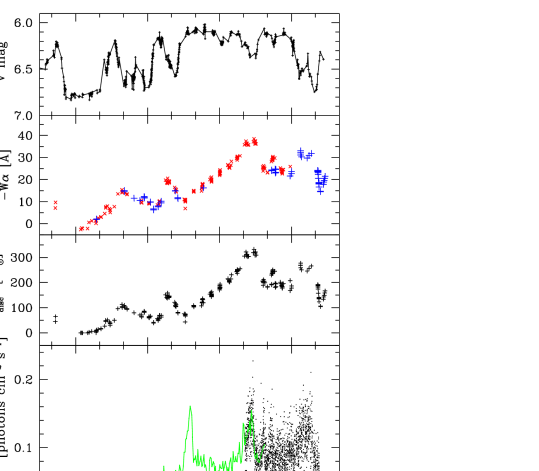
The mass transfer rate onto the neutron star and subsequent accretion-driven X-ray flux should depend on the changes in the radius of the disc of the Be star that we can track through the variations in H emission line. The V-band magnitude, , the calculated disc radius, and X-ray data are plotted in Fig. 5. The V-band data are from American Association of Variable Star Observers (AAVSO). The X-ray data are from RXTE/ASM (Jahoda et al., 1996; Levine et al., 1996) and MAXI (Matsuoka et al., 2009). The RXTE/ASM X-ray light curve is rebinned with a time of 30 days and scaled relatively to the MAXI counts (binning with 25 or 35 days provide very similar light curve). In the panel , the red crosses are data from the literature (Reig et al., 2016; Grundstrom et al., 2007; Li et al., 2014). The blue plus signs represent Rozhen, TIGRE, and ELODIE data from our Tables 1 and 2 of Zamanov et al. (2001).
Li et al. (2014) discussed the connection between and X-ray flux during the period JD 2451000 - JD 2455000. They pointed out the time delay between the maximum at about JD 2452000 and X-ray maximum, which is days later. They used this delay to estimate the viscosity in the outflowing disc ( parameter). We point that there is a similar time delay between a minimum in at JD 2452600 and a minimum in RXTE/ASM X-ray flux at JD 2453500.
After JD 2454000 increases and the X-ray flux also increases, which indicates that the neutron star accretes more material and probably truncates the outer parts of the disc. Two stronger peaks are visible in at JD 2455000 and JD 2457500. Both of these peaks are also well detectable in the MAXI X-ray data. We performed correlation analysis and found moderate to strong correlation between and X-ray flux with the Pearson correlation coefficient 0.61-0.66, Spearman’s (rho) correlation coefficient 0.61-0.68, and significance, in the range - . There is no time delay between and X-ray flux after JD 2454000. If a time delay exists it is less than 40 days.
A comparison between the behaviour of V brightness and shows that before JD 2453000 these parameters vary almost simultaneously – the maxima of correspond to the maxima of the V-band brightness and have time delays days. After it, the behaviour is different – the maxima of and correspond to minima of the V-band brightness.
5 Discussion
For Be stars, Hanuschik et al. (1988) found that the peak separations of and emission lines follow the relation . For X Per the ratio is considerably below the average value for Be stars (see Sect. 4). At this stage considerable deviation from the behaviour of the Be stars is also detected in LSI (Zamanov et al., 2016). In both star the -emitting disc is only 1.7 times larger than the -emitting disc, while in normal Be stars it is 3.2 times larger. This can be a result of truncation of the outer parts or different density structures in the inner parts of the Be disc.
The pulse period of neutron star in X Per shows episodic spin-ups and spin-downs. Between 1972 and 1978 the neutron star has been spinning up with a rate of yr-1 (Henrichs, 1983). Since 1978 till 2002 the neutron star has been spinning down with a rate yr-1. After 2002 (JD 2452000) a new episode of spin-up has began (Blay & Reglero, 2012; Acuner et al., 2014). This new spin-up began together with the increase of the X-ray brightness, and its start corresponds to the moment when achieved 20 Å and R⊙.
Yatabe et al. (2018) analysed X-ray data and estimated for the neutron star in X Per mass M⊙, and magnetic field G, adopting GAIA distance pc. They also found that the X-ray luminosity varies in the range to erg s-1.
Postnov et al. (2017) proposed that in the enigmatic Be star Cassiopeia the elusive companion is a neutron star acting as a propeller. In this scenario, the subsequent evolutionary stage of Cas and its analogues should be X Per-type binaries comprising low-luminosity slowly rotating X-ray pulsars. The corotation radius of the neutron star is
| (5) |
The radius of its magnetosphere (the Alfvén radius) is
| (6) |
In the standard theory of gravimagnetic rotators (Lipunov, 1987; Campana et al., 2018) for a neutron star to be accretor (X-ray pulsar) the condition is that the magnetosphere radius should be smaller than the corotation radius, . Assuming km and that X-ray flux is equal to the accretion luminosity,
| (7) |
we estimate that the mass accretion rate is in the range to M⊙ yr-1 (from to g s-1). We calculate that at low accretion rate R⊙, in other words at low X-ray flux the neutron star is close to the accretor-propeller transition boundary. The condition that the neutron star in X Per is an accretor (not propeller), , also puts a limit on the magnetic field strength, G. This value is estimated taking into account the deviation of the magnetosphere radius from the the Alfvén radius (e.g. Bozzo et al., 2018). If the magnetic field is above this value, the neutron star would act as a propeller, the X-ray luminosity would decrease and the X-ray pulsations would disappear (which is not observed).
Roche et al. (1993) found a clear correlation between the optical, infrared, and X-ray behaviours during the 1974-1977 low state, followed by an extended period in which the X-ray behaviour appears to be unrelated to the optical. Li et al. (2014), analysing data obtained after the disc-less episode in 1990, found a time delay of about 800 days between and X-ray flux. This time delay exists before JD 2454000. After JD 2454000 (as visible on Fig. 5) there is no time delay, but there is a correlation between the variability of and X-ray flux. As the increases, the X-ray flux also increases. This is indicating a direct linkage between the circumstellar disc around mass donor and accretion rate onto the neutron star. This linkage is visible when Å and R⊙. When the circumstellar disc around the primary increases above 200 R⊙, the quantity of the material that is captured in the accretion cylinder of the neutron star also increases. The Roche lobe size of the primary is R⊙ (see Sect. 4.2). When Å, , the circumstellar disc fills the Roche lobe around the primary and the neutron star begins to accrete material from the Roche lobe overflow. In the past few years the existence of a relatively efficient mode of wind mass accretion in a binary system has been proposed, called the wind Roche lobe overflow (WRLOF; Mohamed & Podsiadlowski, 2007), which lies in between the canonical Bondi-Hoyle-Littleton accretion and Roche lobe overflow. In case of X Per, most probably before JD 2454000 the circumstellar disc is small, it is well inside the Roche lobe () and wind accretion (Bondi-Hoyle-Littleton accretion) is acting. After JD 2454000 when the circumstellar disc size achieves the Roche lobe, , the accretion mode changes to WRLOF, and the neutron star is accreting material directly from the circumstellar disc (Roche lobe overflow from the circumstellar disc) without time delay.
Other possibilities include the development of spiral arms (Grundstrom et al., 2007) or other large-scale perturbations (Negueruela et al., 1998) in the circumstellar envelope excited by tidal interaction which may lift disc gas out to radii where the accretion by the neutron star becomes more effective.
6 Conclusions
We present optical spectroscopic observations of the Be/X-ray binary X Per, optical counterpart of the X-ray pulsar 4U 0352+309. In this work, we combine published data with our measurements. First, we estimate, that the expansion velocity of the circumstellar disc is in the range 0.4 - 0.7 km s-1. Second, we find that the distribution of the disc radius from the average equivalent width suggests resonant truncation of the disc, while the maximum disc radius is smaller than the separation of the stars at periastron but larger than the Roche lobe of the primary. Third, we derive a correlation between the equivalent width of emission line and X-ray flux, which is visible since JD 2454000, when Å. We briefly discuss possible mechanisms of mass transfer.
Acknowledgements.
This work is supported by the grant K-06-H28/2 08.12.2018 (Bulgarian National Science Fund). It is based on observations from Rozhen National Astronomical Observatory, Bulgaria and the TIGRE telescope, located at La Luz, Mexico. TIGRE is a joint collaboration of the Hamburger Sternwarte, the University of Guanajuato and the University of Liège. This research has made use of (1) the MAXI data provided by RIKEN, JAXA, and the MAXI team; (2) results provided by the ASM/RXTE teams at MIT and at the RXTE SOF and GOF at NASA’s GSFC; and (3) observations from the AAVSO International Database contributed by observers worldwide. UW acknowledges funding by DLR, project 50OR1701. DM acknowledges partial support by grants DN 08/20/2017 and RD-08-112/2018. We are very grateful to the referee whose comments helped to improve considerably the original manuscript.References
- Acuner et al. (2014) Acuner, Z., İnam, S. Ç., Şahiner, Ş., et al. 2014, MNRAS, 444, 457
- Andrillat (1983) Andrillat, Y. 1983, A&AS, 53, 319
- Apparao (1994) Apparao, K. M. V. 1994, Space Sci. Rev., 69, 255
- Blay & Reglero (2012) Blay, P. & Reglero, V. 2012, in Proceedings of “An INTEGRAL view of the high-energy sky (the first 10 years)” - 9th INTEGRAL Workshop and celebration of the 10th anniversary of the launch (INTEGRAL 2012). 15-19 October 2012. Bibliotheque Nationale de France, Paris, France. Published online at http://pos.sissa.it/cgi-bin/reader/conf.cgi?confid=176¡/A¿, id., 26
- Bonev et al. (2017) Bonev, T., Markov, H., Tomov, T., et al. 2017, Bulgarian Astronomical Journal, 26, 67
- Bozzo et al. (2018) Bozzo, E., Ascenzi, S., Ducci, L., et al. 2018, A&A, 617, A126
- Braes & Miley (1972) Braes, L. L. E. & Miley, G. K. 1972, Nature, 235, 273
- Campana et al. (2018) Campana, S., Stella, L., Mereghetti, S., & de Martino, D. 2018, A&A, 610, A46
- Catanzaro (2013) Catanzaro, G. 2013, A&A, 550, A79
- Coe et al. (2006) Coe, M. J., Reig, P., McBride, V. A., Galache, J. L., & Fabregat, J. 2006, MNRAS, 368, 447
- Dachs et al. (1986) Dachs, J., Hanuschik, R., Kaiser, D., & Rohe, D. 1986, A&A, 159, 276
- Dachs et al. (1992) Dachs, J., Hummel, W., & Hanuschik, R. W. 1992, A&AS, 95, 437
- de Loore et al. (1979) de Loore, C., Altamore, A., Baratta, G. B., et al. 1979, A&A, 78, 287
- Delgado-Martí et al. (2001) Delgado-Martí, H., Levine, A. M., Pfahl, E., & Rappaport, S. A. 2001, ApJ, 546, 455
- Doroshenko et al. (2012) Doroshenko, V., Santangelo, A., Kreykenbohm, I., & Doroshenko, R. 2012, A&A, 540, L1
- Dorren et al. (1979) Dorren, J. D., Guinan, E. F., & McCook, G. P. 1979, IAU Circ., 3352
- Eggleton (1983) Eggleton, P. P. 1983, ApJ, 268, 368
- Fabregat et al. (1992) Fabregat, J., Reglero, V., Coe, M. J., et al. 1992, A&A, 259, 522
- Finger et al. (1996) Finger, M. H., Wilson, R. B., & Harmon, B. A. 1996, ApJ, 459, 288
- Gaia Collaboration et al. (2018) Gaia Collaboration, Brown, A. G. A., Vallenari, A., et al. 2018, A&A, 616, A1
- Gaia Collaboration et al. (2016) Gaia Collaboration, Prusti, T., de Bruijne, J. H. J., et al. 2016, A&A, 595, A1
- Grundstrom et al. (2007) Grundstrom, E. D., Boyajian, T. S., Finch, C., et al. 2007, ApJ, 660, 1398
- Grundstrom & Gies (2006) Grundstrom, E. D. & Gies, D. R. 2006, ApJ, 651, L53
- Hanuschik (1986) Hanuschik, R. W. 1986, A&A, 166, 185
- Hanuschik (1989) Hanuschik, R. W. 1989, Ap&SS, 161, 61
- Hanuschik et al. (1988) Hanuschik, R. W., Kozok, J. R., & Kaiser, D. 1988, A&A, 189, 147
- Henrichs (1983) Henrichs, H. F. 1983, in Accretion-Driven Stellar X-ray Sources, ed. W. H. G. Lewin & E. P. J. van den Heuvel, 393–429
- Hohle et al. (2010) Hohle, M. M., Neuhäuser, R., & Schutz, B. F. 2010, Astronomische Nachrichten, 331, 349
- Jahoda et al. (1996) Jahoda, K., Swank, J. H., Giles, A. B., et al. 1996, in Proc. SPIE, Vol. 2808, EUV, X-Ray, and Gamma-Ray Instrumentation for Astronomy VII, ed. O. H. Siegmund & M. A. Gummin, 59–70
- Knigge et al. (2011) Knigge, C., Coe, M. J., & Podsiadlowski, P. 2011, Nature, 479, 372
- La Palombara & Mereghetti (2007) La Palombara, N. & Mereghetti, S. 2007, A&A, 474, 137
- Levine et al. (1996) Levine, A. M., Bradt, H., Cui, W., et al. 1996, ApJ, 469, L33
- Li et al. (2014) Li, H., Yan, J., Zhou, J., & Liu, Q. 2014, AJ, 148, 113
- Lipunov (1987) Lipunov, V. M. 1987, The astrophysics of neutron stars
- Lutovinov et al. (2012) Lutovinov, A., Tsygankov, S., & Chernyakova, M. 2012, MNRAS, 423, 1978
- Lyubimkov et al. (1997) Lyubimkov, L. S., Rostopchin, S. I., Roche, P., & Tarasov, A. E. 1997, MNRAS, 286, 549
- Maitra et al. (2017) Maitra, C., Raichur, H., Pradhan, P., & Paul, B. 2017, MNRAS, 470, 713
- Matsuoka et al. (2009) Matsuoka, M., Kawasaki, K., Ueno, S., et al. 2009, PASJ, 61, 999
- Mohamed & Podsiadlowski (2007) Mohamed, S. & Podsiadlowski, P. 2007, in Astronomical Society of the Pacific Conference Series, Vol. 372, 15th European Workshop on White Dwarfs, ed. R. Napiwotzki & M. R. Burleigh, 397
- Monageng et al. (2017) Monageng, I. M., McBride, V. A., Coe, M. J., Steele, I. A., & Reig, P. 2017, MNRAS, 464, 572
- Moultaka et al. (2004) Moultaka, J., Ilovaisky, S. A., Prugniel, P., & Soubiran, C. 2004, PASP, 116, 693
- Negueruela (1998) Negueruela, I. 1998, A&A, 338, 505
- Negueruela (2004) Negueruela, I. 2004, in Revista Mexicana de Astronomia y Astrofisica Conference Series, Vol. 20, Revista Mexicana de Astronomia y Astrofisica Conference Series, ed. G. Tovmassian & E. Sion, 55–56
- Negueruela et al. (1998) Negueruela, I., Reig, P., Coe, M. J., & Fabregat, J. 1998, A&A, 336, 251
- Nieva (2013) Nieva, M.-F. 2013, A&A, 550, A26
- Nikolov et al. (2017) Nikolov, Y. M., Zamanov, R. K., Stoyanov, K. A., & Martí, J. 2017, Bulgarian Astronomical Journal, 27, 10
- Norton et al. (1991) Norton, A. J., Coe, M. J., Estela, A., et al. 1991, MNRAS, 253, 579
- Okazaki & Negueruela (2001) Okazaki, A. T. & Negueruela, I. 2001, A&A, 377, 161
- Pfahl et al. (2002) Pfahl, E., Rappaport, S., Podsiadlowski, P., & Spruit, H. 2002, ApJ, 574, 364
- Porter & Rivinius (2003) Porter, J. M. & Rivinius, T. 2003, PASP, 115, 1153
- Postnov et al. (2017) Postnov, K., Oskinova, L., & Torrejón, J. M. 2017, MNRAS, 465, L119
- Reig (2011) Reig, P. 2011, Ap&SS, 332, 1
- Reig et al. (2016) Reig, P., Nersesian, A., Zezas, A., Gkouvelis, L., & Coe, M. J. 2016, A&A, 590, A122
- Rivinius et al. (2001) Rivinius, T., Baade, D., Štefl, S., & Maintz, M. 2001, A&A, 379, 257
- Roche et al. (1993) Roche, P., Coe, M. J., Fabregat, J., et al. 1993, A&A, 270, 122
- Roche et al. (1997) Roche, P., Larionov, V., Tarasov, A. E., et al. 1997, A&A, 322, 139
- Schmidt-Kaler (1982) Schmidt-Kaler, T. 1982, Landolt-Börnstein. Numerical data and functional relationships in science and technology. New Series. Group VI: Volume 2/b
- Schmitt et al. (2014) Schmitt, J. H. M. M., Schröder, K.-P., Rauw, G., et al. 2014, Astronomische Nachrichten, 335, 787
- Slettebak et al. (1992) Slettebak, A., Collins, II, G. W., & Truax, R. 1992, ApJS, 81, 335
- Stella et al. (1986) Stella, L., White, N. E., & Rosner, R. 1986, ApJ, 308, 669
- Struve (1931) Struve, O. 1931, ApJ, 73, 94
- Taranova & Shenavrin (2017) Taranova, O. G. & Shenavrin, V. I. 2017, Astronomy Reports, 61, 983
- Tarasov & Roche (1995) Tarasov, A. E. & Roche, P. 1995, MNRAS, 276, L19
- Telting et al. (1998) Telting, J. H., Waters, L. B. F. M., Roche, P., et al. 1998, MNRAS, 296, 785
- van den Bergh (1972) van den Bergh, S. 1972, Nature, 235, 273
- Viotti et al. (1982) Viotti, R., Ferrari-Toniolo, M., Giangrande, A., Persi, P., & Baratta, G. B. 1982, in IAU Symposium, Vol. 98, Be Stars, ed. M. Jaschek & H.-G. Groth, 423–426
- Worrall et al. (1981) Worrall, D. M., Knight, F. K., Nolan, P. L., et al. 1981, ApJ, 247, L31
- Yatabe et al. (2018) Yatabe, F., Makishima, K., Mihara, T., et al. 2018, PASJ, 70, 89
- Zamanov et al. (2001) Zamanov, R. K., Reig, P., Martí, J., et al. 2001, A&A, 367, 884
- Zamanov et al. (2016) Zamanov, R. K., Stoyanov, K. A., Martí, J., et al. 2016, A&A, 593, A97
- Zamanov & Zamanova (1995) Zamanov, R. K. & Zamanova, V. I. 1995, Information Bulletin on Variable Stars, 4189
| file | telescope | JD-start | exp-time | Wα | |||
|---|---|---|---|---|---|---|---|
| instrument | 2400000+ | [min] | [Å] | [km s-1] | [km s-1] | ||
| 19920903* | 2.0m Coude | 48869.5278 | 59 | -1.9 | 382 | ||
| 19920905* | 2.0m Coude | 48871.5042 | 54 | -2.2 | 386 | ||
| 19951107.0024 | Elodie | 50029.4808 | 30 | -14.9 | 177.8 | 202.0 | |
| 19951107.0028 | Elodie | 50029.5449 | 45 | -14.7 | 176.9 | 200.0 | |
| 19961217.0024 | Elodie | 50435.3818 | 8 | -12.1 | |||
| 19970817* | 2.0m Coude | 50677.5447 | 15 | -10.5 | 97 | ||
| 19980209a* | 2.0m Coude | 50854.1816 | 5 | -12.3 | 133 | ||
| 19980209b* | 2.0m Coude | 50854.1856 | 5 | -12.2 | 134 | ||
| 19980219a* | 2.0m Coude | 50864.2089 | 7 | -12.1 | 118 | ||
| 19980219b* | 2.0m Coude | 50864.2191 | 7 | -11.7 | 127 | ||
| 19981102a* | 2.0m Coude | 51120.6553 | 15 | -9.8 | 142 | ||
| 19981102b* | 2.0m Coude | 51120.6660 | 15 | -9.9 | 145 | ||
| 19981230.65 | 2.0m Coude | 51178.4811 | 25 | -8.4 | 167.7 | ||
| 19981230.66 | 2.0m Coude | 51178.4991 | 25 | -8.2 | 164.8 | ||
| 19990309a* | 2.0m Coude | 51247.2356 | 20 | -6.7 | 161 | ||
| 19990309b* | 2.0m Coude | 51247.2497 | 20 | -6.3 | 164 | ||
| 19990919a* | 2.0m Coude | 51441.5191 | 20 | -8.1 | 146 | ||
| 19990919b* | 2.0m Coude | 51441.5333 | 10 | -7.7 | 148 | ||
| 20000129.0005 | Elodie | 51573.2545 | 30 | -9.3 | 153.7 | 190.3 | |
| 20000129.0006 | Elodie | 51573.2767 | 30 | -10.0 | 153.6 | 193.5 | |
| 20010903.178 | 2.0m Coude | 52156.5933 | 10 | -14.8 | 122 | ||
| 20010903.179 | 2.0m Coude | 52156.6006 | 8 | -15.0 | 120 | ||
| 20011220.0011 | Elodie | 52264.3216 | 30 | -11.4 | |||
| 20011221.0008 | Elodie | 52265.3375 | 60 | -11.7 | |||
| 20041117.0010 | Elodie | 53328.4980 | 33 | -16.2 | 102.1 | 168.3 | |
| 20120903.1 | 2.0m Coude | 56173.5163 | 10 | -24.08 | — | ||
| 20120903.2 | 2.0m Coude | 56173.5235 | 10 | -24.41 | — | ||
| 20130102.1 | 2.0m Coude | 56295.3645 | 10 | -25.61 | 81 | ||
| 20130102.2 | 2.0m Coude | 56295.3717 | 10 | -25.95 | 88 | ||
| 20130103.1 | 2.0m Coude | 56296.3813 | 10 | -26.39 | 85.9 | ||
| 20130103.2 | 2.0m Coude | 56296.3885 | 10 | -26.54 | 85.8 | ||
| 20141013.1 | 2.0m Coude | 56944.4487 | 10 | -24.4 | 105.5 | ||
| 20141013.2 | 2.0m Coude | 56944.4560 | 10 | -24.17 | 101.8 | ||
| 20141212.1 | 2.0m Coude | 57004.4019 | 10 | -26.8 | 87.2 | ||
| 20141212.2 | 2.0m Coude | 57004.4091 | 10 | -26.6 | 108 | ||
| 20151223.1 | 2.0m Echelle | 57380.4701 | 30 | satur. | — | 144.0 | |
| 20151223.2 | 2.0m Echelle | 57380.4916 | 10 | -36.4 | — | 146.7 | |
| 20151224 | 2.0m Echelle | 57381.3691 | 10 | -36.3 | — | 145.3 | |
| 20151226 | 2.0m Echelle | 57383.3341 | 10 | -36.1 | — | 145.1 | |
| 20151227 | 2.0m Echelle | 57384.3728 | 5 | -36.5 | — | 145.2 | |
| 20160130 | 2.0m Echelle | 57418.2988 | 5 | -33.9 | 95.3 | 124.9 | |
| 20160923 | 2.0m Echelle | 57654.5749 | 10 | -30.8 | — | 143.3 | |
| 20161211 | 2.0m Echelle | 57734.3811 | 20 | -32.7 | 63.0 | 133.5 | |
| 20170317 | 2.0m Echelle | 57830.2978 | 20 | -30.9 | — | 126.1 | |
| 20171207.1 | 2.0m Echelle | 58095.2062 | 2 | -23.5 | 119.4 | ||
| 20171207.2 | 2.0m Echelle | 58095.2107 | 15 | -23.5 | 120.3 | 149.3 | |
| 20171207.3 | 2.0m Echelle | 58095.2226 | 15 | -23.4 | 119.6 | 150.1 | |
| 20171208.1 | 2.0m Echelle | 58096.203 | 2 | -22.7 | 117.8 | ||
| 20171208.2 | 2.0m Echelle | 58096.207 | 10 | -23.5 | 121.8 | 148.0 | |
| 20171220.2134 | TIGRE | 58108.6489 | 4 | -25.0 | 125.3 | ||
| 20171221.1853 | TIGRE | 58109.5373 | 4 | -24.1 | 122.4 | ||
| 20171222.1854 | TIGRE | 58110.5380 | 2 | -23.4 | 120.3 | ||
| 20171223.1922 | TIGRE | 58111.5571 | 4 | -23.8 | 120.8 | ||
| 20171224.1926 | TIGRE | 58112.5601 | 4 | -23.0 | 120.7 | ||
| 20171230 | 2.0m Echelle | 58118.2314 | 20 | -21.9 | 125.7 | 148.7 | |
| 20180101 | 2.0m Echelle | 58120.230 | 20 | -19.8 | 121.5 | 143.7 | |
| 20180103.1928 | TIGRE | 58122.5614 | 15 | -20.5 | 122.2 | ||
| 20180103.2156 | TIGRE | 58122.6638 | 15 | -21.2 | 123.9 |
| 20180104.0017 | TIGRE | 58122.7622 | 15 | -20.2 | 124.1 | ||
| 20180104.1921 | TIGRE | 58123.5563 | 15 | -21.3 | 123.8 | ||
| 20180105.1959 | TIGRE | 58124.5832 | 15 | -21.1 | 121.9 | ||
| 20180105.2219 | TIGRE | 58124.6805 | 15 | -21.3 | 121.8 | ||
| 20180106.0039 | TIGRE | 58124.7775 | 5 | -20.7 | 121.3 | ||
| 20180106.1923 | TIGRE | 58125.5582 | 15 | -20.7 | 121.1 | ||
| 20180106.2149 | TIGRE | 58125.6594 | 15 | -21.0 | 121.0 | ||
| 20180107.0014 | TIGRE | 58125.7601 | 15 | -20.8 | 122.1 | ||
| 20180126.01 | 2.0m Echelle | 58145.2150 | 2 | -18.34 | 106.3 | ||
| 20180126.02 | 2.0m Echelle | 58145.2170 | 3 | -18.44 | 106.1 | ||
| 20180126.03 | 2.0m Echelle | 58145.2201 | 15 | -18.05 | 106.8 | ||
| 20180126.04 | 2.0m Echelle | 58145.2312 | 20 | -18.64 | 108.5 | 141.3 | |
| 20180201.01 | 2.0m Echelle | 58151.2218 | 20 | -18.3 | 122.4 | 141.6 | |
| 20180201.02 | 2.0m Echelle | 58151.2312 | 5 | -16.7 | 122.5 | ||
| 20180402.01 | 2.0m Echelle | 58211.2832 | 10 | -14.7 | 105.8 | 115.0 | |
| 20180402.02 | 2.0m Echelle | 58211.2879 | 2 | -14.5 | 103.6 | ||
| 20180802 | TIGRE | 58332.9723 | 10 | -17.83 | |||
| 20180818 | TIGRE | 58348.9210 | 10 | -18.89 | |||
| 20180905 | TIGRE | 58366.8712 | 10 | -19.62 | |||
| 20180925 | TIGRE | 58386.8679 | 10 | -20.61 | |||
| 20181010 | TIGRE | 58401.8028 | 10 | -21.51 |