To be or not to be: hot WHIM absorption in the blazar PKS 2155-304 sight line?
The cosmological missing baryons at z1 most likely hide in the hot (T K) phase of the Warm Hot Intergalactic Medium (WHIM). While the hot WHIM is hard to detect due to its high ionisation level, the warm (T K) phase of the WHIM has been very robustly detected in the FUV band. We adopted the assumption that the hot and warm WHIM phases are co-located and thus used the FUV-detected warm WHIM as a tracer for the cosmologically interesting hot WHIM. We utilised the assumption by performing an X-ray follow-up in the sight line of a blazar PKS 2155-304 at the redshifts where previous FUV measurements of O VI, Si IV and BLA absorption have indicated the existence of the warm WHIM. We looked for the O VII He and O VIII Ly absorption lines, the most likely hot WHIM tracers. Despite of the very large exposure time ( 1 Ms), the XMM-Newton/RGS1 data yielded no significant detection which corresponds to upper limits of and . An analysis of LETG/HRC data yielded consistent results. However, the LETG/ACIS data yielded a detection of an absorption line - like feature at 20 Å at simple one parameter uncertainty - based confidence level of 3.7 , consistently with several earlier LETG/ACIS reports. Given the high statistical quality of the RGS1 data, the possibility of RGS1 accidentally missing the true line at 20 Å is very low, 0.006%. Neglecting this, the LETG/ACIS detection can be interpreted as Ly transition of O VIII at one of the redshifts (z 0.054) of FUV-detected warm WHIM. Given the very convincing X-ray spectral evidence for and against the existence of the 20 Å feature, we cannot conclude whether or not it is a true astrophysical absorption line. Considering cosmological simulations, the probability of LETG/ACIS Å feature being due to astrophysical O VIII absorber co-located with the FUV-detected O VI absorber is at the very low level level of 0.1%. We cannot rule out completely the very unlikely possibility that the LETG/ACIS 20 Å feature is due to a transient event located close to the blazar.
Key Words.:
Cosmology: observations – large-scale structure of Universe – intergalactic medium1 Introduction
High resolution X-ray spectroscopy is currently a popular method for searching for the local (z1) missing baryons. According to cosmological large scale simulations (e.g. Cen & Ostriker 1999; Davé et al. 2001; Dolag et al. 2006; Branchini et al. 2009; Cui et al. 2012, 2018) these missing baryons reside in the hottest (T K) phase of the Warm Hot Intergalactic Medium (WHIM), embedded within the filaments of the Cosmic Web. Given a bright enough background X-ray emission source, and a high enough column density of the intervening hot WHIM filament, detectable high ion metal absorption line features (e.g. O VII He and O VIII Ly) can be imprinted in the emission spectrum.
Due to relatively weak X-ray signal of WHIM, compared to the sensitivities of the current instrumentation, significant measurements (at statistical significance 3 ) of absorption lines from the ionised metals in the WHIM embedded within the large scale filaments are very sparse. The rare 4 detection of the O VII He line at the Sculptor Wall (Buote et al. 2009; Fang et al. 2010) has been questioned by 1) the existence of a galaxy 240 kpc away from the absorber (Williams et al. 2013) and 2) the possible contamination by the Galactic O II K absorption (Nicastro et al. 2016) whose rest wavelength 22.30 Å matches that of O VII He at z=0.03, as in the case of the Sculptor Wall. We showed in Nevalainen et al. (2015) that an unrealistically long path length through the halo of the nearby galaxy is required for the hydrogen column density inferred from the X-ray measurement in Sculptor Wall. Also, the X-ray measurements of the Galactic O II K are questionable since the modeling heavily relies on the O II K line whose wavelength 23.35 Å co-incides with the poorly calibrated instrumental feature in both RGS and LETG, resulting in significantly different equivalent widths depending on which instrument is used (see Nevalainen et al. (2017) and the references therein). Furthermore, the spectral modelling in Nicastro et al. (2016), if assumed correct, does not rule out a significant amount of O VII He absorption at z=0.03 ( 15.4).
Nicastro et al. (2018) reported on the search for the WHIM absorption line in the sight line towards a blazar 1ES 1553+113. When considering the redshift trials for the blind search and the systematic uncertainties of the instrument, they determined an absorption line - like feature at Å at a 3.5 confidence level and interpreted it being due to O VII He at z0.43. It is not clear, whether the signal comes from WHIM located in a large scale filament (as required for the solution for the cosmological missing baryons problem) or from the halo of a nearby galaxy (as the authors prefer). Thus, the interpretation of the signal as due to O VII within a large scale filament needs to be confirmed by detection of a galaxy filament using sufficiently deep spectroscopic data. The significance of the second line interpreted as O VII at z0.36 discussed in the paper has a significance below the 3 limit.
On the other hand, the commonly used background sources, the blazars, are much brighter in the FUV compared to X-rays. Also, the current FUV instruments (COS and STIS on-board HST; FUSE) are more sensitive than the current high resolution X-ray instruments (XMM-Newton/RGS and Chandra/LETG). Thus, the FUV measurements have yielded numerous detections of the extragalactic O VI and broad Ly (BLA) absorption lines, typically interpreted as signatures of the warm (T K) WHIM (e.g. Lehner et al. 2007). Thus, the warm part of the local WHIM is considered to be robustly detected (Shull et al. 2012).
Given the abundance of the FUV absorbers, it is tempting to use their locations to look for the hottest WHIM. The underlying assumption of the co-location of the warm (O VI and BLA) and hot (O VII-VIII) WHIM absorbers has not been well tested yet, basically due to the very limited number of significant O VII-VIII detections. We utilised the above assumption by performing an X-ray follow-up in the sight line of a blazar PKS 2155-304 at the redshifts where previous FUV measurements of O VI, Si IV and BLA absorption have indicated the existence of the warm WHIM.
Yao et al. (2009) stacked the available LETG/ACIS and MEG/ACIS data of PKS 2155-304 together with the spectra from several other AGN sight lines in order to examine the combined signal of the possible hot counterparts to the FUV-detected O VI absorbers. They obtained no significant absorption line and upper limits of and . Compared to Yao et al. (2009) we have the luxury of a very large amount of high resolution X-ray data on PKS 2155-304. We used all useful data available to us on PKS 2155-304 obtained with RGS1 on-board XMM-Newton (the RGS2 does not cover most of the studied lines) and LETG/ACIS and LETG/HRC-S combinations on-board Chandra (the quality of the available MEG/ACIS data was too poor to yield meaningful constraints). We utilised these data in order to obtain similar detection limits as Yao et al. (2009) but for the individual FUV absorbers in a single sight line (i.e. PKS 2155-304), as reported by Tilton et al. (2012). While doing so, we will avoid possible problems due to stacking the data from different instruments, targets and redshifts. With this we aim at improving the observational status of the possible co-location of the warm and hot WHIM.
We use , and . The distances and redshifts refer to the heliocentric frame. We quote uncertainties at the 1 confidence level.
| IDa𝑎aa𝑎aName of the absorber | b𝑏bb𝑏bThe redshift of the FUV absorber. | line | c𝑐cc𝑐cOur adopted redshift for the X-ray follow-up. | (O VII He)d𝑑dd𝑑dThe redshifted wavelength of O VII He and O VIII Ly. | (O VIII Ly)d𝑑dd𝑑dThe redshifted wavelength of O VII He and O VIII Ly. | |||||
|---|---|---|---|---|---|---|---|---|---|---|
| Metal | BLA | |||||||||
| ion | EWe𝑒ee𝑒eThe equivalent width of the metal line. | f𝑓ff𝑓fThe column density of the metal line. | EWg𝑔gg𝑔gThe equivalent width of the BLA. | bhℎhhℎhThe Doppler parameter of the BLA. | i𝑖ii𝑖iThe column density of the BLA. | |||||
| (mÅ) | (mÅ) | (km s-1) | (Å) | (Å) | ||||||
| A1 | 0.00878 | – | – | 498 | 598 | 13.00.1 | 0.00878 | 21.79 | 19.14 | |
| A2 | 0.01892 | – | – | 594 | 384 | 13.00.1 | 0.01892 | 22.01 | 19.33 | |
| A3aj𝑗jj𝑗jThe two FUV absorbers at the same WHIM structure candidate are shown separately. | 0.05405 | O VI | 325k𝑘kk𝑘kThe equivalent width of the O VI 1031.9Å and 1037.6Å transitions, respectively., 309k𝑘kk𝑘kThe equivalent width of the O VI 1031.9Å and 1037.6Å transitions, respectively. | 13.6 | 3154 | 440 | 14.10.1 | 0.05425 | 22.77 | 20.00 |
| A3bj𝑗jj𝑗jThe two FUV absorbers at the same WHIM structure candidate are shown separately. | 0.05445 | – | – | 6031 | 547 | 13.00.1 | ||||
| A4aj𝑗jj𝑗jThe two FUV absorbers at the same WHIM structure candidate are shown separately. | 0.05659 | – | – | 47710 | 481 | 14.50.3 | 0.05683 | 22.83 | 20.05 | |
| A4bj𝑗jj𝑗jThe two FUV absorbers at the same WHIM structure candidate are shown separately. | 0.05707 | O VI | 4411l𝑙ll𝑙lThe equivalent width of the only significantly detected O VI 1031.9Å transition. | 13.60.1 | 42411 | 681 | 14.00.0 | |||
| A5 | 0.08062 | Si IV | 124m𝑚mm𝑚mThe equivalent width of the only significantly detected Si IV 1393.8Å transition. | 12.10.1 | 295 | 405 | 12.70.1 | 0.08062 | (23.34)n𝑛nn𝑛nThe possible A5 O VIII line would land at problematic wavelengths due to astrophysical and instrumental oxygen edges which prevents an accurate modelling. We thus excluded this line from the further analysis. | 20.50 |
| A6aj𝑗jj𝑗jThe two FUV absorbers at the same WHIM structure candidate are shown separately. | 0.10552 | – | – | 3607 | 541 | 14.10.2 | 0.10569 | 23.83 | 20.97 | |
| A6bj𝑗jj𝑗jThe two FUV absorbers at the same WHIM structure candidate are shown separately. | 0.10586 | – | – | 15622 | 664 | 13.50.0 | ||||
2 FUV detections
In the present work we employed the catalogue of blazar FUV measurements from Tilton et al. (2012). The PKS 2155-304 sight line has been extensively studied using the Hubble Space Telescope COS instrument (Savage et al. 2014) and (Danforth et al. 2016) and the Far Ultraviolet Spectroscopic Explorer (FUSE) and Space Telescope Imaging Spectrograph (STIS) (e.g. Shull et al. (1998, 2003) ; Sembach et al. (2003) ; Wakker et al. (2003) ; Danforth & Shull (2008) ; Stocke et al. (2013, 2014) and Richter et al. (2017)). The inclusion of the FUSE and the STIS instruments ensures the coverage of O VI lines at all redshifts of interest due to their broader wavelength range, compared to the COS.
The BLA and O VI absorption, observable in the FUV band, are commonly interpreted as originating from the warm WHIM. Using a single O VI transition of the 1031.9/1037.6 Å doublet or a single BLA as a WHIM signature may be too optimistic, given the possibilities of misidentification of a single line. On the other hand, a more robust criterion of requiring both O VI transitions to be significantly detected reduces the number of the potential WHIM redshifts due to e.g. detector gap at the critical wavelengths, and consequently we may loose some true WHIM signal. Thus, we adopted the more relaxed criterion of requiring at least one significantly (3) detected O VI line (or other metal line whose ionisation temperature exceeds K) or BLA for follow-up, keeping the above caveat in mind.
As BLA we considered absorption lines due to H I Ly transition with broadening velocity higher than 40 km s-1, which corresponds to thermal broadening of hydrogen at T = K, the lower limit of the WHIM temperature range.
Using the above criteria, the catalogue of Tilton et al. (2012) yielded O VI, Si IV or BLA detections at 9 different redshifts in the PKS 2155-304 sight line (see Table 1). Considering the LETG/RGS photon energy resolution of 40-60 mÅ at 20 Å, we associated the FUV absorbers with redshift difference smaller than 0.002 (co-moving distance difference of 8 Mpc) with a single X-ray absorber. For such absorbers (i.e. A3, A4 and A6) we use the average redshift of the FUV lines as the X-ray follow-up redshift. As a result we have the redshifts of six possible X-ray absorbers to study with X-ray instruments in the PKS 2155-304 sight line (see Table 1).
3 X-ray analysis
We examine here the most likely hot WHIM tracers, i.e. O VII He and O VIII Ly lines at the five FUV-predicted redshifts (see Table 1), including the much studied and controversial O VIII Ly line at z=0.054-0.056 (see Section 4.1).
| instr. | O VII He | O VIII Ly | ||
|---|---|---|---|---|
| EWa𝑎aa𝑎aThe constrains or the upper limits at 1 confidence level for the equivalent width (EW) and the ion column densities , where the uncertainties include both the statistical one and the systematic 2% of the flux. | a𝑎aa𝑎aThe constrains or the upper limits at 1 confidence level for the equivalent width (EW) and the ion column densities , where the uncertainties include both the statistical one and the systematic 2% of the flux. | EWa𝑎aa𝑎aThe constrains or the upper limits at 1 confidence level for the equivalent width (EW) and the ion column densities , where the uncertainties include both the statistical one and the systematic 2% of the flux. | a𝑎aa𝑎aThe constrains or the upper limits at 1 confidence level for the equivalent width (EW) and the ion column densities , where the uncertainties include both the statistical one and the systematic 2% of the flux. | |
| mÅ | cm-2 | mÅ | cm-2 | |
| A1 (z = 0.00878 ; = 21.79 Å; = 19.14 Å) | ||||
| RGS1 | 2.21.8 | 14.9 | 2.1 | 15.2 |
| HRC | 2.6 | 15.0 | 1.2 | 15.0 |
| A2 (z = 0.01892 ; = 22.01 Å; = 19.33 Å) | ||||
| RGS1 | 1.2 | 14.6 | 2.0 | 15.2 |
| HRC | 1.0 | 14.6 | 2.4 | 15.3 |
| A3 (z = 0.05425 ; = 22.77 Å; = 20.00 Å) | ||||
| RGS1 | 4.0 | 15.2 | 1.0 | 14.9 |
| HRC | 4.6 | 15.2 | 2.3 | 15.2 |
| A4 (z = 0.05683 ; = 22.83 Å; = 20.05 Å) | ||||
| RGS1 | 0.8 | 14.5 | 1.4 | 15.0 |
| HRC | 5.8 | 15.4 | 2.3 | 15.3 |
| A5 (z = 0.08062 ; = 23.34 Å; = 20.50 Å) | ||||
| RGS1 | –b𝑏bb𝑏bThe wavelengths coincide with the instrumental feature | –b𝑏bb𝑏bThe wavelengths coincide with the instrumental feature | 1.9 | 15.2 |
| HRC | –b𝑏bb𝑏bThe wavelengths coincide with the instrumental feature | –b𝑏bb𝑏bThe wavelengths coincide with the instrumental feature | 2.6 | 15.3 |
| A6 (z=0.10569 ; = 23.89 Å; = 20.97 Å) | ||||
| RGS1 | 1.8 | 14.8 | 1.4 | 15.0 |
| HRC | 1.6 | 14.8 | 2.6 | 15.3 |
3.1 X-ray data
We analysed all PKS 2155-304 spectra obtained with RGS1 and LETG/HRC-S available in the year 2016, published in Nevalainen et al. (2017). The RGS2 does not cover most of the interesting wavelengths and we thus ignore that data. We examine LETG/ACIS spectra separately in Section 4.4. The exposure time of the RGS1 exceeds 1 Ms rendering the data very powerful for measuring the weak WHIM lines.
We analysed the data using SPEX spectral fitting package (Kaastra et al. 1996). We used 20 mÅ bin size for RGS and 25 mÅ for LETG/HRC, oversampling the spectral resolution by a factor of 2-3. Due to the high number of counts in the spectral channels we used statistics. We added 2% of the flux at each channel as a systematic uncertainty of the effective area in quadrature to the statistical uncertainties, see Nevalainen et al. (2017).
3.2 Wavelength scale calibration
To correct for possible wavelength scale calibration offsets, the individual RGS spectra have been shifted as indicated by the Galactic neutral absorber lines before co-addition (see the description and references in Nevalainen et al. (2017)).
The same procedure was not practical in the case of HRC spectra, since its lower effective area and exposure time (300 ks) compared to RGS, rendered the statistical quality too poor for measuring the Galactic line centroids accurately using the individual spectra. Thus, we examined the total HRC spectrum, co-added without any shifts. The Galactic O I ( = 23.51 Å) and O VII (= 21.60 Å) lines were unambiguously identified. We fitted the 23.0–24.0 Å and 21.0–22.0 Å bands with a model consisting of a power-law continuum and a Gaussian line and consequently obtained significant detections of the Galactic O I and O VII lines. Their centroid wavelengths were detected with an accuracy better than 10 mÅ. Within the uncertainties, the centroid wavelengths agreed with the a priori values. Thus, the HRC energy scale of the co-added spectrum was very accurately calibrated.
3.3 Wavebands
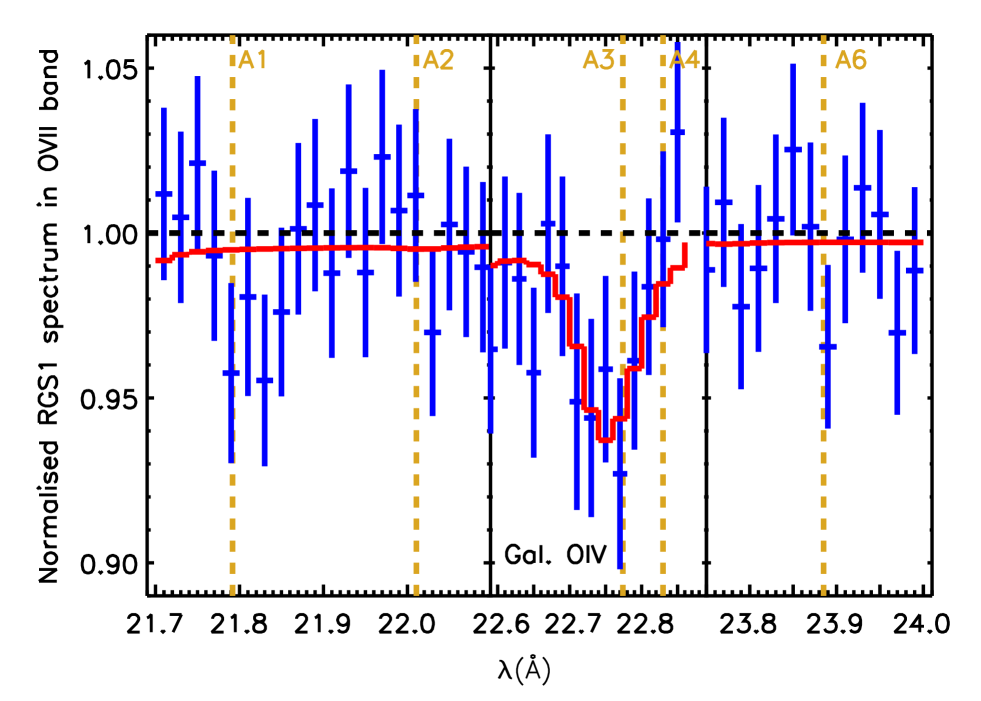
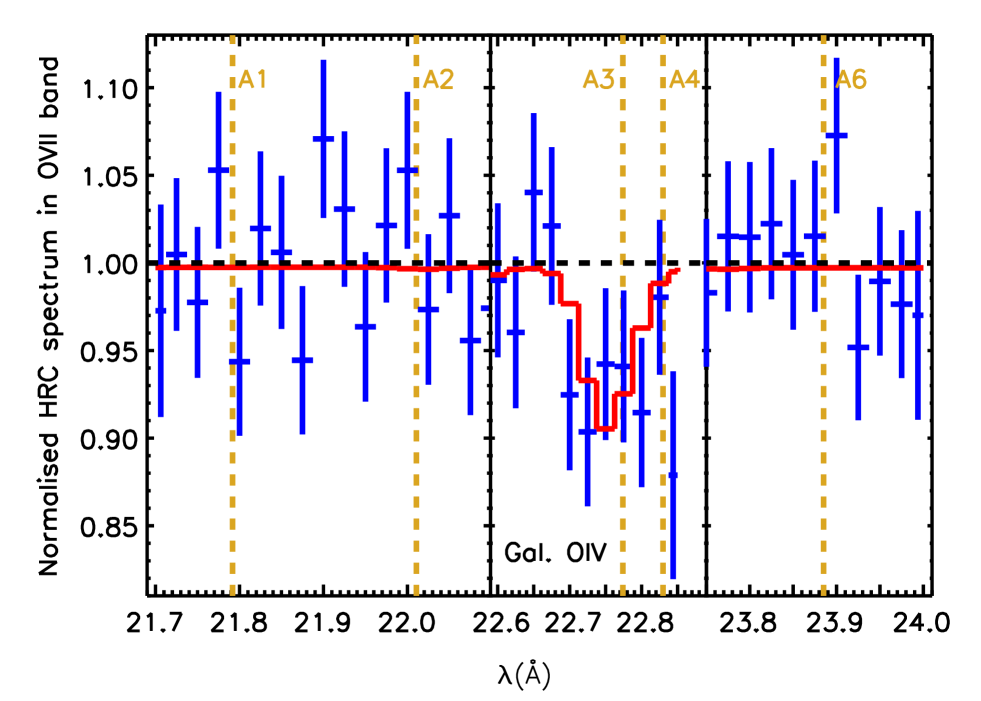
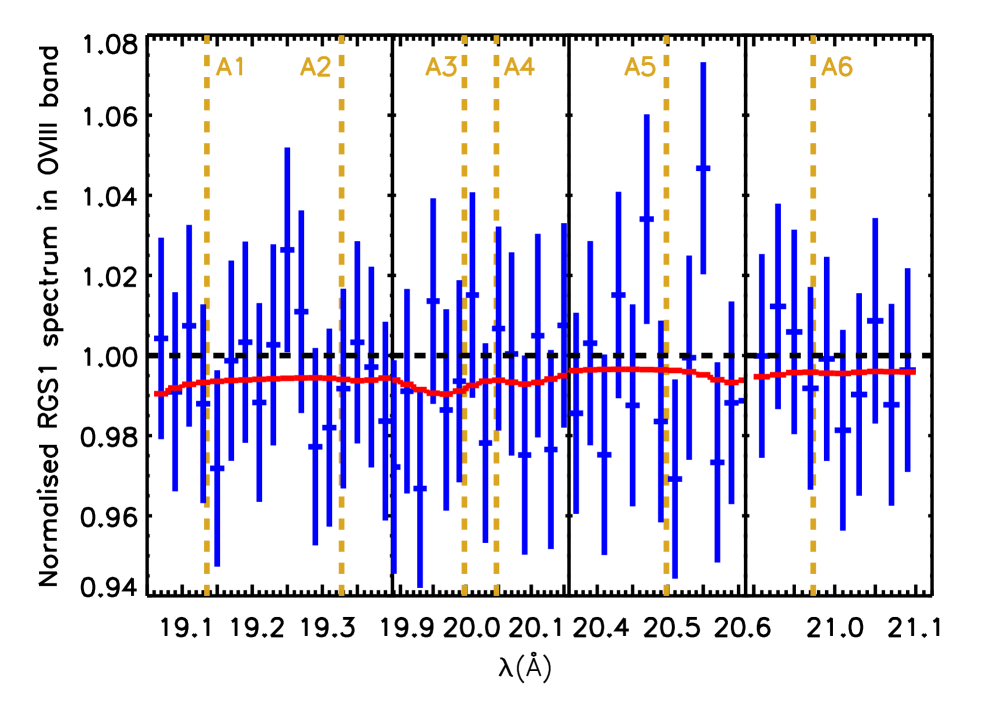
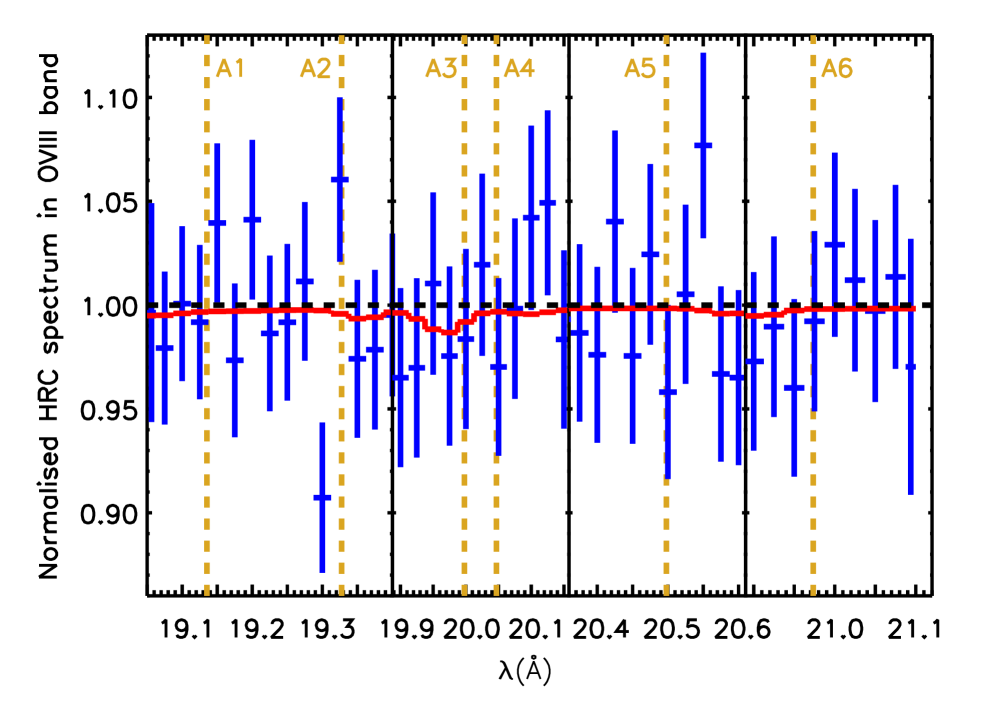
Our aim is to cover the possible O VII He and O VIII Ly lines, assuming the redshifts of the absorbers A1-A6 (see Table 1 for the wavelengths). We wish to select minimally wide bands around the above lines to simplify the continuum modelling, but wide enough to obtain a robust continuum level. We decided to confine the analyses within wavebands 21.7–24.0 Å (the O VII band) and 19.05–21.1 Å (the O VIII band).
We excluded some problematic channels, as described in the following. In both RGS1 and HRC the wavelength of the A5 O VII absorber ( 23.34 Å) coincides with the instrumental absorption feature (de Vries et al. 2003, 2015) rendering the measurement inaccurate. We thus excluded the 22.85–23.6 Å band from both spectra and consequently we will not analyse the possible A5 O VII. Due to the RGS1 CCD4-5 gap we excluded the 20.75–20.90 Å band from the RGS1 analysis. Fortunately none of our candidate lines has the centroid in that band. There is excess of HRC data on top the otherwise smooth continuum at 19.74–19.85 Å which cannot be adequately fitted. We thus excluded the HRC data in this band which does not contain any of the tested lines.
3.4 Galactic absorption
For the ionised Galactic absorption, we adopted the Nevalainen et al. (2017) model: the hot halo (HH) and the transition temperature gas (TTG),
manifested as O IV, O V, O VII, O VIII, N VI,C VI and Ne IX absorption lines, were modelled
as two CIE absorbers (a model called hot in SPEX). We allowed the parameters of these components to vary within the statistical 1 uncertainties
as derived from RGS1 data in Nevalainen et al. (2017):
N(HHH) = 2.40.3 cm-2,
kTHH = 1.70.1 keV,
N(HTTG) = 1.00.2 cm-2,
kTTTG = 1.40.1 keV.
We assumed the element number density ratios from Lodders & Palme (2009) and that the metal abundance is Solar.
We constrained the non-thermal broadening velocity to 15–35 km s-1, as in (Nevalainen et al. 2017) based on the FUV measurements of Wakker (priv. comm.).
For the LETG/HRC, we additionally included the neutral Galactic disc absorber consisting of atomic and molecular components which have been used to correct for the cold Galactic absorption when processing the RGS spectra (see Nevalainen et al. (2017) for details).
The band passes occupied by the possible O VII line due to A3 and A4 overlap with that of the Galactic O IV line (see Nevalainen et al. (2017) for the discussion of the identification of the line as Galactic O IV). However, since we used priors in the Galactic absorber model (see above), the fit converged to a minimum.
3.5 Blazar emission
The RGS spectra have already been normalised to the PKS 2155-304 continuum, i.e. the PKS 2155-304 emission absorbed by the cold Galactic component, see Nevalainen et al. (2017). Thus, we modelled here the RGS blazar emission with a constant, which we allowed to vary in order to accommodate for the statistical uncertainties of the continuum modelling.
The emission spectrum of PKS 2155-304 as measured with HRC was adequately modelled in the O VII band with a power-law. In the WHIM analysis below, we allowed the normalisation and the photon index of the power-law component to vary. However, in the case of the HRC O VIII band the continuum was more complicated. We modelled that with a spline model with a constant grid size of 300 mÅ. Allowing all the spline parameters to be free in the WHIM analysis allowed too much freedom to the model in the sense that some of the tested lines were significantly affected. Thus we fixed the spline parameters to their best fit values in order to maintain the continuum shape and allowed only the normalisation of the continuum to vary.
3.6 WHIM lines
In order to examine the possible WHIM lines, we added a SPEX model called slab to the continuum model described above. “Slab” calculates the transmission of a thin slab of material whose ion column densities can be varied independently, i.e. the ion ratios are not determined by the ionisation balance. The Lorentz component of the final Voigt profile is calculated for each transition in the SPEX atomic data base for a given ion, while the Gaussian component is calculated based on the input value of the total velocity dispersion (thermal and non-thermal). We fixed the total broadening to 100 km s-1, which corresponds to the pure thermal broadening of oxygen at T = 107 K. Thus, in the case of significant non-thermal broadening, our measurements of the column densities of O VII and O VIII are somewhat overestimated. We get back to this point when discussing the measurements below.
We fitted the data of each instrument separately, fixing the slab model wavelength to that of either O VII He or O VIII Ly, applying one of the adopted X-ray redshifts at a time for a given fit (see Table 1). The column density of a given ion was the only free parameter.
We obtained the best-fit values and the uncertainties (including both the statistical and the systematic 2% of the flux) of the column densities by the minimisation. We used these models to calculate the equivalent width and its uncertainties (EW) of each tested line and used the ratio EW / as a measure of its detection significance.
3.7 Results
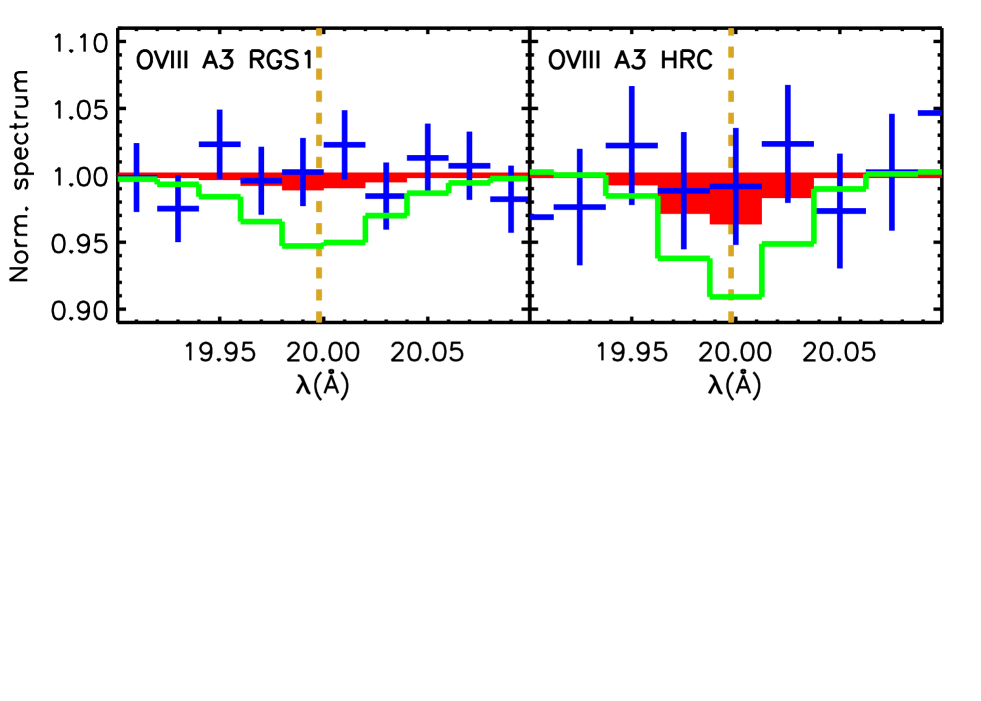
We found that none of the tested lines was detected significantly with RGS1 or HRC (see Figs. 1 - 4 and Table 2). The upper limits333The obtained upper limits for the column densities may be slightly overestimated due to neglected, possible non-thermal velocities. of a few mÅ correspond to O VII and O VIII level of cm-2. We discuss the implications of these results in Section 5.
The underlying assumption in the above analysis was that the warm and hot WHIM are co-located and at rest (or moving with the same velocity), so that zX-ray = zFUV. We next relaxed this assumption by allowing a relative projected sight line velocity difference up to 600 km s-1 (i.e. = 0.002) between the FUV and X-ray absorbers, while co-located. In practise, we repeated the above fits, but shifting the test line centroid by 40 mÅ in steps of 20 mÅ. This resulted in no significant change in the results444We found marginal (2 ) indication for O VII absorption at z = 0.01010.0006 in the RGS1 data. The redshift change corresponds to velocity difference of 400 km s-1 compared to the FUV-based A1 X-ray test redshift..
4 O VIII Ly absorption at z0.054?
Before discussing the implications of the above results, we investigate here the widely reported line-like feature at 20 Å in the LETG/ACIS PKS 2155-304 spectrum, interpreted as O VIII Ly absorption at z=0.054-0.056 (see Table 3). The redshift of such line agrees with the range of values of the FUV lines associated with our A3 absorber (see Table 1). We use a notation O VIIIA3 for this line in the following.
4.1 Summary of earlier X-ray work
| Ref. | RGS1 | LETG/HRC | LETG/ACIS-S | |||||
| Exp. time | EWf𝑓ff𝑓fThe equivalent width is reported at 1 confidence level, | Exp. time | EWf𝑓ff𝑓fThe equivalent width is reported at 1 confidence level, | Exp. time | z | EWf𝑓ff𝑓fThe equivalent width is reported at 1 confidence level, | signif.g𝑔gg𝑔gThe significance of the detection. | |
| (ks) | (mÅ) | (ks) | (mÅ) | (ks) | (mÅ) | |||
| F02a𝑎aa𝑎aFang et al. (2002) | – | – | – | – | 80 | 0.0560.001 | 14.0 | 4.5 |
| C04b𝑏bb𝑏bCagnoni et al. (2004) | 110 | 7 | – | – | – | – | – | – |
| F07c𝑐cc𝑐cFang et al. (2007) | – | – | 200 | 5 | 280 | 0.0540.001 | 7.4 | 5.0 |
| W07d𝑑dd𝑑dWilliams et al. (2007), | – | – | 230 | 6 | 250 | 0.0560.001 | 7.5 | 3.5 |
| this worke𝑒ee𝑒eThe final sample, | 1200 | 1.3 | 310 | 2.1 | 330 | 0.05540.0004 | 6.2 | 3.2 |
Combining three observations with total exposure time of 80 ks obtained with LETG/ACIS-S, Fang et al. (2002) reported a 4.5 detection of an absorption line at = 20.020.02 Å and interpreted that as O VIII Ly absorption at z = 0.0560.001 (see Table 3 for the summary of different measurements). This was contrasted by Cagnoni et al. (2004) who studied 110 ks of RGS1 data of PKS 2155-304 and did not detect the line, despite of the longer exposure and higher effective area. An another analysis with LETG/ACIS data (Fang et al. 2007), this time with a larger exposure time of 280 ks, compared to that in Fang et al. (2002), yielded a 5.0 detection of an absorption line at = 20.000.01 Å, consistent with the O VIII Ly line at z = 0.0540.001. The equivalent width of the line is consistent with that of Fang et al. (2002) value within the uncertainties at 90% confidence level. Williams et al. (2007) analysed a LETG/ACIS data set, largely overlapping with Fang et al. (2007), and detected an absorption line at 3.5 confidence level at = 20.030.01 Å, i.e. at a bit higher wavelength (2 ) than Fang et al. (2007), corresponding to z = 0.0560.001 if interpreted as the O VIII Ly line. The equivalent widths agree very well in the two works. They also analysed 230 ks of LETG/HRC data, which however did not yield a significant detection.
4.2 Our results
We used our RGS1 non-detection of O VIIIA3 i.e. EW(O VIIIA3) 1.3 mÅ (Table 2), to estimate the upper limit for the column density as . This is by a factor of four smaller than the lower limit reported by Fang et al. (2007) and Williams et al. (2007) obtained with LETG/ACIS (Table 3). Also our LETG/HRC analysis yielded only an upper limit of EW(O VIIIA3) 2.1 mÅ, significantly lower than the reported LETG/ACIS detections (see Fig. 5 and Table 3). We investigate in the following what might be causing such large discrepancies.
4.3 RGS issues
As discussed in Section 4.1, the previous XMM-Newton/RGS work of a subsample of our data (Cagnoni et al. 2004) yielded no detection of O VIIIA3, while the upper limit for the equivalent width was inconsistent with the LETG/ACIS detections of Fang et al. (2007) and Williams et al. (2007). Our RGS analysis contains a lot more data and differs in several ways from the above RGS work (Cagnoni et al. 2004). Yet, the results are consistent in the sense that neither detected the O VIIIA3 line, indicating no significant systematic uncertainties in either RGS results.
4.3.1 Co-addition
However, co-addition of a large number of spectra, 25 in our case, may be problematic considering weak unresolved lines. In order to examine the robustness of our results we now repeated our O VIIIA3 analysis, but this time instead of co-adding the 25 RGS1 residual spectra, see Nevalainen et al. (2017) for the information on the observation identification codes), we analysed them jointly. Here we started from the archival data and processed them with the standard procedures available in Oct 2017, differently from the procedure described in section 3. In detail, we fitted the 19.05–20.2 Å continua with a power-law model, allowing the normalisations to vary, independently from each other. We adopted the galactic absorption model described in section 3.4. We added a slab component for O VIII absorption redshifted by z0.055. linking the column density equal in all spectra. The result is EW(O VIII) 0.9 mÅ, very similar to what we derived using the co-added RGS1 spectrum EW(O VIII) 1.3 mÅ. Thus, we conclude that we have not missed a significant O VIII Ly line at z = 0.055 due to possible co-addition problems in the RGS1 data. The close similarity of the two results also demonstrates that the non-standard processing of the RGS data we adopted for our work see Nevalainen et al. (2017) for details) does not produce significant problems.
4.4 LETG/ACIS issues
The fact that the LETG/ACIS is the only instrument combination that has yielded significant detections of O VIIIA3 indicates significant systematic uncertainties in the LETG/ACIS data. Thus, we investigated next the hypothesis that the LETG/ACIS O VIIIA3 detections are actually due to a line-like artifact in the LETG/ACIS data as analysed by Fang et al. (2007) and Williams et al. (2007).
4.4.1 Aim point offset
As discussed by Fang et al. (2007) and Williams et al. (2007), most of the observations they used have been obtained with an aim point offset of y = +1.5 arcmin. Such configuration places the tentative positive first order 20.0 Å line close to the boundary between nodes 2 and 3 in the S3 chip. The standard dithering of the spacecraft (16 arcsec peak-to-peak i.e. 1 Å) will fill the gap with photons. Depending on the completeness of the procedure, the calibration of the effective area at 20.0 Å may be less accurate than at other wavelengths.
Fang et al. (2007) presented following arguments against significant calibration artifacts at 20.0 Å. Firstly, the tentative negative first order = 20.0 Å line, when using the above offsets, is safely outside the node boundary. Yet, according to Fang et al. (2007) the line is clearly visible in both positive and negative first order data. Unfortunately they did not report the wavelengths or EW measurements for these lines. Secondly, the 20.0 Å line obtained with observation 3669, which has been carried out with an exceptionally large offset (y = +3.3 arcmin), lands at a very different detector location compared to the other observations. However, this argument is not developed to the point of comparing the results obtained with this observation with the rest of the sample.
4.4.2 Methods
We examined the above arguments by re-analysing the LETG/ACIS data used by Fang et al. (2007) and Williams et al. (2007). The data used in the two works are almost the same, with the exceptions that the latter did not include the very high offset observation 3669 (42 ks), and they included an additional observation 3668 (14 ks). Also, Williams et al. (2007) did not shift the energy scales of the two observations as Fang et al. (2007). Yet, the two works yielded a significant detection of O VIII at z 0.054–0.055 with consistent EW values.
We processed the data with the current public CIAO processing pipeline tool , and for co-adding the +1 and -1 order data we used the tool . We used a bin size of 25 mÅ as in Fang et al. (2007). The inclusion of the 2% systematic uncertainties (see Section 3) had no significant effect because the statistical uncertainties are larger due to shorter exposure and lower effective area compared to that of RGS.
As in the case of RGS and HRC (see section 3.2) we examined here the wavelength scale calibration accuracy of each LETG/ACIS co-added spectrum using Galactic lines. We then fitted the 19-21 Å band continuum with a spline model666In case of the O VIIIA3 line, the usage of the more complex continuum, including the Galactic absorbers as in section 3.4, yielded a negligible effect on the O VIII equivalent width in the narrow band we used. with a grid step of 0.75 Å to mimic the continuum modelling of Fang et al. (2007), where the polynomial fits effectively removed features broader than 0.7 Å. We then added a redshifted O VIII slab model to investigate the tentative WHIM line.
4.4.3 Tests with Williams et al. (2007) sample
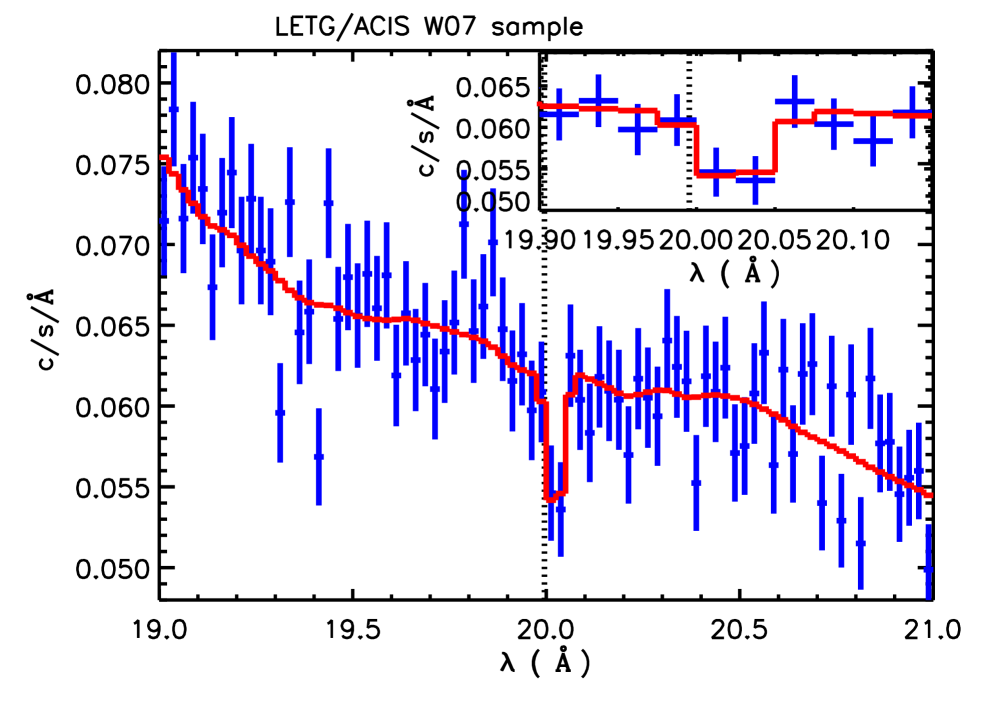
The Galactic O I and O VII lines in our co-added Williams et al. (2007) sample spectrum were unambiguously detected and indicated that the wavelength scale is very accurate, i.e. a possible shift is smaller than the statistical uncertainties of 6 mÅ, similarly as in Williams et al. (2007). The WHIM O VIII modelling of the 19–21 Å band data yielded a significant (3.6 ) detection of a line at = 20.030.01, identical with Williams et al. (2007) (see Fig. 6). Our EW = mÅ is consistent with Williams et al. (2007) (EW = 7.52.1 mÅ).
We then examined, whether the above detection may be an artifact produced by the node boundary (see above). We utilised the argument that the tentative 20 Å line in the positive and negative first order spectrum lands at a very different region of the detector. Thus, possible consistence of the wavelengths and equivalent widths of the lines in both orders would indicate a true astrophysical origin for the line. We used the same sample as (Williams et al. 2007), but this time separately for the positive and negative first order co-added spectra.
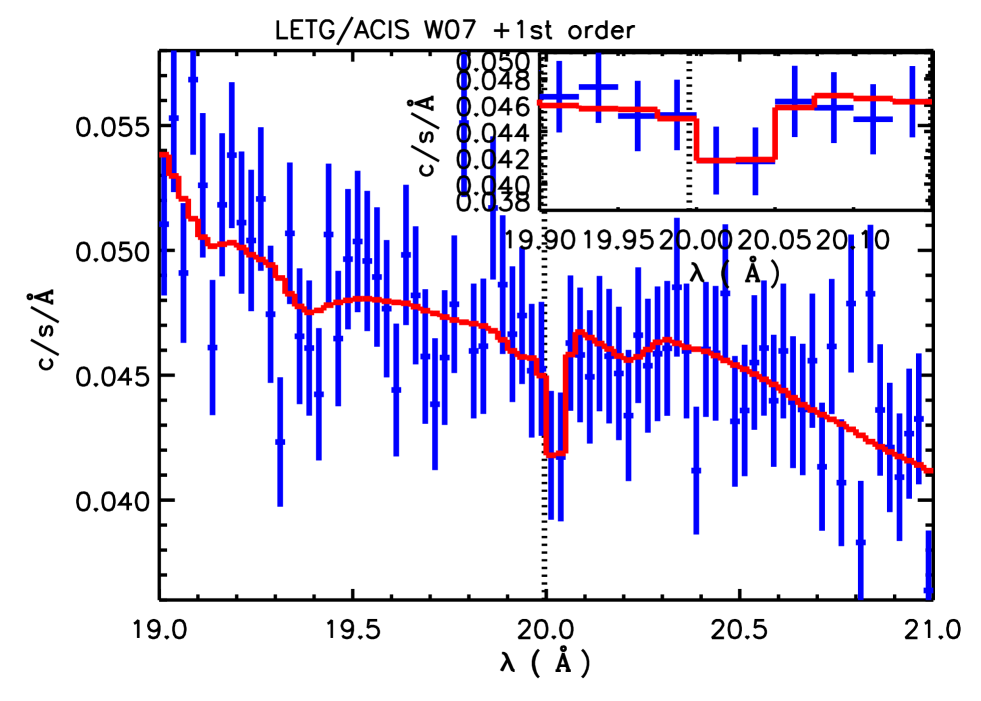
In the case of the positive order, the Galactic lines did not allow a significant wavelength scale shift. Around 20 Å the data indicated a line-like feature at = 20.030.01, i.e. identical to that found when using the co-added positive and negative first order spectra above. The equivalent width measurement of 6.52.7 mÅ yields a detection significance of 2.4 (see Fig. 7).
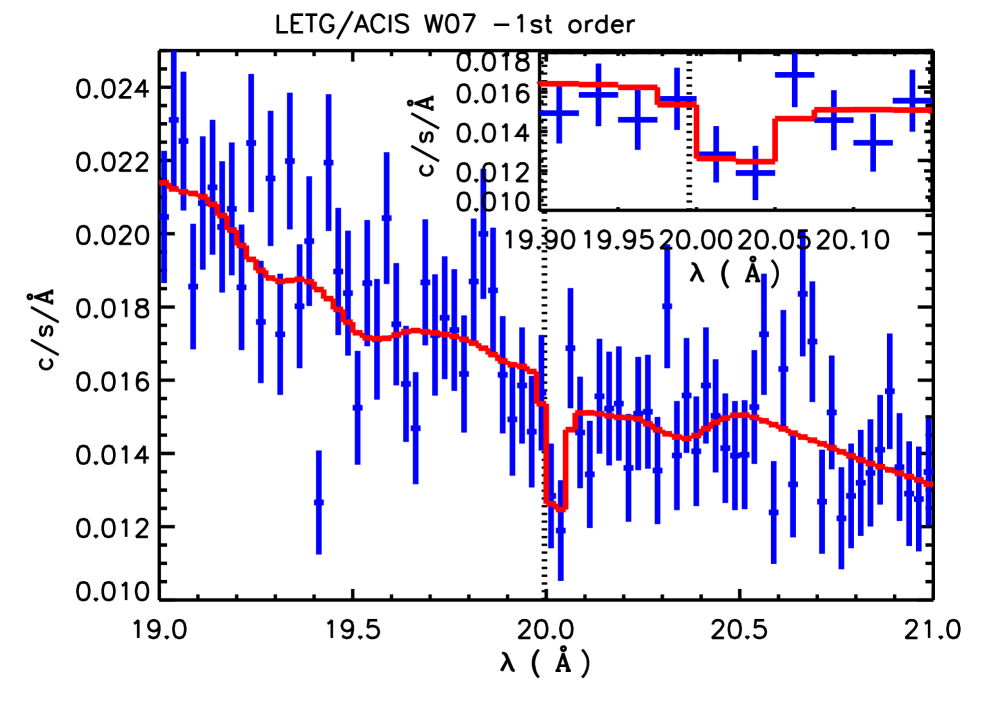
In case of the negative order, no Galactic line was unambiguously detected. At the vicinity of 20 Å we detected an absorption line at = 20.020.01 Å consistently with the positive order (see Fig. 8). We measured EW = 13.45.0 mÅ for this line, (2.8 ), consistently with the positive order.
While the statistical significances of the positive and negative order lines are not very high individually, their centroids are consistent within 1-3 with that of O VIII Ly (20.00 Å) at z=0.05425, the redshift of FUV absorber A3 (see Table 1). This match will improve the probability of the line feature being a true astrophysical signal (see below).
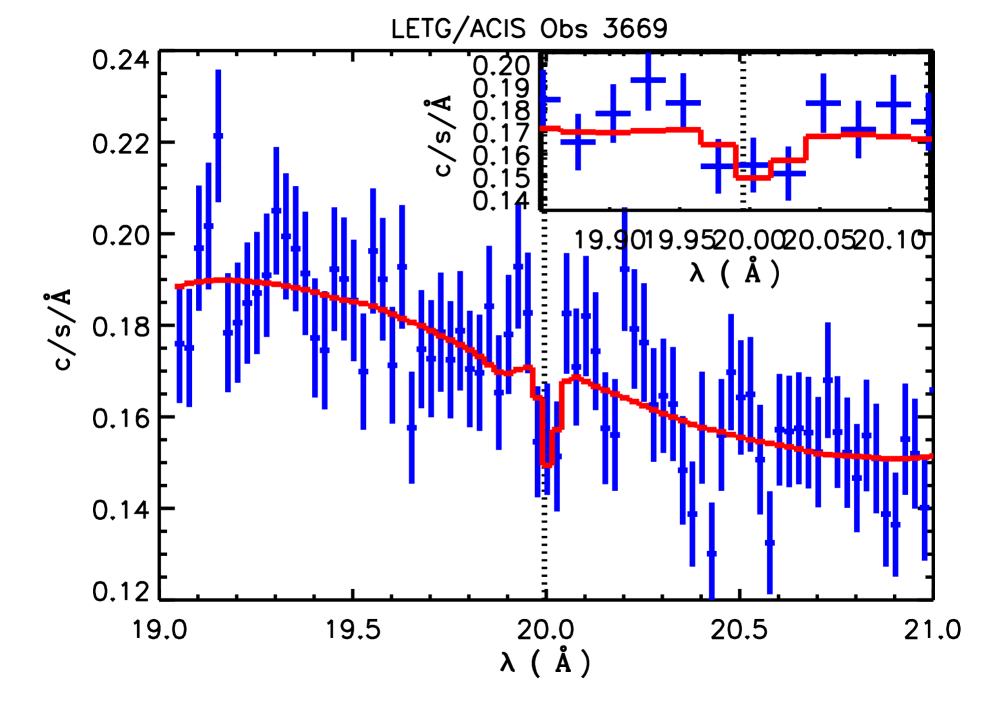
4.4.4 Tests with the large offset observation 3669
We then utilised the Fang et al. (2007) argument that the 20 Å line in the large off-axis observation 3669 lands at a different detector region, compared to the above lower offset sample case, and thus is not affected by the same node boundary. Thus it is very unlikely that random fluctuations would yield consistent lines using observation 3669 and the Williams et al. (2007) sample above.
The centroid of the Galactic O I (O VII was not useful) absorption line in observation 3669 was significantly shifted towards lower wavelengths by 4010 mÅ. Such a large wavelength shift may be due to complications of the calibration of large offset observations.
At wavelengths around 20 Å we found a 2.2 indication for an absorption line at Å (see Fig. 9). Since 20 Å photons land quite far from the FOV centre in such a high offset observation, the energy resolution is degraded. This is seen via the broad, 75 mÅ wide feature in the data (see Fig. 9). Due to the different amount of broadening at different offset angles, it is important not to co-add observations with different offsets. The energy redistribution function shows a similarly broad feature, indicating that the off-set line spread function is well calibrated. Using the slab model we measured EW = mÅ for this line (no additional broadening required) which is consistent with our measurement using the Williams et al. (2007) sample, see section 4.4.3. Shifting the line centroid by +4010 mÅ, as indicated by the Galactic OI, the corrected wavelength Å of the O VIII line is consistent with that derived above using the Williams et al. (2007) sample.
While the statistical significance of the line detection is quite low, its wavelength consistence with that of O VIII Ly at the redshift of the FUV absorber A3 renders this test indicative that the line is a true astrophysical signal.
| sample | EW | |
|---|---|---|
| Å | mÅ | |
| W07a𝑎aa𝑎aThe observations used in Williams et al. (2007), positive and negative first orders co-added. | 20.030.01 | 8.22.3 |
| W07+b𝑏bb𝑏bThe observations used in Williams et al. (2007), but only positive first order. | 20.030.01 | 6.52.7 |
| W07-c𝑐cc𝑐cThe observations used in Williams et al. (2007), but only negative first order. | 20.020.01 | 13.45.0 |
| 3669d𝑑dd𝑑dThe large pointing offset observation 3669. | 20.01g𝑔gg𝑔gAfter correcting the wavelength scale as indicated by the shift of the wavelength of the Galactic O I line. | 6.93.2 |
| finale𝑒ee𝑒eUsing all the public data in Oct 2017 obtained with y = +1.5 arcmin and SIM-Z = -8 mm. | 20.020.01 | 6.01.9 |
| final & 3669 f𝑓ff𝑓fCombining the results of the final sample and of the observation 3669. | 20.020.01 | 6.21.7 |
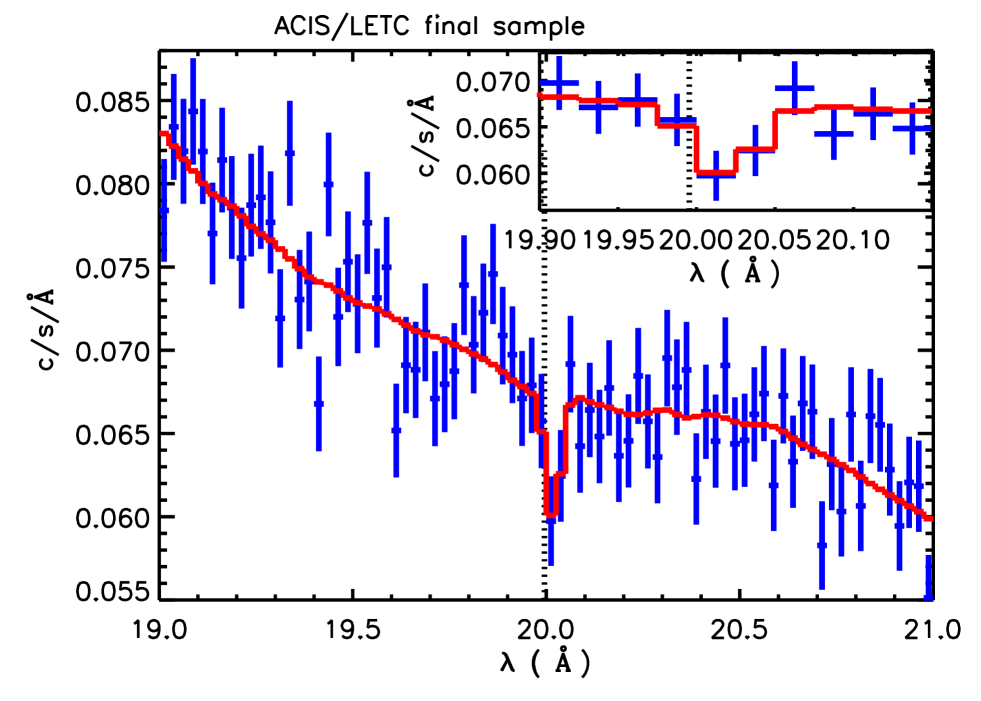
4.4.5 The final sample
We then utilised the additional useful observations of PKS 2155-304 obtained after the works published by Williams et al. (2007) and Fang et al. (2007), available in Oct 2017 (Table 5). Due to the indicated problems with the large offset pointing wavelength scale calibration (see section 4.4.4) we selected only the observations obtained with the same offset setting as in the above works, i.e. y = +1.5 arcmin and SIM-Z = -8 mm. Our co-added spectrum has an exposure time of 330 ks. The study of the wavelengths of the Galactic O I and O VII lines allowed no wavelength scale shift. We significantly detected a line at z=0.05540.0004 or = 20.020.01 Å (see Fig. 10) with EW = 6.01.9 mÅ (3.2 ), consistently with our analysis of the observation 3669 (see section 4.4.4).
We did not co-add the data from the observation 3669 to that of the final sample due to the indicated significant wavelength shift. Since PKS 2155-304 was very bright during the observation 3669, it has significant statistical weight compared to the final sample. We thus combined the measurements of the equivalent width using the spectra of the final sample and the observation 3669 into an error weighted average, obtaining EW = 6.21.7 for the 20 Å line which is thus detected at a quite high statistical significance of 3.7 .
| OBS. ID. | Exposure (ks) |
|---|---|
| 2335 | 29 |
| 3168 | 29 |
| 3668 | 13 |
| 3707 | 27 |
| 4416 | 46 |
| 6090 | 28 |
| 6091 | 29 |
| 6874 | 28 |
| 6924 | 9 |
| 6927 | 27 |
| 7293 | 9 |
| 8388 | 29 |
| 10662 | 28 |
4.5 Summary
Our measurements of the positive and negative orders of the Williams et al. (2007) sample and the large offset observation 3669 yielded consistent wavelengths and equivalent widths for the O VIII Ly line, indicating that the systematic uncertainties are small. Thus, our tests indicated that the feature is very likely a true astrophysical signal. The assumption that the ACIS measurement is true can be formulated as a null hypothesis that by change the ACIS measurement agrees with the non-detection of RGS1 ( 0.9 mÅ). Applying the statistics to the ACIS analysis yielded a very low 0.7% probability for such situation. The random probability would become even smaller when considering the matches obtained with the above tests of positive and negative orders and the offset observation which cannot be derived analytically.
On the other hand, it is also very unlikely that 1.2 Ms of RGS1 data and 300 ks of HRC data could have missed a true O VIII Ly line (see section 4.3) with EW = 6 mÅ, as measured with ACIS. The application of the statistics to the RGS1 analysis yielded that such incidence has a 0.006% probability.
Complicated and extensive simulations would be needed to improve the accuracy of the above probabilities. However, we think that this is not useful since both values would be extremely high, and thus we could not conclude which case is significantly better. Thus, given the very convincing X-ray spectral evidence for and against the existence of the 20 Å absorption line, we cannot conclude whether or not the feature is a true astrophysical line.
5 Discussion
5.1 About the spatial co-incidence of O VII absorbers at the location of O VI absorbers
In this work we assumed the co-location of the warm and hot WHIM in order to enable the usage of the robustly detected warm WHIM in the FUV band as a tracer of the cosmologically interesting hot WHIM. We performed an X-ray follow-up of the O VII line in the PKS 2155-304 sight line at the two redshifts where the previous FUV observations (Tilton et al. 2012) have yielded O VI detections at the level of . We obtained no significant detection and upper (RGS1) limits of 14.5 and 15.2888The value is higher due to complications with the overlapping Galactic O IV line for the two absorbers, i.e. A3 and A4 (see Table 2 and Fig. 1).
Considering the simulations of Cen (2012) the basic problem in our work is the shortness of the studied redshift path, dz=0.1. The above simulations indicated about one O VI absorber with and one O VII absorber at the level of within our path length on average. The observational values for the above absorbers are two (O VI) and zero (O VII), similar to the prediction. Additionally, in the above simulation (Cen 2012), the probability of finding an absorber with at the location of an absorber with is less than 10%. Thus, we should increase the studied path length at least by an order of magnitude to get a meaningful sample for comparisons with the simulations. As we demonstrated in this work, the study of the O VII line at even a small path length at the level is very challenging. The requirements for the signal-to-noise with the current instruments translate into very long exposures of several 100 ks. We plan to probe systematically the current archival high resolution X-ray spectra at the locations of the FUV-detected warm WHIM in a future work.
5.2 LETC/ACIS 20 Å feature
The LETG/ACIS feature at 20 Å in our final sample (see Fig. 10), if interpreted as being due to O VIII at absorber A3 (z), corresponds to . At consistent redshifts there is very securely detected FUV absorption (see Table 1) yielding (Tilton et al. 2012). The simulations of Cen (2012) indicate that in such a small redshift path as studied in our work (dz0.1) there should be on average only 0.1 O VII absorbers with column density exceeding cm-2. Since the IllustrisTNG simulations (Nelson et al. 2017) indicate that clustering of O VIII ions in the Mpc scales is an order of magnitude smaller than that of O VII ions, the probability for finding O VIII absorbers is much smaller than that ( 10%) for O VII discussed above in Section 5.1. Thus, the probability of LETG/ACIS Å feature being due to astrophysical O VIII absorber co-located with the FUV-detected O VI absorber is at the very low level level of 0.1%.
Assuming that the LETG/ACIS Å feature is due to O VIII, the absence of significant O VII absorption at A3 indicates two distinct gas phases: the FUV-detected warm one with and the X-ray-detected hot one with . Such configuration is possible in the WHIM embedded in a large scale filament. Namely, the cosmological simulations e.g. EAGLE (Schaye et al. 2015) and IllustrisTNG (Nelson et al. 2017) suggest that the hottest WHIM is concentrated along filament axes while the warm WHIM occupies much larger surrounding volumes. Thus, most of the random sight lines are expected to contain only the warm FUV WHIM, consistent with the simulations of Cen (2012). We suggest that in few lucky incidences (as may be the case for A3, as well as for the Sculptor Wall (Buote et al. 2009; Fang et al. 2010) and 3C273 (J. Ahoranta et al., 2018, in preparation)) when the sight line passes very close to the filament axis, both warm and hot WHIM may be co-located and thus the FUV and X-ray spectra would exhibit WHIM absorption lines at similar redshifts.
Assuming that a) LETG/ACIS Å feature is due to O VIII embedded in the WHIM in an intervening large scale filament, b) the metal abundances in the A3 absorber are 0.1 Solar, c) the temperature of the WHIM is quite high K999If the temperature is higher, i.e. less optimal for O VIII production, the hydrogen density and thus the path length would become larger. to keep the O VII column density below the detection limit of cm-2 and d) that the system is in collisional ionisation equilibrium, the LETG/ACIS measurement corresponds to equivalent hydrogen column density level of cm-3. Such a hot model contains also lines from Ne IX (rest frame 13.447 Å) and Fe XVII (rest frame 15.014 Å). The Ne IX line is consistent with the ACIS data. The Fe XVII line is slightly overpredicted with such a model, but within the statistical uncertainties, the iron abundance is consistent with 0.1 Solar used for oxygen. Thus, the CIE modelling did not rule out the O VIII line.
Adopting the typical baryon overdensity range of 10-100 for the WHIM implies that the path through the WHIM should be in excess of 10 Mpc. This in turn requires a co-incidence of a major filament being oriented very closely along the sight line. We plan to address the puzzle of the A3 O VIII line in a future work by utilising the galaxy distribution around the possible X-ray absorber in order to detect or rule out a major galactic filament crossing the PKS 2155-304 sight line at the matching redshift.
5.3 Transient LETG/ACIS 20 Å absorption?
In the case of the blazar H2356-309, Fang et al. (2011) detected a transient O VIII absorption feature (duration 100 ks) at the surface of the blazar using LETG/HRC. The feature was found consistent with thermal instability of the absorber and with an outflow of absorbing material. We examine here whether a similar scenario could explain the LETG/ACIS detection of the line feature at 20 Å in the case of PKS 2155-304.
LETC/ACIS observation 3669 (not included in the Williams et al. (2007) sample, see Section 4.4.4) and the Williams et al. (2007) sample (Section 4.4.3) both show the line consistently. This can be interpreted as two distinct transients with similar strength. It is not very likely that one or two transient absorption events took place when LETG/ACIS was observing PKS 2155-304 , and none took place when RGS or LETG/HRC observed PKS 2155-304. Yet the epoch sampling of PKS 2155-304 with RGS and LETG is not frequent enough to rule out this possibility completely.
If the X-ray feature at 20 Å, measured with LETG/ACIS only, is due to O VIII at the blazar surface (z 0.12), the outflow velocity is dz c (1.12 - 1.05) c 20000 km s-1 towards us. Such ultra-fast outflows (UFOs) have been observed in the X-ray spectra of many Seyfert galaxies (e.g. Tombesi & Cappi (2014)). However, we are not aware of any detection of similarly fast outflow in a blazar, such as PKS 2155-304 .
Let’s assume that blazars have not been sufficiently surveyed to robustly rule out the UFO scenario for PKS 2155-304. However, the LETG/ACIS X-ray feature is too narrow and too weak compared to absorption lines measured in UFOs related to Seyferts (e.g. Tombesi & Cappi (2014)). Furthermore, in the UFO scenario the outflow at the blazar surface happens to have such a velocity that its combined effect with the Hubble velocity redshifts the O VIII line to 20 Å, which co-incides with the wavelength of O VIII if originating from an absorber with only Hubble velocity at the location of the FUV absorber A3 (O VI and two BLAs, see Table1).
In summary, given the above problems, it is very unlikely that the transient absorption explains the LETG/ACIS 20 Å feature.
6 Conclusions
We analysed all available useful high-resolution X-ray spectral data in the direction of the blazar PKS 2155-304 at the redshifts where FUV observations (Tilton et al. 2012) have obtained indication of the warm WHIM. The FUV measurements consist of two absorbers with , one with , and several BLA:s (H I broadened by b 40 km s-1) at the level of (see Table 1). The studied redshift path is dz0.1. The analysis yielded the following conclusions:
-
•
We did not obtain any significant detections of O VII He absorption lines, the most likely hot WHIM tracer, at the five (considering the O VI lines and BLAs) or two (considering only the O VI lines) FUV-based X-ray follow-up redshifts. The non-detections correspond to upper RGS1 limits of 14.5-15.2
-
•
At five of the six studied redshifts we did not detect any significant O VIII Ly absorption line. The upper limit is .
-
•
The LETG/ACIS combination yielded an significant (3.7) detection of an absorption line - like feature at 20 Å. If interpreting this as a true absorption line due to O VIII, its redshift matches one of the six FUV-based X-ray follow-up redshifts (z 0.054).
-
•
The data from RGS1 and LETG/HRC did not detect the LETG/ACIS 20 Å feature. Given the high statistical quality of the RGS1 data, the possibility of RGS1 accidentally missing the true line at 20 Å is very low, 0.006%.
- •
-
•
We cannot rule out completely the very unlikely possibility that the LETG/ACIS 20 Å feature is due to a transient event located close to the blazar.
Acknowledgements.
We acknowledge the support by the Estonian Research Council grants PUT246, IUT26-2, IUT40-2, and by the European Regional Development Fund (TK133 and MOBTP86). Thanks to the Chandra X-ray observatory HelpDesk. JN acknowledges the funds from a European Horizon 2020 program AHEAD (Integrated Activities in the High Energy Astrophysics Domain), and from FINCA (the Finnish Centre for Astronomy with ESO). Thanks to Jelle de Plaa for his help with the Spex analysis.References
- Branchini et al. (2009) Branchini, E., Ursino, E., Corsi, A., et al. 2009, ApJ, 697, 328
- Buote et al. (2009) Buote, D. A., Zappacosta, L., Fang, T., et al. 2009, ApJ, 695, 1351
- Cagnoni et al. (2004) Cagnoni, I., Nicastro, F., Maraschi, L., Treves, A., & Tavecchio, F. 2004, ApJ, 603, 449
- Cen (2012) Cen, R. 2012, ApJ, 753, 17
- Cen & Ostriker (1999) Cen, R. & Ostriker, J. P. 1999, ApJ, 514, 1
- Cui et al. (2012) Cui, W., Borgani, S., Dolag, K., Murante, G., & Tornatore, L. 2012, MNRAS, 423, 2279
- Cui et al. (2018) Cui, W., Knebe, A., Yepes, G., et al. 2018, MNRAS, 473, 68
- Danforth & Shull (2008) Danforth, C. W. & Shull, J. M. 2008, ApJ, 679, 194
- Danforth et al. (2016) Danforth, C. W., Stocke, J. T., France, K., Begelman, M. C., & Perlman, E. 2016, ApJ, 832, 76
- Davé et al. (2001) Davé, R., Cen, R., Ostriker, J. P., et al. 2001, ApJ, 552, 473
- de Vries et al. (2015) de Vries, C. P., den Herder, J. W., Gabriel, C., et al. 2015, A&A, 573, A128
- de Vries et al. (2003) de Vries, C. P., den Herder, J. W., Kaastra, J. S., et al. 2003, A&A, 404, 959
- Dolag et al. (2006) Dolag, K., Meneghetti, M., Moscardini, L., Rasia, E., & Bonaldi, A. 2006, MNRAS, 370, 656
- Fang et al. (2011) Fang, T., Buote, D. A., Humphrey, P. J., & Canizares, C. R. 2011, ApJ, 731, 46
- Fang et al. (2010) Fang, T., Buote, D. A., Humphrey, P. J., et al. 2010, ApJ, 714, 1715
- Fang et al. (2007) Fang, T., Canizares, C. R., & Yao, Y. 2007, ApJ, 670, 992
- Fang et al. (2002) Fang, T., Marshall, H. L., Lee, J. C., Davis, D. S., & Canizares, C. R. 2002, ApJ, 572, L127
- Kaastra et al. (1996) Kaastra, J. S., Mewe, R., & Nieuwenhuijzen, H. 1996, in UV and X-ray Spectroscopy of Astrophysical and Laboratory Plasmas, ed. K. Yamashita & T. Watanabe, 411–414
- Lehner et al. (2007) Lehner, N., Savage, B. D., Richter, P., et al. 2007, ApJ, 658, 680
- Lodders & Palme (2009) Lodders, K. & Palme, H. 2009, Meteoritics and Planetary Science Supplement, 72, 5154
- Nelson et al. (2017) Nelson, D., Kauffmann, G., Pillepich, A., et al. 2017, ArXiv e-prints [arXiv:1712.00016]
- Nevalainen et al. (2015) Nevalainen, J., Tempel, E., Liivamägi, L. J., et al. 2015, A&A, 583, A142
- Nevalainen et al. (2017) Nevalainen, J., Wakker, B., Kaastra, J., et al. 2017, A&A, 605, A47
- Nicastro et al. (2018) Nicastro, F., Kaastra, J., Krongold, Y., et al. 2018, Nature, 558, 406
- Nicastro et al. (2016) Nicastro, F., Senatore, F., Gupta, A., et al. 2016, MNRAS, 458, L123
- Richter et al. (2017) Richter, P., Nuza, S. E., Fox, A. J., et al. 2017, A&A, 607, A48
- Savage et al. (2014) Savage, B. D., Kim, T.-S., Wakker, B. P., et al. 2014, ApJS, 212, 8
- Schaye et al. (2015) Schaye, J., Crain, R. A., Bower, R. G., et al. 2015, MNRAS, 446, 521
- Sembach et al. (2003) Sembach, K. R., Wakker, B. P., Savage, B. D., et al. 2003, ApJS, 146, 165
- Shull et al. (1998) Shull, J. M., Penton, S. V., Stocke, J. T., et al. 1998, AJ, 116, 2094
- Shull et al. (2012) Shull, J. M., Smith, B. D., & Danforth, C. W. 2012, ApJ, 759, 23
- Shull et al. (2003) Shull, J. M., Tumlinson, J., & Giroux, M. L. 2003, ApJ, 594, L107
- Stocke et al. (2013) Stocke, J. T., Keeney, B. A., Danforth, C. W., et al. 2013, ApJ, 763, 148
- Stocke et al. (2014) Stocke, J. T., Keeney, B. A., Danforth, C. W., et al. 2014, ApJ, 791, 128
- Tilton et al. (2012) Tilton, E. M., Danforth, C. W., Shull, J. M., & Ross, T. L. 2012, ApJ, 759, 112
- Tombesi & Cappi (2014) Tombesi, F. & Cappi, M. 2014, MNRAS, 443, L104
- Wakker et al. (2003) Wakker, B. P., Savage, B. D., Sembach, K. R., et al. 2003, ApJS, 146, 1
- Williams et al. (2007) Williams, R. J., Mathur, S., Nicastro, F., & Elvis, M. 2007, ApJ, 665, 247
- Williams et al. (2013) Williams, R. J., Mulchaey, J. S., & Kollmeier, J. A. 2013, ApJ, 762, L10
- Yao et al. (2009) Yao, Y., Tripp, T. M., Wang, Q. D., et al. 2009, ApJ, 697, 1784