On the Detection of Supermassive Primordial Stars
Abstract
The collapse of supermassive primordial stars in hot, atomically-cooled halos may have given birth to the first quasars at 15 - 20. Recent numerical simulations of these rapidly accreting stars reveal that they are cool, red hypergiants shrouded by dense envelopes of pristine atomically-cooled gas at 6,000 - 8,000 K, with luminosities 1010 . Could such luminous but cool objects be detected as the first stage of quasar formation in future near infrared (NIR) surveys? We have now calculated the spectra of supermassive primordial stars in their birth envelopes with the Cloudy code. We find that some of these stars will be visible to the James Webb Space Telescope (JWST) at 20 and that with modest gravitational lensing Euclid and the Wide-Field Infrared Space Telescope (WFIRST) could detect them out to 10 - 12. Rather than obscuring the star, its accretion envelope enhances its visibility in the NIR today by reprocessing its short-wavelength flux into photons that are just redward of the Lyman limit in the rest frame of the star.
Subject headings:
quasars: general — black hole physics — early universe — dark ages, reionization, first stars — galaxies: formation — galaxies: high-redshift1. Introduction
Supermassive primordial stars (SMSs) may have been the origin of the first quasars, a few of which have now been discovered at 7 (Mortlock et al., 2011; Bañados et al., 2018). These stars are thought to form in primordial halos exposed to either unusually strong Lyman-Werner (LW) UV fluxes (Agarwal et al., 2016) or highly supersonic baryon streaming motions (Hirano et al., 2017; Schauer et al., 2017). Either one can prevent primordial halos from forming stars until they reach masses of 107 - 108 and virial temperatures of 104 K that trigger rapid atomic cooling and catastrophic baryon collapse at central infall rates of up to 1 yr-1 (Bromm & Loeb, 2003; Lodato & Natarajan, 2006; Wise et al., 2008; Regan & Haehnelt, 2009; Latif et al., 2013).
Stellar evolution models show that Population III (Pop III) stars growing at these rates can reach masses of a few 105 . Most then collapse to black holes (direct collapse black holes, or DCBHs; Umeda et al., 2016; Woods et al., 2017; Haemmerlé et al., 2018a) via the general relativistic (GR) instability, although a few non-accreting stars have been found to explode as highly energetic thermonuclear transients (Whalen et al., 2013a; Johnson et al., 2013a; Whalen et al., 2013b, 2014; Chen et al., 2014). Pop III SMSs are currently the leading contenders for the seeds of the earliest supermassive black holes (SMBHs) because the environments of ordinary Pop III star BHs are less conducive to their rapid growth (Whalen et al., 2004; Alvarez et al., 2009; Whalen & Fryer, 2012; Smith et al., 2018). DCBHs are born with large masses in high densities in host galaxies that can retain their fuel supply, even when it is heated by X-rays (Johnson et al., 2013b).
 |
 |
What are the prospects for detecting SMSs at high redshifts? Hartwig et al. (2018) found that the relics of such stars would be uniquely identifiable with the gravitational wave detector LISA at 15 if they form in binaries. Johnson et al. (2012) examined some spectral features of hot, blue, rapidly-accreting SMSs and found that they would be characterized by strong Balmer emission and the conspicuous absence of Ly lines due to absorption by their envelopes. The source of this flux was not the star but its hypercompact H II region, whose ionizing radiation was trapped close to its surface by the density and ram pressure of the inflow (which was also found to be true in cosmological simulations of highly resolved atomically cooled halos; Becerra et al., 2018). Freese et al. (2010), Zackrisson et al. (2010b) and Zackrisson et al. (2010a) calculated the spectral signatures of hot, blue Pop III ’dark stars’, supermassive primordial stars powered by the self-annihilation of weakly-interacting dark matter rather than by nuclear fusion. They found that such objects might be visible even to telescopes on the ground today, primarily because of their high surface temperatures (20,000 - 30,000 K), larger masses (up to 107 ) and longer lives (up to 107 yr).
But several studies have now shown that rapidly accreting Pop III stars generally evolve as cool, red hypergiants along the Hayashi limit with surface temperatures of 5,000 - 10,000 K (Hosokawa et al., 2013). Haemmerlé et al. (2018b) found that such stars can reach luminosities that could in principle be visible to JWST (Kalirai, 2018), Euclid, WFIRST and extemely large telescopes (ELTs) on the ground. However, they are shrouded by dense accretion flows that reprocess radiation from the star, perhaps suppressing its flux in the NIR today. Detecting SMSs at high redshift would capture primordial quasars at the earliest stages of their development and reveal one of their channels of formation. Here, we calculate NIR luminosities for Pop III SMSs in their accretion envelopes whose structures are taken from a high-resolution cosmological simulation. We describe our models in Section 2, calculate SMS spectra and NIR magnitudes in Section 3 and conclude in Section 4.
2. Numerical Method
 |
 |
 |
 |
Rest frame spectra for the star in its envelope are calculated with Cloudy (Ferland et al., 2017) with envelope profiles taken from a simulation of the collapse of an atomically-cooled halo done with Enzo (Bryan et al., 2014). The spectra are then redshifted, dimmed, and convolved with a variety of filter functions to obtain AB magnitudes in the NIR as a function of SMS redshift. We consider stars accreting at 0.1 and 1.0 yr-1 whose properties are listed in Tables A3 and A2 of Haemmerlé et al. (2018b), respectively. Bolometric luminosities, , and effective temperatures, , for both stars are shown in Figure 1.
2.1. Enzo Envelope Model
The halo in which the SMS is assumed to form was evolved in a 1.5 Mpc box in Enzo from 200 down to 17.8, when it reaches a mass of 2.7 107 and begins to atomically cool and collapse. It is centered in three nested grids for an initial effective resolution of 20483, and we allow up to 15 levels of refinement for a maximum resolution of 0.014 pc. The grid is initialized at 200 with cosmological parameters taken from the second-year Planck release: , , , , , and (Planck Collaboration et al., 2016). To approximate the presence of a strong LW background, we evolve the halo without H2, just H, H+, e-, He, He+ and He++ (Smith et al., 2017b). Cooling by collisional ionization and excitation of H and He, bremsstrahlung, and inverse Compton scattering are all included in the energy equation.
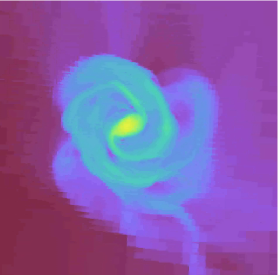
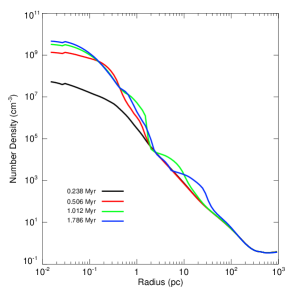
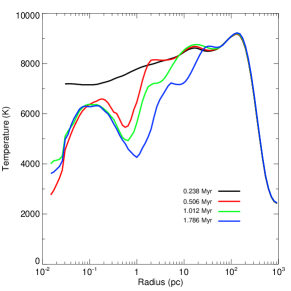
As shown in the upper left panel of Figure 2, a large atomically cooled disk forms at the center of the halo that is 2 pc in diameter and at 4,000 - 6,000 K at 0.625 Myr after the onset of collapse. A bar instability in the disk efficiently transports angular momentum out of its center, producing the large sustained accretion rates onto the star shown in the upper right panel of Figure 2. After a brief burst due to initial collapse and the formation of the disk, infall proceeds at rates of 0.4 - 0.6 yr-1. Spherically averaged density and temperature profiles of the halo are shown in the bottom two panels of Figure 2 at 0.238 Myr, 0.506 Myr, 1.012 Myr and 1.786 Myr.
2.2. Cloudy Spectra
We treat both stars as blackbodies (BBs) because they are relatively cool and have no absorption lines due to metals. Cloudy fits BB spectra to each star from and , which we take to be 1.26 109 and 6653 K for the 0.1 yr-1 star and 3.92 109 and 8241 K for the 1.0 yr-1 star. These values correspond to 3.49 105 yr and 1.089 105 yr for the two stars, about halfway through their respective lifetimes. Ideally, one would surround the star with the accretion envelope that created it in a cosmological simulation for self-consistency. But stellar evolution models of Pop III SMSs in time-dependent cosmological flows are not yet available, so we instead use density and temperature profiles from the Enzo simulation at 1.786 Myr as the envelope of each star. This choice is reasonable because the accretion rates associated with these profiles are intermediate to those in which our stars were evolved.
The density and temperature profiles of the envelope that are input to Cloudy are tabulated in 70 bins that are uniformly partitioned in log radius, with inner and outer boundaries at 0.015 pc and 927 pc. Cloudy solves the equations of radiative transfer, statistical and thermal equilibrium, ionization and recombination, and heating and cooling to calculate the excitation and ionization state of the gas surrounding the star and compute its emergent spectrum. The temperatures of the gas falling onto the star are set by the virialization of cosmic flows well above it, not by radiation from the star. Since they determine to what degree the envelope is collisionally excited, and thus how it reprocesses photons from the star, we required Cloudy to use the temperatures Enzo calculates for the envelope instead of inferring them from the spectrum of the SMS because they would have been too low.
3. Observing Supermassive Stars
3.1. SMS Spectra
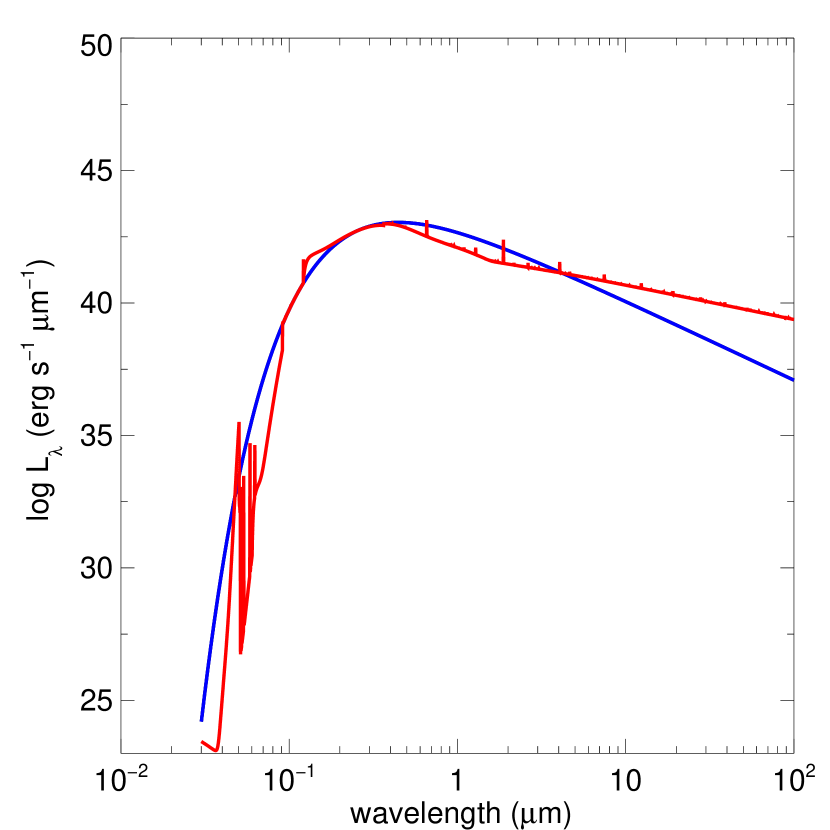
We show spectra for the 1.0 yr-1 star at 1.089 105 yr before and after attenuation by its envelope in Figure 3. As expected, the stellar spectrum peaks at 0.352 m and absorption by the envelope at the Lyman limit of H is clearly visible at 0.0912 m. The continuum absorption below 0.0912 m is punctuated by several prominent He emission lines. There is a Ly- emission line at 0.1216 m and strong H and Paschen series lines are visible at 0.656 m, 1.28 m and 1.88 m. There is continuum absorption half a decade in wavelength above and below 1.65 m due to H- bound-bound and bound-free opacity, respectively.
Photons from the star that are blueward of the Lyman limit are reprocessed by its envelope into the Ly and two-photon continuum emission visible at 0.1216 - 0.16 m. This latter flux is greater than that emitted by the star itself and can enhance its visibility in the NIR today. The effect varies with and source redshift but is at most 0.5 - 1 AB mag. The Ly will not aid in the detection of the star because it will be scattered into a halo of low surface brightness in the neutral IGM. We note that at the velocities and densities of the infall onto the surface of the star, the luminosity of its accretion shock is at most 104 and does not produce a significant contribution to the visibility of the SMS.
3.2. NIR Magnitudes
 |
 |
 |
 |
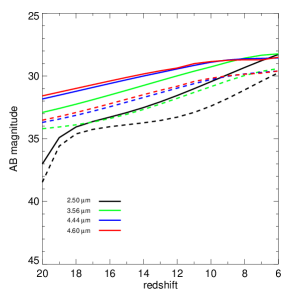
We show AB magnitudes for both stars in JWST NIRCam bands at 2.5 - 4.6 m in the top right panel of Figure 4. The 1.0 yr-1 SMS is consistently 1 - 2 magnitudes brighter than the 0.1 yr-1 SMS except at high redshifts at 2.50 m, where both luminosities abruptly fall off because of absorption of flux blueward of Ly in the source frame of the star by the neutral intergalactic medium (IGM) at 6. At the two stars are brightest in the 3.56 m filter but at 10 they are brighter in the 4.44 m and 4.60 m bands, with magnitudes that vary from 28.5 - 31.5 at 6 - 20 for the 1.0 yr-1 SMS and 29.5 - 33.5 for the 0.1 yr-1 SMS.
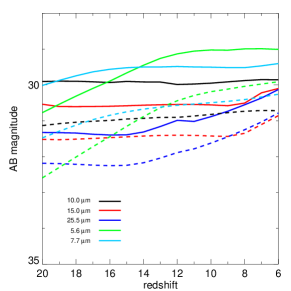
SMS magnitudes are much more uniform in redshift in the mid infrared, as we show for several JWST MIRI bands in the top right panel of Figure 4. They exhibit the greatest variation at 5.6 m, which is closest to the NIR, but largely level off at 7.7 - 25.5 m. This behavior is primarily due to the flattening of the spectrum at wavelengths above 1.5 m in the source frame due to reprocessing of flux from the star by its envelope. The two stars are brightest from 6 - 20 at 5.6 - 10.0 m, with magnitudes 31 and could therefore provide important additional spectral confirmation of SMS candidates in NIRCam.
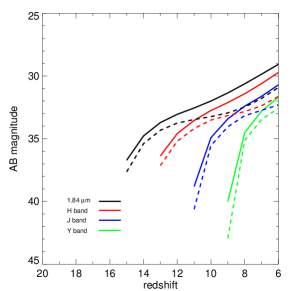
We show SMS magnitudes for Euclid and WFIRST in the lower two panels of Figure 4. Absorption by the neutral IGM at 6 quenches Y, J and H band fluxes at 7, 10 and 14, respectively, limiting detections of these stars to these redshifts in these filters. Magnitudes for the 1.0 yr-1 star vary from 29.5 - 31.8 in Euclid and 29 - 32.5 in WFIRST at . For the 0.1 yr-1 star, they vary from 31.5 - 32.5 in Euclid and from 31 - 32.5 in WFIRST at the same redshift. They drop off more rapidly with redshift than in the NIRCam bands because spectral luminosities in the source frame fall with decreasing wavelength below 0.3 m.
3.3. SMS Formation / Detection Rates
Since the lifetime of an SMS is much smaller than the Hubble time, even at the high redshifts at which it is likely to form, the number of SMSs per unit redshift per unit solid angle at a redshift can be written as
| (1) |
where is the SMS formation rate per unit comoving volume, is the characteristic lifetime of an SMS, and is the comoving distance to redshift ,
| (2) |
Unfortunately, is poorly constrained, with theoretical models predicting number densities that vary by up to eight orders of magnitude (see, e.g., the recent review of Woods et al., 2018). These models also predict different evolutions in with redshift. Habouzit et al. (2016) predict a steady increase in the comoving number density of SMSs with decreasing while Valiante et al. (2017) predict that most form in the narrow range –18. We therefore consider two toy models that bracket this range of .
In the first, our “optimistic” model, we assume that most SMSs form at –12 and that the final comoving number density is around , as in the Habouzit et al. (2016) model with a low value for . In the other, our “pessimistic” model, we assume that most SMSs form at redshifts –18, as in Valiante et al. (2017), with a final comoving number density of around . The optimistic model yields approximately potentially observable SMSs per steradian per unit redshift, or around 30 per NIRCam field of view. On the other hand, the pessimistic model predicts only SMSs per steradian per unit redshift, meaning that any given NIRCam pointing with the appropriate limiting magnitude would have a probability of only around of detecting an SMS.
The chances of detecting an SMS are highly dependent on the model assumed for their formation. However, since some models predict number counts high enough for one or more SMSs to be found in any sufficiently deep NIRCam image, JWST will begin to place observational constraints on these models, even if it cannot rule out extreme ones such as our pessimistic model. We note that no SMSs have been found in the Hubble Ultra Deep Field to date because of its AB mag limit of 29 at 1.38 m in the H band, which is well below that expected of either star even at 6.
4. Conclusion
At NIRCam AB magnitude limits of 31.5 JWST could detect the 1.0 yr-1 SMS at 20 and the 0.1 yr-1 SMS at 13. But the prospects for discovering such stars would be better if they could also be found by Euclid and WFIRST because their wide fields would enclose far more of them at high redshifts. Once flagged, SMS candidates could then be studied with JWST in greater detail. However, as shown in Figure 4, the H band magnitudes of both stars at 6 - 20 are above current Euclid and WFIRST detection limits (26 and 28, respectively).
But this does not mean Euclid and WFIRST will not find these stars because only modest gravitational lensing is required to boost their fluxes above their detection limits. The fields of view of both missions will enclose thousands of galaxy clusters and massive galaxies, and at 6 - 10 magnification factors of only 10 - 100 would be required to reveal either star. It is likely that a sufficient fraction of their survey areas will be lensed to such factors (Rydberg et al., 2018). Even higher magnifications may be possible in future surveys of individual cluster lenses by JWST but at the cost of smaller lensing volumes (Whalen et al., 2013c; Windhorst et al., 2018).
In our Enzo and Cloudy calculations we have neglected the effect of radiation pressure due to flux from the star on the flows that create it. Modeling these effects in cosmological simulations is challenging in part because they must resolve photospheres on very small scales that preclude the codes from evolving them for long times. Smith et al. (2017a) post processed simulations of highly resolved atomically cooling halos with Ly photon transport and found it could exert mechanical feedback on flows in the vicinity of the star. Radiation hydrodynamical simulations by Luo et al. (2018) and Ardaneh et al. (2018) that neglect resonant Ly scattering found that radiation from the protostar in its early stages did not significantly alter flows in its vicinity but did suppress fragmentation, thus promoting the rapid growth of a single supermassive object. In principle, radiation from the SMS could blow out gas and partially expose it to the IGM, but this will have little effect on the AB magnitudes of the star today because all that would be lost is the mild enhancement of UV flux redward of the Lyman limit by the envelope discussed in Section 3.1.
While we have only considered cool red supergiant stars, hotter SMSs could be easier to detect because they would produce more flux in the NIR today. Low accretion rates ( 0.005 yr-1; Haemmerlé et al., 2018b) or clumpy accretion due to fragmentation (Sakurai et al., 2015) or turbulence in the disk can produce such stars. However, blue SMS spectra require corrections due to absorption by their atmospheres before the flux that exits the accretion envelope can be calculated. SMSs could also be found at higher redshifts if they exhibit pulsations that temporarily boost their fluxes above the detection limits of the wide-field surveys. Although current stellar evolution codes use implicit solvers and large time steps that do not resolve such oscillations, they can cause the star to periodically brighten and dim by an order of magnitude on timescales of a few weeks in the rest frame. Such variations might also facilitate their detection because their regularity would differentiate them from dusty, red high- quasars or low- impostors such as exoplanets. Periodic dimming and brightening could also flag these objects as high- SMSs in transient surveys proposed for JWST such as FLARE (Wang et al., 2017).
DCBH birth may be the next stage of primordial quasar evolution, and a number of studies have considered their prospects for detection in future NIR surveys. These are also deeply imbedded objects in dense, atomically-cooled flows and radiative transfer techniques similar to those we have used here are required to model their spectra. One-dimensional radiation hydrodynamics simulations of DCBH emission post processed with Cloudy have shown that they could be detected by JWST out to 20 (Becerra et al., 2015; Natarajan et al., 2017). We are now post processing radiation hydrodynamical simulations of the H II region of a SMBH from 6 - 20 (Smidt et al., 2018) with Cloudy to determine out to what redshifts it could be found by Euclid, WFIRST and JWST.
References
- Agarwal et al. (2016) Agarwal, B., Smith, B., Glover, S., Natarajan, P., & Khochfar, S. 2016, MNRAS, 459, 4209
- Alvarez et al. (2009) Alvarez, M. A., Wise, J. H., & Abel, T. 2009, ApJ, 701, L133
- Ardaneh et al. (2018) Ardaneh, K., Luo, Y., Shlosman, I., Nagamine, K., Wise, J. H., & Begelman, M. C. 2018, MNRAS, 479, 2277
- Bañados et al. (2018) Bañados, E., et al. 2018, Nature, 553, 473
- Becerra et al. (2015) Becerra, F., Greif, T. H., Springel, V., & Hernquist, L. E. 2015, MNRAS, 446, 2380
- Becerra et al. (2018) Becerra, F., Marinacci, F., Bromm, V., & Hernquist, L. E. 2018, MNRAS, 480, 5029
- Bromm & Loeb (2003) Bromm, V., & Loeb, A. 2003, ApJ, 596, 34
- Bryan et al. (2014) Bryan, G. L., et al. 2014, ApJS, 211, 19
- Chen et al. (2014) Chen, K.-J., Heger, A., Woosley, S., Almgren, A., Whalen, D. J., & Johnson, J. L. 2014, ApJ, 790, 162
- Ferland et al. (2017) Ferland, G. J., et al. 2017, Rev. Mex. Astron & Astrophys, 53, 385
- Freese et al. (2010) Freese, K., Ilie, C., Spolyar, D., Valluri, M., & Bodenheimer, P. 2010, ApJ, 716, 1397
- Habouzit et al. (2016) Habouzit, M., Volonteri, M., Latif, M., Dubois, Y., & Peirani, S. 2016, MNRAS, 463, 529
- Haemmerlé et al. (2018a) Haemmerlé, L., Woods, T. E., Klessen, R. S., Heger, A., & Whalen, D. J. 2018a, ApJ, 853, L3
- Haemmerlé et al. (2018b) —. 2018b, MNRAS, 474, 2757
- Hartwig et al. (2018) Hartwig, T., Agarwal, B., & Regan, J. A. 2018, MNRAS, 479, L23
- Hirano et al. (2017) Hirano, S., Hosokawa, T., Yoshida, N., & Kuiper, R. 2017, Science, 357, 1375
- Hosokawa et al. (2013) Hosokawa, T., Yorke, H. W., Inayoshi, K., Omukai, K., & Yoshida, N. 2013, ApJ, 778, 178
- Johnson et al. (2013a) Johnson, J. L., Whalen, D. J., Even, W., Fryer, C. L., Heger, A., Smidt, J., & Chen, K.-J. 2013a, ApJ, 775, 107
- Johnson et al. (2012) Johnson, J. L., Whalen, D. J., Fryer, C. L., & Li, H. 2012, ApJ, 750, 66
- Johnson et al. (2013b) Johnson, J. L., Whalen, D. J., Li, H., & Holz, D. E. 2013b, ApJ, 771, 116
- Kalirai (2018) Kalirai, J. 2018, Contemporary Physics, 59, 251
- Latif et al. (2013) Latif, M. A., Schleicher, D. R. G., Schmidt, W., & Niemeyer, J. 2013, MNRAS, 430, 588
- Lodato & Natarajan (2006) Lodato, G., & Natarajan, P. 2006, MNRAS, 371, 1813
- Luo et al. (2018) Luo, Y., Ardaneh, K., Shlosman, I., Nagamine, K., Wise, J. H., & Begelman, M. C. 2018, MNRAS, 476, 3523
- Mortlock et al. (2011) Mortlock, D. J., et al. 2011, Nature, 474, 616
- Natarajan et al. (2017) Natarajan, P., Pacucci, F., Ferrara, A., Agarwal, B., Ricarte, A., Zackrisson, E., & Cappelluti, N. 2017, ApJ, 838, 117
- Planck Collaboration et al. (2016) Planck Collaboration et al. 2016, A&A, 594, A13
- Regan & Haehnelt (2009) Regan, J. A., & Haehnelt, M. G. 2009, MNRAS, 396, 343
- Rydberg et al. (2018) Rydberg, C.-E., Whalen, D. J., Maturi, M., Collett, T., Carrasco, M., Magg, M., & Klessen, R. S. 2018, arXiv:1805.02662
- Sakurai et al. (2015) Sakurai, Y., Hosokawa, T., Yoshida, N., & Yorke, H. W. 2015, MNRAS, 452, 755
- Schauer et al. (2017) Schauer, A. T. P., Regan, J., Glover, S. C. O., & Klessen, R. S. 2017, MNRAS, 471, 4878
- Smidt et al. (2018) Smidt, J., Whalen, D. J., Johnson, J. L., Surace, M., & Li, H. 2018, ApJ, 865, 126
- Smith et al. (2017a) Smith, A., Becerra, F., Bromm, V., & Hernquist, L. 2017a, MNRAS, 472, 205
- Smith et al. (2018) Smith, B. D., Regan, J. A., Downes, T. P., Norman, M. L., O’Shea, B. W., & Wise, J. H. 2018, MNRAS, 480, 3762
- Smith et al. (2017b) Smith, B. D., et al. 2017b, MNRAS, 466, 2217
- Umeda et al. (2016) Umeda, H., Hosokawa, T., Omukai, K., & Yoshida, N. 2016, ApJ, 830, L34
- Valiante et al. (2017) Valiante, R., Agarwal, B., Habouzit, M., & Pezzulli, E. 2017, Publications of the Astronomical Society of Australia, 34, e031
- Wang et al. (2017) Wang, L., et al. 2017, arXiv:1710.07005
- Whalen et al. (2004) Whalen, D., Abel, T., & Norman, M. L. 2004, ApJ, 610, 14
- Whalen & Fryer (2012) Whalen, D. J., & Fryer, C. L. 2012, ApJ, 756, L19
- Whalen et al. (2013a) Whalen, D. J., Fryer, C. L., Holz, D. E., Heger, A., Woosley, S. E., Stiavelli, M., Even, W., & Frey, L. H. 2013a, ApJ, 762, L6
- Whalen et al. (2013b) Whalen, D. J., Johnson, J. L., Smidt, J., Heger, A., Even, W., & Fryer, C. L. 2013b, ApJ, 777, 99
- Whalen et al. (2014) Whalen, D. J., Smidt, J., Even, W., Woosley, S. E., Heger, A., Stiavelli, M., & Fryer, C. L. 2014, ApJ, 781, 106
- Whalen et al. (2013c) Whalen, D. J., Smidt, J., Johnson, J. L., Holz, D. E., Stiavelli, M., & Fryer, C. L. 2013c, arXiv:1312.6330
- Windhorst et al. (2018) Windhorst, R. A., et al. 2018, ApJS, 234, 41
- Wise et al. (2008) Wise, J. H., Turk, M. J., & Abel, T. 2008, ApJ, 682, 745
- Woods et al. (2017) Woods, T. E., Heger, A., Whalen, D. J., Haemmerlé, L., & Klessen, R. S. 2017, ApJ, 842, L6
- Woods et al. (2018) Woods, T. E., et al. 2018, arXiv:1810.12310
- Zackrisson et al. (2010a) Zackrisson, E., et al. 2010a, ApJ, 717, 257
- Zackrisson et al. (2010b) —. 2010b, MNRAS, 407, L74