Neutral-Gas-Phase Metal Abundances in Zn ii-Selected Quasar Absorption Line Systems near Redshift ††thanks: Based on data obtained from the Sloan Digital Sky Survey and on observations made with the Hubble Space Telescope, operated by STScI-AURA for NASA/ESA.
Abstract
We present ten metallicity measurements for quasar absorbers near that were selected for having unusually significant Zn ii absorption in their SDSS spectra. Follow-up UV space spectroscopy of the Ly region shows that all ten have damped Ly (DLA) absorption, corresponding to neutral hydrogen column densities in the range N(H i) atoms cm-2, and indicating that the gas is very optically thick and essentially neutral. The sample is a very small subset of systems compiled by searching the University of Pittsburgh catalog of intervening Mg ii absorption line systems in SDSS quasar spectra up to DR7. We started by isolating that had strong Mg ii absorption in the redshift interval in brighter background quasars. Of these, 36 exhibited significant absorption near Zn ii. Space UV spectroscopy was then obtained for nine of these (25% of the total), and a tenth system in a fainter quasar was found in the HST archives. The result is a representative sample of the highest Zn+ columns of gas within the DLA population. These Zn ii-selected systems define the upper envelope of DLA metallicities near . They show a tight anti-correlation between N(H i) and [Zn/H], with the higher metallicity systems clearly exhibiting more depletion based on [Cr/Zn] values. The various metal-line measurements (Zn, Cr, Si, Fe, Mn) indicate evolved neutral gas with [Zn/H] .
keywords:
galaxies: evolution - galaxies: ISM - galaxies: formation - quasars: absorption lines1 Introduction
Since the first spectroscopic survey for damped Ly systems (DLAs) by Wolfe et al. (1986), it has been recognized that these galaxy-sized columns of neutral hydrogen (classically defined as having N(H i) atoms cm-2) can be used to trace the neutral gas content of the Universe back to . Indeed, the results indicate that DLAs contain the bulk of the known H i gas mass in the Universe (e.g. see Rao et al., 2017; Noterdaeme et al., 2012, and references therein). Given our ability to identify this gas, an important follow-up challenge is to understand its metallicity and dust content.
Metallicity studies of DLAs are often done using the elements Zn, Cr, Fe, Mn, and Si, which are expected to exist primarily in a singly ionized state. The equivalent widths of the weaker, unsaturated transitions of these lines can be directly converted into column densities because they lie on the linear part of the curve of growth. Zn ii in particular is often taken to be a direct measurement of the metal abundance of the gas, because it follows Fe and is generally not depleted onto dust grains. Cr, on the other hand, is readily depleted onto dust grains, so the neighboring Cr ii lines can be combined with the Zn ii measurements to trace dust depletion in the gas via [Cr/Zn] in moderate- to high-redshift DLAs; this has been realized for some time (e.g., Pettini, Boksenberg & Hunstead 1990, Pettini et al. 1994).
One would expect the cosmic neutral gas to become more metal-enriched with increasing cosmic time, forming molecular gas and then stars as it cycles through galaxies, and this qualitative expectation has been confirmed (e.g. see Quiret et al., 2016, and references therein). However, we do not yet know how metal-enriched DLAs can become. This study investigates the upper limit of metal abundance in DLAs at . Our aim is to identify and study absorption-line systems for which unusually significant Zn ii is detectable among the large number of available moderate-resolution Sloan Digital Sky Survey (SDSS) optical quasar spectra. Using the volatile element Zn, we can identify the highest columns of metals in the Universe and explore their environments, including their associated neutral hydrogen column densities, and the degree to which some refractory elements are depleted onto grains. These systems can reveal important information about the upper envelope of the N(HI) versus metallicity relation, which otherwise has an intrinsic spread greater than two orders of magnitude (Quiret et al 2016).
As shown by Rao & Turnshek (2000) and Rao, Turnshek & Nestor (2006), DLAs at redshifts are a subset of strong Mg ii absorption systems, which are easily identified in Sloan Digital Sky Survey (SDSS) quasar spectra (Quider et al., 2011). We assume that Zn ii systems detectable in SDSS spectra must be a subset of strong Mg ii systems, and this assumption is confirmed by the results of our analysis. However, UV space spectroscopy is needed to determine if a particular system at these redshifts has a large-enough N(H i) value to be classified as a neutral-gas DLA system. Spectroscopy of unsaturated absorption (e.g. Zn ii)111Saturated absorption like Mg ii cannot be used to determine metallicity., combined with a measurement of N(H i), then allows metallicities to be determined.
Thus, in this contribution we report on a search for Zn ii absorption in the spectra of reasonably bright SDSS quasars, followed by UV space spectroscopy of Ly to measure N(H i) values and hence metallicities. We observed Ly for nine systems with , which is 25% of the Zn ii sample identified in our search of SDSS spectra. We also found a tenth and similar Zn ii system with an HST archival spectrum in a fainter SDSS quasar. Given the likely range of metallicities, we reasoned that these Zn ii-selected systems might fall in the DLA regime, and this turned out to be the case. These ten systems represent a good sample for future follow-up, and we use them here to explore the upper envelope of the distribution of neutral-gas-phase metallicities, and corresponding metal depletion measures, as a function of N(H i) near redshift .
2 Sample
We initially considered a sample of nearly 30,000 SDSS quasar Mg ii absorbers, with the aim of identifying a subset for which we could obtain UV spectroscopy of Ly. These were the Mg ii absorbers in the University of Pittsburgh catalog of Quider et al. (2011), which originally covered up to DR4 ( systems), and was later augmented with additional systems up to DR7 ( systems). We then isolated those with , SDSS fiber magnitude ,222This approximately corresponds to SDSS model mag . and Mg ii rest equivalent width (REW) Å. Strong, redshifted Zn ii absorption would be visible in SDSS spectra within these criteria,333Our search did not require the presence of Cr ii near this region since Cr might be depleted onto dust grains. would be bright enough to make them amenable to space UV spectroscopy near Ly absorption with a reasonably short integration time, and would have redshifts allowing follow-up galaxy identification studies. As shown by Rao et al. (2006), the requirement that Å would find all DLAs with N(H i) atoms cm-2 as well as a subset of subDLAs with N(H i) atoms cm-2; such systems are empirically known to contain a sufficient amount of neutral gas, making them favorable for the existence of Zn+. These steps left us with Mg ii systems to search for absorption at the predicted locations of Zn ii.
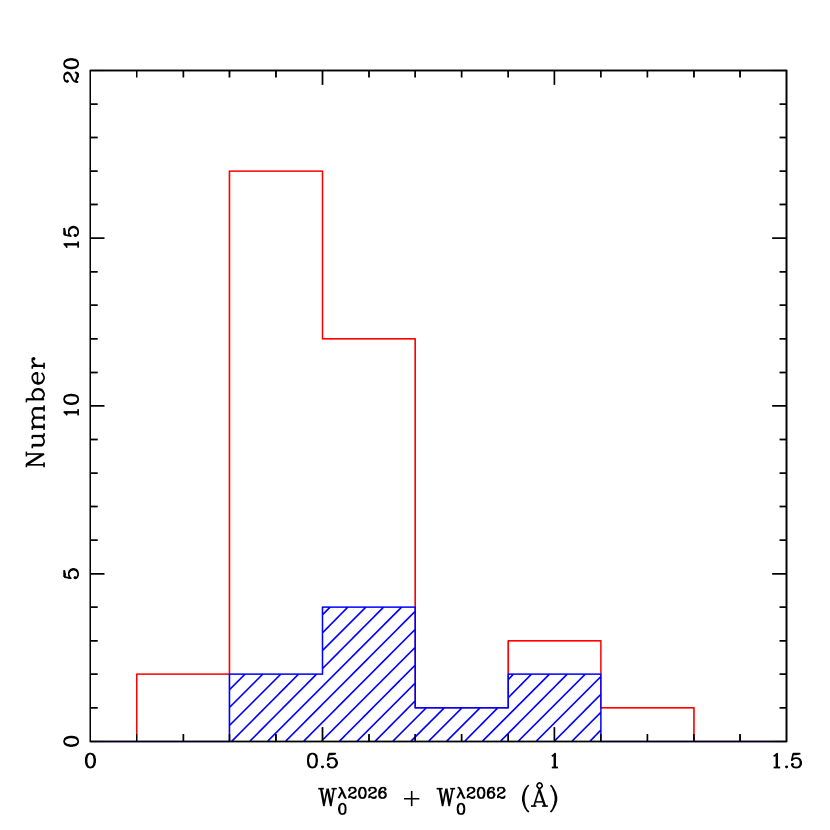
The final criterion for our sample required absorption features near rest wavelengths of and . The feature is a blend due to Zn ii and much weaker Cr ii and Mg i. The feature is a blend due to Zn ii and weaker Cr ii. We required and to be individually present at levels of significance , plus together have an effective significance of , where . This yielded Zn ii-selected systems, and we obtained space UV spectroscopy of nine of them (25%) near the predicted position of their Ly absorption to measure N(H i). A tenth system in a fainter quasar (1017+5356, PI:Becker) found in the HST archives444Obtained from the Mikulski Archive for Space Telescopes (MAST). rounds out the sample. A histogram of the 36 Zn ii-selected systems, and the nine for which we obtained space UV spectroscopy of Ly, is shown in Figure 1.
3 Observations and Measurements
The Journal of Observations for the ten Zn ii-selected systems with space UV spectroscopy is presented in Table 1. In addition to the SDSS coordinates, MJD-plate-fiber IDs, and fiber magnitudes of the quasars, Table 1 includes zem and zabs of the systems in our sample. The dates and spectral elements of space UV spectroscopy, including the signal-to-noise ratio per resolution element in the region of the Ly line, are also given. Nine observations were made with HST STIS-G230L (), and one was made with GALEX NUV (). The GALEX observation was previously published in Monier et al. (2009).
| QSO name | MJD | Plate | Fiber | g | zem | zabs | Date | Mode | Exp Time | SNR |
|---|---|---|---|---|---|---|---|---|---|---|
| [sec] | ||||||||||
| J02030910 | 52149 | 666 | 109 | 18.64 | 1.580 | 1.028 | Nov 02 2007 | GALEX NUV | 30,720 | 14.7 |
| J02540734 | 51901 | 457 | 495 | 18.08 | 1.472 | 1.288 | Aug 11 2011 | HST STIS-G230L | 2416 | 12.7 |
| J0831+3635 | 52312 | 827 | 001 | 18.57 | 1.160 | 1.127 | May 17 2011 | HST STIS-G230L | 2463 | 11.3 |
| J0953+6351 | 51943 | 487 | 372 | 18.24 | 1.313 | 1.239 | May 12 2011 | HST STIS-G230L | 3686 | 10.6 |
| J1017+5356 | 52381 | 904 | 500 | 19.53 | 1.398 | 1.307 | May 05 2002 | HST STIS-G230L | 5580 | 7.8 |
| J1204+0338 | 52017 | 516 | 589 | 18.72 | 1.545 | 1.208 | Jan 20 2011 | HST STIS-G230L | 2396 | 7.8 |
| J12053144 | 53474 | 3181 | 576 | 18.74 | 1.689 | 1.274 | Jan 14 2011 | HST STIS-G230L | 2437 | 6.4 |
| J1353+0333 | 52375 | 855 | 096 | 18.93 | 1.584 | 1.208 | Mar 11 2011 | HST STIS-G230L | 5376 | 13.4 |
| J1355+0042 | 51942 | 301 | 321 | 19.09 | 1.624 | 1.404 | Jul 27 2011 | HST STIS-G230L | 5368 | 6.4 |
| J1453+3136 | 55364 | 3875 | 586 | 18.85 | 1.851 | 1.251 | Sep 23 2011 | HST STIS-G230L | 5458 | 4.9 |
3.1 Metal Lines
As explained in Section 2, these quasars were selected on the basis of strong Zn ii absorption. The other available metal lines in the SDSS spectra were also measured (see below) to study the properties of the ten systems for which we have UV spectroscopy. For each system, Table 2 presents the rest wavelengths, oscillator strengths (Morton, 2003), and rest equivalent widths of the metal lines measured in the SDSS spectrum.555The more recent Zn ii oscillator strengths of Kisielius et al. (2015) are slightly higher than those of Morton (2003) and would lower our subsequent determination of [Zn/H] by about 0.1 dex.
We start by drawing attention to the result that the ten Zn ii systems have Å, which is significantly isolated to higher values than our sample search criteria of Å. The total sample of 36 Zn ii systems has Å. Thus, the Mg ii properties of the ones selected for space UV spectroscopy are similar to the ones not selected, but with a narrower range of values. The very high values for generally confirm our assumption that Zn ii systems detectable in SDSS spectra are a subset of strong Mg ii systems, and that they may be a subset of the strongest Mg ii systems.
| SDSS J02030910 | SDSS J02540734 | SDSS J0831+3635 | SDSS J0953+6351 | SDSS J1017+5356 | ||||||||
|---|---|---|---|---|---|---|---|---|---|---|---|---|
| Ion | =1.028 | =1.288 | =1.127 | =1.239 | =1.306 | |||||||
| (Å) | aaParentheses denote inferred or estimated values | aaParentheses denote inferred or estimated values | aaParentheses denote inferred or estimated values | aaParentheses denote inferred or estimated values | aaParentheses denote inferred or estimated values | |||||||
| Si ii | 1808.01 | 0.0022 | bbNot covered by spectrum. | 0.299 | 0.041 | 0.309 | 0.081 | 0.277 | 0.048 | 0.375 | 0.059 | |
| Zn ii/Cr ii/Mg i | 2026 | 0.333 | 0.091 | 0.245 | 0.039 | 0.215 | 0.073 | 0.222 | 0.050 | 0.357 | 0.069 | |
| Zn ii | 2026.14 | 0.501 | (0.298) | (0.225) | (0.188) | (0.196) | (0.347) | |||||
| Cr ii | 2026.27 | 0.001 | ccNoise spike | (0.002) | (0.002) | (0.006) | ccNoise spike | |||||
| Mg i | 2026.48 | 0.113 | (0.035) | (0.018) | (0.025) | (0.020) | (0.01) | |||||
| Cr ii | 2056.25 | 0.103 | 0.235 | 0.050 | 0.093 | 0.035 | 0.044 | 0.074 | 0.130 | 0.044 | 0.074 | 0.070 |
| Cr ii/Zn ii | 2062 | 0.267 | 0.075 | 0.174 | 0.042 | 0.296 | 0.067 | 0.311 | 0.050 | 0.144 | 0.098 | |
| Cr ii | 2062.23 | 0.076 | (0.175) | (0.069) | (0.033) | (0.097) | (0.056) | |||||
| Zn ii | 2062.66 | 0.246 | (0.092) | (0.104) | (0.263) | (0.213) | (0.088) | |||||
| Cr ii | 2066.16 | 0.051 | 0.381 | 0.063 | 0.050 | 0.033 | 0.064 | 0.046 | 0.117 | 0.057 | 0.093 | 0.060 |
| Fe ii | 2249.88 | 0.002 | 0.371 | 0.053 | 0.158 | 0.050 | ddAssumed to be negligible. | 0.252 | 0.077 | 0.247 | 0.085 | |
| Fe ii | 2260.78 | 0.002 | 0.396 | 0.044 | 0.252 | 0.054 | 0.260 | 0.074 | 0.241 | 0.041 | 0.093 | 0.046 |
| Fe ii | 2344.21 | 0.114 | 1.287 | 0.035 | 1.443 | 0.053 | 1.261 | 0.078 | 1.281 | 0.051 | 0.858 | 0.057 |
| Fe ii | 2374.46 | 0.031 | 1.108 | 0.034 | 0.943 | 0.055 | 0.904 | 0.065 | 0.826 | 0.042 | 0.522 | 0.052 |
| Fe ii | 2382.77 | 0.320 | 1.791 | 0.033 | 1.865 | 0.060 | 1.606 | 0.072 | 1.410 | 0.047 | 0.836 | 0.052 |
| Mn ii | 2576.88 | 0.351 | 0.337 | 0.044 | 0.181 | 0.087 | 0.258 | 0.075 | 0.243 | 0.053 | 0.223 | 0.048 |
| Fe ii | 2586.65 | 0.069 | 1.430 | 0.036 | 1.367 | 0.060 | 1.375 | 0.080 | 1.105 | 0.057 | 0.737 | 0.055 |
| Mn ii | 2594.50 | 0.280 | 0.335 | 0.058 | 0.143 | 0.049 | 0.225 | 0.064 | 0.200 | 0.054 | 0.083 | 0.062 |
| Fe ii | 2600.17 | 0.239 | 1.780 | 0.045 | 1.833 | 0.053 | 1.629 | 0.074 | 1.318 | 0.066 | 0.928 | 0.057 |
| Mn ii | 2606.46 | 0.198 | 0.176 | 0.045 | 0.112 | 0.042 | 0.293 | 0.086 | 0.142 | 0.051 | 0.039 | 0.039 |
| Mg ii | 2796.35 | 0.612 | 2.665 | 0.056 | 2.510 | 0.043 | 2.619 | 0.061 | 2.343 | 0.041 | 2.841 | 0.077 |
| Mg ii | 2803.53 | 0.305 | 2.450 | 0.062 | 2.410 | 0.043 | 2.552 | 0.060 | 2.223 | 0.033 | 2.701 | 0.054 |
| Mg i | 2852.96 | 1.830 | 0.890 | 0.056 | 0.573 | 0.049 | 0.793 | 0.052 | 0.643 | 0.041 | 0.289 | 0.044 |
Rest Equivalent Widths (Å) of Ions Measured in the Sample from SDSS Spectra SDSS J1204+0338 SDSS J12053144 SDSS J1353+0333 SDSS J1355+0042 SDSS J1453+3136 Ion =1.208 =1.273 =1.208 =1.404 =1.250 (Å) aaParentheses denote inferred or estimated values aaParentheses denote inferred or estimated values aaParentheses denote inferred or estimated values aaParentheses denote inferred or estimated values aaParentheses denote inferred or estimated values Si ii 1808.01 0.0022 0.406 0.071 0.481 0.046 0.341 0.053 0.491 0.068 0.482 0.057 Zn ii/Cr ii/Mg i 2026 0.279 0.088 0.465 0.068 0.367 0.108 0.531 0.058 0.271 0.040 Zn ii 2026.14 0.489 (0.243) (0.410) (0.333) (0.500) (0.232) Cr ii 2026.27 0.005 (0.005) (0.018) (0.004) (0.002) (0.018) Mg i 2026.48 0.112 (0.031) (0.037) (0.030) (0.029) (0.020) Cr ii 2056.25 0.105 0.112 0.064 0.391 0.040 0.082 0.091 0.334 0.064 0.217 0.040 Cr ii/Zn ii 2062 0.271 0.072 0.473 0.052 0.360 0.134 0.319 0.054 0.289 0.053 Cr ii 2062.23 0.078 (0.084) (0.293) (0.062) (0.212) (0.163) Zn ii 2062.66 0.256 (0.187) (0.180) (0.298) (0.107) (0.126) Cr ii 2066.16 0.052 0.040 0.050 0.269 0.044 0.026 0.070 0.089 0.048 0.143 0.044 Fe ii 2249.88 0.00182 0.133 0.068 0.457 0.038 ddAssumed to be negligible. 0.234 0.076 0.152 0.039 Fe ii 2260.78 0.00244 0.255 0.082 0.637 0.036 0.250 0.072 0.422 0.098 0.280 0.039 Fe ii 2344.21 0.114 2.067 0.082 2.164 0.047 1.347 0.104 1.694 0.087 1.858 0.036 Fe ii 2374.46 0.0313 1.366 0.084 1.928 0.048 1.000 0.088 1.396 0.093 1.177 0.034 Fe ii 2382.77 0.320 2.329 0.088 2.391 0.050 1.412 0.093 1.973 0.088 2.291 0.039 Mn ii 2576.88 0.3508 0.469 0.109 0.645 0.060 0.222 0.134 0.403 0.075 0.328 0.049 Fe ii 2586.65 0.0691 1.951 0.099 2.263 0.067 1.382 0.108 1.654 0.080 1.640 0.042 Mn ii 2594.50 0.271 0.362 0.170 0.885 0.105 0.319 0.114 0.477 0.103 0.254 0.049 Fe ii 2600.17 0.239 2.483 0.106 2.573 0.069 1.547 0.107 1.950 0.085 1.928 0.061 Mn ii 2606.46 0.1927 0.258 0.120 0.395 0.084 0.273 0.102 0.173 0.069 0.213 0.050 Mg ii 2796.35 0.6123 2.628 0.064 3.036 0.064 1.813 0.070 2.657 0.059 2.787 0.065 Mg ii 2803.53 0.3054 2.446 0.060 2.794 0.056 1.817 0.073 2.535 0.052 2.168 0.062 Mg i 2852.96 1.810 0.980 0.103 1.193 0.048 0.962 0.125 0.926 0.073 0.653 0.049
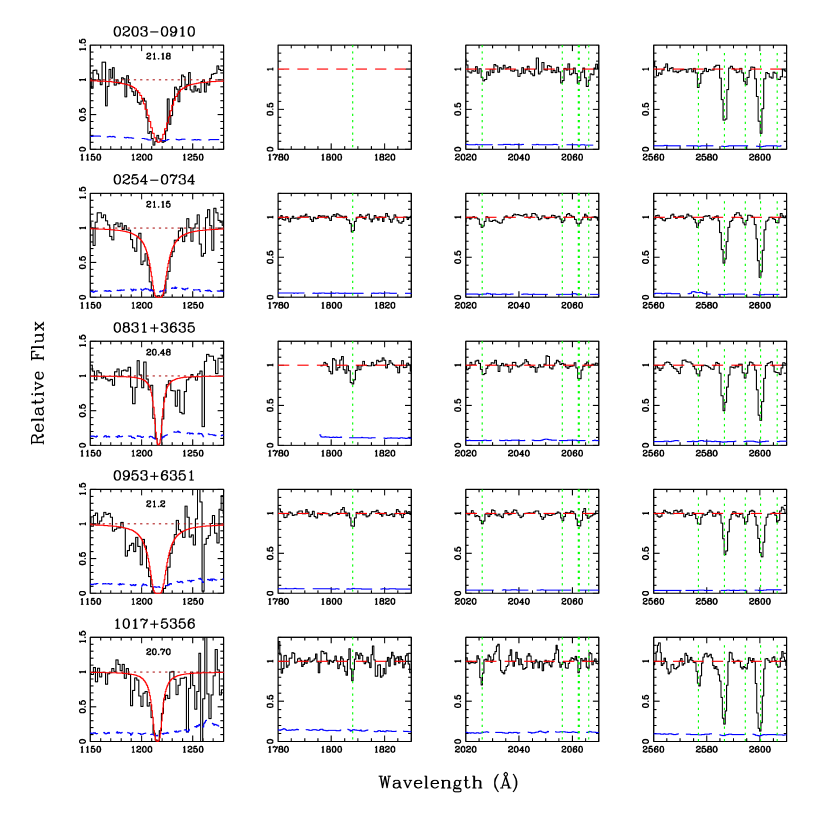
To make the measurements presented in Table 2, the SDSS spectra were normalized by continuum fits in the standard way (e.g. Quider et al., 2011). The results are shown for the visible Si ii, Zn ii, Cr ii, Mn ii, and some Fe ii transitions in the absorber rest-frame in the middle two and right panels of Figure 2. The REWs of these lines and others were measured by fitting Gaussians to the absorption features. The only problematic aspect is that some absorption features are blends at the SDSS resolution. Notably, Zn ii (with oscillator strength ) blends with Mg i () and Cr ii (), although the Mg i contribution is minimal and the Cr ii contribution is generally insignificant. The Mg i contribution can be estimated and removed since we know the strength of Mg i (). Also, Zn ii () is blended with Cr ii (), whereas Cr ii lies alone at () and (). By taking advantage of the fact that these weak lines lie on the linear part of the curve of growth, and using the Cr ii equivalent widths and the oscillator strength ratios, we are able to infer the Zn ii contribution in the blends as described in Nestor et al. (2003).
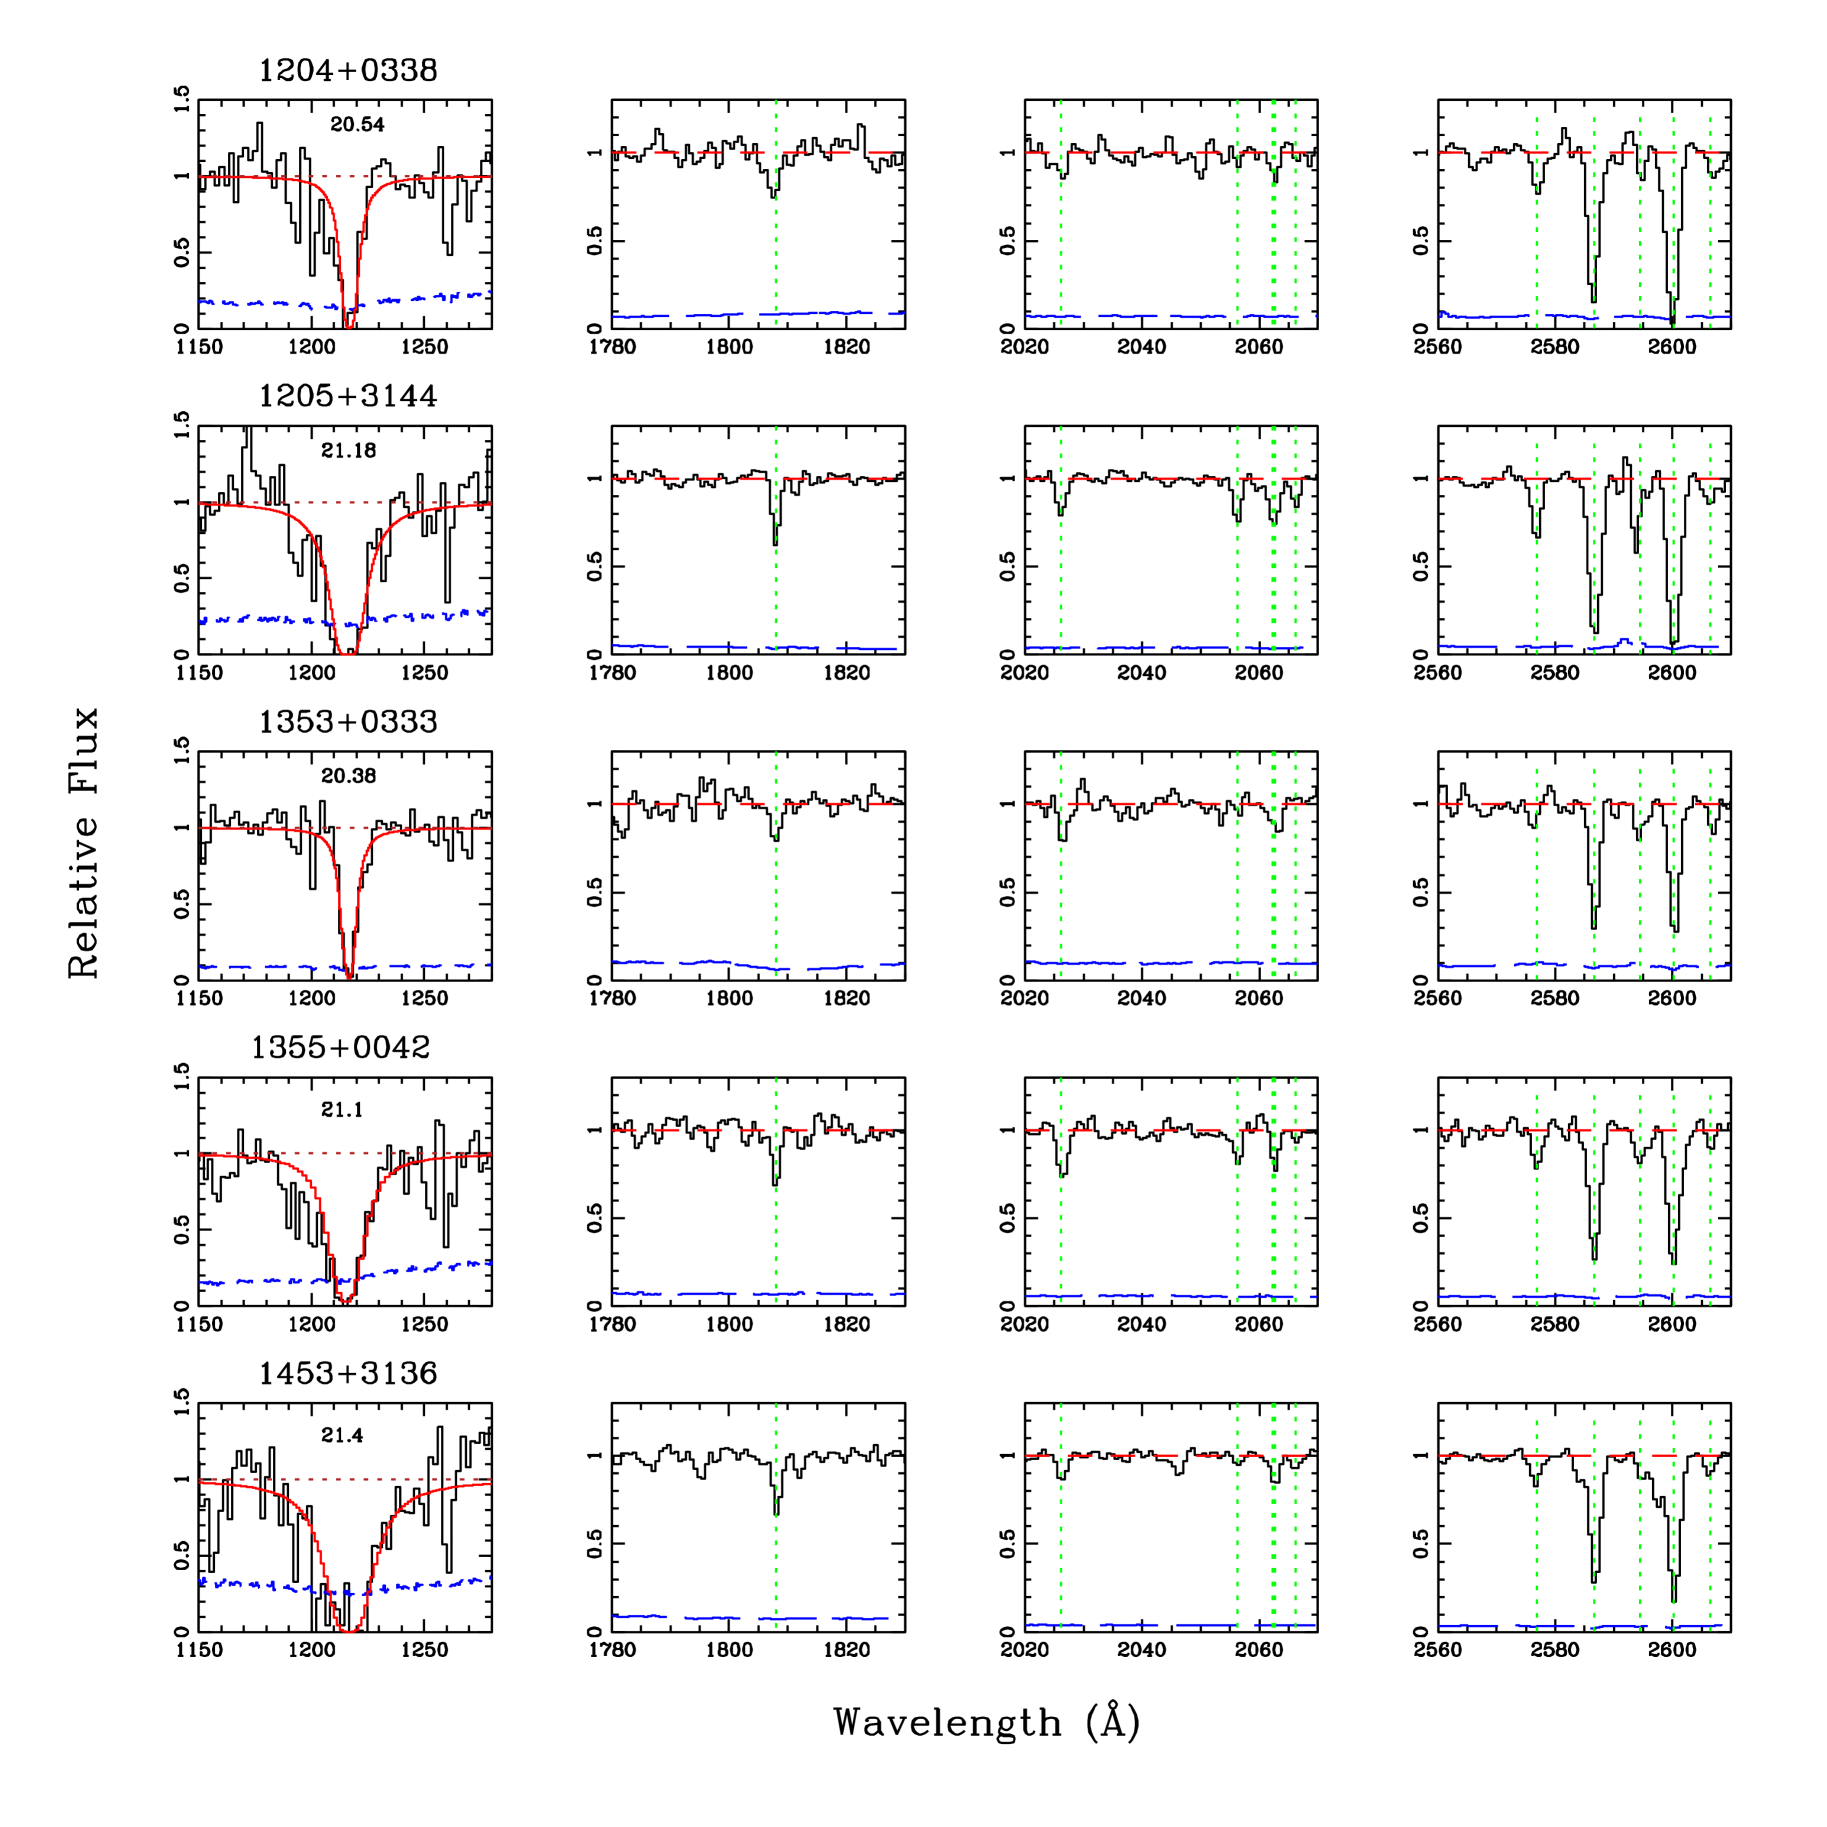
HST and SDSS data for the second set of five systems.
3.2 Ly Absorption Lines
The aim of the UV spectroscopy (Table 1) for each Zn ii system was simply to measure the Ly absorption line to derive (or place upper limits on) its neutral hydrogen column density, N(H i). Each spectrum was measured by first extrapolating the continuum across Ly absorption, fitting a local continuum, normalizing the spectrum, and then fitting the Ly with a Voigt profile convolved with the instrumental resolution. All of the Voigt profiles showed damping wings, allowing us to derive reliable N(H i) values from the fits. Errors on the N(H i) values were estimated by re-normalizing the continuua by , where is the spectrum error array, and re-fitting the Voigt profiles. The resulting rest-frame, normalized spectra for the systems near Ly absorption are shown in the leftmost panels of Figure 2. The [N(H i)/cm-2] values and derived errors are presented in Table 4. Note that six of the ten systems have [N(H i)/cm-2]21.
3.3 Ancillary Keck Spectroscopy
A search of the Keck Observatory Archive (KOA) revealed that two of the ten objects in our sample, 02030910 and 09536351, also have Keck HIRES spectroscopy. Portions of their Keck spectra are shown in Figures 4 and 5. We discuss these spectra in Section 4.


4 Analysis and Results
The REWs of transitions due to Zn ii, Cr ii, Si ii, Mn ii, and some Fe ii lines (Table 2) are weak and lie on the linear part of the curve of growth. They can be converted into column densities using appropriate weighting when multiple transitions are observed. These column densities for our Zn ii-selected sample of DLAs are reported in Table 4.
| QSO | N(H i)aa [N(X)/cm-2] | N(Zn+)aa [N(X)/cm-2] | N(Cr+)aa [N(X)/cm-2] | N(Fe+)aa [N(X)/cm-2] | N(Mn+)aa [N(X)/cm-2] | N(Si+)aa [N(X)/cm-2] |
|---|---|---|---|---|---|---|
| SDSS J02030910 | ||||||
| SDSS J02540734 | ||||||
| SDSS J0831+3565 | bbFe ii only | |||||
| SDSS J0953+6351 | ||||||
| SDSS J1017+5356 | ||||||
| SDSS J1204+0338 | ||||||
| SDSS J1205+3144 | ||||||
| SDSS J1353+0333 | aa [N(X)/cm-2] | |||||
| SDSS J1355+0042 | ||||||
| SDSS J1453+3136 |
When DLA metallicity results are reported in the literature, the usual assumption is that most of the metals are in the singly ionized state, and therefore significant ionization corrections are not required (e.g. Vladilo et al., 2001; Dessauges-Zavadsky et al., 2003). This has proven to be a good assumption since the hydrogen is nearly completely neutral, and any corrections would generally be below the measurement error. Another often-made assumption is that Zn is not significantly depleted onto dust grains. This assumption is reliable at the lowest metallicities but is less reliable at high values. It is reported that Zn depletion is dex in most DLAs, but can be up to 0.5 dex for metal-rich DLAs (De Cia et al., 2018). However, we will not attempt to estimate and correct for any Zn depletion, keeping consistent with the way results have been reported in the literature. Thus, the assumption that Zn is not depleted may lead to an underestimate of the true Zn metallicity, especially at the highest metallicities.
| QSO | N(HI)aa [N(HI)/cm-2] | [Zn/H] | [Cr/H] | [Cr/Zn] | [Mn/H] | [Fe/H] | [Si/H] |
|---|---|---|---|---|---|---|---|
| SDSS J02030910 | 21.16 | ||||||
| SDSS J02540734 | 21.25 | ||||||
| SDSS J0831+3565 | 20.48 | ||||||
| SDSS J0953+6351 | 21.18 | ||||||
| SDSS J1017+5356 | 20.70 | ||||||
| SDSS J1204+0338 | 20.54 | ||||||
| SDSS J1205+3144 | 21.18 | ||||||
| SDSS J1353+0333 | 20.38 | ||||||
| SDSS J1355+0042 | 21.08 | ||||||
| SDSS J1453+3136 | 21.40 |
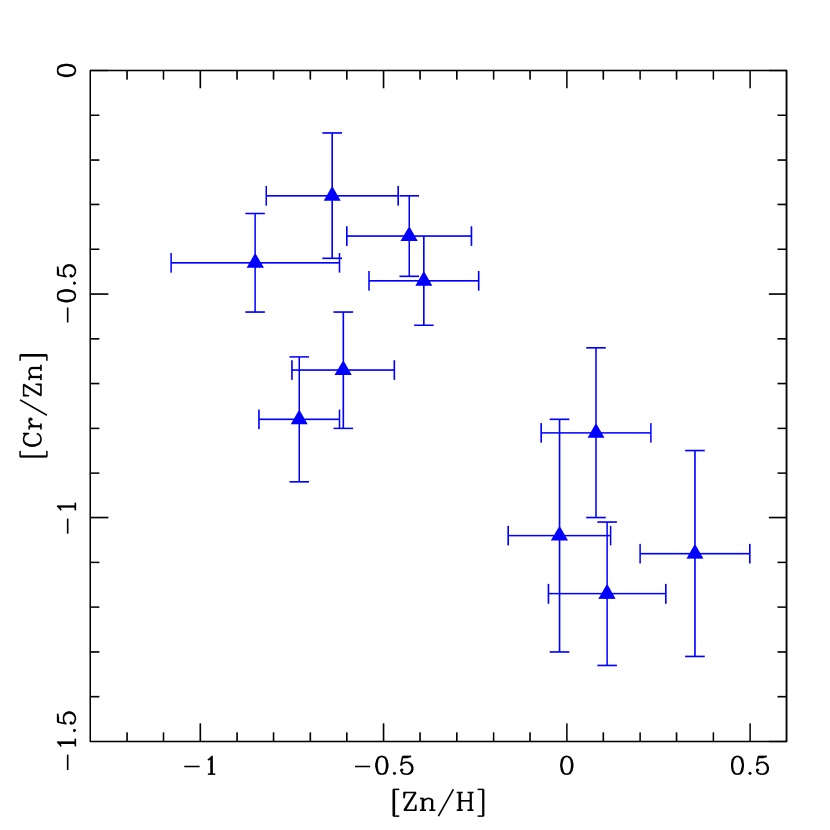
Our metallicity results are given in Table 5 in the standard way relative to solar values from Asplund et al. (2009), [X/H] = (NX/N (NX/N. Table 5 also includes [Cr/Zn], which is a measure of depletion commonly reported in moderate- to high-redshift DLAs (e.g., Pettini et al., 1990, 1994).
In Section 3.3 we noted the existence of Keck HIRES observations for two of our systems, shown in Figures 4 and 5. Figure 4 shows the spectrum of 02030910 obtained during a 60 minute exposure in 2006 (PI: Prochaska, unpublished). In these higher-resolution data (), the blend is resolved into its Zn ii and Cr ii components. In addition, the data appear to show some velocity structure: relative to the most prominent component, a weaker component of Zn ii may be present at higher velocity, separated by km s-1. We assumed two components to the system and fit the Cr and Zn absorption lines and blends with Voigt profiles to obtain rest equivalent widths. The equivalent width measurements of these features generally confirmed - to within 1 - the SDSS results reported in Table 2. The corresponding Zn and Cr abundances derived from this spectrum are [Zn/H] and [Cr/H] , within 1 of the values reported in Table 5 based on the SDSS data. The ratio [Cr/Zn] is within of the value in Table 5.
Figure 5 presents the Keck spectrum of 0953+6351 obtained during a 45 minute exposure in 2006 (PI: Prochaska, unpublished). The blend is again resolved into its Zn ii and Cr ii components. This higher-resolution spectrum () shows the system comprises a prominent component and at least one weaker component, separated from the stronger one by km s-1. We assumed two components and fit Voigt profiles to the Cr and Zn absorption lines and blends. The combined rest equivalent widths of the Zn ii and Cr ii lines are within 1 of the values determined from the SDSS spectrum (Table 2). These measurements of the Keck spectrum lead to [Zn/H] and [Cr/H] , within 1 of the values derived from the SDSS data and reported in Table 5. The ratio [Cr/Zn] is within of the value in Table 5.
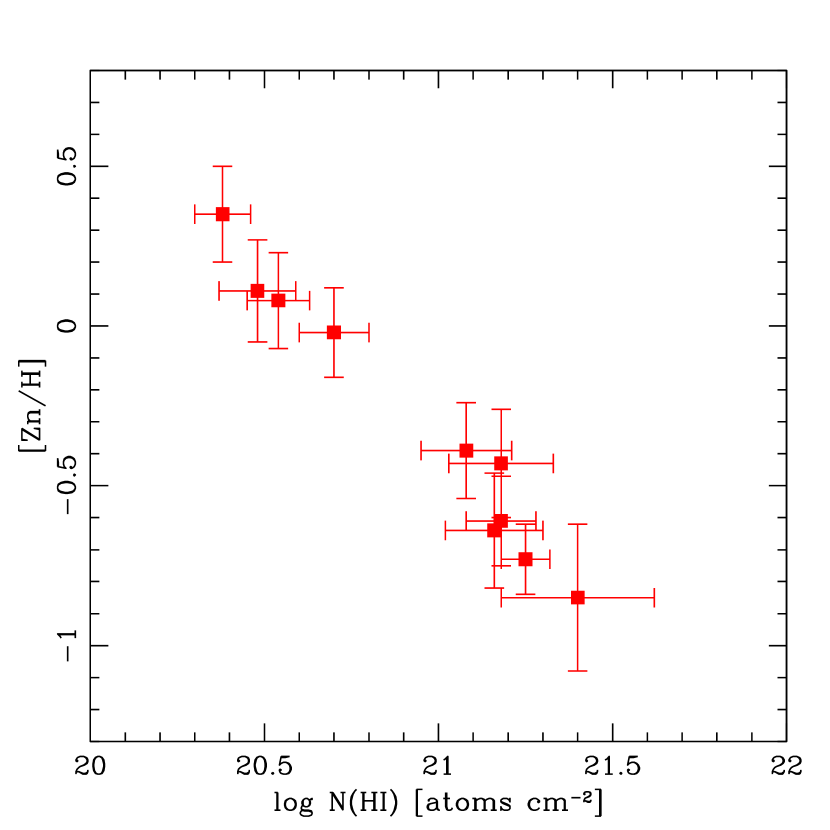
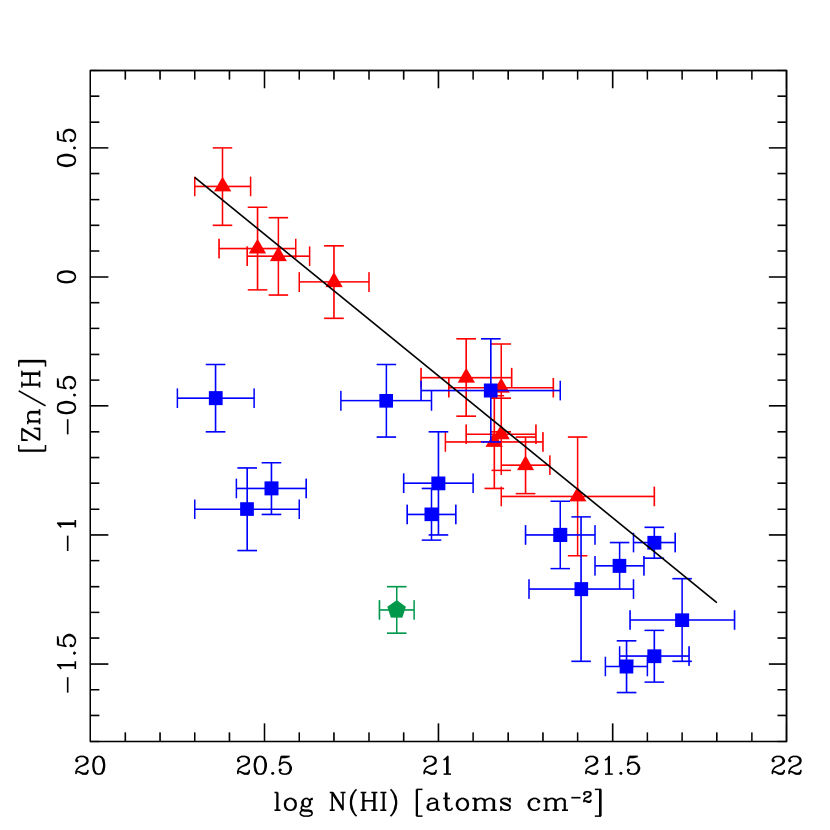
The SDSS spectroscopy shows that the Zn abundances of the systems in 1353+0333, 0831+3565, 1204+0338 and 1017+5356 are 224%, 129%, 120% and 95% of solar, placing these systems among the highest metallicity DLAs yet discovered near . Within our Zn ii-selected sample, these same four systems also have the lowest N(H i) values, with N(H i) atoms cm-2, and the largest depletion measures, with [Cr/Zn] . Figures 6 and 7 show these trends by plotting [Zn/H] as a function of [N(H i)/cm-2] and [Cr/H] as a function of [Zn/H], respectively.
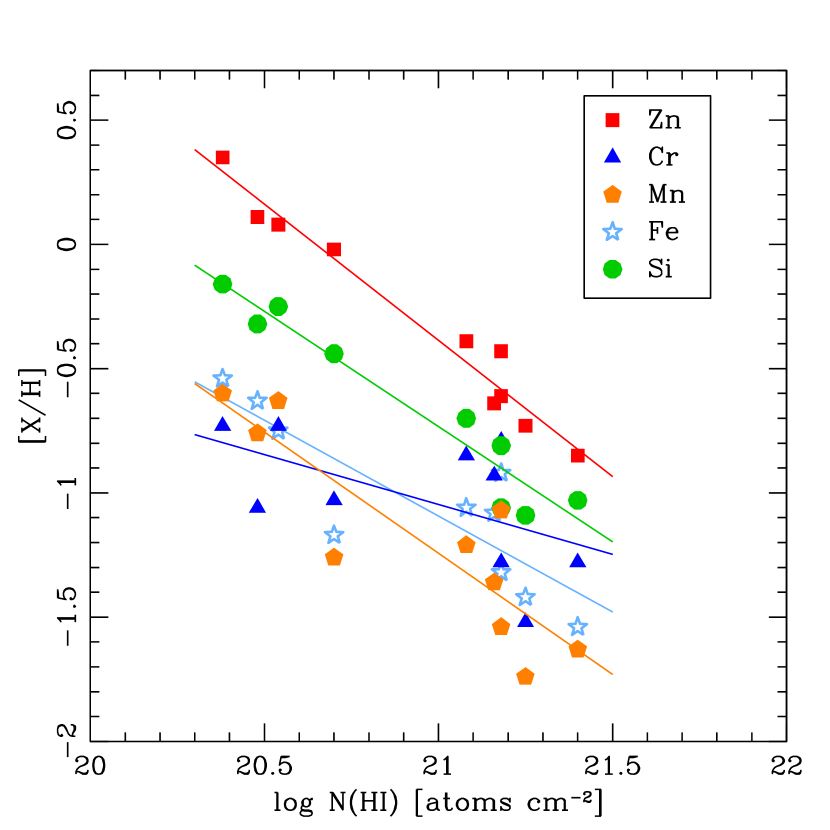
The metallicities of [Cr/H], [Mn/H], [Fe/H], and [Si/H] are plotted along with [Zn/H] as a function of [N(H i)/cm-2] in Figure 8, and linear fits are also shown for each data set. The error bars reported in Table 5 are not shown in Figure 8 to make it easier to see trends.
The elements Zn, Fe, and Cr are often assumed to track the Fe-peak elements and to have a common origin. Zn itself is not an Fe-peak element but it is produced by the same type of nucleosynthetic processes (nuclear statistical equilibrium) that produce normal Fe-peak elements, so it is often argued that it should generally track them. Therefore, since results indicate that Zn suffers little depletion in DLA absorbers, past investigators have often argued that it is useful to compare its metallicity to Fe-peak elements. At the same time, Skúladóttir et al. (2018, and references therein) have recently emphasized that although Zn primarily tracks Fe-peak elements in the Milky Way disk and halo stars, it is not clear that Zn can be used for this purpose in other environments (e.g. in the Milky Way bulge and satellite dwarfs).
As shown in Figures 6 and 8, at the highest N(H i) values where metallicity is lowest, [Zn/H] approaches , but at lower N(H i) where metallicity is largest, [Zn/H] approaches . The fit to [Cr/H] (Figure 8) shows a trend of increasing depletion of Cr with increasing metallicity (or with decreasing N(H i) values) relative to the [Zn/H] fit, and the fit to [Fe/H] shows a smaller but similar trend.
Our measurements of the Fe-peak element Mn are not atypical of those seen in other DLAs. This is apparent if one explores the tabulation for DLAs recently compiled by Quiret et al. (2016, and references therein). In our sample, [Mn/Zn] to within a few tenths of a dex throughout our range of N(H i) values and metallicities. [Mn/Fe] appears to change slightly from at the lowest N(H i) values and highest metallicities, to values of at the highest N(H i) values and lowest metallicities. The [Mn/Fe] values are similar to those seen in Galactic halo field stars and individual stars in globular clusters for [Fe/H] (Sobeck et al., 2006). The trend we see suggests that the origin of the Mn production is core collapse666Possibly asymmetric. supernovae prior to the time when SN1a are more frequent (Prantzos, 2005, and references therein); i.e., an increase in [Mn/Fe] is expected with increasing metallicity, which is consistent with our measurements. For comparison, the work discussed by Savage & Sembach (1996) indicates that Fe is significantly more depleted than Mn in cool Galactic disk clouds ([Mn/Fe] ), but that Mn and Fe are similarly depleted in warm Galactic halo clouds ([Mn/Fe] ). Our values of [Mn/Fe] lie mainly outside this range. Thus, the Mn measurements offer an important clue to the chemical history of the gas.
The -element Si only shows a minor change relative to Zn as a function of N(H i) or metallicity. We find [Si/Zn] , with more sub-solar values at lower N(H i) where [Zn/H] is higher. We note that very metal-poor Galactic halo stars, which represent an early stage of chemical evolution, show enhanced levels of -elements (e.g. McWilliam, 1997), and the lowest-metallicity DLAs (e.g., [Fe/H], which show little evidence for depletion) often show enhanced levels of -elements like Si, with [Si/Fe] (e.g. Cooke et al., 2011, and references therein). None of our Zn ii-selected systems display enhanced Si. Thus, none of the gas in these Zn ii-selected systems appears to be in the earliest stages of chemical evolution. This is consistent with the result that our Zn ii-selected sample is more chemically evolved with [Zn/H].
5 Potential of Expanding the Search of SDSS Quasars to Find Additional Detectable Zn ii Systems
As explained in Section 2, of the SDSS quasar Mg ii absorption systems we started with, after we applied our magnitude and absorption redshift cuts, we ended up with a set of to search for strong Zn ii. The cuts were motivated by the practical goal of obtaining a sample that could be observed with HST to determine N(H i) in a reasonable number of orbits. However, it is clear that by expanding the sample using a fainter magnitude cut and a broader redshift range, additional interesting objects would be found. The tenth Zn ii system in a fainter SDSS quasar, which was added to our sample because it had HST archival spectroscopy, is one such example. A more interesting example is the spectrum of SDSS J0831+2138 shown in Figure 9. It has a fiber magnitude of , so it was 1.0 magnitude too faint to be included in our sample (Section 2). There is a clear indication of the 2175 Å dust absorption feature in its spectrum. However, a discussion of such systems is beyond the limited scope of this paper.

6 Discussion and Conclusions
The methodology used in this study enabled us to sort through and efficiently identify a sample of DLAs with the highest Zn+ columns of gas in the redshift interval . We searched for Zn ii in relatively bright quasars with known strong Mg ii absorbers, and found that 36 (1.2%) of them exhibited strong Zn ii absorption. UV space spectroscopy of nine of these (25%), plus one in a fainter quasar with HST UV spectroscopy, then allowed us to measure N(H i) values and to establish that they were DLAs. These Zn ii-selected systems have column densities which lie in a relatively narrow range, N(Zn+) , which corresponds to a factor of . This narrow range evidently reveals a value for the typical maximum chemical enrichment into neutral gas regions that represent the DLAs. The ten systems studied here only span an N(H i) range of about a factor of ten ( [N(H i)/cm-2] ). This is a factor of five smaller than the observed range of DLA N(H i) values ( [N(H i)/cm-2] ). Figure 10 is similar to Figure 6, but in addition to showing [Zn/H] as a function of [N(H i)/cm-2] for our ten Zn ii-selected systems, it also shows values for all DLAs with Zn ii measurements at from the compilation of Quiret et al. (2016). This figure shows how our Zn ii-selected systems establish the upper envelope of the [N(H i)/cm-2] versus [Zn/H] relation at these redshifts.
The metallicities of these Zn ii-selected systems ([Zn/H]), along with their corresponding depletion measures, indicate that this neutral gas is not representative of gas still in its earliest stage of chemical evolution. But the [Mn/Fe] values ( [Mn/Fe] ) suggest that enrichment happened primarily from core collapse supernovae. And while our results trace the upper envelope of the metallicity distribution of DLAs as a function of N(H i), DLAs found in other surveys can fall more than two orders of magnitude below this envelope at lower metallicity; i.e., most DLAs are much more metal-poor at a given N(H i). In this context, it is interesting that the systems presented here have metallicities that match the most metal-rich components of halo field stars and globular clusters in external galaxies. For example, Lamers et al. (2017, and references therein, especially and ) discuss these metallicity distributions. Their work indicates that the halos can possess both metal-poor and metal-rich components; the metal-rich component has a tail that generally reaches metallicities as high as the DLAs that trace the upper envelope of the metallicity distribution.
A halo origin for the gas is supported by the relatively large impact parameters found by Rao et al. (2011) for galaxies associated with DLAs at .
Greater depletion measures are generally seen when neutral gas is denser (e.g. Savage & Bohlin, 1979; Spitzer, 1985; Jenkins et al., 1986, and references therein).777See Vladilo (2002), Vladilo et al. (2011), Jenkins & Wallerstein (2017), and references therein for recent work on improved methods to measure depletion patterns. In addition, as dictated by dust condensation temperatures, cooler gas has higher depletion measures than warmer gas (e.g., Savage & Sembach, 1996, see their figure 6). Thus, our more highly depleted systems, with [Cr/Zn]-1, [Zn/H]0, and lower N(H i) (Figures 6 and 7), would represent denser and/or cooler gas, while at the other extreme, the systems with [Cr/Zn], [Zn/H], and higher N(H i) would represent less dense and/or warmer gas. (See also the different slopes of the fits in Figure 8.) Our overall depletion measures are broadly consistent with metal-enriched gas residing in halos, with some warm disk gas mixed in at the highest metallicities. These trends may be related to the characteristics of the DLA host galaxy environment.
Given these trends, our findings should be considered in the context of work which has suggested that DLAs obey a mass-metallicity relation (e.g., Krogager et al., 2017), where higher-N(H i) DLAs are preferentially associated with galaxies that have lower mass-luminosity and lower metallicity. Relative to this model, our findings suggest that a follow-up DLA galaxy identification study of our sample should reveal a positive correlation between metallicity and galaxy luminosity and a negative correlation between N(H i) and galaxy luminosity. Since our sample selection method nicely defines the upper envelope to the negative correlation between metallicity and N(H i) (Figure 6), any correlations found with galaxy luminosity might also be well-defined.
Based on this study, the following conclusions can be reached:
(1) This sample of DLAs is biased by our Zn ii-selection method. Since they are not randomly selected, care should be taken when using them with other samples to draw conclusions. For example, when dealing with Mg ii-selected samples of DLAs, appropriate care must be taken to infer results on their incidence and cosmic mass density (Rao et al., 2017) and mean metallicity (Rao, Turnshek & Monier, 2018).
(2) At the same time, more detailed follow-up spectroscopic and imaging studies of this sample can reveal important information about the nature of the most metal-enriched DLAs and DLA galaxies at .
(3) The equation which establishes the upper envelope for DLA metallicity at as a function of N(H i) is [Zn/H] = . Since Zn might be depleted by one or two tenths of a dex, interpretation of this relationship may require some upward adjustment, especially at high metallicity.
(4) The measured transitions of other singly ionized refractory elements (Si, Cr, Fe, Mn) provide information on the levels of depletion and the extent to which the gas is chemically evolved.
(5) Taken together, the metallicity and depletion measurements of the gas suggest that it resides in halos, consistent with halo-sized impact parameters for DLAs found by Rao et al. (2011).
Acknowledgments
We thank the referee, Max Pettini, for his prompt review and helpful suggestions that improved the presentation of this work. Support for program #12308 was provided by NASA through a grant from the Space Telescope Science Institute, which is operated by the Association of Universities for Research in Astronomy, Inc., under NASA contract NAS 5-26555. D.B. received support from the R.V. Mancuso Summer Undergraduate Research Award from the Brockport Physics Department. The SDSS is managed by the Astrophysical Research Consortium for the Participating Institutions. The Participating Institutions are the American Museum of Natural History, Astrophysical Institute Potsdam, University of Basel, University of Cambridge, Case Western Reserve University, University of Chicago, Drexel University, Fermilab, the Institute for Advanced Study, the Japan Participation Group, Johns Hopkins University, the Joint Institute for Nuclear Astrophysics, the Kavli Institute for Particle Astrophysics and Cosmology, the Korean Scientist Group, the Chinese Academy of Sciences (LAMOST), Los Alamos National Laboratory, the Max-Planck-Institute for Astronomy (MPIA), the Max-Planck-Institute for Astrophysics (MPA), New Mexico State University, Ohio State University, University of Pittsburgh, University of Portsmouth, Princeton University, the United States Naval Observatory, and the University of Washington. This research has made use of the Keck Observatory Archive (KOA), which is operated by the W. M. Keck Observatory and the NASA Exoplanet Science Institute (NExScI), under contract with NASA.
References
- Asplund et al. (2009) Asplund M., Grevesse N., Sauval A. J., Scott P., 2009, ARA&A, 47, 481
- Beasley et al. (2008) Beasley M. A., Bridges T., Peng E., Harris W. E., Harris G. L. H., Forbes D. A., Mackie G., 2008, MNRAS, 386, 1443
- Cooke et al. (2011) Cooke R., Pettini M., Steidel C. C., Rudie G. C., Nissen P. E., 2011, MNRAS, 417, 1534
- De Cia et al. (2018) De Cia A., Ledoux C., Petitjean P., Savaglio S., 2018, A&A, 611, A76
- Dessauges-Zavadsky et al. (2003) Dessauges-Zavadsky M., Péroux C., Kim T.-S., D’Odorico S., McMahon R. G., 2003, MNRAS, 345, 447
- Ibata et al. (2014) Ibata R. A., et al., 2014, ApJ, 780, 128
- Jenkins & Wallerstein (2017) Jenkins E. B., Wallerstein G., 2017, ApJ, 838, 85
- Jenkins et al. (1986) Jenkins E. B., Savage B. D., Spitzer Jr. L., 1986, ApJ, 301, 355
- Kisielius et al. (2015) Kisielius R., Kulkarni V. P., Ferland G. J., Bogdanovich P., Som D., Lykins M. L., 2015, ApJ, 804, 76
- Krogager et al. (2017) Krogager J.-K., Møller P., Fynbo J. P. U., Noterdaeme P., 2017, MNRAS, 469, 2959
- Lamers et al. (2017) Lamers H. J. G. L. M., Kruijssen J. M. D., Bastian N., Rejkuba M., Hilker M., Kissler-Patig M., 2017, A&A, 606, A85
- McWilliam (1997) McWilliam A., 1997, ARA&A, 35, 503
- Monier et al. (2009) Monier E. M., Turnshek D. A., Rao S. M., Weyant A., 2009, AJ, 138, 1609
- Morton (2003) Morton D. C., 2003, ApJS, 149, 205
- Nestor et al. (2003) Nestor D. B., Rao S. M., Turnshek D. A., Vanden Berk D., 2003, ApJ, 595, L5
- Noterdaeme et al. (2012) Noterdaeme P., et al., 2012, A&A, 547, L1
- Pettini et al. (1990) Pettini M., Boksenberg A., Hunstead R. W., 1990, ApJ, 348, 48
- Pettini et al. (1994) Pettini M., Smith L. J., Hunstead R. W., King D. L., 1994, ApJ, 426, 79
- Prantzos (2005) Prantzos N., 2005, Nuclear Physics A, 758, 249
- Quider et al. (2011) Quider A. M., Nestor D. B., Turnshek D. A., Rao S. M., Monier E. M., Weyant A. N., Busche J. R., 2011, AJ, 141, 137
- Quiret et al. (2016) Quiret S., et al., 2016, MNRAS, 458, 4074
- Rao & Turnshek (2000) Rao S. M., Turnshek D. A., 2000, ApJS, 130, 1
- Rao et al. (2006) Rao S. M., Turnshek D. A., Nestor D. B., 2006, ApJ, 636, 610
- Rao et al. (2011) Rao S. M., Belfort-Mihalyi M., Turnshek D. A., Monier E. M., Nestor D. B., Quider A., 2011, MNRAS, 416, 1215
- Rao et al. (2017) Rao S. M., Turnshek D. A., Sardane G. M., Monier E. M., 2017, MNRAS, 471, 3428
- Rao et al. (2018) Rao S. M., Turnshek D. A., Monier E. M., 2018, Submitted
- Savage & Bohlin (1979) Savage B. D., Bohlin R. C., 1979, ApJ, 229, 136
- Savage & Sembach (1996) Savage B. D., Sembach K. R., 1996, ARA&A, 34, 279
- Skúladóttir et al. (2018) Skúladóttir Á., Salvadori S., Pettini M., Tolstoy E., Hill V., 2018, A&A, 615, A137
- Sobeck et al. (2006) Sobeck J. S., Ivans I. I., Simmerer J. A., Sneden C., Hoeflich P., Fulbright J. P., Kraft R. P., 2006, AJ, 131, 2949
- Spitzer (1985) Spitzer Jr. L., 1985, ApJ, 290, L21
- Vladilo (2002) Vladilo G., 2002, ApJ, 569, 295
- Vladilo et al. (2001) Vladilo G., Centurión M., Bonifacio P., Howk J. C., 2001, ApJ, 557, 1007
- Vladilo et al. (2011) Vladilo G., Abate C., Yin J., Cescutti G., Matteucci F., 2011, A&A, 530, A33
- Wolfe et al. (1986) Wolfe A. M., Turnshek D. A., Smith H. E., Cohen R. D., 1986, ApJS, 61, 249