The role of radioactive nickel in shaping the plateau phase of Type II supernovae
Abstract
In the present study, we systematically explore the effect of the radioactive 56Ni and its mixing properties in the ejecta on the plateau of Type IIP supernovae (SNe). We evaluate the importance of 56Ni in shaping light curves of SNe IIP by simulating light curves for two red supergiant models using different amounts of 56Ni and with different types of mixing: uniform distribution of 56Ni out to different fractions of the envelope and “boxcar” distribution of 56Ni. We find, similarly to previous studies, that 56Ni extends duration of the plateau. We find a formula to estimate the extension based on the observed bolometric light curves and show that for most SNe IIP 56Ni extends the plateau by about 20 %. Another effect of 56Ni consists in reduction of the plateau decline rate, i.e. 56Ni presented in the ejecta flattens the plateau. Our simulations suggest that for typical SNe IIP it can reduce the decline rate by about 1 mag/100 day. We find that for the contribution of 56Ni seen in most SNe our simulated bolometric light curves resemble observed ones for various types of 56Ni mixing. We thereby cannot determine the level of 56Ni mixing in these SNe based on the light curve alone. However, for SN 2009ib we find that only a model where 56Ni is mixed significantly throughout most of the hydrogen envelope is consistent with the observed light curve. Our light curves are available via link https://wwwmpa.mpa-garching.mpg.de/ccsnarchive/data/Kozyreva2018/.
keywords:
supernovae: general – supernovae – stars: massive – radiative transfer1 Introduction
Type II supernovae (SNe II), i.e. those supernovae (SNe) which display strong hydrogen lines in the spectra at the time of discovery, are the most common explosions in the volume-limited sample (Smartt, 2009; Smith et al., 2011; Li et al., 2011). Among them, Type IIP SNe remain bright during about 100 days showing the so-called plateau phase. They contribute 50% to 80% to all core-collapse explosions. Roughly 75% of all stellar explosions are core-collapse SNe (Mackey et al., 2003; Dahlen et al., 2004; Mannucci et al., 2007). CCSNe originate from explosions of massive stars, i.e. stars with initial masses above 8 and below 100 . Progenitors for SNe II are stars which retain hydrogen envelopes by the time of iron-core collapse, among which extended red supergiants produce SNe IIP (Shklovskii, 1960; Grasberg et al., 1971; Smartt, 2009).
| model | Radius | Mtot | MH | MHe | MC | MO | MNe | MNi | mixed in | Eexpl | |||
| [] | [] | [] | [] | [] | [] | [] | [] | [fraction of ejecta] | [foe( erg)] | ||||
| m12 | 496 | 11.25 | 5.4 | 3.8 | 0.09 | 0.6 | 0.04 | 0 | centre | uniform | 0.4 | ||
| 0.011 | 0.22 | 1/3 | 2/3 | 1 | 0.9 | ||||||||
| 0.025 | 1.35 | ||||||||||||
| 0.045 | |||||||||||||
| 0.065 | |||||||||||||
| 0.137 | |||||||||||||
| m15 | 631 | 13.4 | 6.0 | 4.3 | 0.17 | 0.2 | 0.24 | 0 | centre | boxcar | 0.53 | ||
| 0.028 | 0.4 | 0.16 | 0.31 | 1.1 | |||||||||
| 0.056 | uniform | 1.53 | |||||||||||
| 0.113 | 0.46 | 0.88 | |||||||||||
A given progenitor with a particular radius, mass, density, chemical structure, and explosion energy defines a unique light curve. However, the common task is to solve the reverse problem, i.e. determine the progenitor parameters from observational signatures of the SN explosion. Early studies estimated the progenitor and explosion parameters from the SN IIP light curve and photospheric velocity observations taking into account that the plateau phase is supported mostly by the thermal energy deposited by the shock wave which unbinds the progenitor envelope and that its evolution is dictated by the cooling and recombination wave receding through the expanding envelope (Grasberg et al., 1971; Grasberg & Nadezhin, 1976; Falk & Arnett, 1977; Litvinova & Nadezhin, 1985; Popov, 1993). These studies provide formulae that relate light curve properties, mostly the plateau luminosity and duration and the photospheric velocity, to the most general progenitor properties (mass and radius) and the explosion energy. This is done using models with different levels of approximations of the the recombination wave that crosses the hydrogen envelope, neglecting contribution from freshly made radioactive 56Ni. However, more recent studies have shown that the energy input from radioactive decay of nickel 56Ni and cobalt 56Co strongly affects the behavior of the cooling wave and the resulting observations in SNe IIP (Young, 2004; Kasen & Woosley, 2009; Bersten et al., 2011, and others). As a result, estimates which ignore the contribution of 56Ni can be highly inaccurate.
The energy deposited by the radioactive decay of 56Ni starts affecting the observed emission as soon as the recombination wave encounters Ni-generated photons diffusing through the inner ejecta. Once that happens 56Ni energy deposition tends to increase the luminosity compared to the emission if no 56Ni was present. Since 56Ni contribution is more dominant at later times, it has two major effects. First, it delays the propagation of the recombination wave, thereby extending the plateau duration (e.g., Kasen & Woosley, 2009). Second, it reduces luminosity decline rate, making the plateau “flatter” (e.g., Bersten et al., 2011). The exact effect depends on the total abundance of 56Ni and on its mixing throughout the envelope.
Recently, Nakar et al. (2016) introduced an observable that measures the importance of 56Ni in the light curve of Type II SNe. They also analysed 24 observed SNe IIP and evaluated the importance of 56Ni heating for the plateau phase. They concluded that 56Ni contributes to most SN IIP plateaus in their study and plays an important role where the effect consists of both an extension and a flattening of the plateau. In Section 2 we give a brief description of the observable introduced by Nakar et al. (2016) and of the results of their analysis.
The goal of this paper is to study numerically the effect of 56Ni on the light curve of type II SNe, and especially how the signature of 56Ni depends on its mixing through the envelope. In order to do that we carry out simulations of two red supergiant progenitors and their explosions (Section 3). We explore the effect of Ni-heating during photospheric phase, by varying the amount of 56Ni and its mixing as well as the explosion energy (Section 3.1), and analyse the obtained light curves in the context of observations using the measures introduced in Nakar et al. (2016) (Section 4). We summarise the conclusions of our study in Section 5.
2 Observable that measures the importance of 56Ni
The main difficulty in measuring the effect of 56Ni is that radiative transfer couples the energy deposited by the 56Ni to the energy deposited by the SN shock (e.g., by affecting the ionization and thereby the opacity) in a way that the instantaneous luminosity cannot be separated to the contribution of each component. However, Nakar et al. (2016) have shown that there are integrated observable quantities where this separation is possible. They generalized the result of Katz et al. (2013) that have shown that the integral of the time weighted bolometric luminosity is a highly accurate measure of the integral over the time weighted energy deposition. Now, since the amount of 56Ni in Type II SNe can be measured quite accurately from their nebular phase, one can separate the time weighted energy deposition to that of the initial energy deposited by the shock and the additional energy deposited by radioactive decay. Nakar et al. (2016), therefore, defined the observable:
| (1) |
where is the time since the explosion, is the instantaneous bolometric luminosity and is the instantaneous deposition of energy by radioactive decay. is the time that the photospheric phase ends, which is marked by the end of luminosity drop at the end of the plateau and the beginning of the the 56Co tail.
The time weights in the integrals account for the adiabatic losses of the radiation between the time that the energy is deposited and the time that it is released, making this observable to be one of the few that are insensitive to the unknown details of the radiation transfer through the envelope. The numerator is insensitive to the radiation deposited by the SN shock. it measures the integrated time weighted luminosity that we would have seen if all the emission were powered by 56Ni (as, for example, in Type I SNe) and it is roughly proportional to . The denominator is insensitive to the presence of 56Ni and it measures the integrated time weighted luminosity that we would have seen if there were no 56Ni. Shussman et al. (2016) studied the physical meaning of the denominator, which they denote as ET. They show that it depends on the progenitor structure as well as the explosion energy and that for red-supergiants that retain most of their H envelope it can be roughly approximated as , where is the kinetic energy at infinity (defined as the explosion energy), is the ejecta mass and is the progenitor radius.
is a measure of the importance of 56Ni in shaping the emission that we see. If then 56Ni is unimportant and there is a little difference between the observed light curve and the one that would have been observed if there were no 56Ni. If it implies that most of the observed emission is generated by 56Ni (this is the case in type I SNe). Nakar et al. (2016) analysed 24 type II SNe with a good bolometric (or pseudo-bolometric) light curves and calculated the value of for these SNe. They find that for all SNe except one, falls within the range . SN 2009ib is an exception which has .
56Ni is expected to affect the decline rate during the plateau as well, and indeed Nakar et al. (2016) found that is anti-correlated with the decline rate. 56Ni is also supposed to extend the duration of the plateau. In the following section we examine these expectations using numerical simulations.
3 Input models
For our analysis we computed two hydrogen-rich red supergiant models m12
and m15 with initial masses of 12 and 15 , correspondingly
(see Table 1).
The models are at solar metallicity and non-rotating. The mixing-length parameter is chosen
equal to 3.
The main property of the models is the presence of a hydrogen-rich (total
hydrogen mass 5.4 and 6 ) extended envelope (496 and 631 ).
We apply the following method. Firstly,
the stellar evolution from zero-age main sequence until the formation of an
iron core was computed with
MESA111Modules for Experiments in Stellar Astrophysics
http://mesa.sourceforge.net/
(Paxton et al., 2011; Paxton
et al., 2013, 2015)..
Secondly, the models were blown up with V1D.
Explosion is created by means of a piston, which is set at a
Lagrangian mass of choice, given initial velocity equal to the escape
velocity, and then allowed to free-fall.
Thirdly, were mapped into the radiation hydrodynamics code STELLA to
follow the post-explosion evolution.
V1D is a one-dimensional hydrodynamics version of the code
Vulcan (Livne, 1993).
V1D solves the equations of motion using explicit Lagrangian hydrodynamics. The
radiative-transport in V1D is solved under the assumption of LTE and diffusion approximation
for radiative transfer. The opacities in V1D are computed based on the opacity
routines of CMFGEN
(Dessart &
Hillier, 2010; Dessart
et al., 2010, 2015).
Our main light curve simulations are carried out with STELLA which is a one-dimensional hydrodynamics
code which solves radiative transfer equations in hundred frequency bins in
momentum approximation (Blinnikov et al., 1998, 2006).
Additionally, we carried out radiative transfer simulations with the
multi-group extension to V1D and compare to the main results computed
with STELLA.
The explosion of the m12 and m15 models by V1D was done using default explosion energy of 0.9 foe and 1.1 foe,
correspondingly. To vary explosion energy, we modified velocity profile of the shocked material
via multiplying by a certain factor while mapping the models into STELLA. The explosion
energy of the models we run is defined as the kinetic energy at infinity and it is: 0.4 foe, 0.9 foe, and 1.35 foe
for m12, and 0.53 foe, 1.1 foe, and 1.53 foe for m15.
3.1 Nickel mixing setup
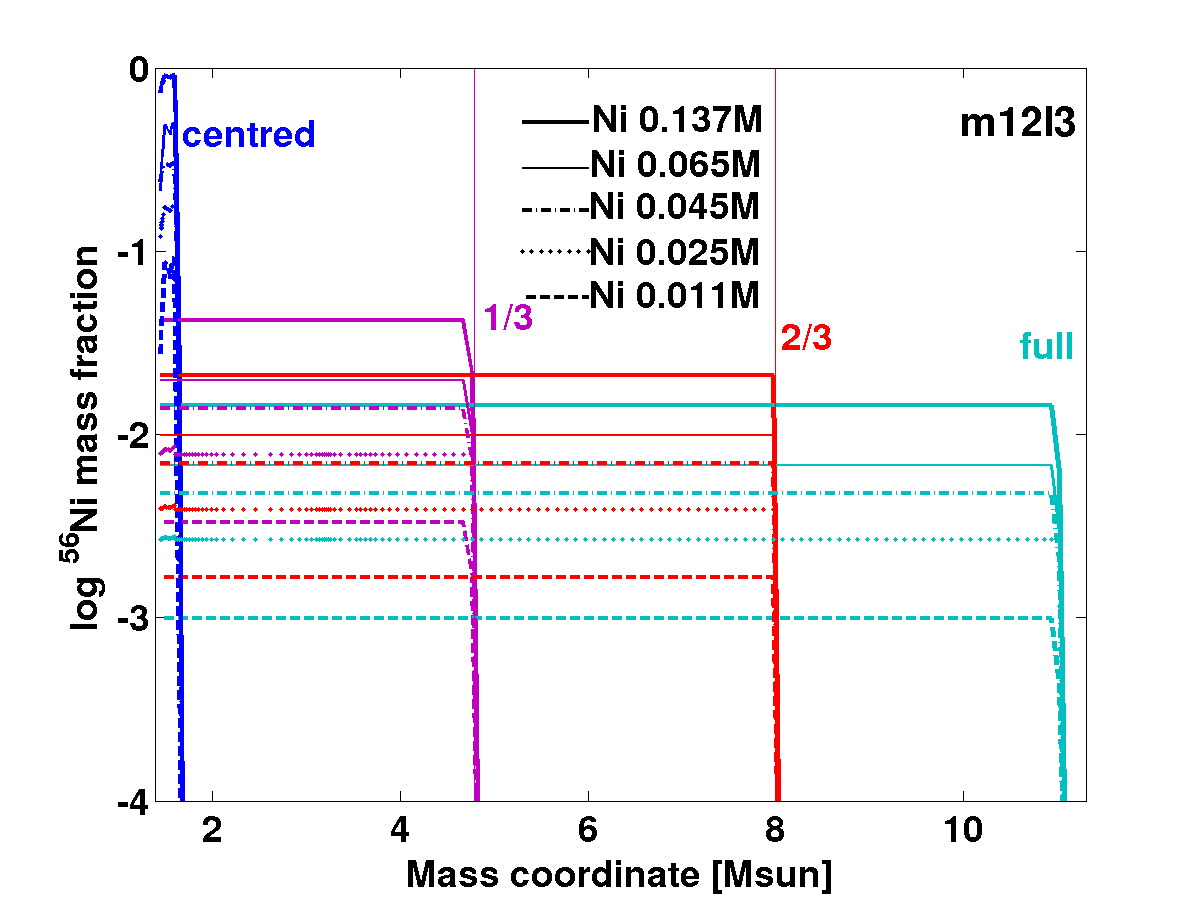
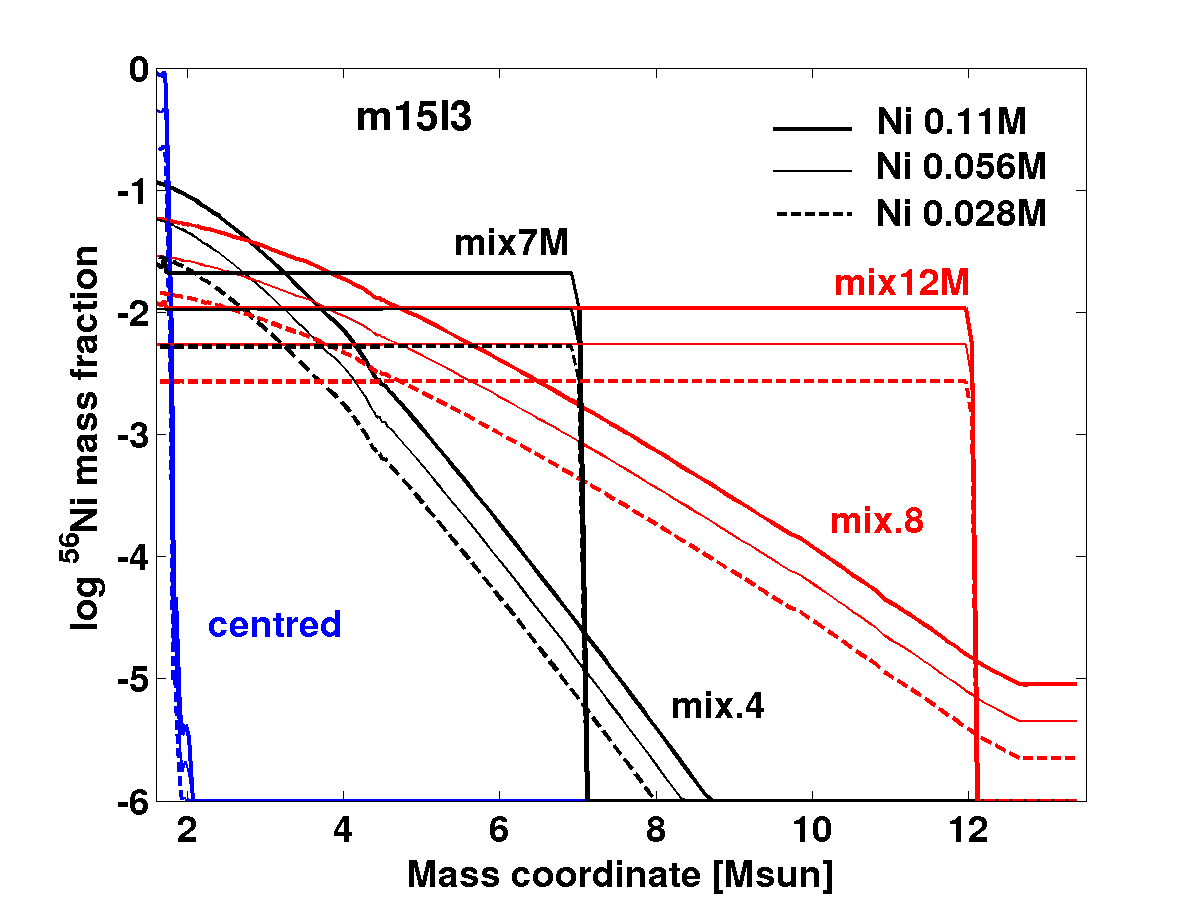
In Figure 1, we demonstrate the input profiles for 56Ni
distribution in the ejecta.
The values of 56Ni mass that we set are, 0.011 , 0.025 ,
0.045 , 0.065 , 0.14 , and no nickel for m12 (Fig. 1 left), and
0.028 , 0.056 , 0.11 , and no nickel for m15 (Fig. 1 right).
By default 56Ni is concentrated to the inner 0.22 and
0.4 in the model m12 and the model m15, correspondingly.
Default distribution of 56Ni comes from V1D
simulations of the piston-driven explosion. Nucleosynthesis in V1D
is done with the implemented nuclear network which includes 54 isotopes.
Reaction rates are as given in the non-smoker database
https://nucastro.org/nonsmoker.html.
Throughout the paper we call this kind of unmixed distribution as “centrally located” or “centrally concentrated” 56Ni. We apply two kinds of mixing. For the model m12, we uniformly spread radioactive nickel in 1/3, 2/3 and in the entire (so-called “full”) ejecta mass. For uniform mixing, 56Ni is set as shown in Figure 1 while mass fraction of the rest species are recalibrated in each Lagrangian zone to keep the sum of mass fraction equal unity. For the model m15, we applied both uniform and so-called “boxcar” mixing. For boxcar mixing, we loop over all zones of the model. For each zone, with Lagrangian mass , we uniformly mix the composition in all zones between and , where is the boxcar parameter, e.g. 0.4, 0.8, in units. We repeat the above procedure a total of four times.
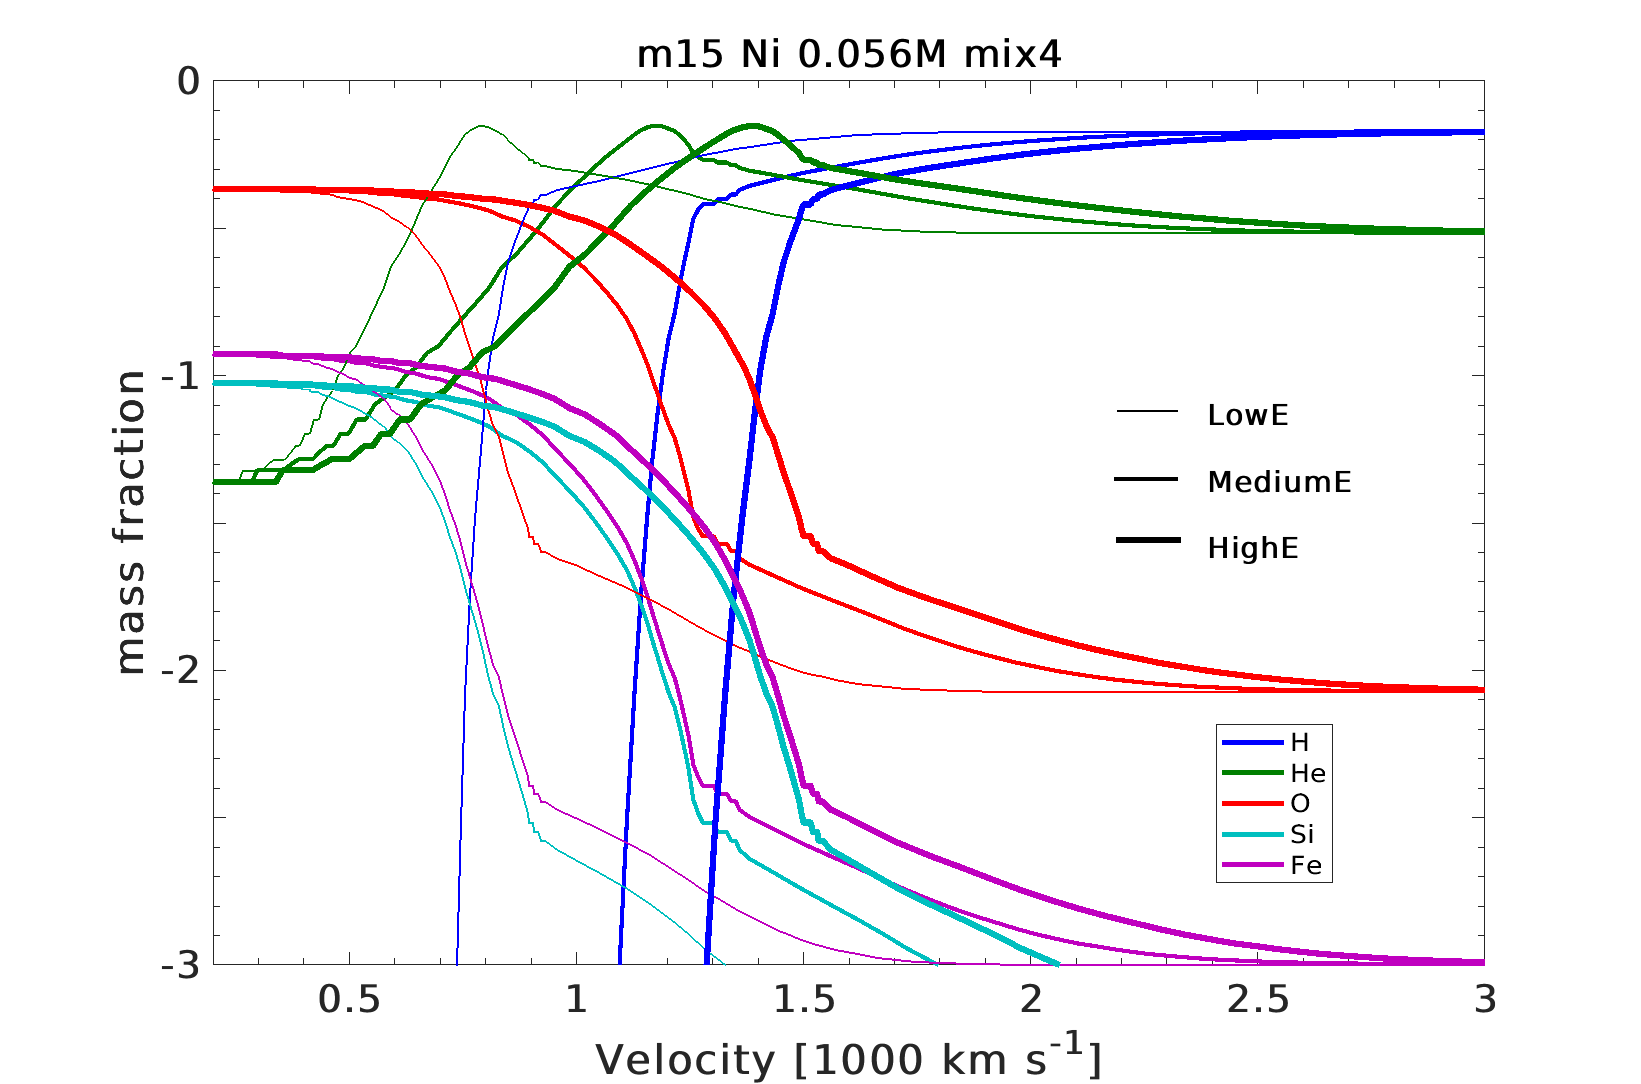
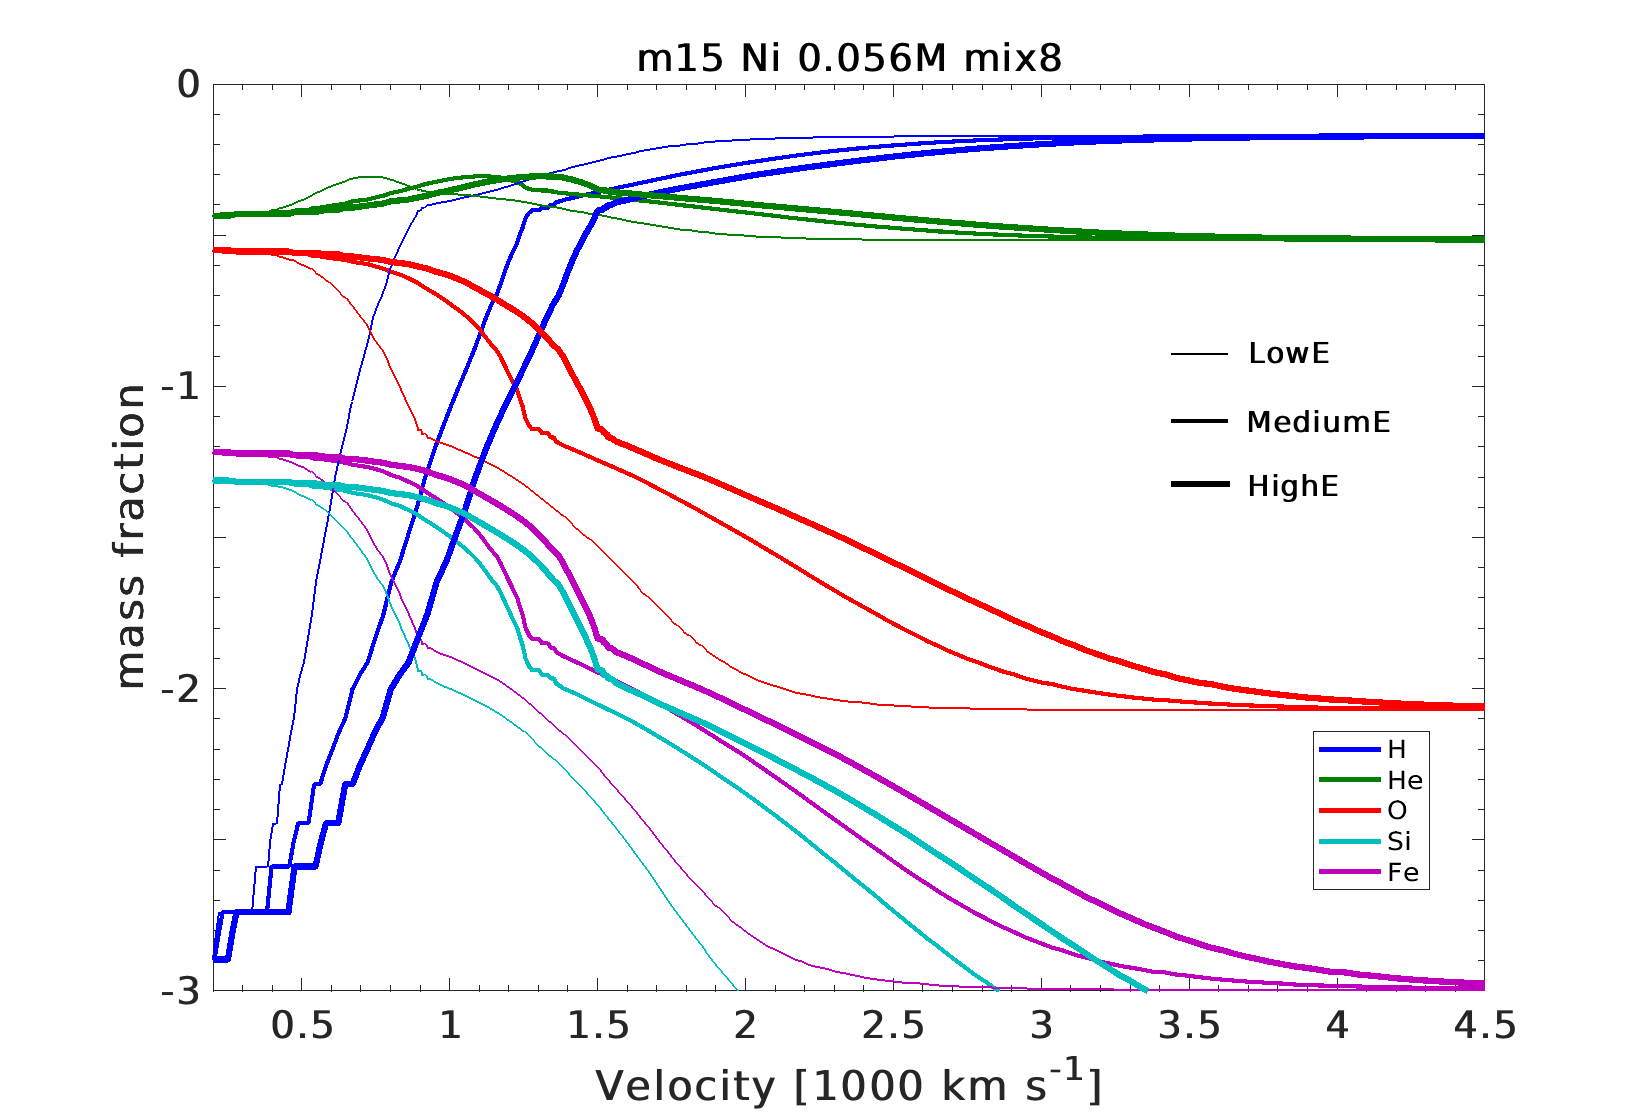
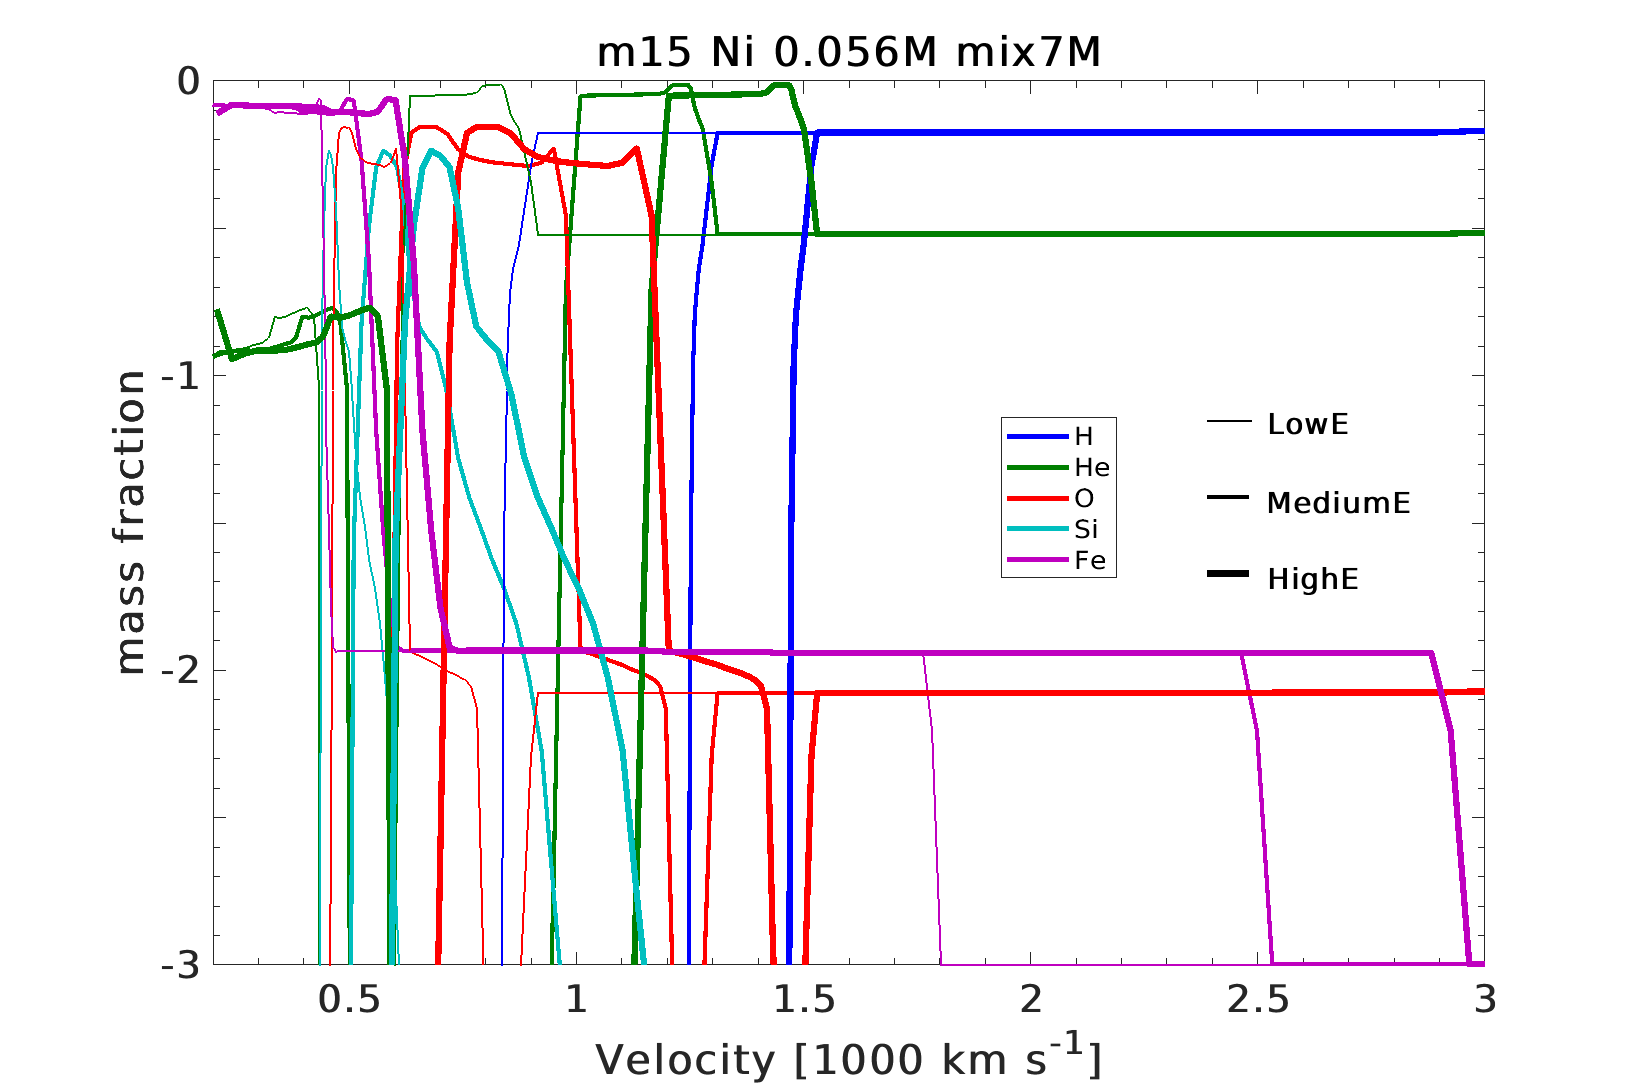
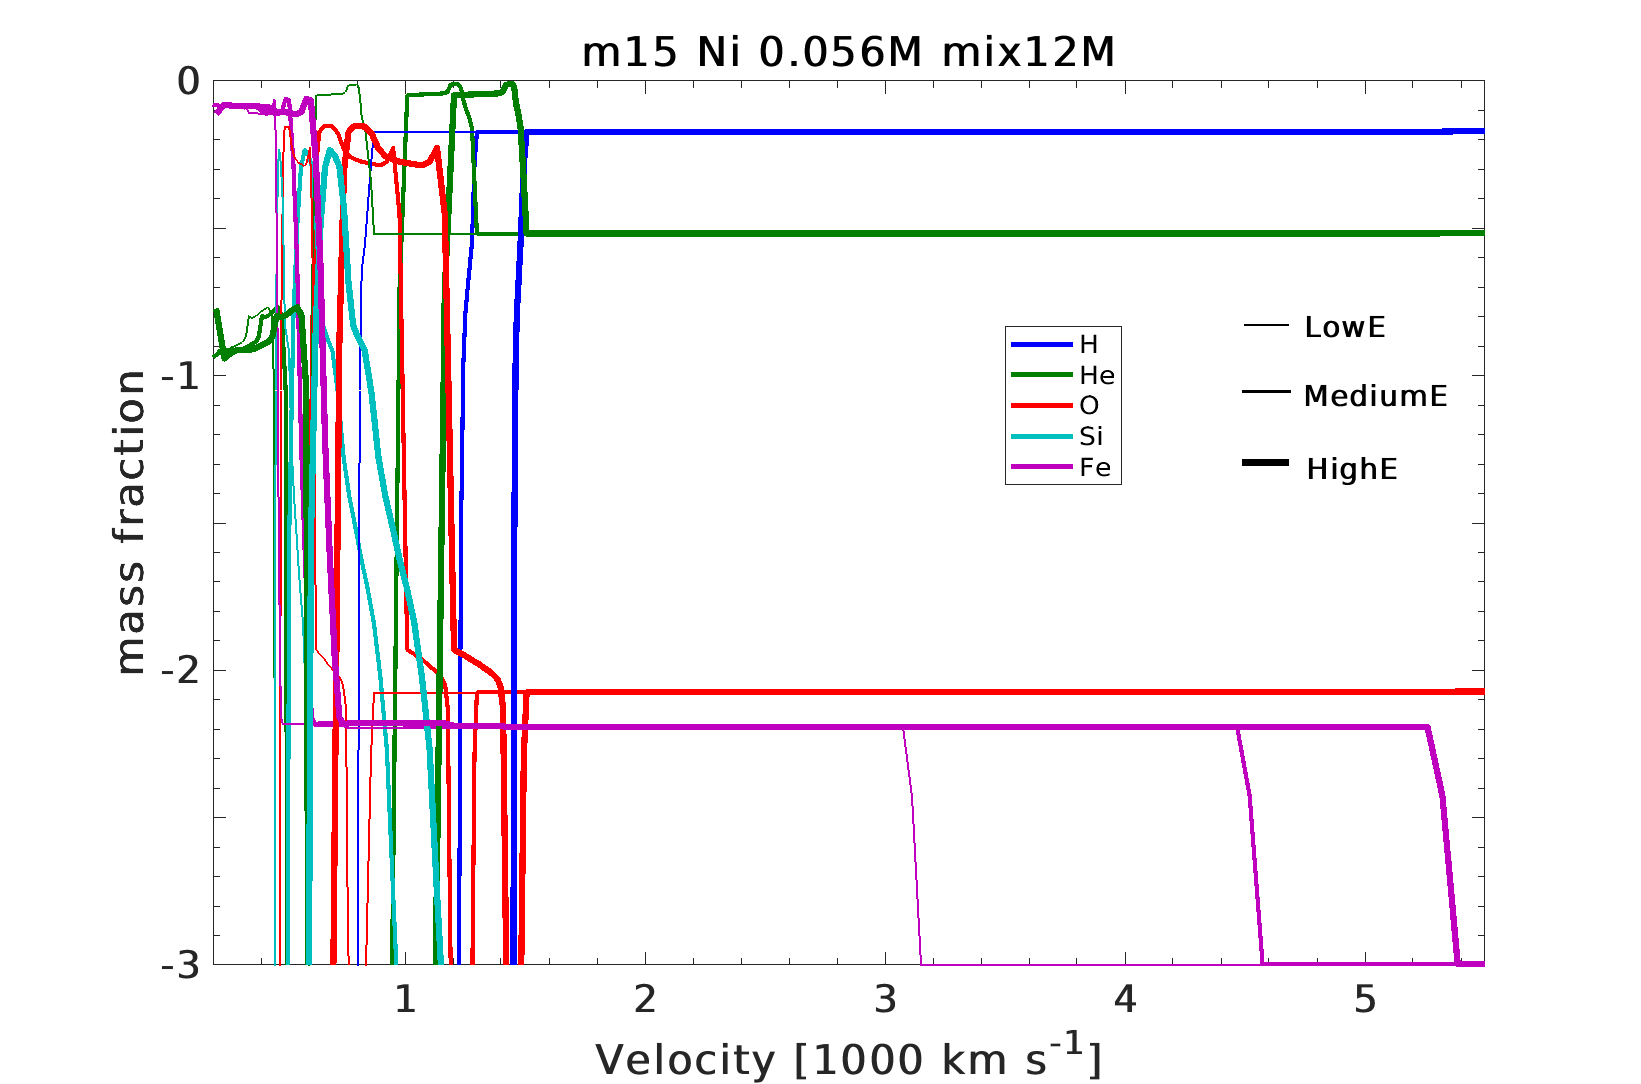
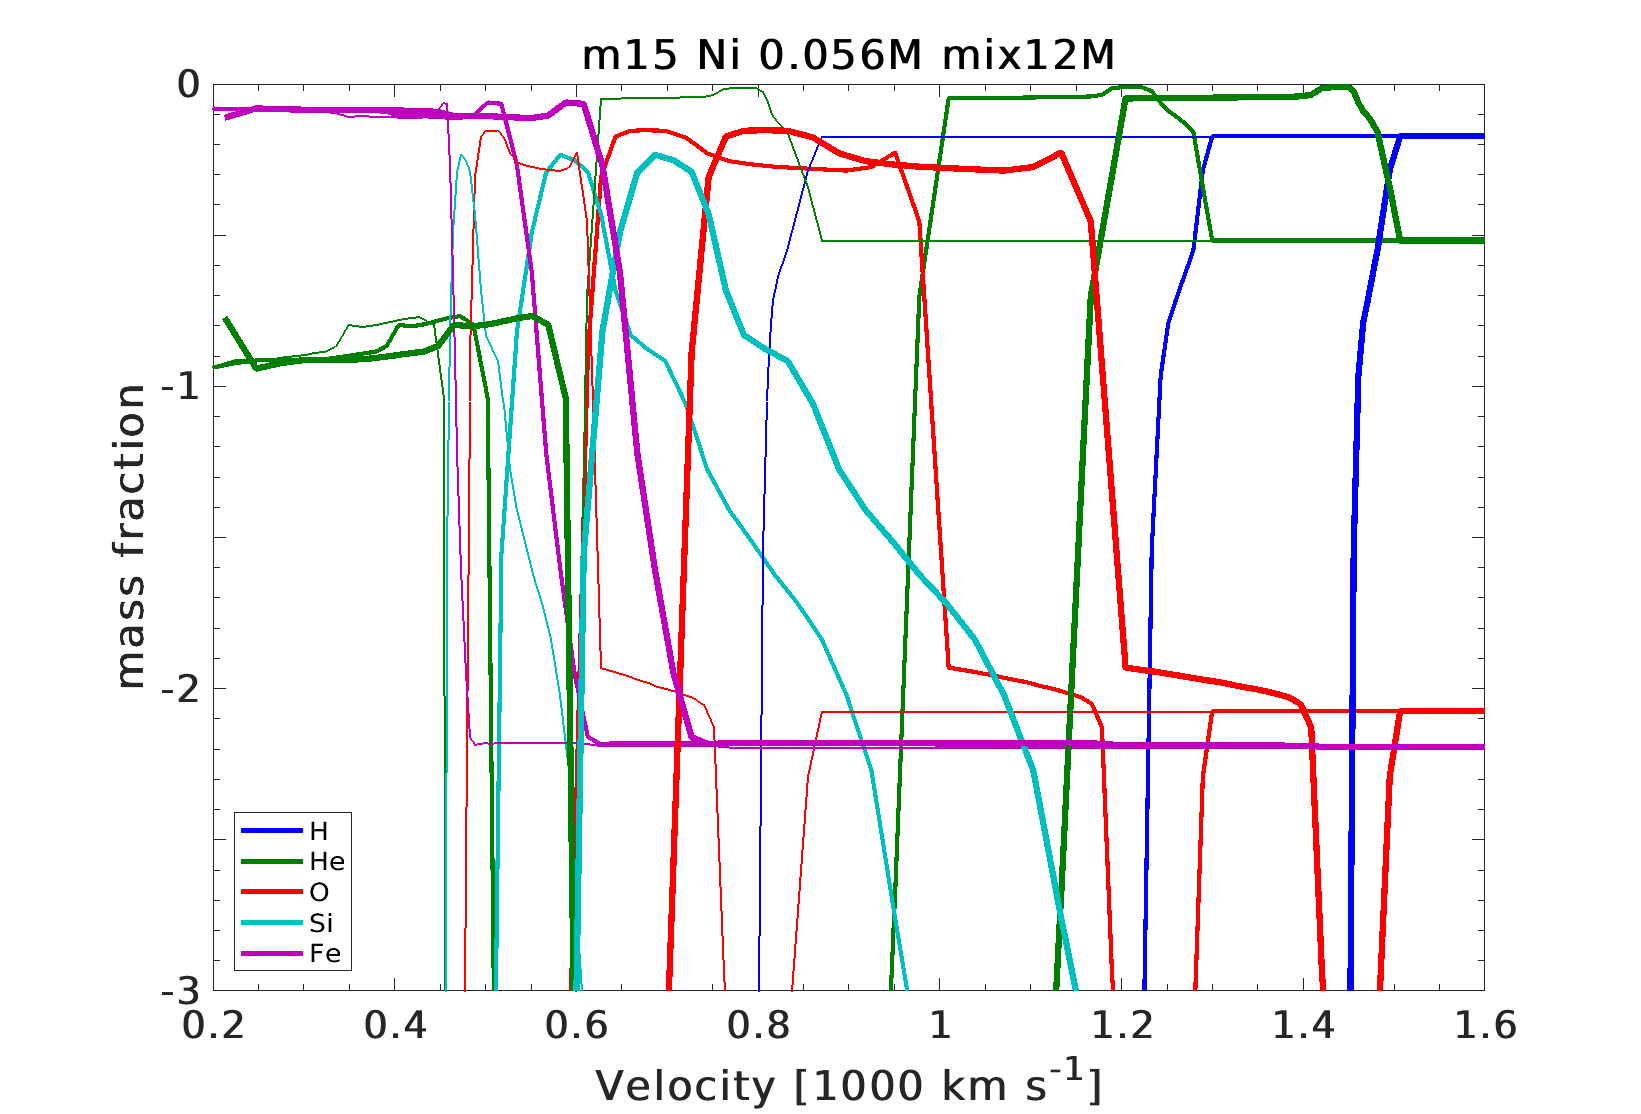
The “boxcar” method is supposed to imitate mixing of chemical elements taking place during the earlier phase of expansion in core-collapse explosions. “Mix.4” means 56Ni distribution in which we applied “boxcar”-mixing with the “boxcar”-parameter 0.4. “Mix.8” stands for mixing with the “boxcar”-parameter 0.8. In fact, 95 % of 56Ni is located in the inner 3.5 and 5.3 for “mix.4” and “mix.8”, correspondingly, i.e. in 0.16 and 0.31 of the ejecta. “Mix7M” and “Mix12M” mean uniform mixing of 56Ni in 7 (46 %) and 12 (88 %) of the expanding ejecta, correspondingly.
In total, each evolutionary model has 6 and 4 values for mass of 56Ni, 3 and 5 kinds of mixing, for m12 and m15 respectively, and 3 values for explosion energy.
4 Results
4.1 Light curves
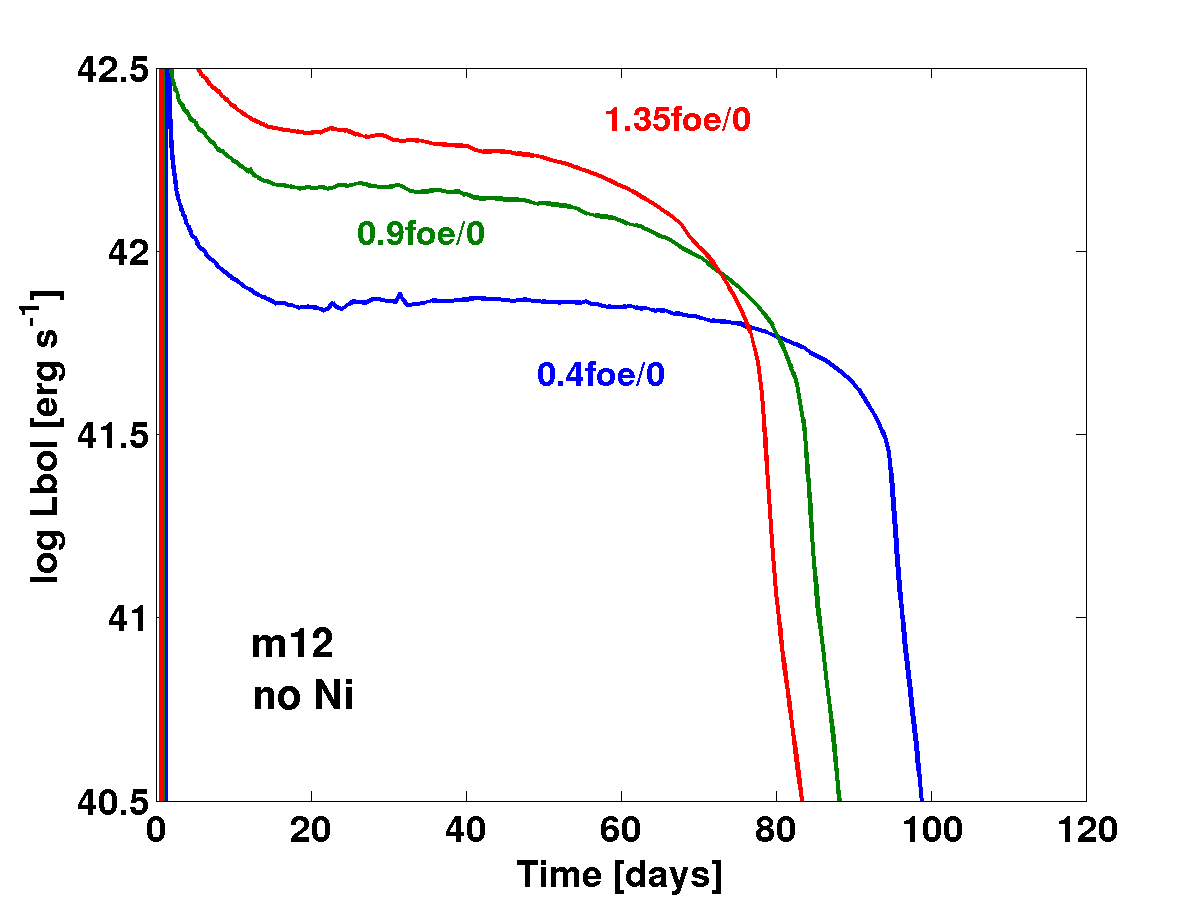
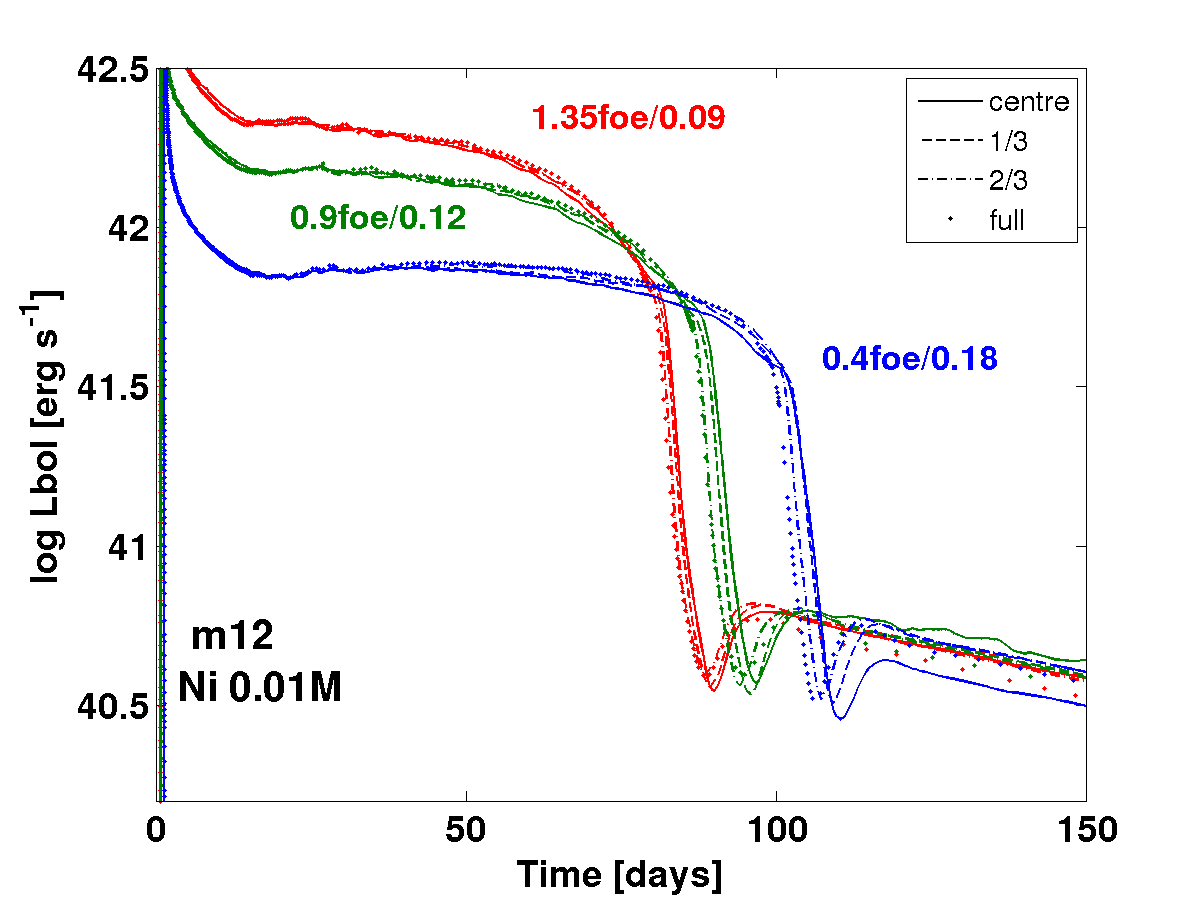
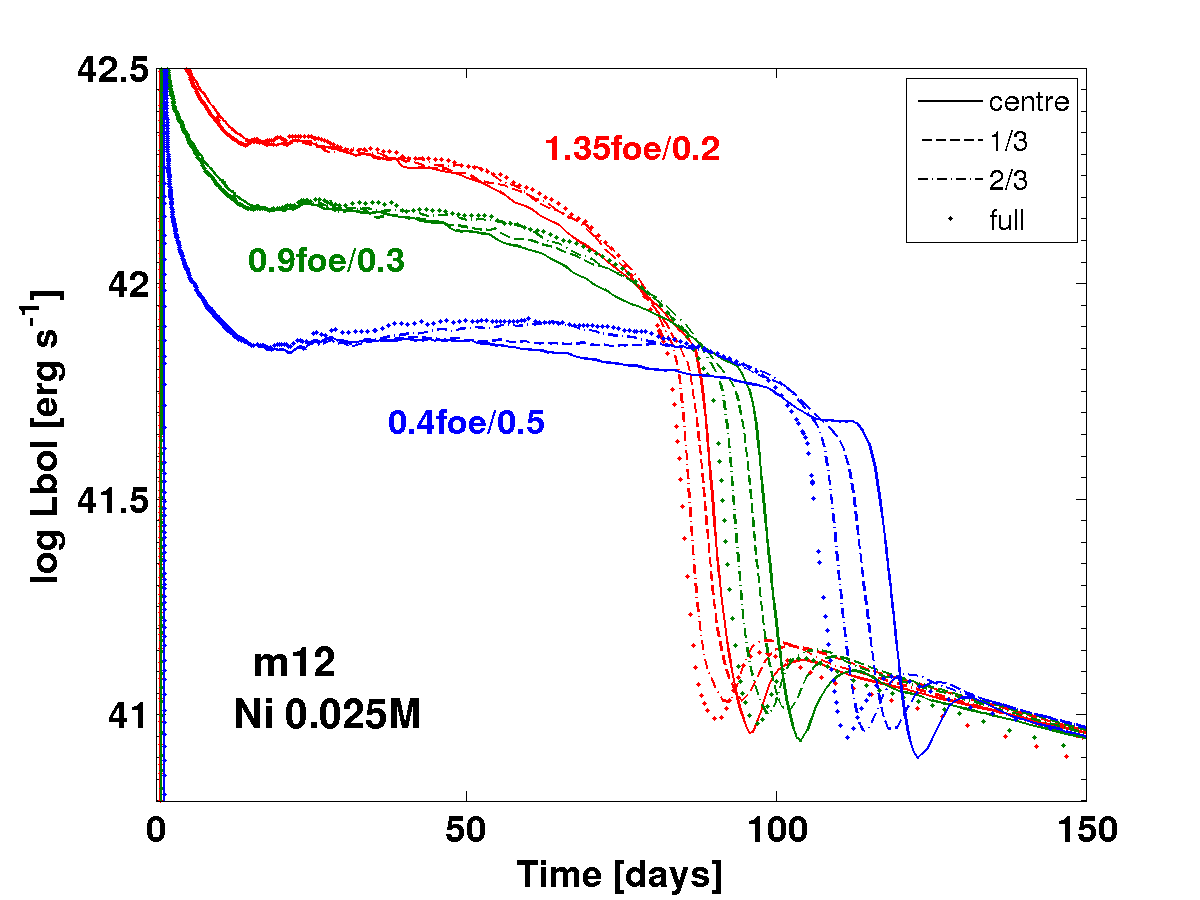
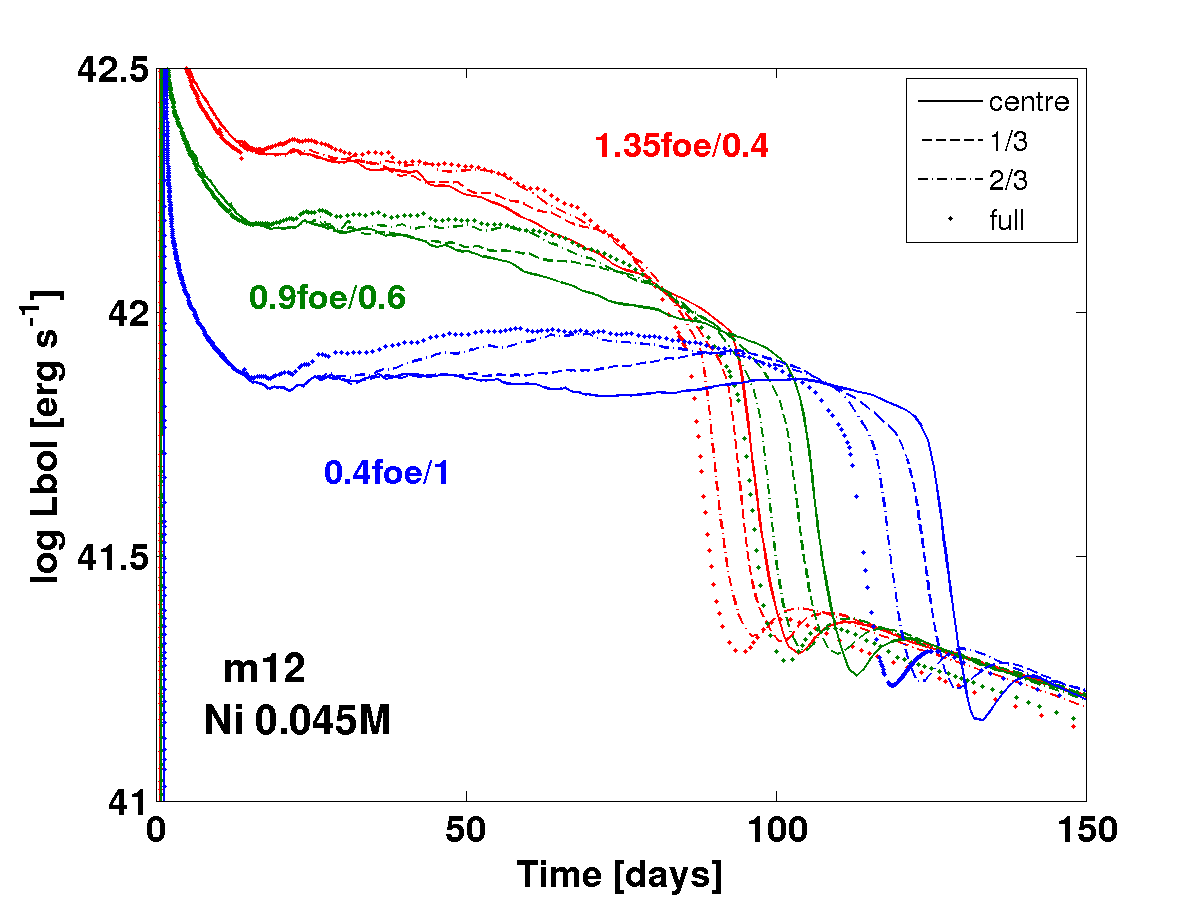
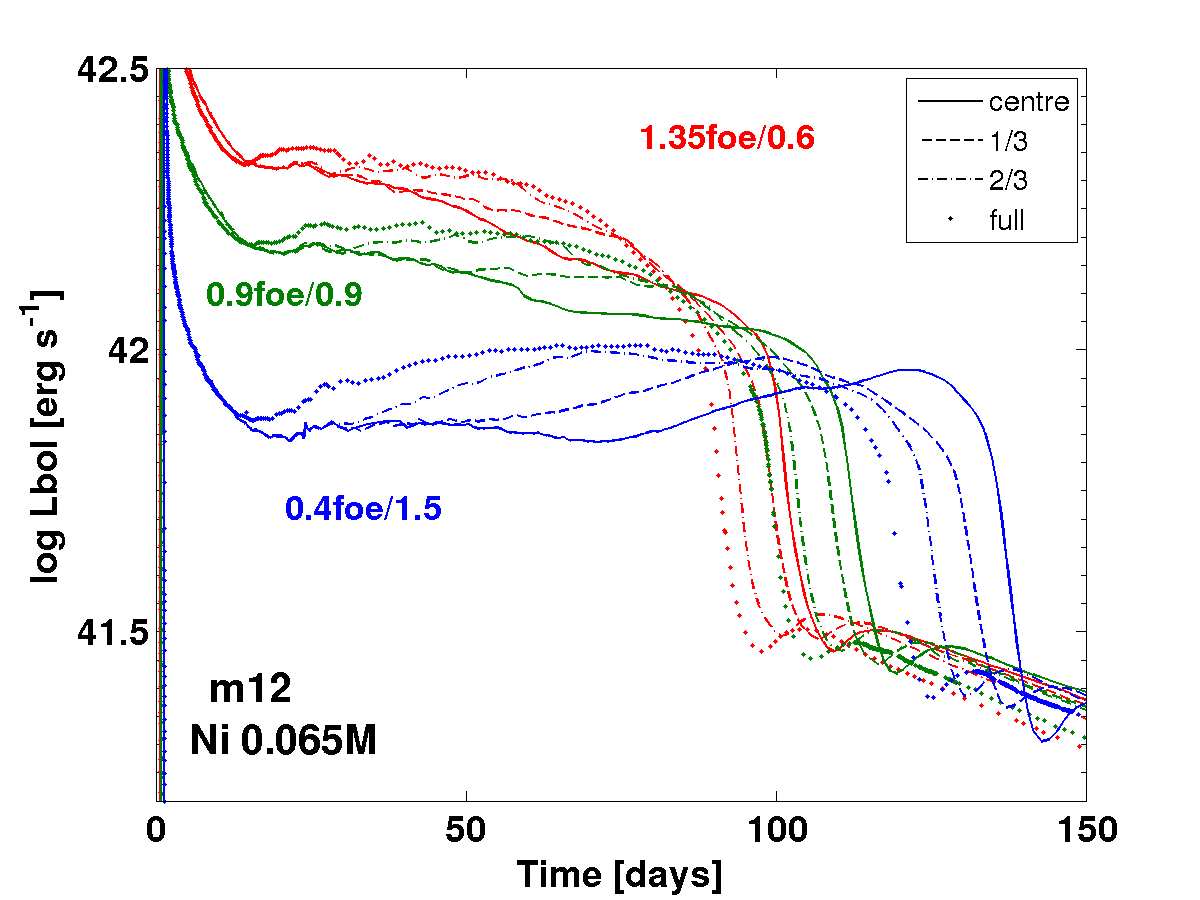
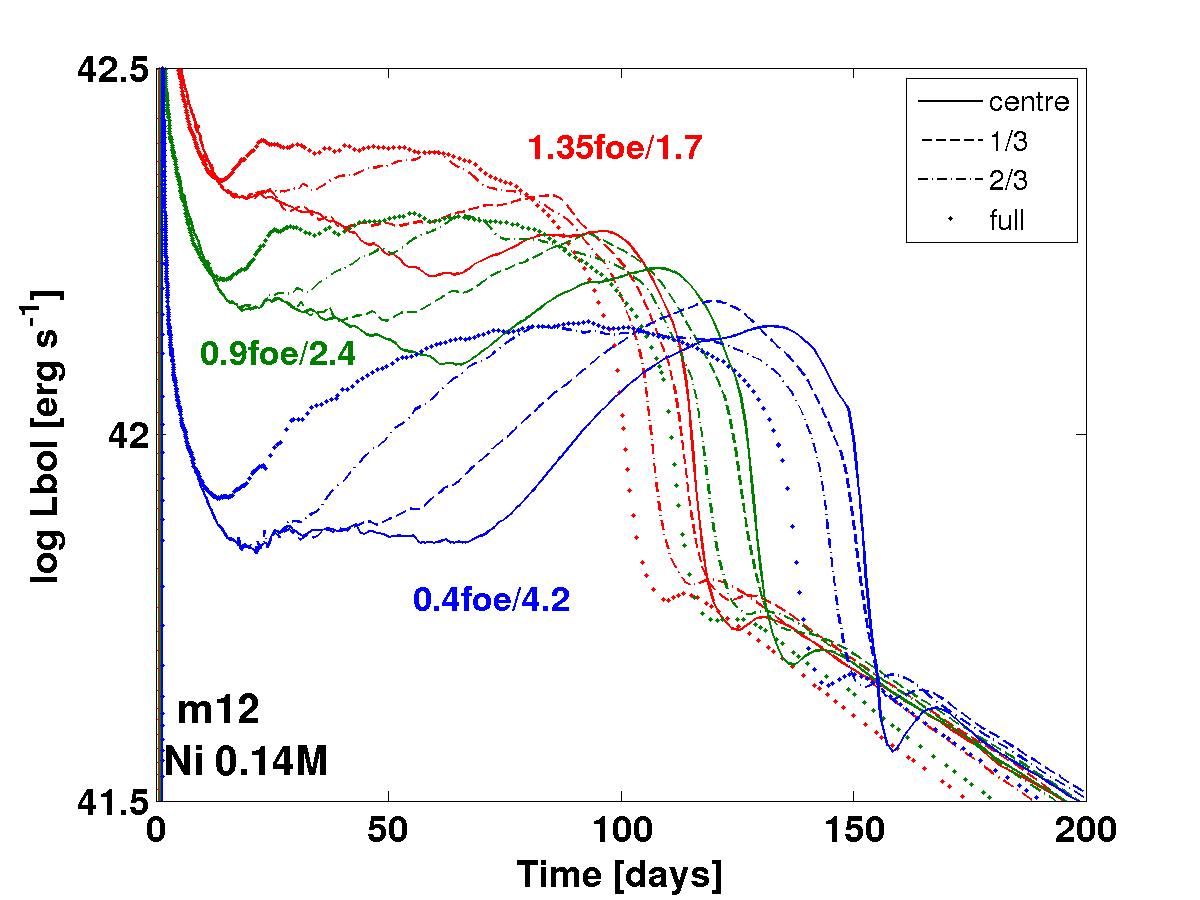
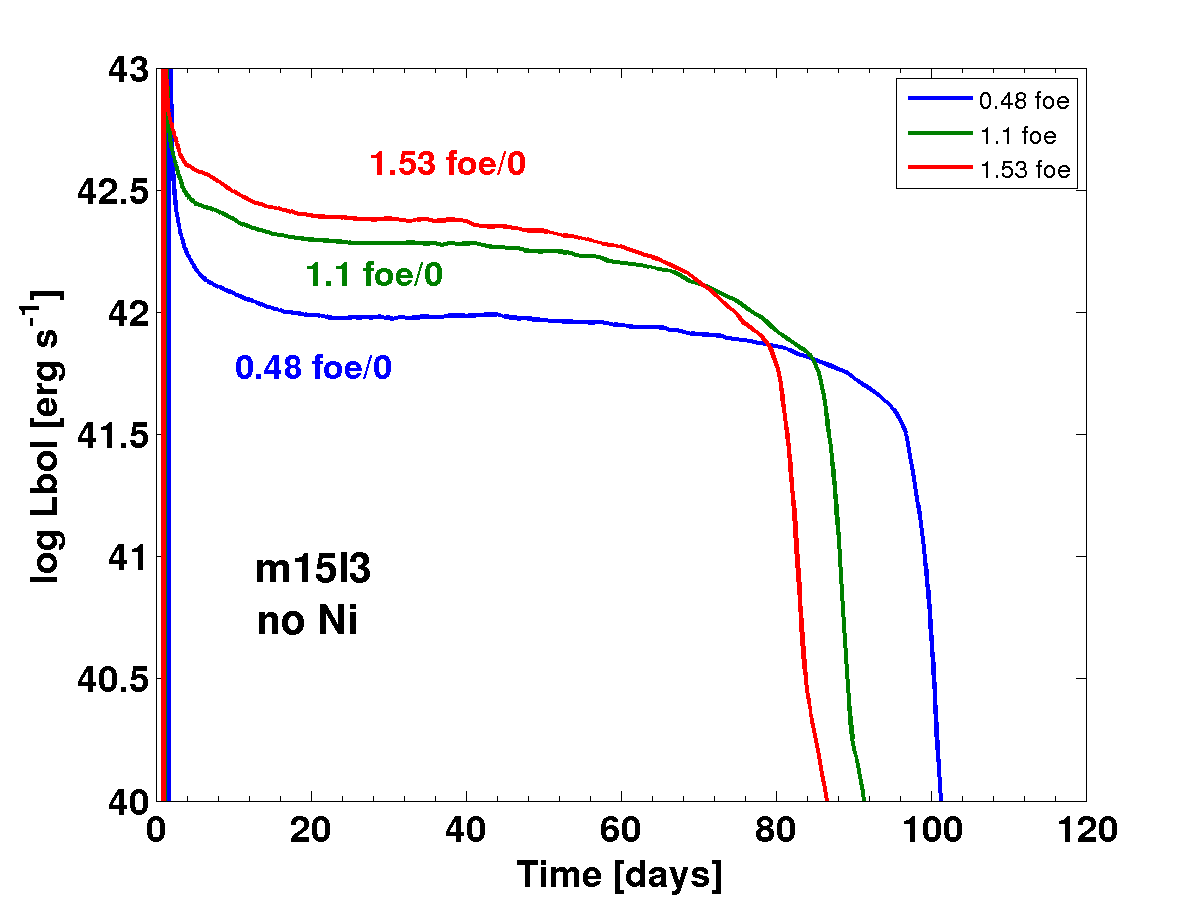
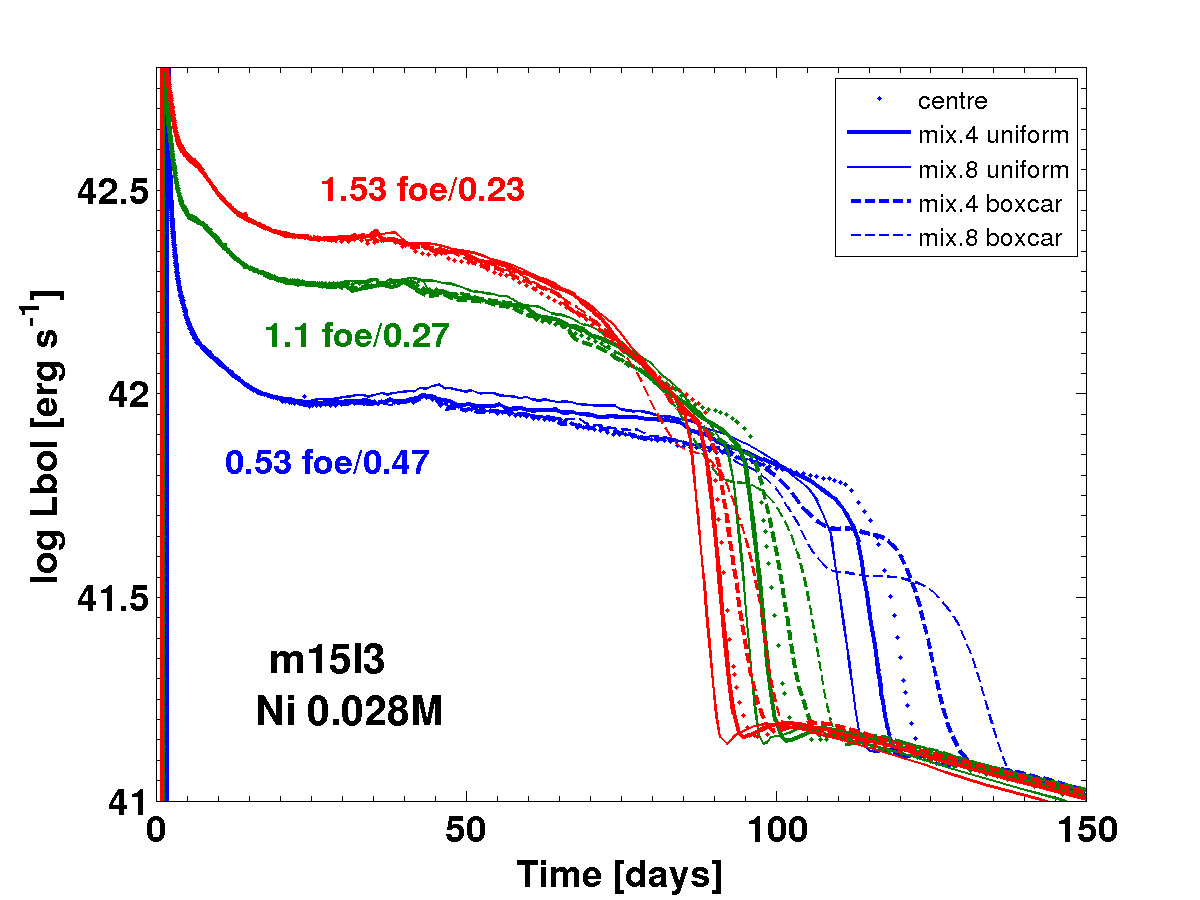
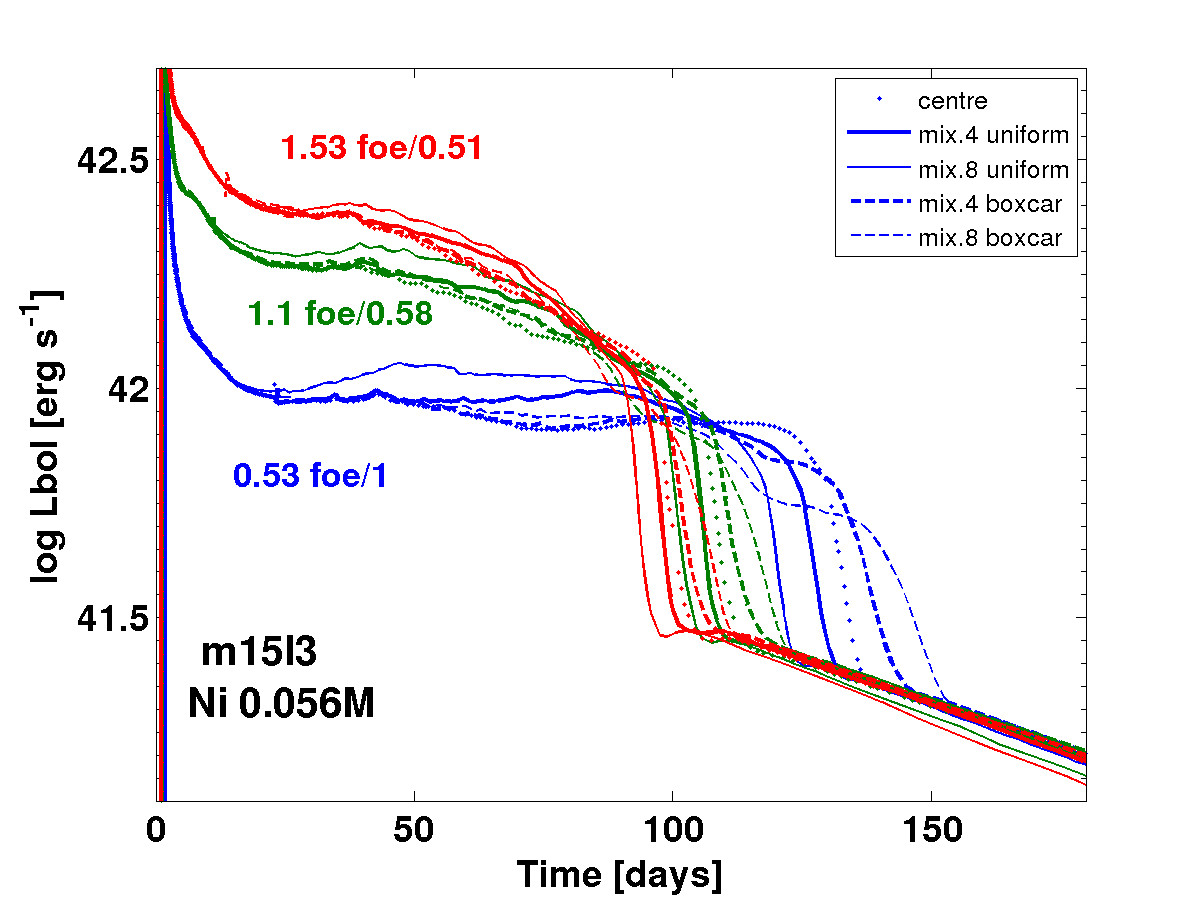
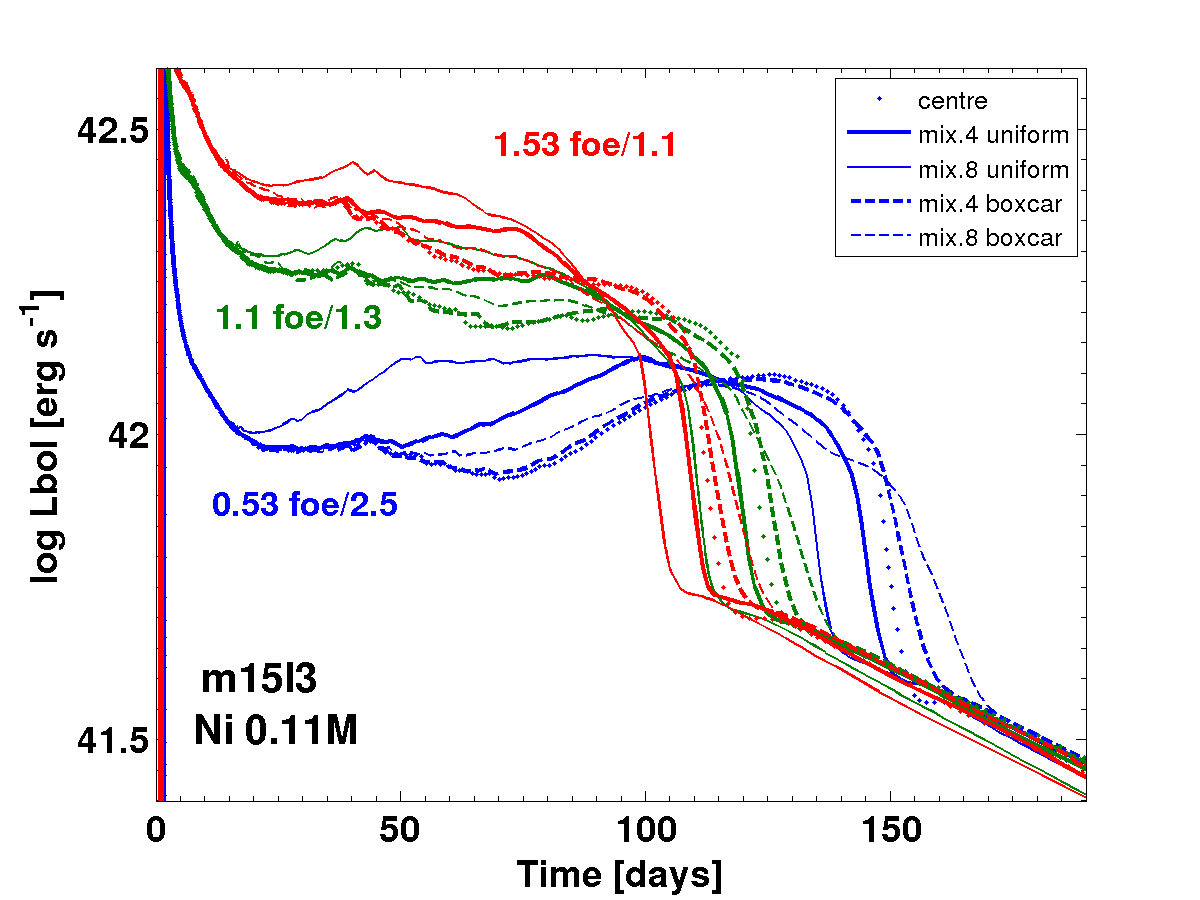
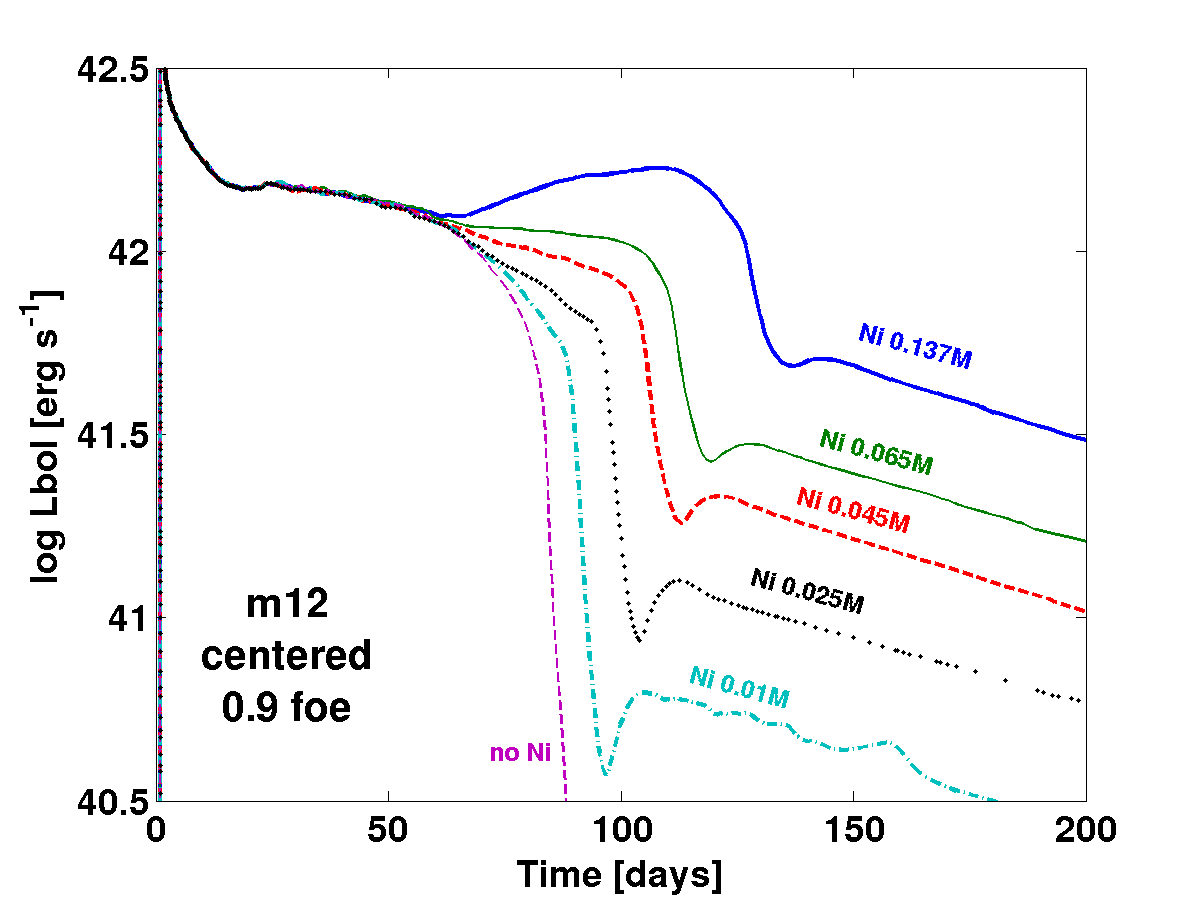
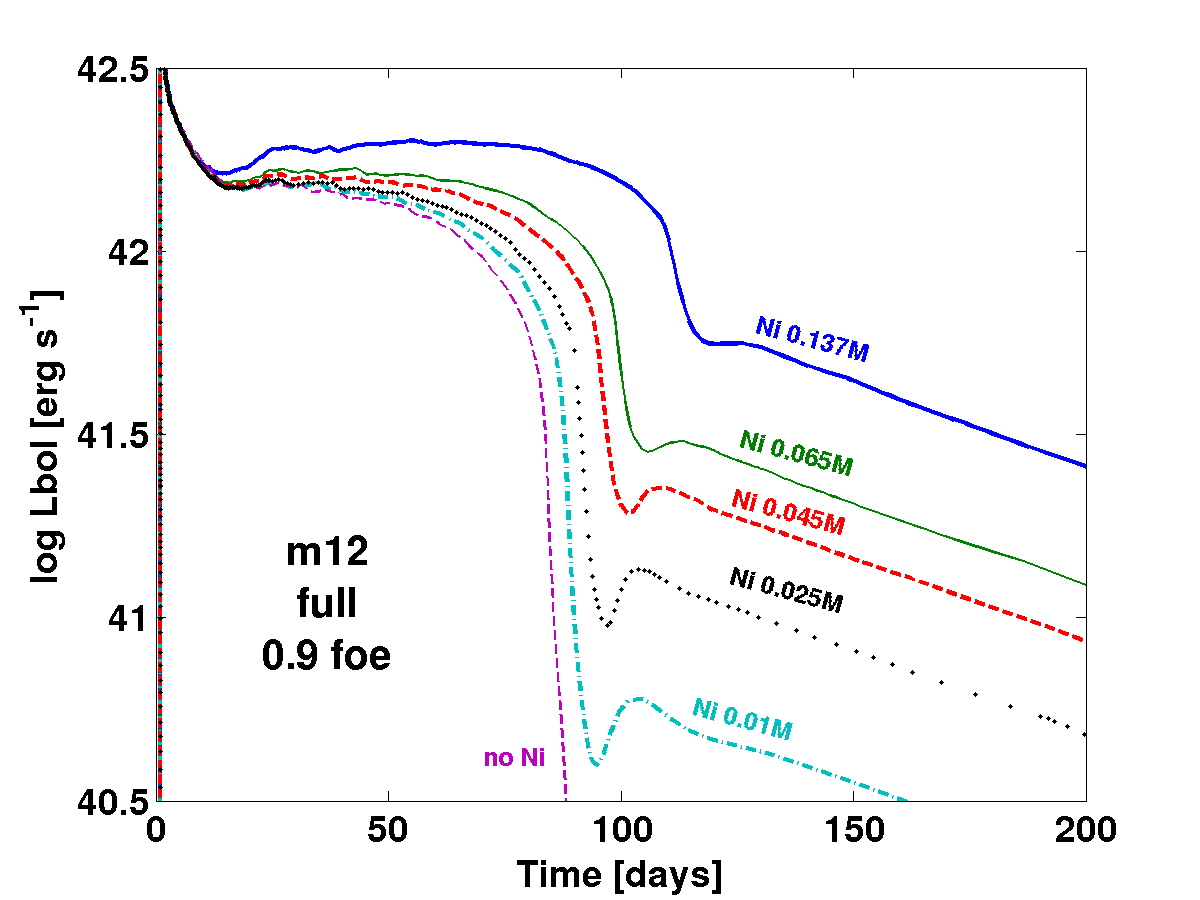
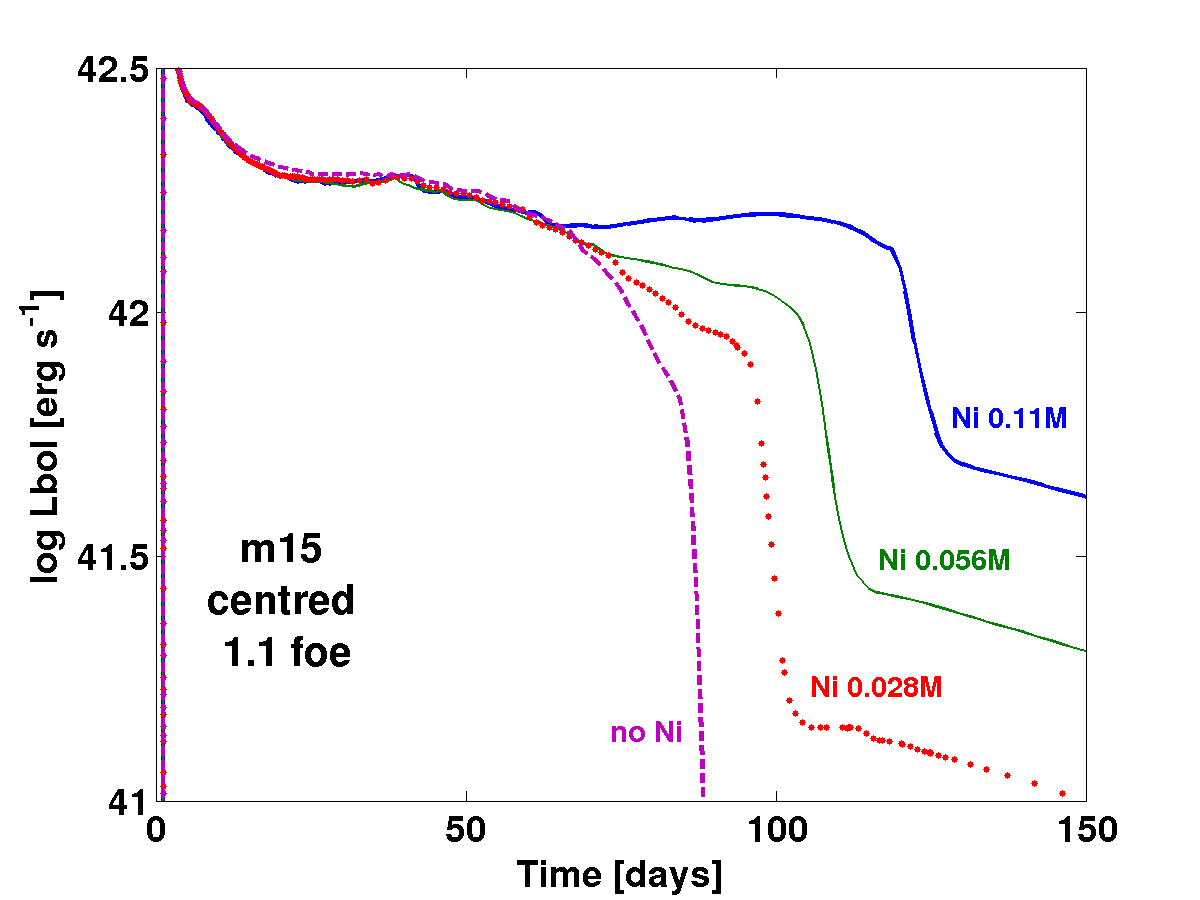
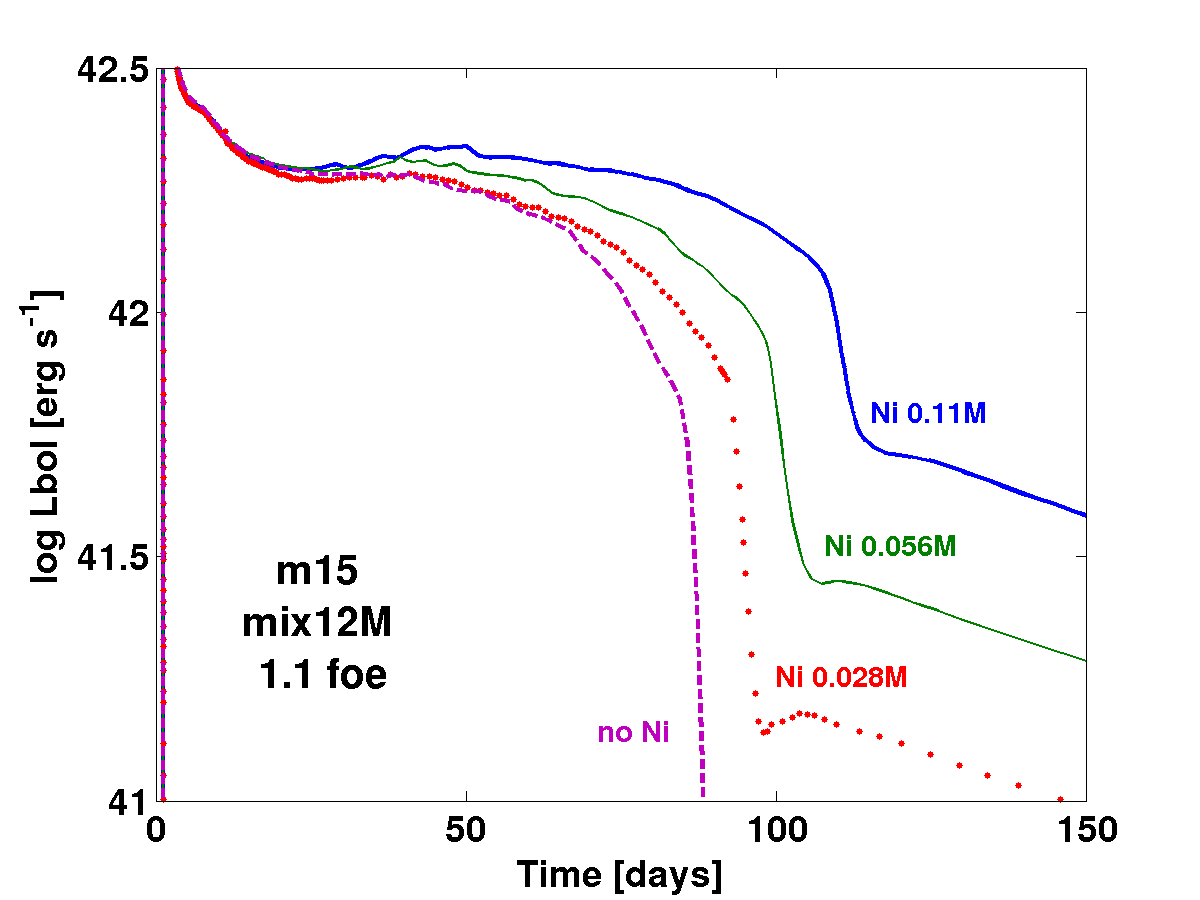
In Figures 2, 3 and 4, we present the resulting bolometric light curves for the model m12 and the model m15 with different amount of 56Ni mass, degree of nickel mixing, and explosion energy. The labels along the curves indicate the explosion energy and corresponding average parameter . From these figures we can see several clear features.
First, the time at which 56Ni starts to affect the light curve is determined only by the degree of mixing and is independent of the 56Ni mass (see figure 4). A centrally concentrated 56Ni starts affecting the emission around the time the plateau ends in the no 56Ni light curve while a fully mixed 56Ni has an affect already from the beginning of the plateau. In all cases, once 56Ni starts affecting it increases the luminosity leading, as expected, to a flatter and longer plateau. The prominence of the 56Ni emission is increased with the 56Ni mass and reduced with the explosion energy. In general, for a given type of mixing, light curve with similar values of (although different amounts of 56Ni mass and explosion energy) show similar effect of 56Ni on the light curve. The effect is of course more prominent for higher values.
An interesting property of central 56Ni mixing is that the light curve can be roughly separated between the cooling emission and the 56Ni driven radiation. The luminosity of each phase depends on different properties of the progenitor, therefore, they are not necessarily similar. Indeed, in some of the light curves the transition between the two phases can be seen. The nature of this transition depends on . For very low values of the effect of 56Ni can be hardly identified. For slightly higher values, but still relatively low, , the 56Ni contribution becomes apparent, but is still less luminous then earlier cooling emission, therefore, near the middle of the plateau, i.e. around day 50, the decay of the light curve becomes steeper. For intermediate values the 56Ni phase has comparable contribution as the cooling emission, and the transition between the two phases can be hardly observed. Finally, for the 56Ni driven emission is seen as a clear “bump” that starts rising from the middle of the plateau. Such a bump was never seen in a type II SN from a red supergiant. In simulations where 56Ni is mixed out to the envelope its contribution is also mixed with that of the cooling emission leading to a smoother plateau evolution with no observable transition for any value of . A result of the difference between the mixing levels is that a more concentrated 56Ni leads to longer plateaus than less concentrated 56Ni, while the flattening is more prominent when 56Ni is mixed to outer layers. Light curves for the “boxcar” mixed models look similar to the models with the centrally located 56Ni (for a given 56Ni mass) during the plateau phase. This happens because the major fraction of 56Ni in “boxcar” mixed models is located in the centre (see Section 3.1 and Table 1), and a little mass of 56Ni is contained in the ejecta at higher velocity.
Interestingly, the values of in most of the sample explored by Nakar et al. (2016) are in the range 0.3 – 0.7, which implies a non-negligible 56Ni contribution. However, for these values it is hard to determine the type of 56Ni mixing based on the light curve alone. The reason is that this is exactly the values were the 56Ni phase in the models with centrally concentrated 56Ni continues the cooling emission phase smoothly with no obvious observational feature. The only SN for which our results can strongly constrain the mixing is SN 2009ib for which . The light curve of SN 2009ib shows a long 130-day very smooth plateau (Takáts et al., 2015). This light curve is very different than those that we see in our simulations where the 56Ni is concentrated in the centre. In fact, it seems that for even in cases where 56Ni is only partially mixed into the envelope we should identify the time at which the 56Ni contribution kicks in. Among our light curves with similar values only those with 56Ni mixing throughout the envelope resemble the light curve of SN 2009ib.
We notice that bolometric light curves for some models have a specific step-like feature during transition from the standard recombination phase to the radioactive tail. These are models with either low explosion energy combined with low mass of 56Ni located in the centre (see Figure 2, the model m12, 0.025 of 56Ni, 0.4 foe, blue solid curve) or models with “boxcar” mixing and low or medium explosion energy (see Figure 3, the model m15, e.g. 0.028 , 0.53 foe and 1.1 foe, green and blue dashed curves). We noticed, that the step disappears for the mentioned models at higher explosion energy (e.g. with 1.53 foe in the model m15). In those models, the step is caused by helium recombination, i.e. when photosphere recedes to the helium shell. Photons produced in 56Ni and 56Co decay diffuse and ionise helium, therefore, keeping photosphere at this layer for a while. The step does not appear in cases of relatively higher energy, because the overall internal energy is higher and relative contribution from Ni-heating is lower. Similarly, the transition from hydrogen to helium recombination is smooth in the models with stronger Ni-mixing. In fact, in these cases Ni-produced photons heat hydrogen-rich atmosphere equally as helium layer (in uniform mixing). While hydrogen ionisation supports photosphere at larger radius, the whole ejecta expands and then photosphere quickly drops through helium layer which becomes transparent. Nevertheless, the majority SNe IIP have no such shape in their light curves. Thus, our results suggest that all mentioned models which are attributed by the step-feature in the bolometric light curve are not the progenitors for normal SNe IIP. This result however is still needed to be confirmed by other numerical codes to verify that the observed step-like feature is indeed seen in these models. If confirmed then “boxcar” mixed models with low (about 0.5 foe) and intermediate (1 foe) explosion energy could not reproduce normal type IIP supernova light curves, while uniformly mixed models do.
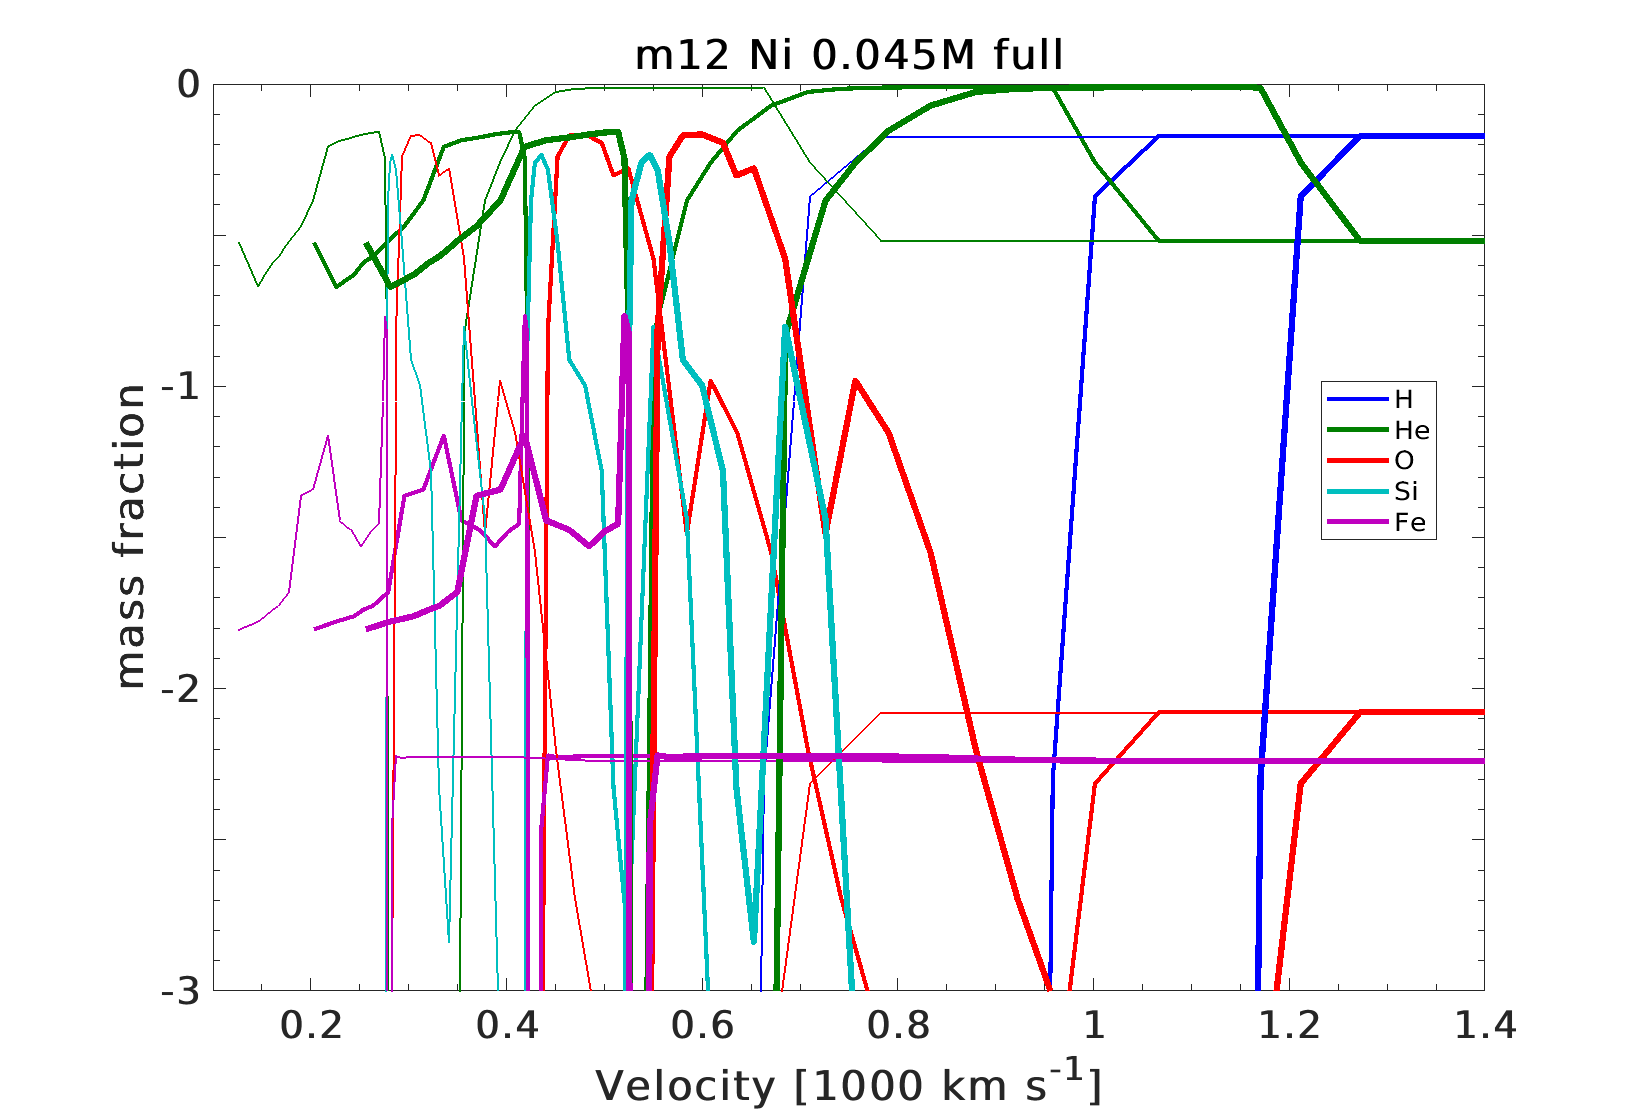
As our study is focused on the light curve, we present ejecta properties on the coasting phase in Appendix A. Namely, we chose the model m12 with 0.045 of 56Ni and the model m15 with 0.056 of 56Ni, and show selected species, hydrogen, helium, oxygen, silicon, and iron, presented in the SN ejecta along velocity.
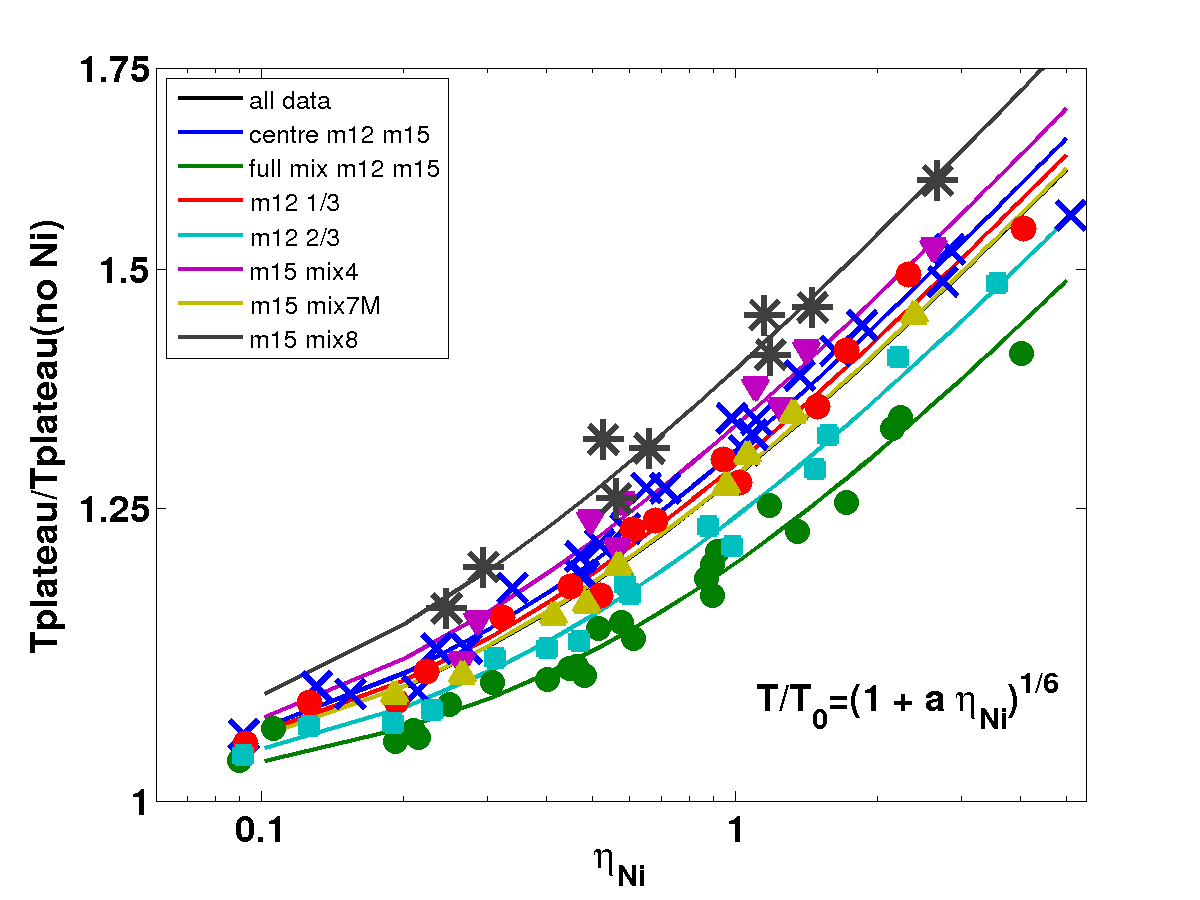
4.2 Extension of the plateau duration
Our goal here is to quantify the effect of 56Ni on the plateau duration , finding its dependence of the observable and on the 56Ni mixing. We measure as time since explosion till the middle of transition between plateau and the radioactive tail. According to (Chugai, 1991), duration of plateau corresponds to time when the recombination front traverses throught the SN ejecta. The plateau extension was previously studied. Kasen & Woosley (2009) and Sukhbold et al. (2016) derived the following relation between the duration of the plateau, the explosion energy and the progenitor properties based on a set of numerical runs (Eq. 19 of Sukhbold et al. (2016)):
| (2) |
where is a constant that depends on the progenitor structure, is the explosion energy in units of foe, is the ejecta mass is units of 10 and is the progenitor radius in units of 500 . Interestingly, for a given progenitor structure (see Section 2), therefore, we fit the results of our simulations to the relation
| (3) |
The results are shown in Figure 5. We use different values of for different mixing types, where the range of values that we find is between 2 and 6. Firstly, it is clear that formula 3 provides an excellent fit to the data. Its main advantage over equatio 2 is that is an observable, therefore, it can be measured for any SNe with a good bolometric light curve. Secondly, it shows the dependence of the plateau extension on the mixing. Maximal extension is obtained for the boxcar “mix8” and “mix4” mixings followed closely by the centrally concentrated 56Ni. For these types of mixing . The plateau extension drops when 56Ni is heavily mixed into the envelope, and the smallest effect is measured for fully mixed 56Ni where . Finally, for our two progenitors we found that similar mixing types resulted in the same value of . Although we examined only two progenitor models this suggests that most of the dependence of on the progenitor structure in equation 2 is absorbed into the parameter and that the coefficient depends mostly on the mixing type. Hence, we suggest the averaged formula which is valid with roughly 10 % accuracy:
| (4) |
Applying these results to the sample of Nakar et al. (2016) we find that for typical explosions with the 56Ni extends the plateau by 15 % – 25 %, depending on the type of mixing. As the typical observed plateau duration is about 100 days, this implies that if there was no 56Ni the typical plateau duration would have been about 80 days. In the case of SN 2009ib where the plateau is unusually long, we find that for and a uniform mixing throughout the envelope (as inferred from the light curve shape) the 56Ni extends the plateau by 35 %. Thus, the unusual plateau length of SN 2009ib is mostly due to 56Ni, as without 56Ni the plateau duration would have been shorter than 100 days.
4.3 Mitigating the plateau decline rate
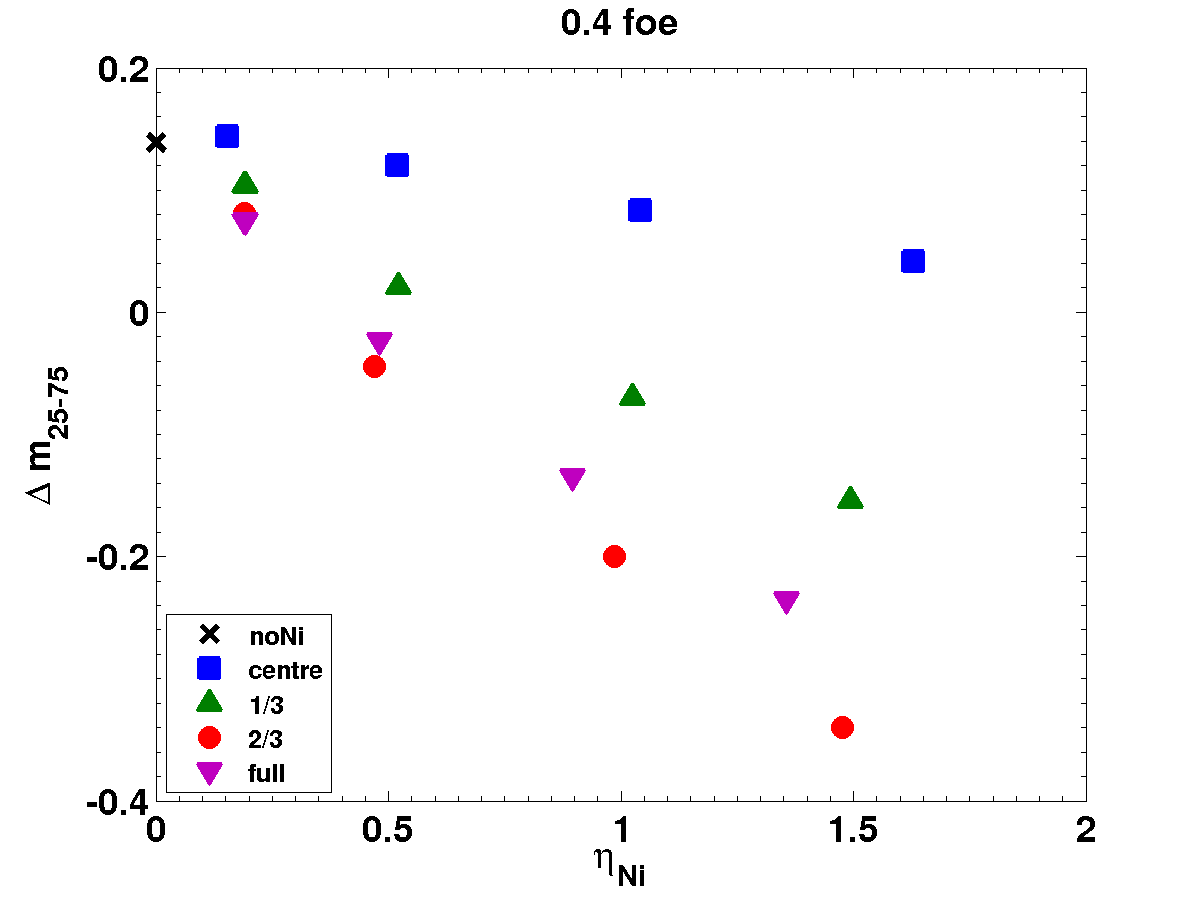
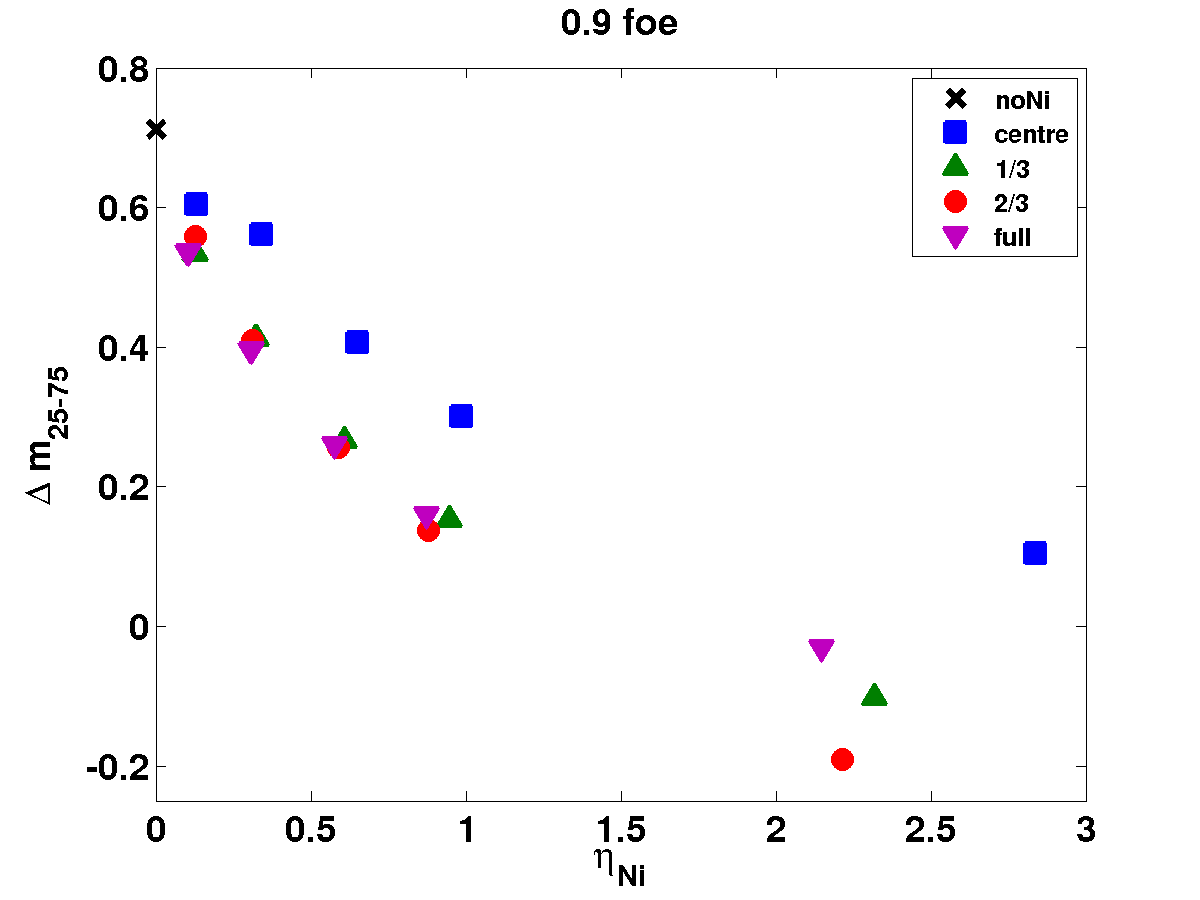
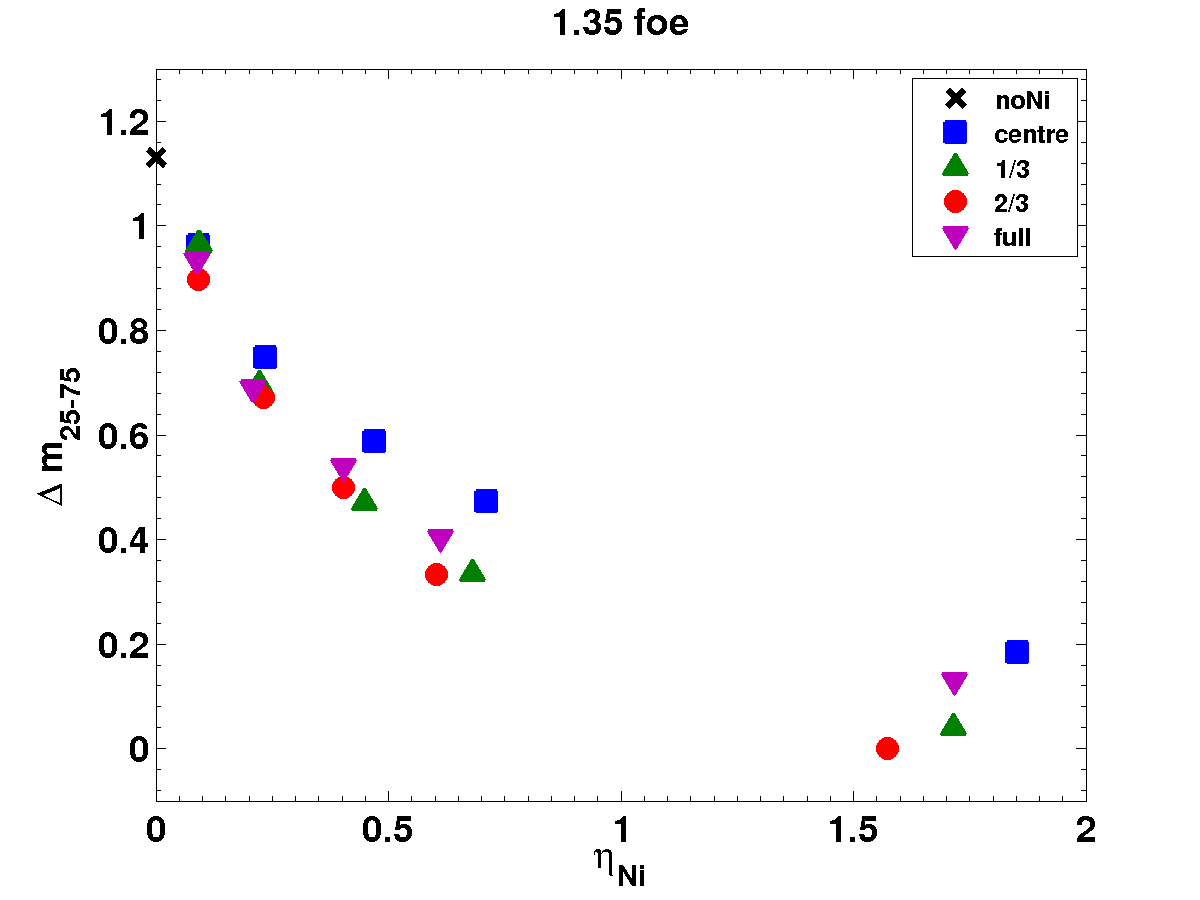
Another effect of 56Ni, when it is present in the SN ejecta, is increasing the plateau luminosity at late time, thereby reducing the decline rate, i.e., making the light curve flatter. We use the bolometric increase in magnitude (i.e., drop in luminosity) between days 25 and 75, , as a measure of the decline rate. The values in the Nakar et al. (2016) sample vary between for light curves that show slow brightening during the plateau to (i.e., a decline rate of 2.4 mag/100 day) for fast declining SN, which are usually classified as type IIL. Nakar et al. (2016) test for a correlation between and finding a significant anti-correlation, suggesting that 56Ni is responsible for at least some of the plateau flatness. They continue with an attempt to measure this effect, estimating that in SNe with flat plateaus 56Ni contributes about 1 mag/100 day to the plateau (i.e., without 56Ni these SNe would have showen a decline rate of ).
Figure 6 shows as a function of for progenitor m12 (the results for m15 are very similar). The different panels are for different explosion energies. First, we find that without 56Ni more energetic and luminous explosions evolve faster and have a faster decline rate. This is consistent with the correlation found between SN luminosity and the decline rate (Anderson et al., 2014; Faran et al., 2014b), suggesting that high explosion energy might be at least one of the reasons for the fast decline observed in some SNe IIL. The effect of 56Ni on the decline rate is also seen clearly. For all mixing types higher 56Ni mass results in slower decline rates. This effect is seen for all mixing types, although it is less prominent when 56Ni is concentrated in the center. Quantitatively, for the effect on low energy explosion is minor, but on explosions with energy of about 1 foe it reduces the decline rate by about 1 mag/100 days (i.e., reducing by 0.5). For , the effect is minor, and the resulting light curve decay is similar to the light curve without 56Ni. For , the plateau is always very flat, which is consistent with the light curve of SN 2009ib, and in some cases even slowly rising.
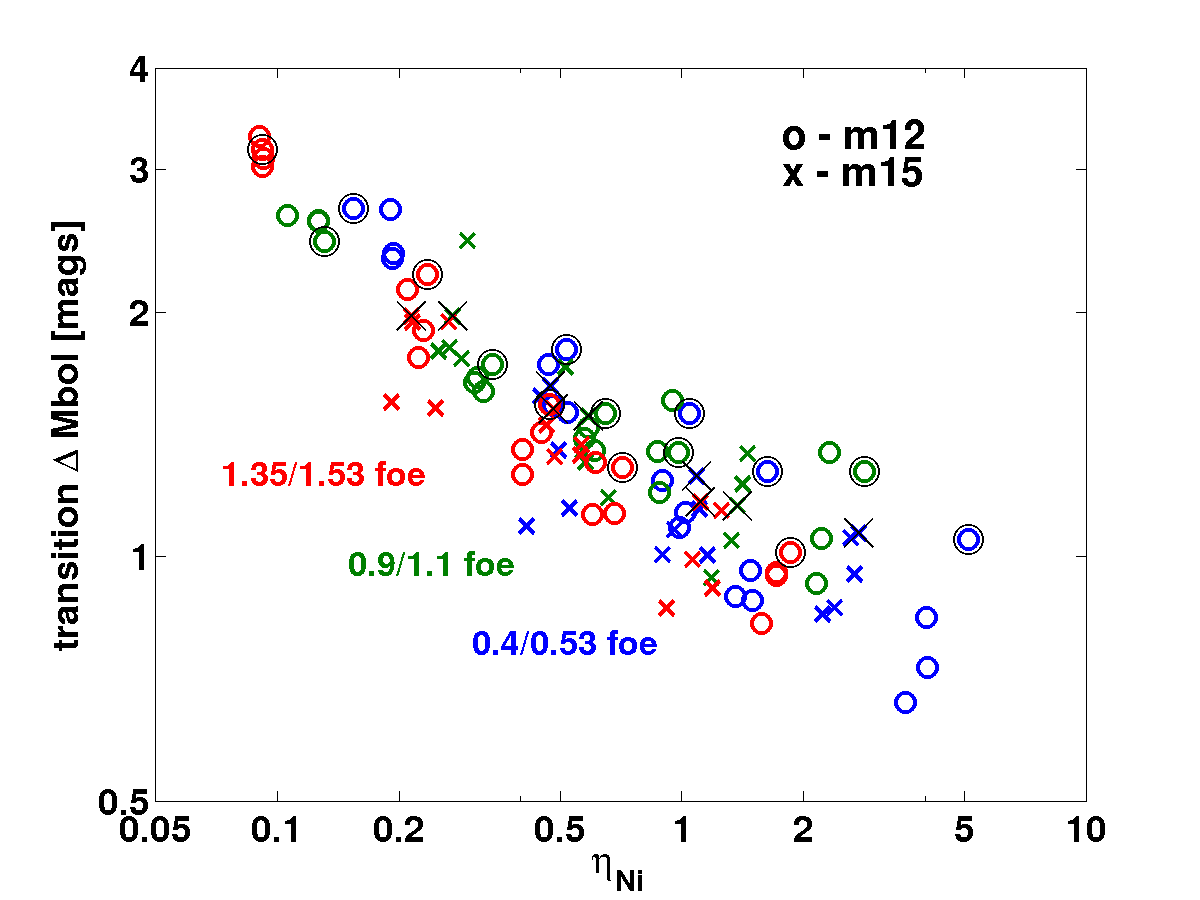
4.4 Correlations between and the drop from the plateau to the radioactive tail
Figure 7 shows the drop in the bolometric light curve during the transition from the plateau to the tail as a function of . We define the transition as a difference in bolometric magnitude between the end of plateau (when the plateau slope starts changing noticeably) and the beginning of radioactive tail. It shows a rather tight correlation with while the scatter is mostly due to the different mixing types. The transition between the plateau and the tail is a complicated characteristic which depends on the explosion energy, global progenitor properties and the mass of 56Ni and its distribution, i.e. .
4.5 Photospheric velocity
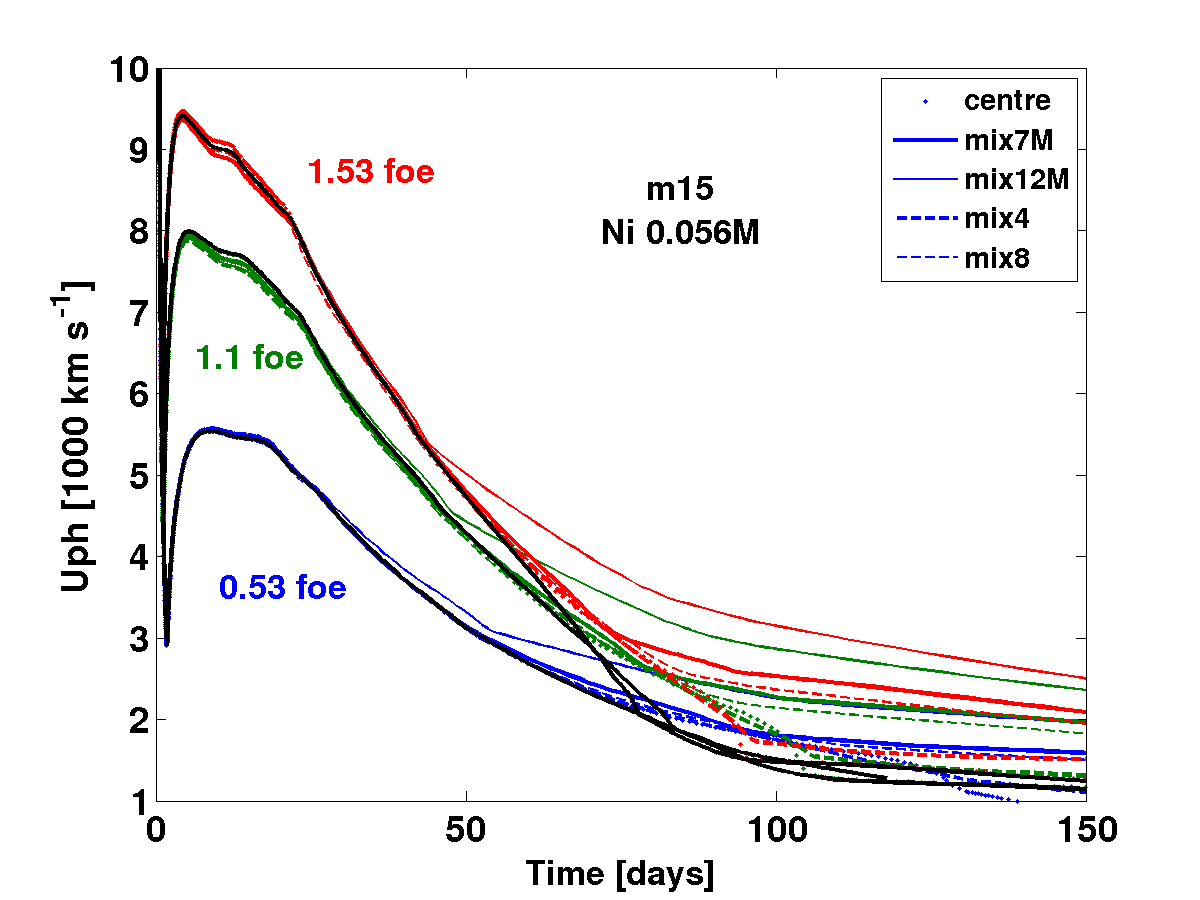
Theoretically, we expect that 56Ni presented in the supernova ejecta heats and ionises matter while supplying high energy photons and positrons, therefore, keeping the photosphere at larger radii where velocity is higher. We define photospheric velocity as velocity of the Lagrangian zone where the integrated Rosseland optical depth is equal 2/3. In Figure 8, we depicts the evolution of the photospheric velocity models m15 with 0.065 of 56Ni and different explosion energies, 0.53 foe, 1.1 foe, and 1.53 foe. It shows that the main factor that determines the photospheric velocity is the explosion energy. Since the typical ejecta velocity scales as , we expect the ejecta mass to have a similar effect as the explosion energy (e.g., Popov, 1993). The effect of 56Ni on the photospheric velocity is significant only at late times. Similarly to the light curve, higher level of mixing starts affecting the velocity at earlier time. However, this happens later than in the light curves. At day 50, only full mixing shows some 56Ni effects of order 10 %. Towards the end of the plateau all mixing types affects the velocity, where in the case of uniform mixing the line velocity can be more than twice the velocity at the same time without 56Ni. To conclude, 56Ni has a negligible contribution to the photospheric velocity evolution up to the middle of the plateau, and starts playing some role by the end of plateau. However, it is expected that even small changes in photospheric velocity due to Ni-heating will be seen in spectra.
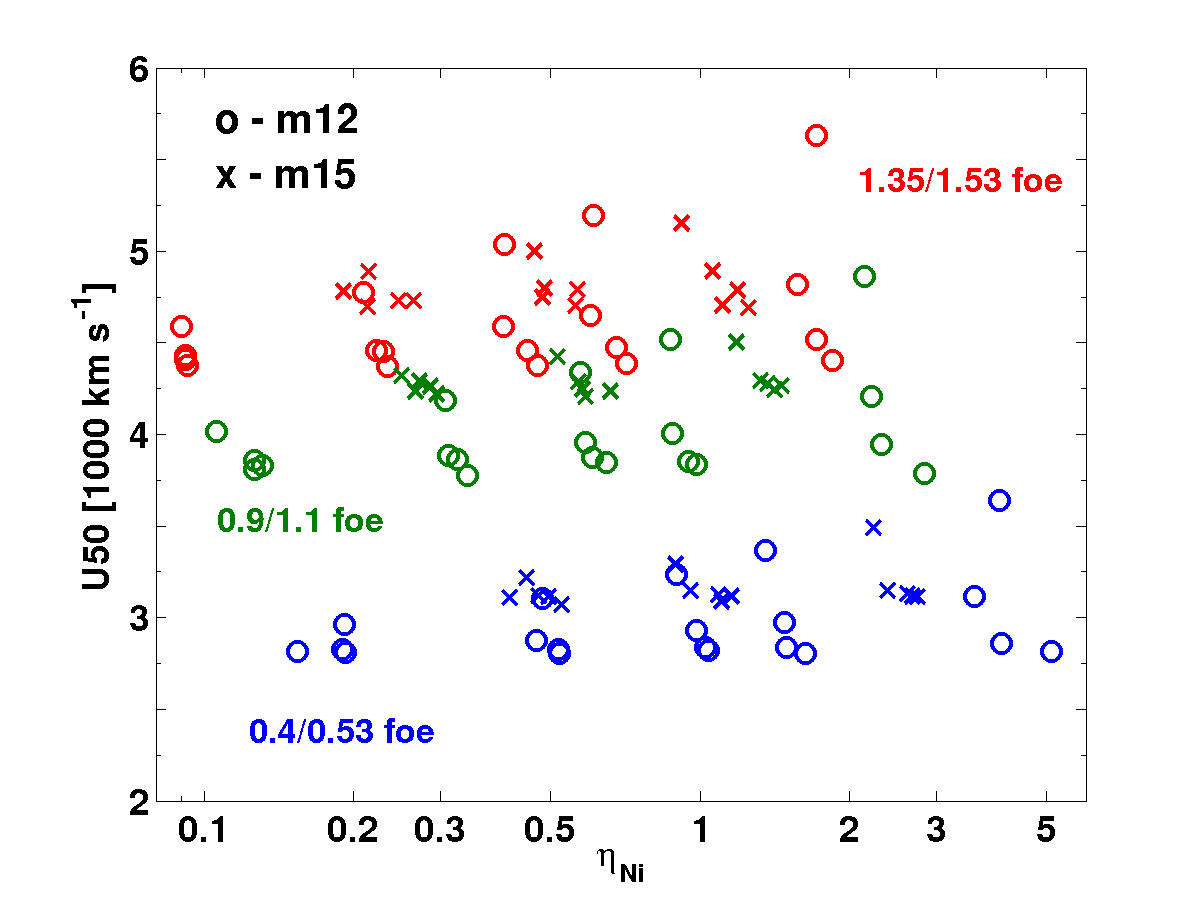
Since the velocity at day 50 is often used to characterise the explosion energy and ejecta mass, we present the photospheric velocity at day 50 in Figure 9, for all models in the study along the parameter . We show that there is no major effect, and for the photospheric velocity is at most 10 % faster.
4.6 Colour B-V
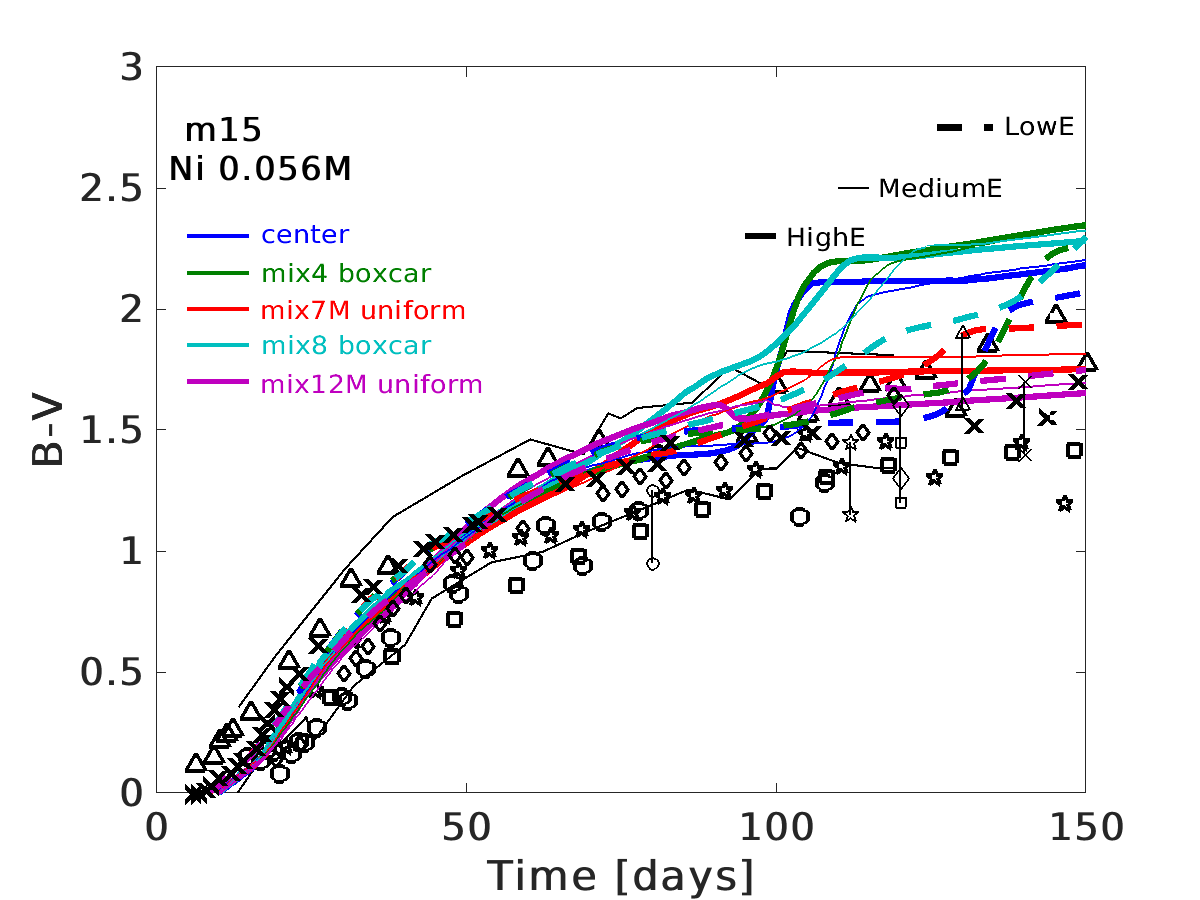
In Figure 10, we plot B–V colour for model m15 with 0.056 of 56Ni with various mixing types and explosion energies of 0.53 foe (“LowE”, thick solid), 1.1 foe (“MediumE”, thin solid), and 1.53 foe (“HighE”, thick dashed). We compare our theoretical curves with a few normal SNe IIP: 1999em (crosses), 1999gi (triangles), 2001X (stars), 2005ay (diamonds), 2013fs (circles), ASASSN14ha (squares) (Faran et al., 2014b; Valenti et al., 2016), and averaged B–V-curves (thin black curves, Faran et al., 2014b). We find that models with centrally concentrated 56Ni (blue curves) and “boxcar” mixing (green and cyan curves) quickly change their B–V colour during the transition from the plateau to the radioactive tail. This is in contrast to the observations that demonstrate monotonic evolution of B–V colour. All the models with uniformly mixed 56Ni show evolution that is similar to the observed one.
Our results suggest that the 56Ni is well mixed into the envelope
in normal SNe IIP.
Note however, that STELLA produces reliable
evolution of radiation field for supernova ejecta when a large fraction of
the ejecta is optically thick, i.e. during photospheric phase.
By the end of transition from the plateau to the tail, the ejecta become optically thin and
the photosphere recedes deep into the ejecta. At this time
the overall bolometric light curves predicted by STELLA are also reliable.
However, lines begin
playing a significant role at late time, and STELLA colours are less reliable.
Therefore, detailed simulations with non-thermal effects
and larger atomic data base (like it is done in CMFGEN, Li
et al. (2012))
are needed to confirm our result about the B–V colour evolution.
Previously, Dessart &
Hillier (2011) present non-LTE simulations
for two models. Their B–V-colour curves lie below the
observed range marked in our Figure 10. Nevertheless, their
light curves are not properly reproduce normal SNe IIP. Kasen &
Woosley (2009)
present broad band light curves for a particular model with applied boxcar
mixing. The derived B–V colour is in very good agreement
with our results for the “mix4” and “mix8” boxcar curves, i.e. the colour
reddens in a step-like way during the transition to the radioactive tail.
Note though that Kasen &
Woosley (2009) do not include non-LTE effects
in their study.
4.7 Comparison to V1D
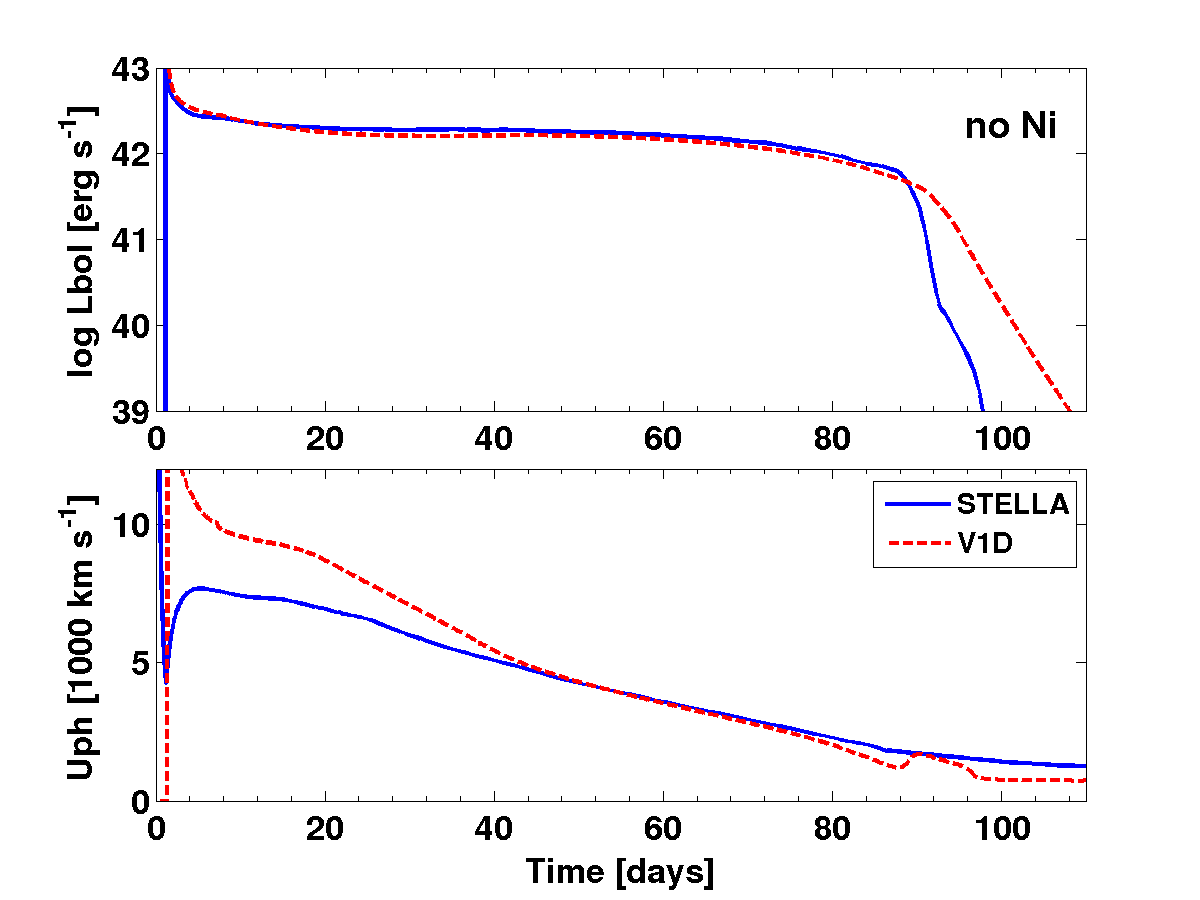
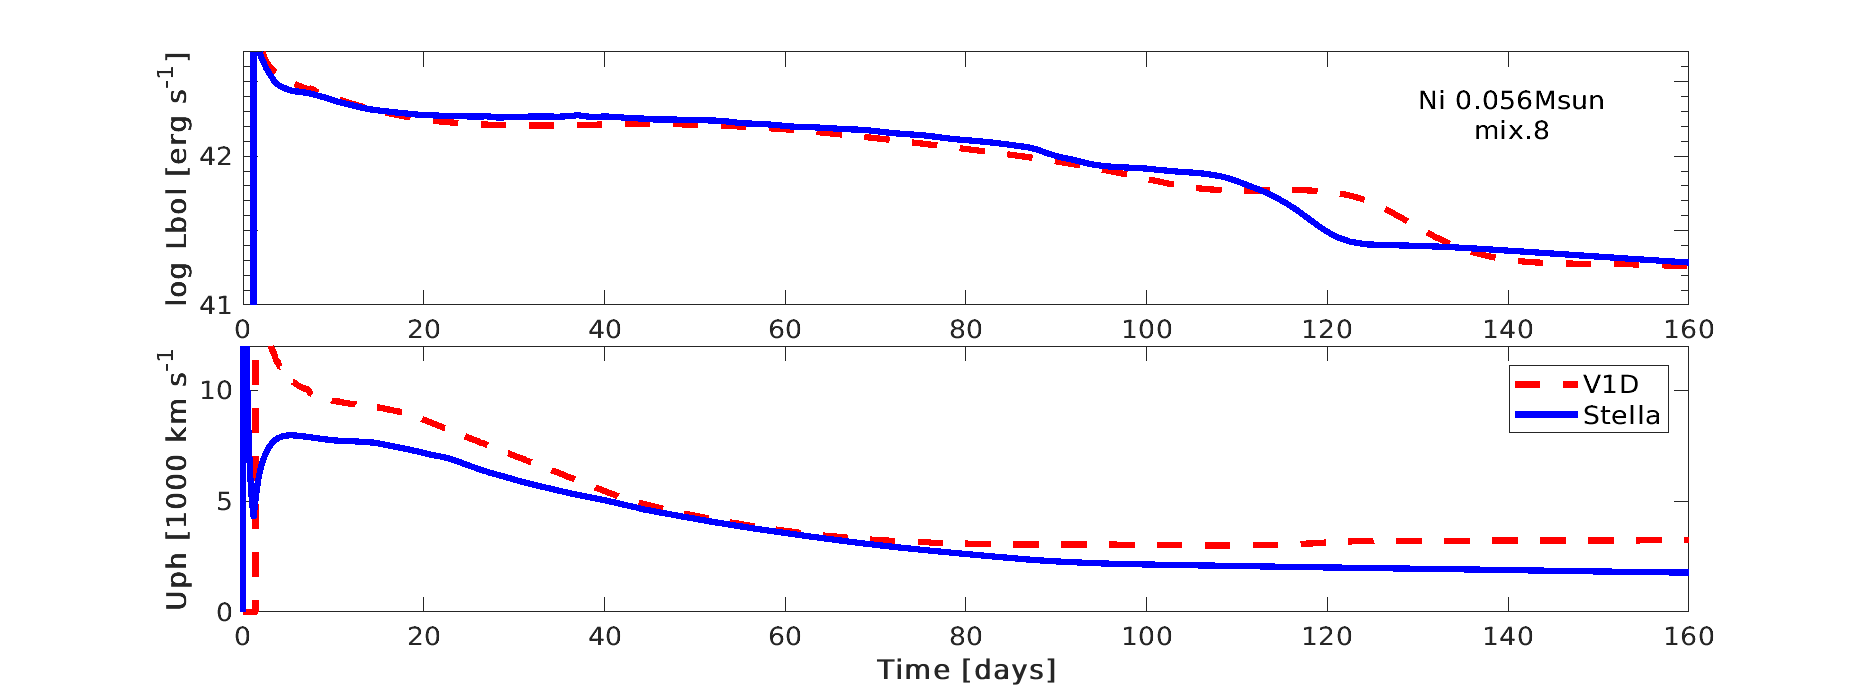
The opacity treatment remains the core aspect in the radiative transfer simulations which provide an uncertainty in the resulting data. Figure 11 demonstrates that using different sets of lines and different assumptions about thermodynamical equilibrium (LTE versus non-LTE) leads to visible differences in bolometric light curves.
In this section we compare simulations done with STELLA and V1D.
V1D uses opacity tables compiled from the CMFGEN data
(Dessart &
Hillier, 2010; Dessart
et al., 2010, 2015) which is
significantly broader than the STELLA standard settings. CMFGEN
includes about 500,000 lines and level populations without assumption of
LTE, and treats non-thermal excitation, while STELLA has 160,000 lines and computed level populations
based on modified Saha equations. From the comparison plots in
Figure 11, it is obvious that the effective V1D
opacity is larger than the opacity in STELLA. This makes the V1D plateau
7-day longer even in the model without radioactive nickel 56Ni
(upper panel of Figure 11).
Apart from the plateau duration, luminosity on the plateau varies. Hence, V1D
predicts a 0.04 dex dimmer plateau compared to STELLA in the case of
0.056 of 56Ni (bottom panel of Figure 11).
Nevertheless, the qualitative agreement between V1D and STELLA
is very good.
Photospheric velocity estimated by V1D and STELLA is
different, as seen in Figure 11, while
photospheric temperature and radius are in very good agreement. V1D
overestimates the velocity by 2000 km s during the post-SBO cooling
phase and up to the middle of plateau, and by 1000 km s after the
middle point. We explain this difference by the way V1D solves the radiative
transfer equations, i.e. diffusion approximation.
5 Conclusions
In the present study, we carried out a systematic analysis of the impact of
56Ni presented in the SN ejecta on the resulting light curves of SNe IIP.
For this, we used two red supergiant models computed with MESA. We
vary amount of 56Ni (0.01 –0.14 ) and its mixing (centrally
concentrated to full), and explosion energy
(0.4 foe to 1.53 foe) and computed a set of light curves with STELLA.
Our light curves are available via link https://wwwmpa.mpa-garching.mpg.de/ccsnarchive/data/Kozyreva2018/.
Based on our light curve simulations, we conclude that even small amount of radioactive nickel 56Ni presented in the supernova ejecta noticeably modifies the bolometric light curve. There is a combination of two effects from Ni-heating on the plateau duration and shape: (1) radioactive nickel 56Ni extends the plateau, and (2) 56Ni flattens plateau decline rate.
To evaluate the importance of 56Ni impact, we used the parameter which is a ratio between time weighted 56Ni deposited energy and the weighted shock deposited energy. We found that the extension of the plateau due to presence of 56Ni can be accurately approximated by a simple formula with an argument (Equation 3 and Figure 5). We found that in most observed type IIP SNe the plateau is extended by 15-25 %. We also found that 56Ni effectively flattens the plateau decline. In fact, the drop in light curves between day 25 and day 75 is correlated with , i.e. decline rate is lower (a light curve is flatter) for higher . For an intermediate explosion energy of about 1 foe and the decline rate is reduced by about 1 mags/100 days ( mags for , Figure 6) The common values of for the observed SNe IIP is 0.3 – 0.7 (Nakar et al., 2016), therefore, 56Ni significantly contributes to plateau shape and duration.
Among other findings are:
-
•
Regardless explosion energy and the total amount of radioactive 56Ni, 56Ni starts to affect plateau luminosity at particular time according to degree of mixing. Particularly, centrally located 56Ni modifies the light curve at the end of the plateau, around day 75, while fully mixed 56Ni increases plateau luminosity at the most beginning, around day 20. In all cases this time depends only on the extent of 56Ni distribution (see Figure 2).
-
•
For the typical values of (between 0.3 and 0.7), it is difficult to distinguish contribution from pure recombination and cooling, and 56Ni heating. Light curves alone do not provide enough information to differenciate between different degrees of mixing. The observed SN 2009ib with the long 150-day plateau has and requires moderate amount of 56Ni (0.046 ) mixed heavily throughout the ejecta.
-
•
“Boxcar” mixing of 56Ni leads to a bolometric light curve with a double step transition from the plateau to the tail if explosion energy is relatively low, about 0.5 foe. This kind of feature is not observed in normal SNe IIP. However, additional numerical simulations are required to clarify this conclusion.
-
•
A centrally concentrated 56Ni and “boxcar” lead to a sharp jump in B–V following the end of the plateau, which is not seen in observations. However, this aspect requires additional simulations accounting for non-LTE radiative transport.
-
•
There is no significant modification to photospheric velocity up to day 50 due to 56Ni-heating. However, moderate changes occur later.
We highlight that uniformly mixed 56Ni either in half of the ejecta or almost entire ejecta supports plateau luminosity providing light curves consistent with observetions. “Boxcar” and centrally concentrated 56Ni results in light curves which colour evolution is inconsistent with observations. However, this should be confirmed by additional numerical simulations. If confirmed, this challenges the core-collapse explosion simulations, since conventional “boxcar” 56Ni mixing is believed to mimic the realistic macroscopic mixing in the supernova ejecta and which is predicted by core-collapse simulations (Wongwathanarat et al., 2015; Müller et al., 2017; Utrobin et al., 2017).
Acknowledgments
AK and EN are supported by ERC grant No. 279368
(“The Gamma Ray Burst – Supernova Connection and shock breakout physics”)
and partially by the I-Core center of excellence of the CHE-ISF.
The STELLA simulations were carried out on the DIRAC Complexity system (grants ST/K000373/1 and ST/M006948/1),
operated by the University of
Leicester IT Services, which forms part of the STFC DiRAC HPC Facility
(www.dirac.ac.uk). AK thank Sergey Blinnikov and Viktor Utrobin
for fruitful and useful discussions.
References
- Anderson et al. (2014) Anderson J. P., et al., 2014, ApJ, 786, 67
- Bersten et al. (2011) Bersten M. C., Benvenuto O., Hamuy M., 2011, ApJ, 729, 61
- Blinnikov et al. (1998) Blinnikov S. I., Eastman R., Bartunov O. S., Popolitov V. A., Woosley S. E., 1998, ApJ, 496, 454
- Blinnikov et al. (2006) Blinnikov S. I., Röpke F. K., Sorokina E. I., Gieseler M., Reinecke M., Travaglio C., Hillebrandt W., Stritzinger M., 2006, A&A, 453, 229
- Chugai (1991) Chugai N. N., 1991, Soviet Astronomy Letters, 17, 210
- Dahlen et al. (2004) Dahlen T., et al., 2004, ApJ, 613, 189
- Dessart & Hillier (2010) Dessart L., Hillier D. J., 2010, MNRAS, 405, 2141
- Dessart & Hillier (2011) Dessart L., Hillier D. J., 2011, MNRAS, 410, 1739
- Dessart et al. (2010) Dessart L., Livne E., Waldman R., 2010, MNRAS, 405, 2113
- Dessart et al. (2015) Dessart L., Audit E., Hillier D. J., 2015, MNRAS, 449, 4304
- Falk & Arnett (1977) Falk S. W., Arnett W. D., 1977, ApJS, 33, 515
- Faran et al. (2014a) Faran T., et al., 2014a, MNRAS, 442, 844
- Faran et al. (2014b) Faran T., et al., 2014b, MNRAS, 445, 554
- Grasberg & Nadezhin (1976) Grasberg E. K., Nadezhin D. K., 1976, Ap&SS, 44, 409
- Grasberg et al. (1971) Grasberg E. K., Imshenik V. S., Nadyozhin D. K., 1971, Ap&SS, 10, 3
- Kasen & Woosley (2009) Kasen D., Woosley S. E., 2009, ApJ, 703, 2205
- Katz et al. (2013) Katz B., Kushnir D., Dong S., 2013, preprint, (arXiv:1301.6766)
- Li et al. (2011) Li W., Chornock R., Leaman J., Filippenko A. V., Poznanski D., Wang X., Ganeshalingam M., Mannucci F., 2011, MNRAS, 412, 1473
- Li et al. (2012) Li C., Hillier D. J., Dessart L., 2012, MNRAS, 426, 1671
- Litvinova & Nadezhin (1985) Litvinova I. Y., Nadezhin D. K., 1985, Soviet Astronomy Letters, 11, 145
- Livne (1993) Livne E., 1993, ApJ, 412, 634
- Mackey et al. (2003) Mackey J., Bromm V., Hernquist L., 2003, ApJ, 586, 1
- Mannucci et al. (2007) Mannucci F., Della Valle M., Panagia N., 2007, MNRAS, 377, 1229
- Müller et al. (2017) Müller B., Melson T., Heger A., Janka H.-T., 2017, MNRAS, 472, 491
- Nakar et al. (2016) Nakar E., Poznanski D., Katz B., 2016, ApJ, 823, 127
- Paxton et al. (2011) Paxton B., Bildsten L., Dotter A., Herwig F., Lesaffre P., Timmes F., 2011, ApJS, 192, 3
- Paxton et al. (2013) Paxton B., et al., 2013, ApJS, 208, 4
- Paxton et al. (2015) Paxton B., et al., 2015, ApJS, 220, 15
- Popov (1993) Popov D. V., 1993, ApJ, 414, 712
- Shklovskii (1960) Shklovskii I. S., 1960, Soviet Ast., 4, 355
- Shussman et al. (2016) Shussman T., Nakar E., Waldman R., Katz B., 2016, preprint, (arXiv:1602.02774)
- Smartt (2009) Smartt S. J., 2009, ARA&A, 47, 63
- Smith et al. (2011) Smith N., Li W., Filippenko A. V., Chornock R., 2011, MNRAS, 412, 1522
- Sukhbold et al. (2016) Sukhbold T., Ertl T., Woosley S. E., Brown J. M., Janka H.-T., 2016, ApJ, 821, 38
- Takáts et al. (2015) Takáts K., et al., 2015, MNRAS, 450, 3137
- Utrobin et al. (2017) Utrobin V. P., Wongwathanarat A., Janka H.-T., Müller E., 2017, ApJ, 846, 37
- Valenti et al. (2016) Valenti S., et al., 2016, MNRAS, 459, 3939
- Wongwathanarat et al. (2015) Wongwathanarat A., Müller E., Janka H.-T., 2015, A&A, 577, A48
- Young (2004) Young T. R., 2004, ApJ, 617, 1233
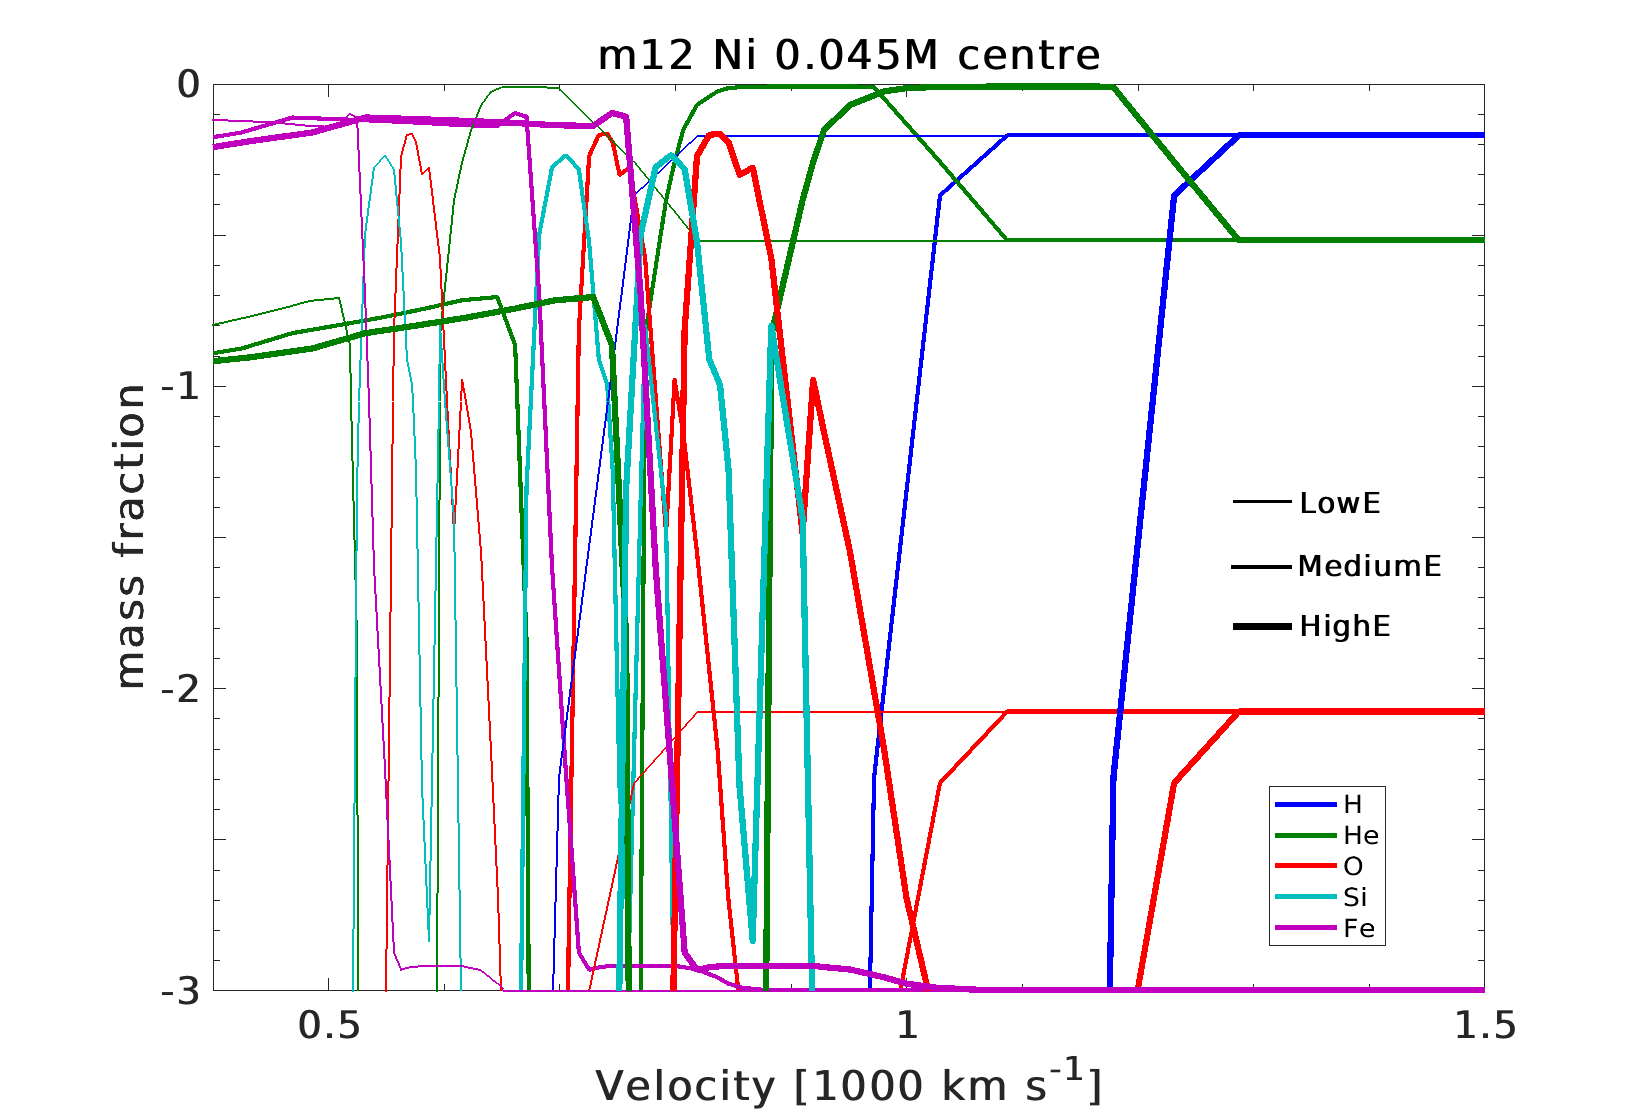
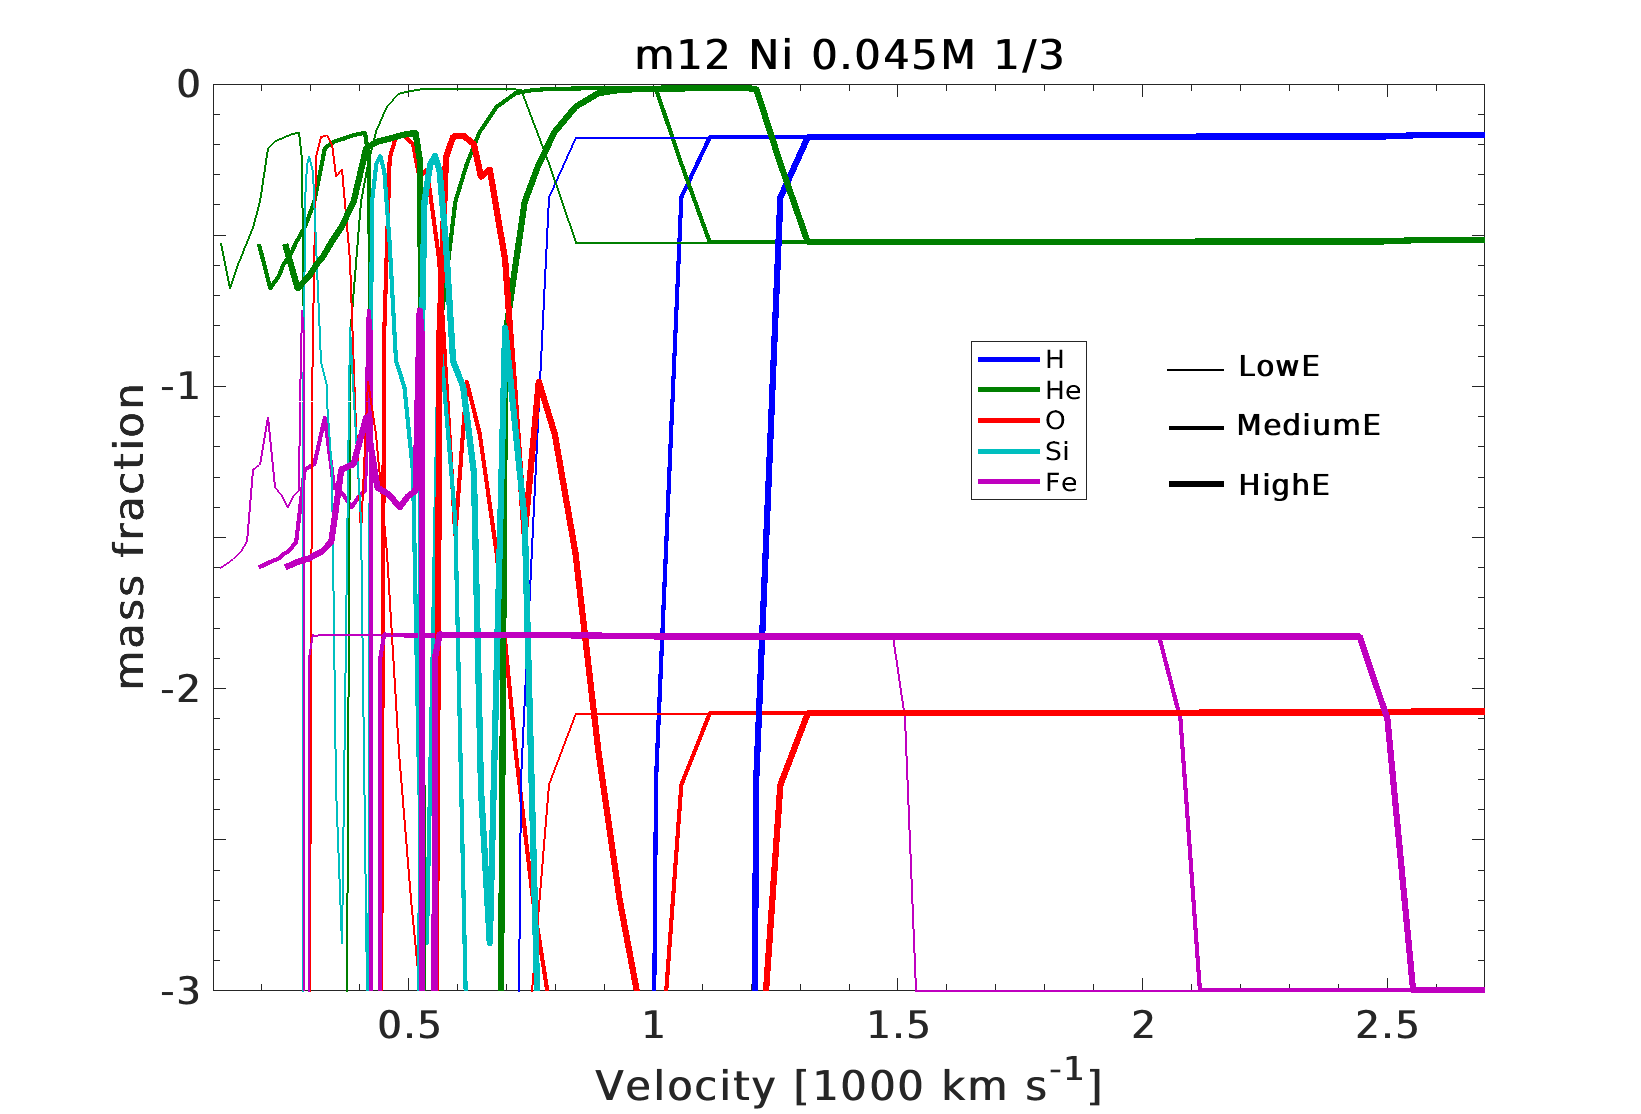
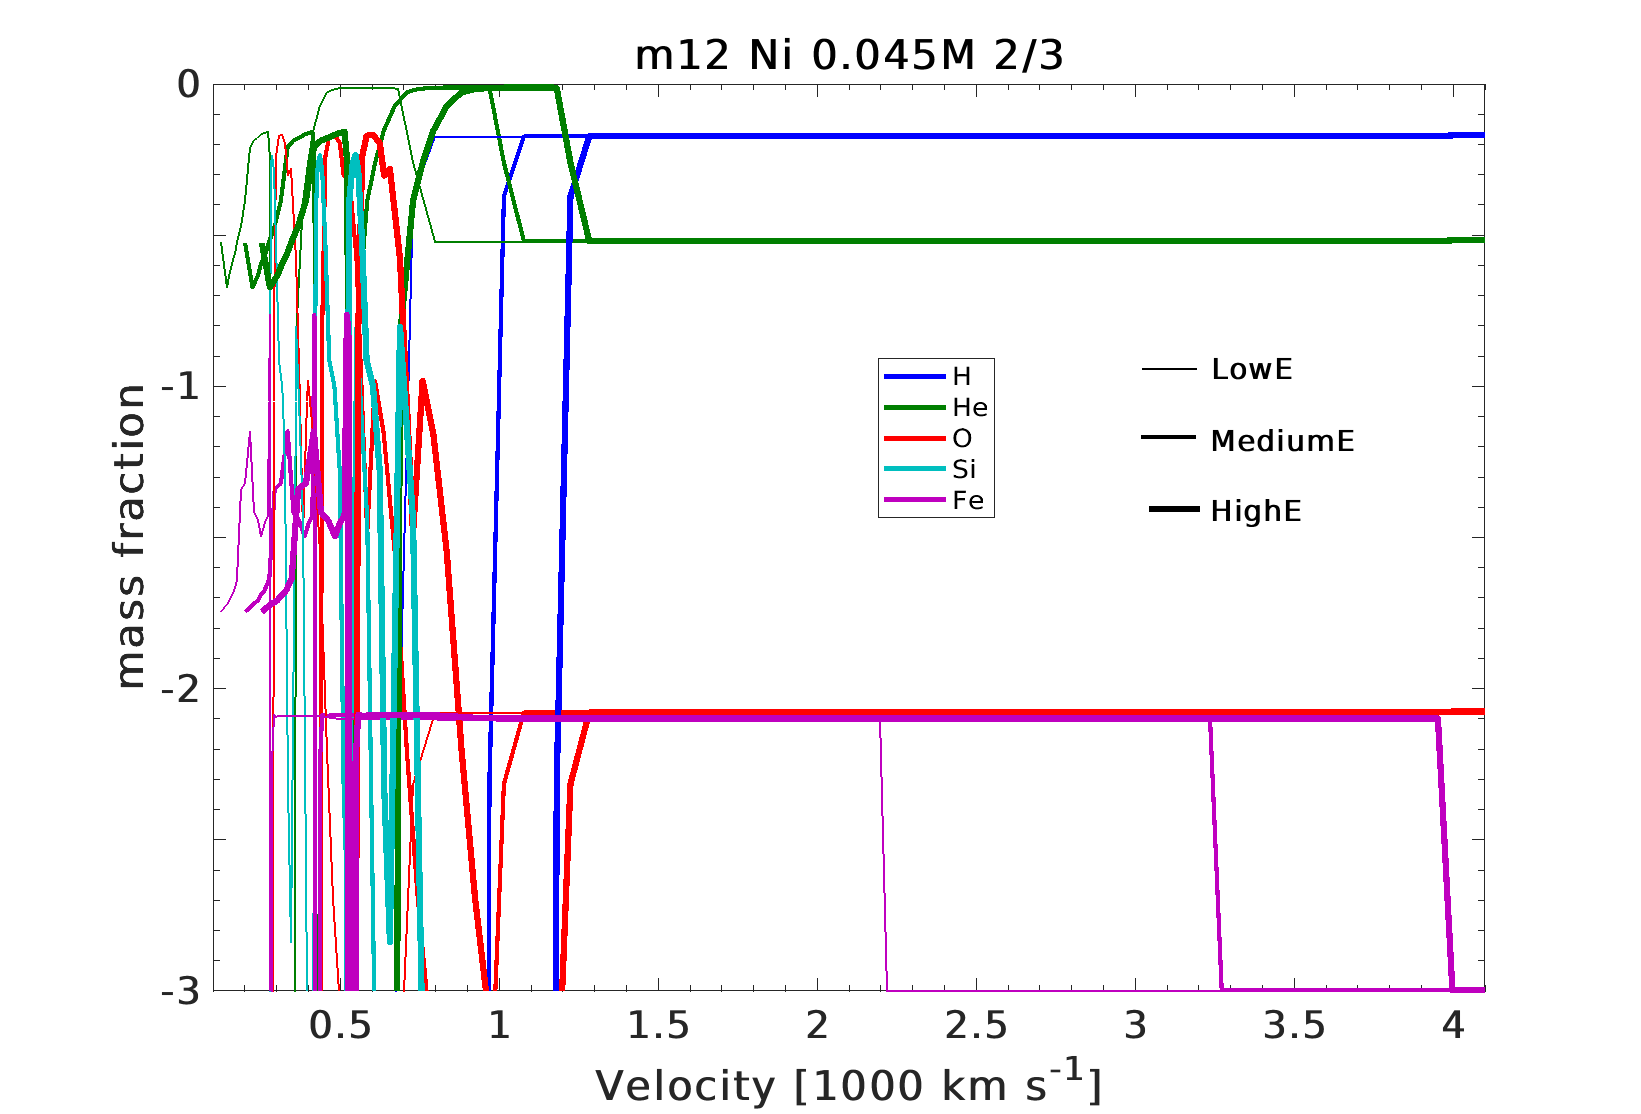
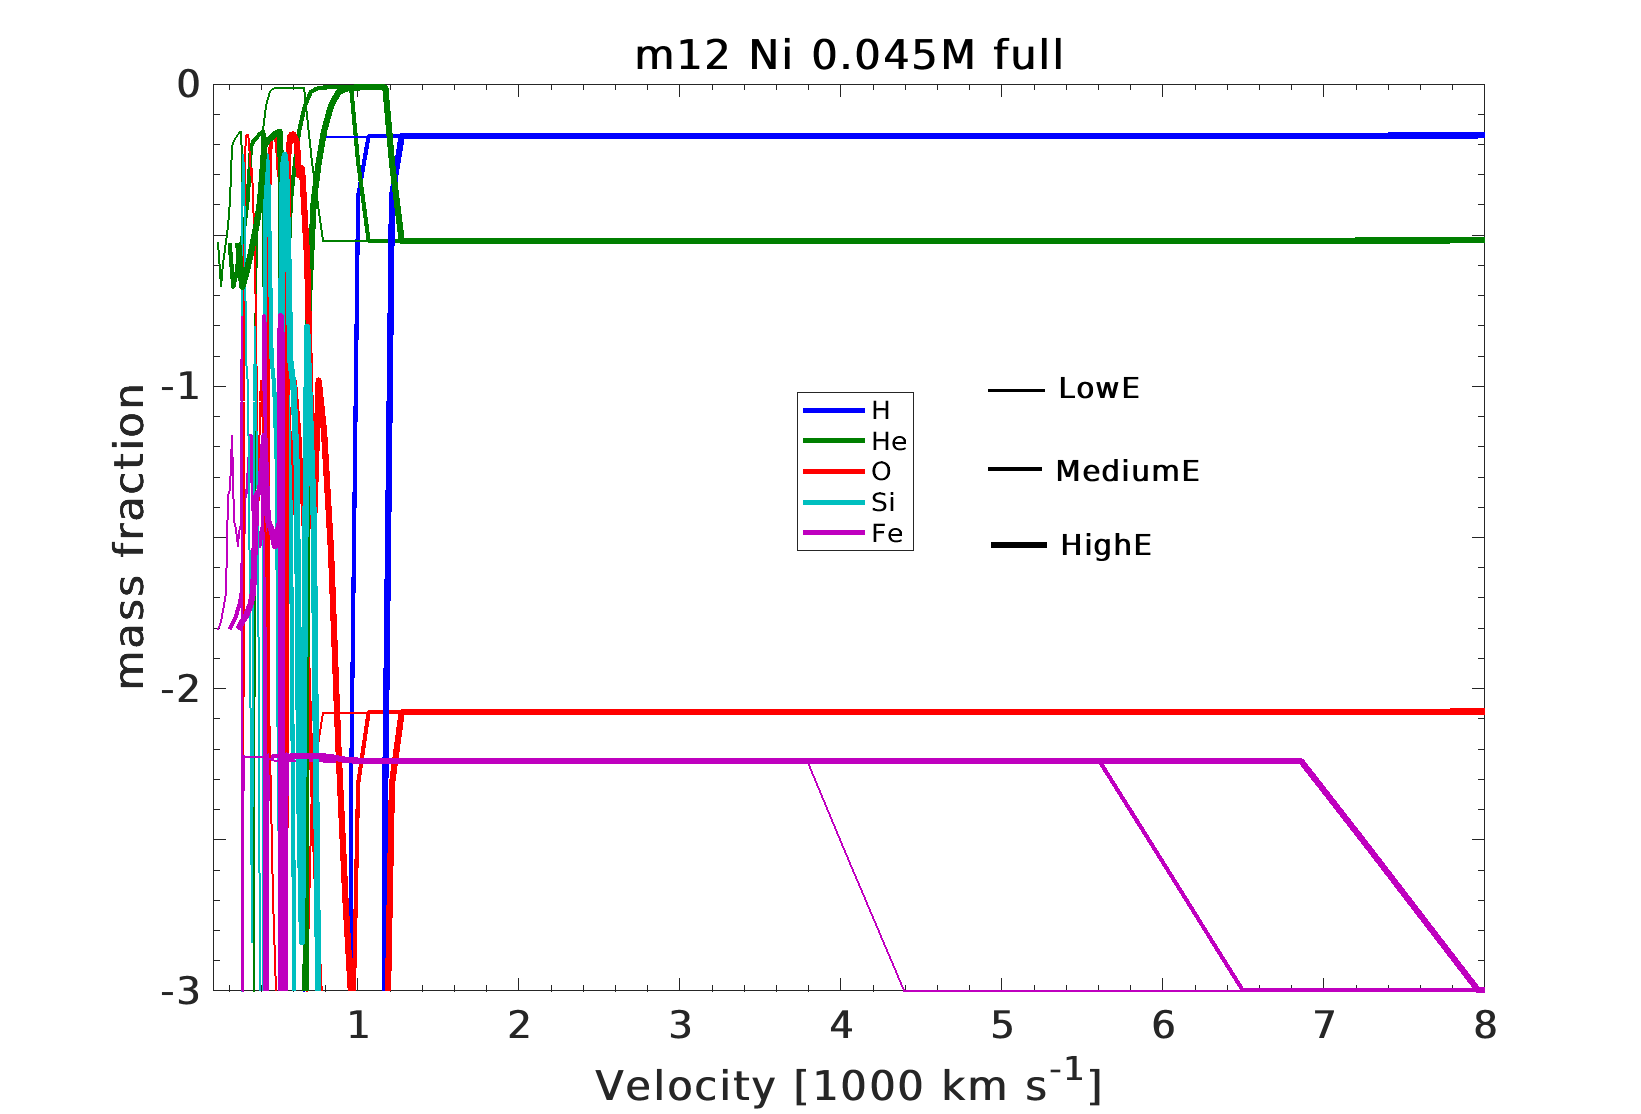
Appendix A The SN ejecta structure at coasting phase
Our study is focused on the light curve analysis, however, we present
additionally the SN ejecta structure at coasting phase. This might be
helpful for observers to interpret observational properties of a given
SN, like width of spectral lines of particular elements. In
Figures 12, 13, 14, and 15,
we show the selected species: hydrogen (H), helium (He), oxygen (O), silicon
(Si), and iron (Fe), at day 170 for the model m12 with 0.045 of
56Ni for all considered distributions of 56Ni for this model and for all
cases of explosion energy, 0.4 foe, 0.9 foe, and 1.35 foe.
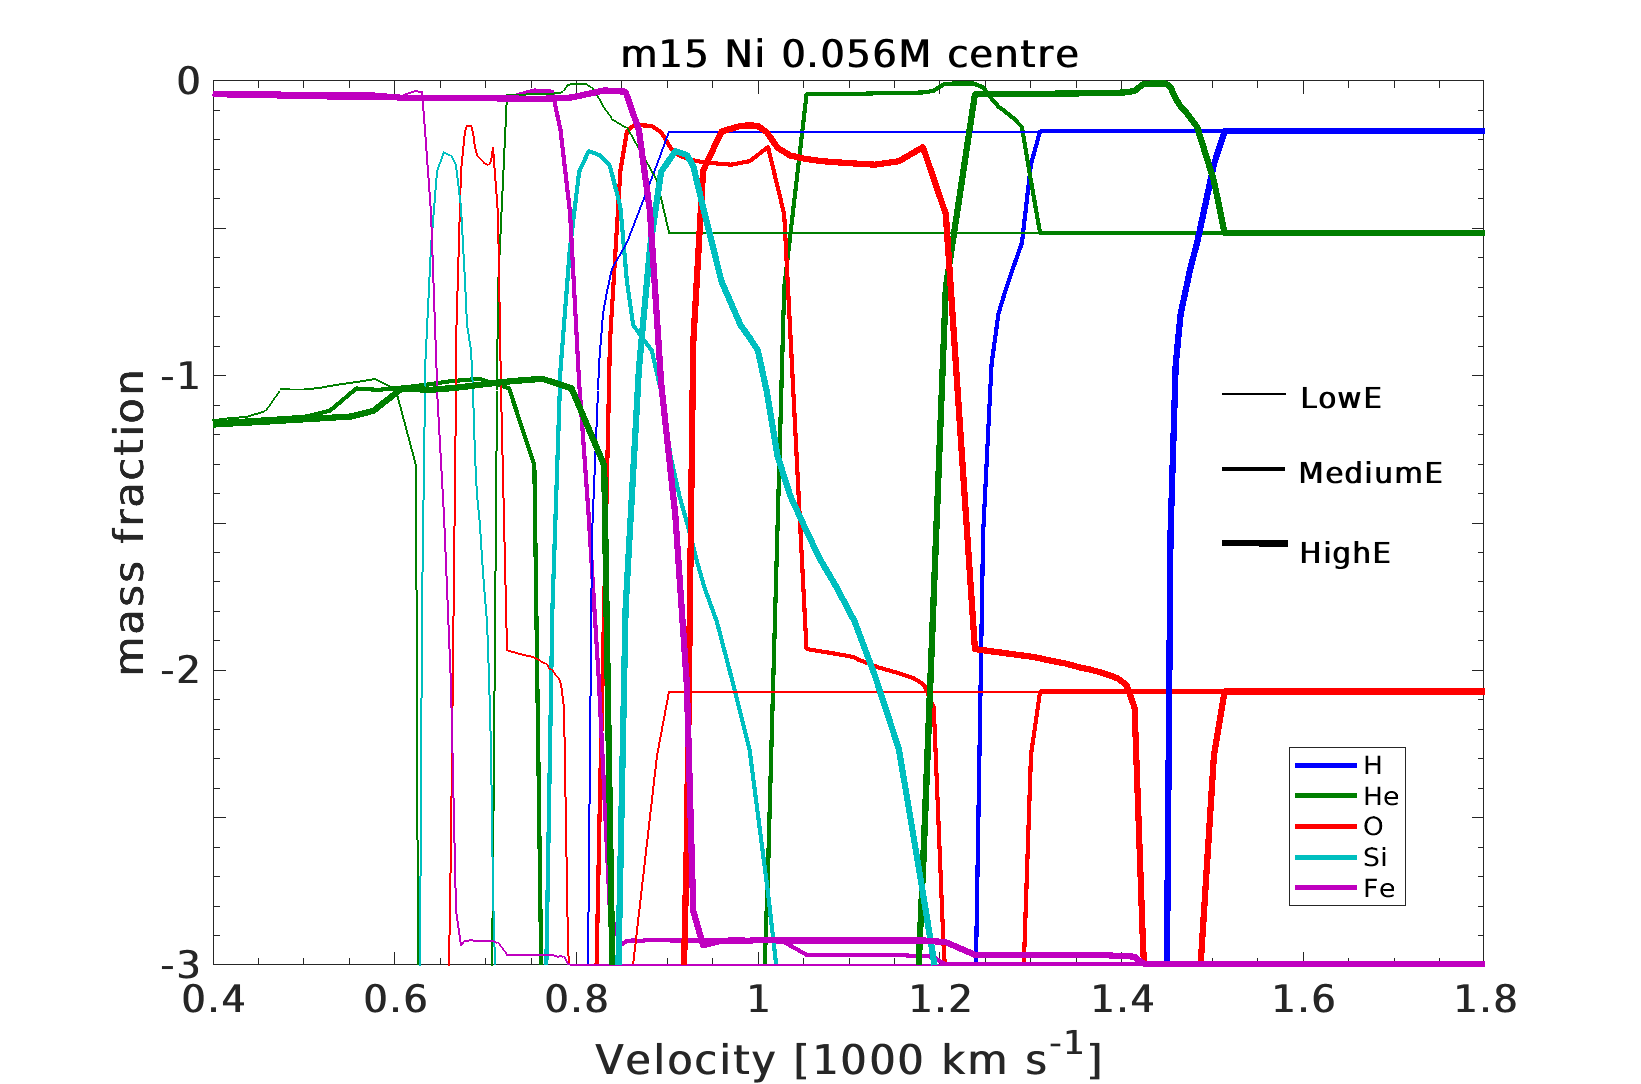
Similarly, Figures 17, 18, 19,
20, and 21 present ejecta structure of the
model m15 with 0.056 of 56Ni and considered explosion energies
0.53 foe, 1.1 foe, and 1.53 foe.
Iron (“Fe”) in the Figures represent a sum of mass fractions of iron-group elements
included in the STELLA simulations, i.e. iron, cobalt, and nickel.
Obviously, all chemical interfaces shift forward in velocity space for higher energy. For instance, the outer boundary of iron-rich material moves at 1550 km s for the model m12 and the mixing case “1/3” exploded with 0.4 foe (Figure 13), while it moves at 2550 km s for the explosion with 1.35 foe. There is no big difference for distribution of all species except iron for different degree of uniform mixing, since we limit our study and focus on modified 56Ni distribution (e.g. if compare Figures 13 and 14).