Subarcsecond blobs in flare-related coronal jets
Abstract
In this paper, we report our multiwavelength observations of subarcsecond blobs in coronal jets. In AR 12149, a C5.5 circular-ribbon flare occurred at 04:55 UT on 2014 August 24, which consisted of a discrete circular ribbon and a short inner ribbon inside. Two jets (jet1 and jet2) were related to the flare. Jet1 appeared first and experienced untwisting motion during its early propagation along a closed coronal loop. Jet2 appeared 6 minutes later and propagated upward along another closed loop. During its initial phase, a big plasmoid was ejected out of jet2 at a speed of 150 km s-1. After the flare peak time (05:02 UT), multiple bright and compact blobs appeared in the lower part of jet2, which were observed by the Slit-Jaw Imager (SJI) on board the Interface Region Imaging Spectrograph. The blobs observed by SJI in 1330 Å have sizes of 045135, nearly 84% of which are subarcsecond (1″). The mean value and standard deviation of the sizes are 078 and 019, respectively. The velocities of the blobs range from 10 to more than 220 km s-1, some of which decelerate and disappear during the upward propagation. Three of the blobs had their counterparts in extreme-ultraviolet (EUV) wavelengths observed by the Atmospheric Imaging Assembly (AIA) on board the Solar Dynamics Observatory spacecraft. The velocities are almost identical in ultraviolet (UV) and EUV wavelengths. We propose that the blobs observed in 1330 Å are the cool component (0.025 MK), while the blobs observed in EUV are the hot component of several MK. In jet1, only one blob was present with a size of 1″and a velocity of 40 km s-1. We conclude that the blobs are created by the tearing-mode instability of the current sheet at the base or inside the coronal jets. Our results have important implication for uncovering the fine structures of coronal jets and understanding the relationship between the blobs observed in UV and EUV wavelengths.
1 Introduction
Jet-like eruptions are prevalent in the solar atmosphere, such as spicules (De Pontieu et al., 2007), H surges (Canfield et al., 1996), chromospheric jets (Tian et al., 2014), and coronal jets (Shibata et al., 1992). Coronal jets are transient collimated outflows of hot plasma in the solar corona, which are associated with flares or microflares at the base (Raouafi et al., 2016). Coronal jets are observed in the extreme-ultraviolet (EUV) and soft X-ray (SXR) wavelengths (Shimojo et al., 1996; Innes et al., 2016; Zhang et al., 2017). According to the different morphology of jets, they are previously classified into the anemone jets (Yokoyama & Shibata, 1996) and two-sided jets (Tian et al., 2017; Zheng et al., 2018). The temperatures of the jet main body are a few MK (Shimojo & Shibata, 2000), while the temperatures of the jet base can reach up to tens of MK (Bain & Fletcher, 2009). The electron densities of jets are 0.74.0109 cm-3 with a mean value of 1.7109 cm-3. The apparent widths and heights of jets are 5100 Mm and 10400 Mm, respectively. The velocities are 101000 km s-1 with a mean value of 200 km s-1 (Shimojo & Shibata, 2000). The magnetic field strength of the jets are a few Gauss (Pucci et al., 2013). The lifetimes of jets range from 10 to 70 minutes, with a median value of 2040 minutes (Nisticò et al., 2009). Coronal jets tend to reoccur from the same region, which are called homologous jets (Madjarska, 2011; Madjarska et al., 2012; Huang et al., 2012; Mulay et al., 2017). Apart from the radial motion, they occasionally experience swirling or untwisting motion (Zhang & Ji, 2014a).
It is generally accepted that coronal jets result from impulsive release of magnetic free energy via magnetic reconnection. Numerical simulations and observations suggest that several triggering mechanisms of jets are at work, such as magnetic flux emergence (Yokoyama & Shibata, 1995; Moreno-Insertis et al., 2008), magnetic cancellation (Chifor et al., 2008; Panesar et al., 2016), mini-filament eruption (Sterling et al., 2015; Hong et al., 2016; Zhu et al., 2017; Wyper et al., 2018), and photospheric rotation (Pariat et al., 2009). Moore et al. (2010) classified the coronal jets into two types, the standard type and blowout type. The standard jets origin from magnetic reconnection between the emerging magnetic field and the preexisiting coronal field (Pucci et al., 2013), while the blowout jets come from the minifilament eruptions (Li et al., 2015; Shen et al., 2017).
The generation of magnetic islands (or called plasmoids) in a thin current sheet as a result of tearing-mode instability (TMI) (or called plasmoid instability) has been predicted in theory (Furth et al., 1963; Biskamp, 2000) and extensively investigated in numerical simulations (e.g., Bhattacharjee et al., 2009; Shen et al., 2011; Mei et al., 2012; Ni et al., 2012a). The creation and cascade of magnetic islands facilitate the magnetic reconnection rate and speed up the diffusion of magnetic energy (Bhattacharjee et al., 2009; Huang & Bhattacharjee, 2010; Ni et al., 2015). Numerical simulations and theoretical analysis have proven that plasmoid instability sets in when the Lundquist number () exceeds the critical value (104) (Bhattacharjee et al., 2009; Huang & Bhattacharjee, 2010, 2012; Ni et al., 2010, 2012b, 2013; Comisso et al., 2016; Huang et al., 2017). Above the solar photosphere, the Lundquist number is usually 101014 (Priest & Forbes, 2000). Therefore, plasmoid instability is expected to occur frequently in the solar eruptions, which are related to magnetic reconnection (Karpen et al., 2012). Discrete and intermittent plasmoids are observed in the long current sheet behind coronal mass ejections (CMEs) (e.g., Ohyama & Shibata, 1998; Ko et al., 2003; Asai et al., 2004; Lin et al., 2005; Takasao et al., 2012; Guo et al., 2013; Kumar & Cho, 2013; Cheng et al., 2018). In the chromospheric anemone jets, recurring plasmoids with a size of 0.1 Mm are reported by Singh et al. (2012) and excellently reproduced by the numerical simulations (Yang et al., 2013). Recently, intermittent plasmoids are detected in ultraviolet (UV) bursts (Rouppe van der Voort et al., 2017). The highly dynamic features (02) have line of sight velocities of 40 km s-1 and a lifetime of orders of seconds. The plasmoid cascading theory and numerical simulations indicate that the high-order plasmoids with a length scale of ion inertial length of 1 m can appear in the reconnection process (Shibata & Tanuma, 2001; Ni et al., 2015; Ni & Lukin, 2018). However, the smaller plasmoids with a length scale of 01 have not been observed due to the limited spatial resolutions and time cadences of solar telescopes.
For the first time, Zhang & Ji (2014b) reported the discovery of intermittent blobs in recurring coronal jets at the active region (AR) boundary. In a follow-up work, Zhang et al. (2016a) reported the observations of multiple blobs embedded in recurring jets propagating along a large-scale closed loop in the quiet region. The bright and compact features have a size of 1.53 Mm, temperature of 1.83.1 MK, electron density of 1.72.8109 cm-3, a lifetime of 2460 s, and a velocity of 120450 km s-1. The authors proposed that the blobs are plasmoids created by TMI of the current sheet and propagate along the jets, which is justified by state-of-the-art 3D numerical simulations (Wyper et al., 2016). Ni et al. (2017) explored in detail the blob formation and ejection in coronal jets. It is found that, in addition to TMI, the Kelvin-Helmholtz instability (KHI) can also create blob-like vortex features in coronal jets when the plasma beta is relatively high (Zhao et al., 2018).
Using the high-resolution observations obtained from the Interface Region Imaging Spectrograph (IRIS; De Pontieu et al., 2014), Zhang & Zhang (2017) investigated the bidirectionally moving blobs that originate from the junction between the spire and the arc-base of a jet. However, the relationship between the blobs observed in UV and EUV wavelengths is not fully addressed. In this paper, we report our multiwavelength observations of the subarcsecond blobs in coronal jets associated with a C5.5 circular-ribbon flare (CRF) on 2014 August 24. As its name implies, the ribbons of CRFs have circular or quasi-circular shapes (Zhang et al., 2015, 2016b, 2016c; Li et al., 2018). The paper is structured as follows. Data analysis is described in Section 2. Results are shown in Section 3. In Section 4, we compare our findings with previous works. In Section 5, we give a brief summary of the results and draw a conclusion.
2 Instruments and data analysis
The C5.5 flare taking place in NOAA AR 12149 (N10E44) was observed by the Atmospheric Imaging Assembly (AIA; Lemen et al., 2012) on board the Solar Dynamics Observatory (SDO; Pesnell et al., 2012) spacecraft. AIA takes full-disk images in UV (1600 and 1700 Å) and EUV (94, 131, 171, 193, 211, 304, and 335 Å) wavelengths. The AIA level_1 data were calibrated using the standard Solar Software (SSW) programs aia_prep.pro. Compared with AIA, the field of view (FOV) of the Slit-Jaw Imager (SJI) on board IRIS is much smaller, being 126″129″. SJI observed the flare and jets in 1330 Å, which includes two C II lines at 1335 Å and 1336 Å formed in the upper chromosphere ( MK). The IRIS/SJI level_2 data were directly used and coaligned with the AIA images using the cross correlation method. SXR fluxes of the flare in 0.54 Å and 18 Å were recorded by the GOES spacecraft. The observational parameters, including the instrument, wavelength, time cadence, and pixel size are summarized in Table 1.
| Instru. | Time | Caden. | Pix. size | |
|---|---|---|---|---|
| (Å) | (UT) | (s) | (″) | |
| IRIS/SJI | 1330 | 04:3005:22 | 18.7 | 0.166 |
| SDO/AIA | 131335 | 04:3006:00 | 12 | 0.60 |
| GOES | 0.54.0 | 04:3006:00 | 2.05 | |
| GOES | 18 | 04:3006:00 | 2.05 |
3 Results
3.1 C5.5 flare and double jets
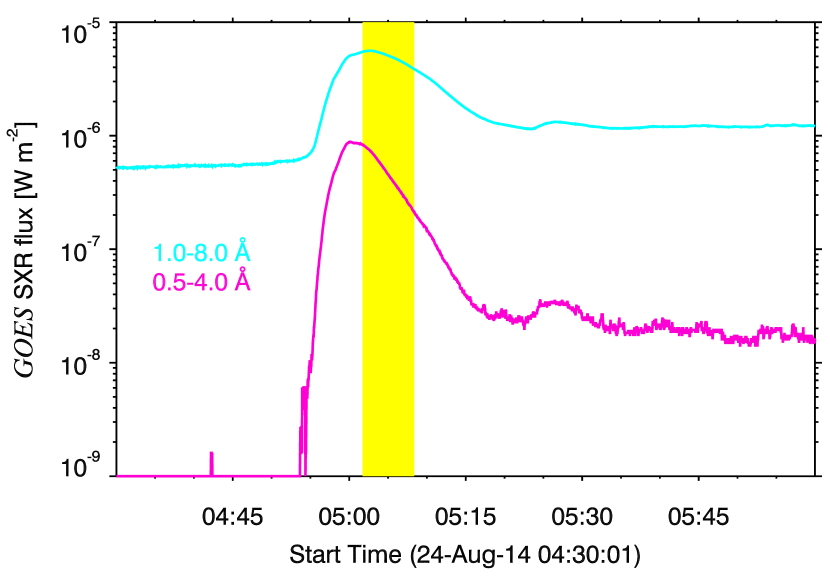
Figure 1 shows the GOES SXR light curves of the C5.5 flare. It is clear that the SXR fluxes increase very slowly during 04:3004:55 UT. In the impulsive phase, the fluxes rise rapidly to the peak values around 05:02 UT, which is followed by a gradual decay phase until 05:25 UT. The lifetime of the flare is 30 minutes.
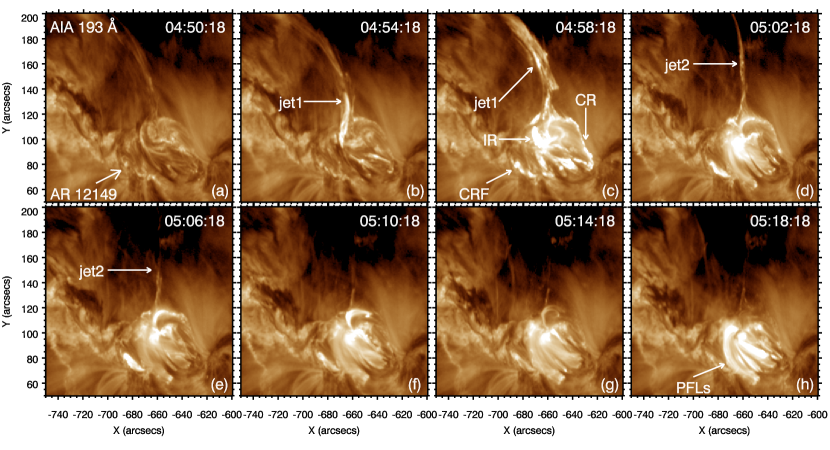
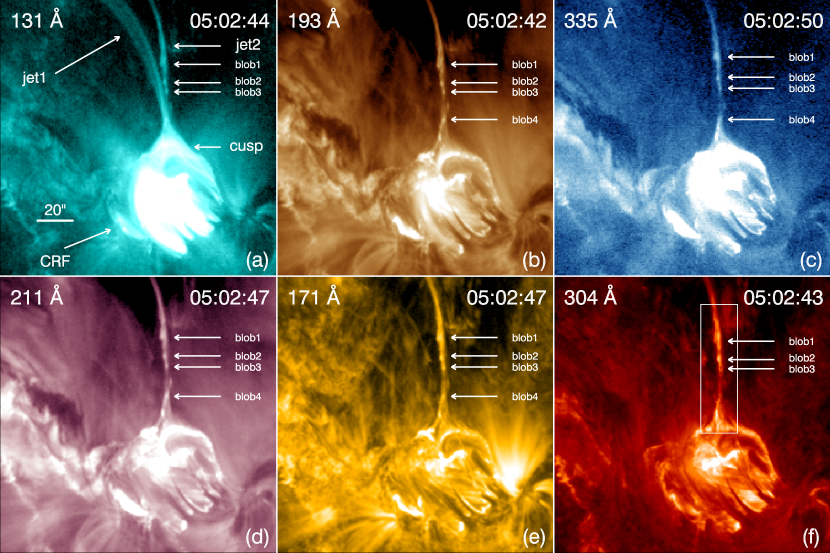
In Figure 2, the evolution of the flare is illustrated by eight snapshots of the AIA images in 193 Å (see also the online movie CRF193.mov). In the preflare phase before 04:55 UT, there was no significant brightening in AR 12149 (see panel (a)). At the very beginning of the impulsive phase, a twisted jet (jet1) spurted out of the AR (see panel (b)). About four minutes later, the jet (jet1) rotated and propagated further and higher along a closed coronal loop in the northeast direction. Meanwhile, the EUV intensities of the flare ribbons at the jet base, including the circular ribbon (CR) and inner ribbon (IR), reached their maxima (see panel (c)). The diameter of CR is 1. The short and bright IR is surrounded by the thin and fragmented CR, implying a magnetic null point () above the CRF and the corresponding fan-spine topology (e.g., Zhang et al., 2012, 2015). Interestingly, a second slender jet (jet2) appeared and propagated northwards near the flare peak time (see panel (d)). Like jet1, jet2 propagated along a large-scale closed coronal loop (see panel (e)). Afterwards, jet1 and jet2 darkened and disappeared sequentially till 05:15 UT (see panel (g)). The post-flare loops (PFLs) cooled down and faded out gradually in the decay phase (see panel (h)).
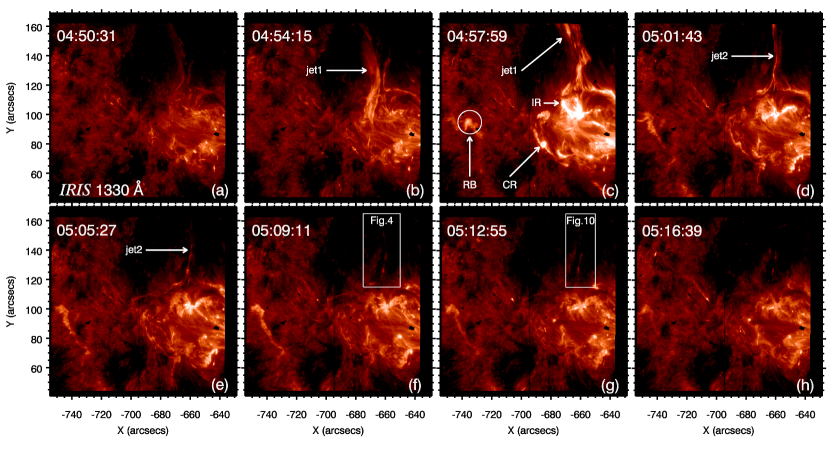
In Figure 3, the evolution of the flare is illustrated by eight snapshots of the IRIS/SJI images in 1330 Å (see also the online movie CRF1330.mov). Due to the limited FOV of SJI, only the eastern part of CR and lower part of the jets are visible (see panel (c)). Like in EUV wavelengths, IR is the brightest feature surrounded by the CR. Interestingly, remote brightening (RB) appeared east to the CR, which is enclosed by a small circle (see panel (c)). EUV observations indicate that the RB and CRF is connected by a closed coronal loop along which jet1 propagates. Owing to the higher resolution of IRIS, the double jets (jet1 and jet2) show more details than those in EUV wavelengths.
3.2 Blobs in jet2
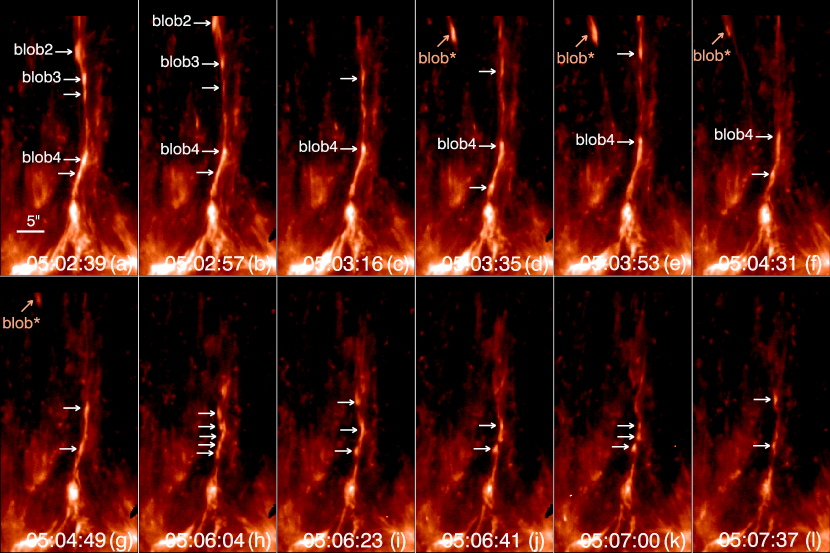
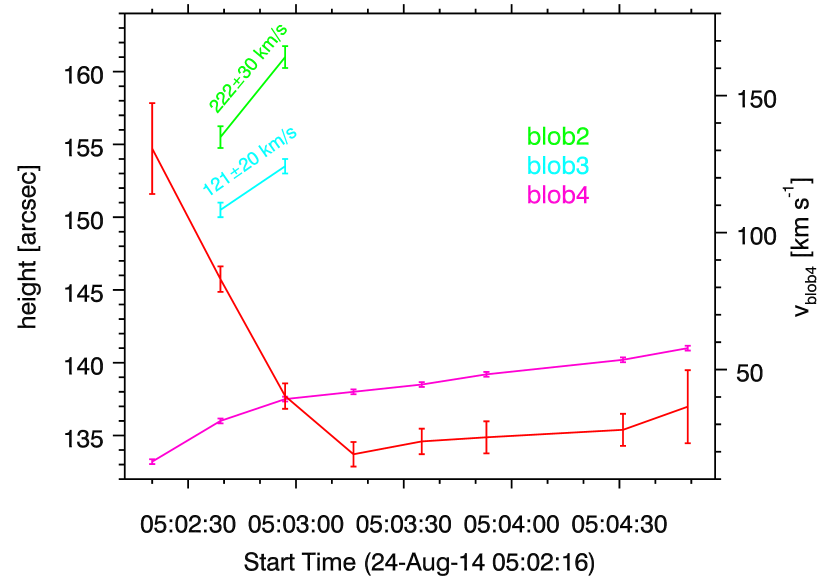
Figure 4 demonstrates twelve closeups of jet2 in 1330 Å during 05:0205:08 UT. The FOV (25″50″) is signified by the white rectangle in Figure 3(f). The most prominent features are the tiny, bright, and compact blobs pointed by the white arrows (see also the online movie blob.mov). At any time, there are multiple blobs moving upward. Some disappeared within a short period of time and new blobs appeared. Three blobs (blob2, blob3, and blob4) with larger sizes are identified and tracked by following the gravitational centers of the blobs, which are defined as the intensity-weighted average heights. The temporal evolutions of the heights are displayed with green, cyan, and magenta lines in Figure 5. Blob2 and blob3 moved so fast that they left the FOV of SJI after 05:03:00 UT. The velocities of blob2 and blob3 are 22230 and 12120 km s-1 in the FOV of SJI. Blob4 was formed at a relatively lower altitude and moved slower than blob2 and blob3. Therefore, we can track blob4 for a longer time. The temporal evolution of the velocity of blob4 is plotted with a red line in Figure 5. It is clear that the velocity decreased quickly from the initial value of 130 km s-1 to 2040 km s-1 in the later phase.
Interestingly, we found multiple blobs in jet2 observed by AIA. The EUV images around 05:02:45 UT are displayed in Figure 6. In each panel, four bright and compact blobs could be recognized and labeled with blob1, blob2, blob3, and blob4. The diameters of the blobs (414, 286, 223, and 280) are close to the sizes reported in previous literatures (Zhang & Ji, 2014b; Zhang et al., 2016a).
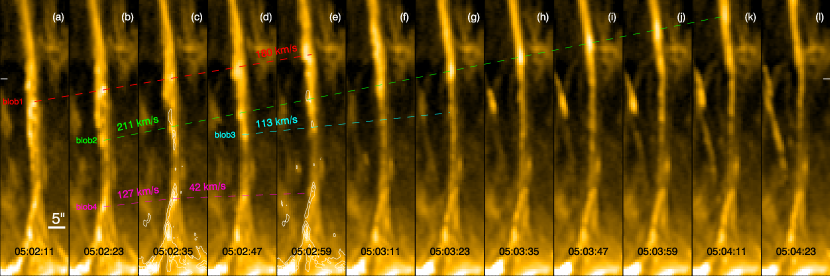
In order to track the propagations of the blobs, twelve closeups of jet2 in 171 Å during 05:0205:05 UT are displayed in Figure 7. It is evident that blob1 was created at the highest altitude and moved upward at a speed of 18018 km s-1. Probably due to the higher temperature and absence of cool plasmas, the formation and propagation of blob1 were not captured by SJI. Compared with blob1, blob2 was created at a lower altitude and propagated at a faster speed of 2118 km s-1. The lifetime of blob2 is close to 2 minutes in EUV wavelengths. In panels (c) and (e), we superpose the intensity contours of the 1330 Å images at 05:02:39 UT and 05:02:57 UT with white lines. It is found that blob2 observed in 1330 Å and 171 Å are cospatial. In other words, blob2 observed in 1330 Å had its counterpart in 171 Å. Blob3 was created around 05:02:47 UT at an altitude slightly higher than blob2 and propagated upward at a speed of 11312 km s-1. The intensity of blob3 decreased too quickly to be recognized after 05:03:23 UT. Blob4 was formed at the lowest altitude. The velocity decreased from 127 km s-1 before 05:02:35 UT to 42 km s-1 afterwards. In panel (e), like blob2, blob3 and blob4 observed in 1330 Å had their counterparts in 171 Å. Combing with Figure 5, we can conclude that the velocities of the blobs observed in UV and EUV wavelengths are almost identical. The coincident presence of blobs in UV and EUV wavelengths indicate that the blobs are multithermal, with their temperatures ranging from 0.025 MK to several MK. We have checked the movie of jets in 94 Å and failed to find clear signature of blobs, which means that the temperature of the blobs are lower than the peak temperature (6.3 MK) of 94 Å.
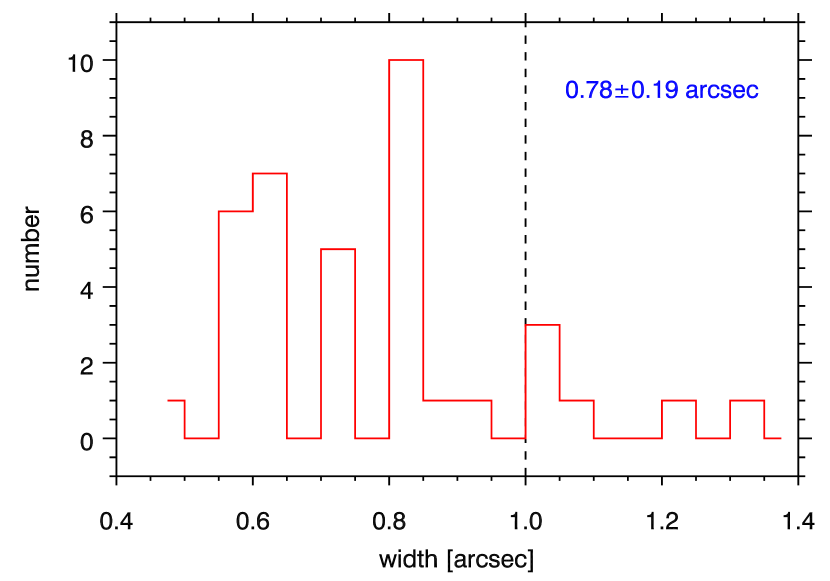
The sizes of the blobs are defined as the full widths at half-maximum (FWHM) of the intensity variation curve along the cuts across the blobs. We measured the widths of all blobs in jet2 observed by IRIS manually and draw a histogram of the widths in Figure 8. The widths range from 045 to 135, with a mean value of 078 and standard deviation of 019. It is clear that most of the blobs (84%) in jet2 are subarcsecond (1″) and only 16% have widths greater than 1″. The sizes of blobs observed by IRIS are significantly smaller than those observed by SDO (Zhang & Ji, 2014b; Zhang et al., 2016a; Shen et al., 2017).
3.3 Blob in jet1
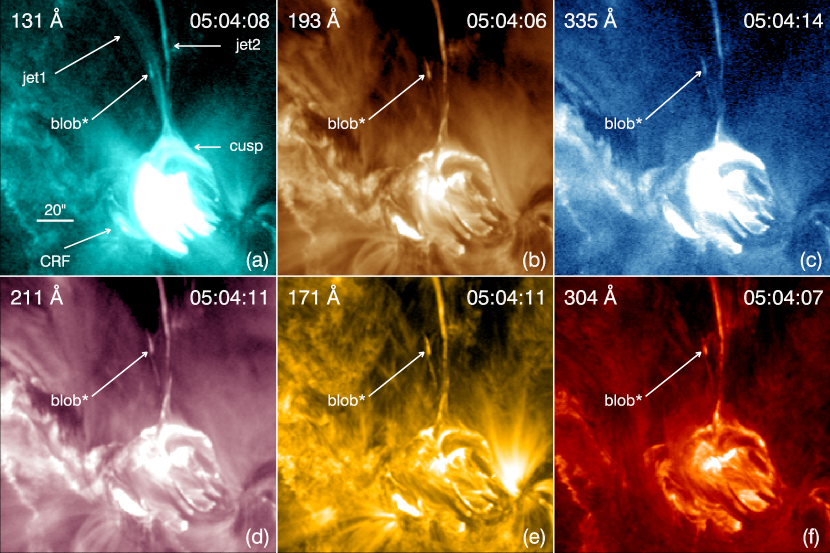
Considering the plentiful blobs in jet2, one may also expect a large number of blobs in jet1. We checked carefully the UV and EUV images of the jets, only to find one blob observed by IRIS and AIA. In Figure 4(d)-(g), the orange arrows point to the blob in jet1, which is labeled with blob*. The width and velocity of the blob are 1″02 and 4111 km s-1. In EUV wavelengths, with a size of 27, blob* appeared at 05:03:35 UT and propagated upward at a speed of 3912 km s-1 before disappearing at 05:04:47 UT. Figure 9 shows the EUV images observed by AIA around 05:04:09 UT, where blob* in jet1 is pointed by the white arrows. The big difference between the velocities of blob* and the blobs in jet2 is probably due to the different environments and velocities of reconnection outflow of the jets. In Table 2, we list the widths and velocities of the blobs observed in 1330 Å and 171 Å.
| blob | ||||
|---|---|---|---|---|
| (″) | (″) | (km s-1) | (km s-1) | |
| blob1 | 4.14 | 18018 | ||
| blob2 | 1.20 | 2.86 | 22230 | 2118 |
| blob3 | 0.82 | 2.23 | 12120 | 11312 |
| blob4 | 0.82 | 2.80 | 20130 | 42127 |
| blob* | 1.0 | 2.70 | 4111 | 3912 |
4 Discussion
In the 2D standard flare model, when a filament or flux rope losses equilibrium and erupts into the interplanetary space, a thin current sheet forms between the cusp-shaped PFLs and CME (Lin et al., 2004). The hot and bright current sheet has been frequently observed and substantially investigated in EUV and white light wavelengths (e.g., Lin et al., 2005; Seaton et al., 2017). Observations of multiple blobs in the current sheet have also been reported (e.g., Ko et al., 2003; Asai et al., 2004; Takasao et al., 2012; Kumar & Cho, 2013; Cheng et al., 2018). The sizes and velocities of bidirectional moving blobs are 2″5″and hundreds of km s-1. The temperatures and densities of the blobs are 1.54 MK and 0.81.21010 cm-3, respectively. During the magnetic reconnection between a filament and nearby coronal loops, multiple blobs are found in the current sheet with temperature of 2.5 MK and electron density of 3.55109 cm-3 (Li et al., 2016). In the small-scale chromospheric jets and UV bursts, the blobs are much smaller (Singh et al., 2012; Rouppe van der Voort et al., 2017).
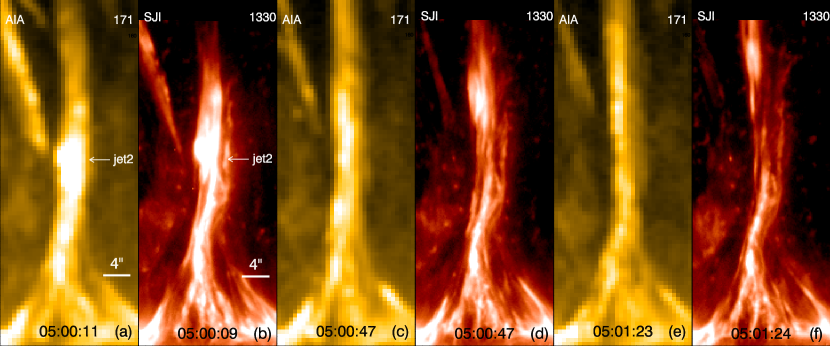
An open question about the blobs in various scales is that how are they created. It has been predicted that a current sheet may experience TMI when it is thin enough (Furth et al., 1963). Most of the authors attribute the observations of blobs to TMI in a current sheet (e.g., Ohyama & Shibata, 1998; Kliem et al., 2000; Asai et al., 2004; Karlický, 2004; Kumar & Cho, 2013). The creation, fragmentation, and coalescence of plasmoids in a current sheet have been well reproduced in multidimensional numerical simulations (Ni et al., 2012a, b; Nishizuka & Shibata, 2013; Yang et al., 2013; Ni et al., 2015; Wyper et al., 2016). Based on the numerical simulations of the jet formation due to the magnetic reconnection between the newly emerging flux and the previous coronal magnetic field, Ni et al. (2017) proposed that there are two possible mechanisms of the blobs. One is TMI and the other is KHI. In this paper, we prefer that the tiny blobs are created by TMI for two reasons. On the one hand, there is no obvious swirling or vortex motion of the blobs as a result of velocity shear in jet2. On the other hand, the lower part of jet2 is very close to the CRF (see Figure 3). A magnetic null point may exist where electric current can accumulate (Thurgood et al., 2017). In Figure 10, six snapshots of jet2 observed by AIA and SJI during 05:0005:02 UT are displayed. At the very beginning of jet2, a “huge” plasmoid is ejected upward at a speed of 150 km s-1, which is followed by the formation and ejection of multiple blobs as described above. This is a miniature version of plasmoid eruption and the underlying current sheet in the standard flare model (e.g., Shibata et al., 1995; Lin et al., 2004; Nishizuka & Shibata, 2013).
Some blobs (e.g., blob1) are firstly seen at locations far away from the flaring site or cusp of the jets. These remote blobs could be associated with the shocks as interpreted by Huang et al. (2018b). In the numerical simulations of Ni et al. (2017), the bright point pointed by the white arrows are caused by the fast reconnection outflows associated with shocks (see their Fig. 4(a)). It is also pointed out that the cusp region at the base of a jet is not the unique region where magnetic reconnections take place. Magnetic reconnection and plasmoid instability also take place inside the jet above the cusp region. Hence, the blobs which are firstly seen at locations far away from the flaring site or cusp region are possibly created by the plasmoid instability inside the fragmented current sheets along the jet.
In Figure 8, the sizes of the blobs in jet2 observed by IRIS/SJI are 045135, with a mean value of 078 and a standard deviation of 019. For the three blobs (blob2, blob3, and blob4) that are visible in both UV and EUV wavelengths, the sizes in 1330 Å are significantly smaller than those in 171 Å (see Table 2). The difference is not caused by the resolution of the instruments since it is beyond the uncertainty brought in by the resolutions. One possible reason of the difference is that different components of the same blob are separately observed by SJI in 1330 Å and by AIA in 171 Å. Since the formation temperature of 1330 Å is 0.025 MK, the blobs observed in 1330 Å represent the cool component of plasmoids. The blobs observed in EUV wavelengths represent the hot component. This is in agreement with the previous numerical simulations of TMI in a current sheet (Ni et al., 2016). The simulations indicate that the plasmas inside the plasmoids can be heated from 4200 K to 105 K during the magnetic reconnection near the temperature minimum region, and the plasmoids are composed of multithermal plasmas. In our study, we propose that the blobs in jet1 and jet2 are plasmoids ejected upward along the jets and some of them are heated to 10106 K so that they can be detected in EUV wavelengths. Ni et al. (2017) found that the blobs both inside the current sheet and along the jet are multithermal and have different sizes in different wavelengths.
Figures 6 and 7 reveal that only a few of the blobs created at the base of jet2 can been observed in EUV wavelengths. The EUV flux at a certain passband (e.g., 171 Å) can be expressed as
| (1) |
where is the temperature response function of passband , stands for the differential emission measure, is the electron temperature where the response reaches the maximum, is the electron number density, and is the integral line-of-sight depth (Cheng et al., 2012). Therefore, the intensities of blobs depend on both density and temperature of plasmas. The EUV intensities of blobs should be high enough to be detected. If the blobs have very low density or temperature as a result of insufficient Joule heating, the intensities will be too weak to be detected.
The kinematics of blob4 is interesting. As is shown in Figure 5, blob4 decelerated from 130 km s-1 at 05:02:20 UT to 20 km s-1 at 05:03:20 UT. The deceleration is estimated to be 1.8 km s-2, which is much larger than the gravitational acceleration on the solar surface. There are two possible reasons. The first explanation is that the flux tubes holding the blobs might be braiding, so that the curvature decelerates the plasma blobs on the plane of sky. The original idea of braiding flux tubes where electric current accumulates in the corona was proposed by Parker (1983) and investigated in numerical simulations by Pontin et al. (2017). Owing to the extraordinarily high resolutions of spacecrafts, direct observations of braiding fine structures are reported by Cirtain et al. (2013) and Huang et al. (2018a). The second explanation is that the plasmoids in the current sheet might collide and coalesce. As is revealed in the previous numerical simulations (e.g., Ni et al., 2015, 2016, 2017), TMI in the current sheets always result in many reconnection X-points, bidirectional flows, and plasmoids with different sizes and velocities adjacent to the X-points. The collision and coalescence between these blobs may result in rapid deceleration of the rising blobs.
5 Summary
In this paper, we report our multiwavelength observations of subarcsecond blobs on 2014 August 24. The main results are summarized as follows:
-
1.
In AR 12149, a C5.5 CRF occurred at 04:55 UT, which consisted of a discrete circular ribbon with a diameter of 1 and a short inner ribbon inside. Two jets (jet1 and jet2) were related to the flare. Jet1 appeared first and underwent untwisting motion during its early propagation along a large-scale, closed coronal loop. Jet2 appeared 6 minutes later and propagated upward along another closed loop. During its initial phase (05:0005:02 UT), a big plasmoid was ejected out of jet2 at a speed of 150 km s-1.
-
2.
After the flare peak time (05:02 UT), multiple bright and compact blobs appeared in the lower part of jet2, which were observed by IRIS/SJI in 1330 Å. The sizes of the blobs are 045135, with a mean value of 078 and a standard deviation of 019. Nearly 84% of the blobs are subarcsecond, and only 16% are larger than 1″. The velocities of the blobs range from ten to more than 220 km s-1, some of which decelerate and disappear during the upward propagation. The formation of blobs ended around 05:08 UT.
-
3.
Three of the blobs (blob2, blob3, and blob4) in jet2 had their counterparts in EUV wavelengths observed by AIA, and the velocities are almost equal in UV and EUV wavelengths. We suppose that the blobs observed in 1330 Å are the cool component (0.025 MK), while the blobs observed in EUV are the hot component of several MK. In jet1, only one blob was clearly observed, with a size of 1″02 and a velocity of 40 km s-1.
-
4.
We conclude that the blobs are created by TMI of the current sheet at the base or inside the coronal jets. Benefiting from the unprecedented spatial resolution of IRIS, our results are important to uncover the fine structures of coronal jets and address the relationship between the jets observed in UV and EUV wavelengths. They will not only impose constraint on the theoretical models of coronal jets, but have implication for magnetic reconnection as well. Additional case studies and numerical simulations are fairly in demand to figure out the cause and properties of blobs.
References
- Asai et al. (2004) Asai, A., Yokoyama, T., Shimojo, M., & Shibata, K. 2004, ApJ, 605, L77
- Bain & Fletcher (2009) Bain, H. M., & Fletcher, L. 2009, A&A, 508, 1443
- Bhattacharjee et al. (2009) Bhattacharjee, A., Huang, Y.-M., Yang, H., & Rogers, B. 2009, Physics of Plasmas, 16, 112102
- Biskamp (2000) Biskamp, D. 2000, Magnetic reconnection in plasmas, Cambridge, UK: Cambridge University Press, 2000 xiv, 387 p. Cambridge monographs on plasma physics, vol. 3, ISBN 0521582881,
- Canfield et al. (1996) Canfield, R. C., Reardon, K. P., Leka, K. D., et al. 1996, ApJ, 464, 1016
- Cheng et al. (2012) Cheng, X., Zhang, J., Saar, S. H., & Ding, M. D. 2012, ApJ, 761, 62
- Cheng et al. (2018) Cheng, X., Li, Y., Wan, L. F., et al. 2018, ApJ, 866, 64
- Chifor et al. (2008) Chifor, C., Isobe, H., Mason, H. E., et al. 2008, A&A, 491, 279
- Cirtain et al. (2013) Cirtain, J. W., Golub, L., Winebarger, A. R., et al. 2013, Nature, 493, 501
- Comisso et al. (2016) Comisso, L., Lingam, M., Huang, Y.-M., & Bhattacharjee, A. 2016, Physics of Plasmas, 23, 100702
- De Pontieu et al. (2007) de Pontieu, B., McIntosh, S., Hansteen, V. H., et al. 2007, PASJ, 59, S655
- De Pontieu et al. (2014) De Pontieu, B., Title, A. M., Lemen, J. R., et al. 2014, Sol. Phys., 289, 2733
- Furth et al. (1963) Furth, H. P., Killeen, J., & Rosenbluth, M. N. 1963, Physics of Fluids, 6, 459
- Guo et al. (2013) Guo, L.-J., Bhattacharjee, A., & Huang, Y.-M. 2013, ApJ, 771, L14
- Hong et al. (2016) Hong, J., Jiang, Y., Yang, J., et al. 2016, ApJ, 830, 60
- Huang & Bhattacharjee (2010) Huang, Y.-M., & Bhattacharjee, A. 2010, Physics of Plasmas, 17, 062104
- Huang & Bhattacharjee (2012) Huang, Y.-M., & Bhattacharjee, A. 2012, Physical Review Letters, 109, 265002
- Huang et al. (2012) Huang, Z., Madjarska, M. S., Doyle, J. G., & Lamb, D. A. 2012, A&A, 548, A62
- Huang et al. (2017) Huang, Y.-M., Comisso, L., & Bhattacharjee, A. 2017, ApJ, 849, 75
- Huang et al. (2018a) Huang, Z., Xia, L., Nelson, C. J., et al. 2018, ApJ, 854, 80
- Huang et al. (2018b) Huang, Z., Mou, C., Fu, H., et al. 2018, ApJ, 853, L26
- Innes et al. (2016) Innes, D. E., Bučík, R., Guo, L.-J., & Nitta, N. 2016, Astronomische Nachrichten, 337, 1024
- Karlický (2004) Karlický, M. 2004, A&A, 417, 325
- Karpen et al. (2012) Karpen, J. T., Antiochos, S. K., & DeVore, C. R. 2012, ApJ, 760, 81
- Kliem et al. (2000) Kliem, B., Karlický, M., & Benz, A. O. 2000, A&A, 360, 715
- Ko et al. (2003) Ko, Y.-K., Raymond, J. C., Lin, J., et al. 2003, ApJ, 594, 1068
- Kumar & Cho (2013) Kumar, P., & Cho, K.-S. 2013, A&A, 557, A115
- Lemen et al. (2012) Lemen, J. R., Title, A. M., Akin, D. J., et al. 2012, Sol. Phys., 275, 17
- Li et al. (2015) Li, X., Yang, S., Chen, H., Li, T., & Zhang, J. 2015, ApJ, 814, L13
- Li et al. (2016) Li, L., Zhang, J., Peter, H., et al. 2016, Nature Physics, 12, 847
- Li et al. (2018) Li, T., Yang, S., Zhang, Q., Hou, Y., & Zhang, J. 2018, ApJ, 859, 122
- Lin et al. (2004) Lin, J., Raymond, J. C., & van Ballegooijen, A. A. 2004, ApJ, 602, 422
- Lin et al. (2005) Lin, J., Ko, Y.-K., Sui, L., et al. 2005, ApJ, 622, 1251
- Madjarska (2011) Madjarska, M. S. 2011, A&A, 526, A19
- Madjarska et al. (2012) Madjarska, M. S., Huang, Z., Doyle, J. G., & Subramanian, S. 2012, A&A, 545, A67
- Mei et al. (2012) Mei, Z., Shen, C., Wu, N., et al. 2012, MNRAS, 425, 2824
- Moore et al. (2010) Moore, R. L., Cirtain, J. W., Sterling, A. C., & Falconer, D. A. 2010, ApJ, 720, 757
- Moreno-Insertis et al. (2008) Moreno-Insertis, F., Galsgaard, K., & Ugarte-Urra, I. 2008, ApJ, 673, L211
- Mulay et al. (2017) Mulay, S. M., Zanna, G. D., & Mason, H. 2017a, A&A, 606, A4
- Ni et al. (2010) Ni, L., Germaschewski, K., Huang, Y.-M., et al. 2010, Physics of Plasmas, 17, 052109
- Ni et al. (2012a) Ni, L., Roussev, I. I., Lin, J., & Ziegler, U. 2012, ApJ, 758, 20
- Ni et al. (2012b) Ni, L., Ziegler, U., Huang, Y.-M., Lin, J., & Mei, Z. 2012, Physics of Plasmas, 19, 072902
- Ni et al. (2013) Ni, L., Lin, J., & Murphy, N. A. 2013, Physics of Plasmas, 20, 061206
- Ni et al. (2015) Ni, L., Kliem, B., Lin, J., & Wu, N. 2015, ApJ, 799, 79
- Ni et al. (2016) Ni, L., Lin, J., Roussev, I. I., & Schmieder, B. 2016, ApJ, 832, 195
- Ni et al. (2017) Ni, L., Zhang, Q.-M., Murphy, N. A., & Lin, J. 2017, ApJ, 841, 27
- Ni & Lukin (2018) Ni, L., & Lukin, V. S. 2018, arXiv:1810.09874
- Nishida et al. (2013) Nishida, K., Nishizuka, N., & Shibata, K. 2013, ApJ, 775, L39
- Nishizuka & Shibata (2013) Nishizuka, N., & Shibata, K. 2013, Physical Review Letters, 110, 051101
- Nisticò et al. (2009) Nisticò, G., Bothmer, V., Patsourakos, S., & Zimbardo, G. 2009, Sol. Phys., 259, 87
- Ohyama & Shibata (1998) Ohyama, M., & Shibata, K. 1998, ApJ, 499, 934
- Panesar et al. (2016) Panesar, N. K., Sterling, A. C., Moore, R. L., & Chakrapani, P. 2016, ApJ, 832, L7
- Pariat et al. (2009) Pariat, E., Antiochos, S. K., & DeVore, C. R. 2009, ApJ, 691, 61
- Parker (1983) Parker, E. N. 1983, ApJ, 264, 635
- Pesnell et al. (2012) Pesnell, W. D., Thompson, B. J., & Chamberlin, P. C. 2012, Sol. Phys., 275, 3
- Pontin et al. (2017) Pontin, D. I., Janvier, M., Tiwari, S. K., et al. 2017, ApJ, 837, 108
- Priest & Forbes (2000) Priest, E., & Forbes, T. 2000, Magnetic reconnection : MHD theory and applications / Eric Priest, Terry Forbes. New York : Cambridge University Press, 2000
- Pucci et al. (2013) Pucci, S., Poletto, G., Sterling, A. C., & Romoli, M. 2013, ApJ, 776, 16
- Raouafi et al. (2016) Raouafi, N. E., Patsourakos, S., Pariat, E., et al. 2016, Space Sci. Rev., 201, 1
- Rouppe van der Voort et al. (2017) Rouppe van der Voort, L., De Pontieu, B., Scharmer, G. B., et al. 2017, ApJ, 851, L6
- Seaton et al. (2017) Seaton, D. B., Bartz, A. E., & Darnel, J. M. 2017, ApJ, 835, 139
- Shen et al. (2011) Shen, C., Lin, J., & Murphy, N. A. 2011, ApJ, 737, 14
- Shen et al. (2017) Shen, Y., Liu, Y. D., Su, J., Qu, Z., & Tian, Z. 2017, ApJ, 851, 67
- Shibata et al. (1992) Shibata, K., Ishido, Y., Acton, L. W., et al. 1992, PASJ, 44, L173
- Shibata et al. (1995) Shibata, K., Masuda, S., Shimojo, M., et al. 1995, ApJ, 451, L83
- Shibata & Tanuma (2001) Shibata, K., & Tanuma, S. 2001, Earth, Planets, and Space, 53, 473
- Shimojo et al. (1996) Shimojo, M., Hashimoto, S., Shibata, K., et al. 1996, PASJ, 48, 123
- Shimojo & Shibata (2000) Shimojo, M., & Shibata, K. 2000, ApJ, 542, 1100
- Singh et al. (2012) Singh, K. A. P., Isobe, H., Nishizuka, N., Nishida, K., & Shibata, K. 2012, ApJ, 759, 33
- Sterling et al. (2015) Sterling, A. C., Moore, R. L., Falconer, D. A., & Adams, M. 2015, Nature, 523, 437
- Takasao et al. (2012) Takasao, S., Asai, A., Isobe, H., & Shibata, K. 2012, ApJ, 745, L6
- Thurgood et al. (2017) Thurgood, J. O., Pontin, D. I., & McLaughlin, J. A. 2017, ApJ, 844, 2
- Tian et al. (2014) Tian, H., DeLuca, E. E., Cranmer, S. R., et al. 2014, Science, 346, 1255711
- Tian et al. (2017) Tian, Z., Liu, Y., Shen, Y., et al. 2017, ApJ, 845, 94
- Wyper et al. (2016) Wyper, P. F., DeVore, C. R., Karpen, J. T., & Lynch, B. J. 2016, ApJ, 827, 4
- Wyper et al. (2018) Wyper, P. F., DeVore, C. R., & Antiochos, S. K. 2018, ApJ, 852, 98
- Yang et al. (2013) Yang, L., He, J., Peter, H., et al. 2013, ApJ, 777, 16
- Yokoyama & Shibata (1995) Yokoyama, T., & Shibata, K. 1995, Nature, 375, 42
- Yokoyama & Shibata (1996) Yokoyama, T., & Shibata, K. 1996, PASJ, 48, 353
- Zhang et al. (2012) Zhang, Q. M., Chen, P. F., Guo, Y., Fang, C., & Ding, M. D. 2012, ApJ, 746, 19
- Zhang & Ji (2014a) Zhang, Q. M., & Ji, H. S. 2014a, A&A, 561, A134
- Zhang & Ji (2014b) Zhang, Q. M., & Ji, H. S. 2014b, A&A, 567, A11
- Zhang et al. (2015) Zhang, Q. M., Ning, Z. J., Guo, Y., et al. 2015, ApJ, 805, 4
- Zhang et al. (2016a) Zhang, Q. M., Ji, H. S., & Su, Y. N. 2016a, Sol. Phys., 291, 859
- Zhang et al. (2016b) Zhang, Q. M., Li, D., Ning, Z. J., et al. 2016b, ApJ, 827, 27
- Zhang et al. (2016c) Zhang, Q. M., Li, D., & Ning, Z. J. 2016c, ApJ, 832, 65
- Zhang et al. (2017) Zhang, Q. M., Li, D., & Ning, Z. J. 2017, ApJ, 851, 47
- Zhang & Zhang (2017) Zhang, Y., & Zhang, J. 2017, ApJ, 834, 79
- Zhao et al. (2018) Zhao, T.-L., Ni, L., Lin, J., & Ziegler, U. 2018, Research in Astronomy and Astrophysics, 18, 045
- Zheng et al. (2018) Zheng, R., Chen, Y., Huang, Z., et al. 2018, ApJ, 861, 108
- Zhu et al. (2017) Zhu, X., Wang, H., Cheng, X., & Huang, C. 2017, ApJ, 844, L20