Detecting fractional Chern insulators through circular dichroism
Abstract
Great efforts are currently devoted to the engineering of topological Bloch bands in ultracold atomic gases. Recent achievements in this direction, together with the possibility of tuning inter-particle interactions, suggest that strongly-correlated states reminiscent of fractional quantum Hall (FQH) liquids could soon be generated in these systems. In this experimental framework, where transport measurements are limited, identifying unambiguous signatures of FQH-type states constitutes a challenge on its own. Here, we demonstrate that the fractional nature of the quantized Hall conductance, a fundamental characteristic of FQH states, could be detected in ultracold gases through a circular-dichroic measurement, namely, by monitoring the energy absorbed by the atomic cloud upon a circular drive. We validate this approach by comparing the circular-dichroic signal to the many-body Chern number, and discuss how such measurements could be performed to distinguish FQH-type states from competing states. Our scheme offers a practical tool for the detection of topologically-ordered states in quantum-engineered systems, with potential applications in solid state.
Introduction
Ultracold atomic gases constitute a promising platform for the study of strongly-correlated topological states Cooper (2008); Goldman et al. (2016); Cooper et al. (2018), such as fractional Chern insulators (FCIs) Parameswaran et al. (2013); Bergholtz and Liu (2013). Conceptually, these topological phases could be engineered in optical-lattice experiments, through the implementation of synthetic gauge fields Dalibard et al. (2011); Goldman et al. (2014). While such configurations have been realized Aidelsburger et al. (2011, 2013); Miyake et al. (2013); Struck et al. (2013); Jotzu et al. (2014); Aidelsburger et al. (2015); Kennedy et al. (2015); Wu et al. (2016); Huang et al. (2016); Tai et al. (2017); Fläschner et al. (2018); Tarnowski et al. (2017); Asteria et al. (2018), so far, topological properties have only been identified in the non-interacting regime Aidelsburger et al. (2015); Wu et al. (2016); Fläschner et al. (2018); Tarnowski et al. (2017); Asteria et al. (2018).
In parallel to the development of schemes that would allow for the stabilization of strongly-correlated topological states in cold atoms Cooper (2008); Goldman et al. (2016); Cooper et al. (2018); Cooper and Dalibard (2013); Motruk and Pollmann (2017); Repellin et al. (2017); Reitter et al. (2017); Näger et al. (2018); Boulier et al. (2018); Messer et al. (2018), an open question still remains: Are there unambiguous probes for topological order that are applicable to interacting atomic systems? In the case of FCIs, the fractional nature of the quantized Hall conductance constitutes a striking manifestation of the underlying topological order Yoshioka (2002); Parameswaran et al. (2013); Bergholtz and Liu (2013). However, a direct access to the Hall conductance is challenging in optical-lattice setups; see Ref. Lebrat et al. (2018) for conductance measurements in a one-dimensional optical lattice and Ref. Salerno et al. (2018) for a possible extension to 2D. Alternative probing schemes have been proposed, such as the detection of edge excitations Cazalilla et al. (2005); Liu et al. (2010); Stanescu et al. (2010); Goldman et al. (2012, 2013, 2016); Irsigler et al. (2019) and anyonic statistics Umucallar et al. (2018), adiabatic pumps Taddia et al. (2017); Wang et al. (2018); Račiūnas et al. (2018), and interferometric protocols involving mobile impurities bound to quasiparticles Grusdt et al. (2016).
In this Letter, we demonstrate that the topological order of an atomic FCI could be detected through circular-dichroic measurements, i.e. by monitoring excitation rates upon circular shaking of the underlying 2D optical lattice Tran et al. (2017, 2018); Asteria et al. (2018). Indeed, comparing the excitation rates associated with drives of opposite orientations (), , provides an indirect measurement of the imaginary part of the transverse optical conductivity Tran et al. (2017); Bennett and Stern (1965)
| (1) |
where and are the amplitude and frequency of the circular drive, respectively, and denotes the area of the 2D lattice. Then, combining Eq. (1) with the Kramers-Kronig relations Bennett and Stern (1965); Hu (1989); Souza and Vanderbilt (2008), one obtains a simple relation between the differential integrated rate (DIR), , and the Hall conductance of the probed system Tran et al. (2017, 2018)
| (2) |
When applied to a (non-interacting) Chern insulator Bernevig and Hughes (2013), characterized by the Chern number , Eq. (2) gives rise to a quantization law for the DIR: ; we set the elementary charge to equally treat systems of charged and neutral gases Dalibard et al. (2011); Goldman et al. (2014); Lebrat et al. (2018). This quantized circular dichroism was recently measured in a non-interacting Fermi gas Asteria et al. (2018); see also Refs. Anderson et al. (2017); Brown et al. (2018) for indirect conductivity measurements in topologically-trivial Fermi gases.
The relation in Eq. (2) is universal in that it only relies on the causality of response functions Bennett and Stern (1965); Hu (1989) and time-dependent perturbation theory Bennett and Stern (1965); Tran et al. (2017, 2018). In particular, it applies to (strongly) interacting systems. In the case of a FCI, the Hall conductance is quantized in terms of a many-body Chern number , whose fractional value () is related to topological order Niu et al. (1985). According to Eq. (2), excitation-rate measurements upon shaking could be used as a practical probe for the topological order of atomic FCIs,
| (3) |
Here, we explore the validity and applicability of the relation in Eq. (3) by performing exact-diagonalization studies on a realistic cold-atom model hosting FCI states: the bosonic Harper-Hofstadter model Aidelsburger et al. (2013); Miyake et al. (2013); Aidelsburger et al. (2015); Tai et al. (2017) with strong on-site interactions. By simulating the full time-evolution of this interacting system under the action of a circular drive, we demonstrate that the resulting excitation rates are indeed constrained by the topological order of the underlying phase [Eq. (3)]. Our results indicate that the experimental protocol implemented in Ref. Asteria et al. (2018) constitutes a realistic scheme by which topological order can be identified in strongly-interacting atomic systems.
The circular-dichroic measurement
We consider a generic many-body system described by a Hamiltonian , which is further subjected to a circular drive,
| (4) |
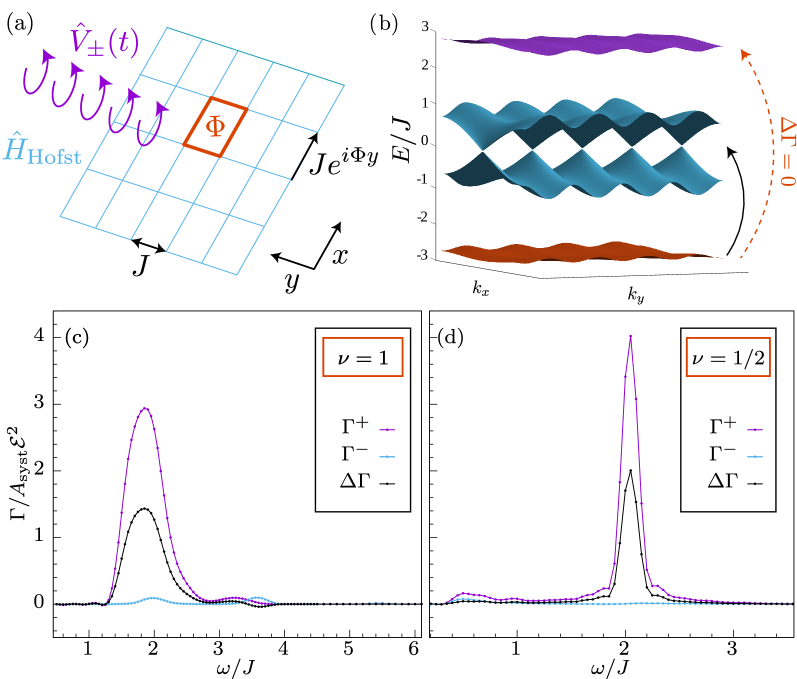
where , and refer to the frequency, amplitude and orientation of the drive, respectively; are position operators. We assume that the system is initially prepared in the ground-state of , with energy , and we analyze the probability of finding the system in an excited state at a given time, , for a given configuration of the drive. The circular-dichroic signal entering Eq. (1) is then obtained by evaluating the excitation rates ; the power absorbed upon driving reads . Figure 1 displays two illustrative spectra , corresponding to a Chern insulator of non-interacting fermions and a FCI of strongly-interacting bosons.
In practice, the extraction of the excitation rates entering Eqs. (1)-(2) can be complicated by finite-size effects, which are intrinsically present in numerical studies; importantly, similar effects could also alter experimental realizations involving small atomic ensembles Tai et al. (2017). In order to appreciate this aspect, let us recall that the results in Eqs. (1)-(2) stem from time-dependent perturbation theory Cohen-Tannoudji et al. (1992); Tran et al. (2017), which expresses the (constant) excitation rates as [henceforth, ]
| (5) |
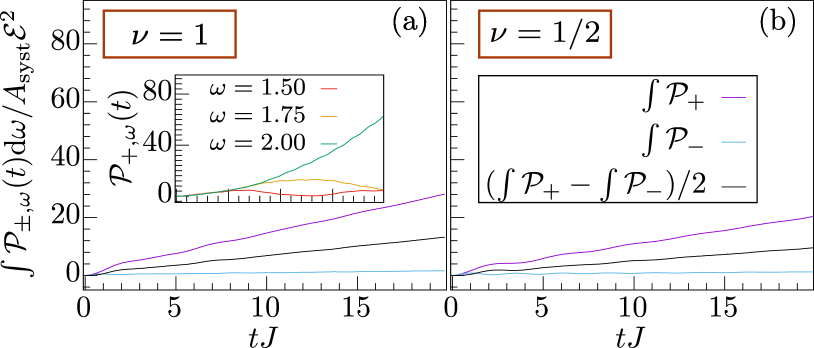
where denotes the excited states with energy . We point out that Eq. (5) relies on two assumptions Cohen-Tannoudji et al. (1992): (a) the rotating-wave approximation is satisfied, ; and (b) the observation time is small compared to the Rabi periods , associated with all possible transitions. For small system sizes, the complete time-evolution associated with Eq. (4) is affected by the discrete nature of the spectrum , which results in residual oscillations in the excitation probability ; see inset of Fig. 2a. This often prevents a precise evaluation of the rates . Since we are ultimately interested in the integrated rates [Eq. (2)], we get rid of these pathological oscillations by integrating over all relevant frequencies. This leads to the quasi-linear behavior shown in Fig. 2, which allows for an efficient evaluation of the DIR, , entering Eqs. (2)-(3).
We now turn to the right-hand side of Eq. (3): the expression for the many-body Chern number . In the single-particle context, the Chern number is defined as the integral of the Berry curvature over the first Brillouin zone Qi and Zhang (2011); Bernevig and Hughes (2013). The many-body counterpart of the Berry curvature can be obtained by considering twisted boundary conditions Niu et al. (1985), with angles , and by considering partial derivatives of the many-body ground-state over these variables: , where is the generalized Berry connection, and where the trace averages over the manifold spanned by the -degenerate many-body ground states . Integrating over the angles yields a quantized number Niu et al. (1985); Hafezi et al. (2007), which traditionally defines the many-body Chern number . Here, we instead consider the nonintegrated many-body Chern number, which is defined as
| (6) |
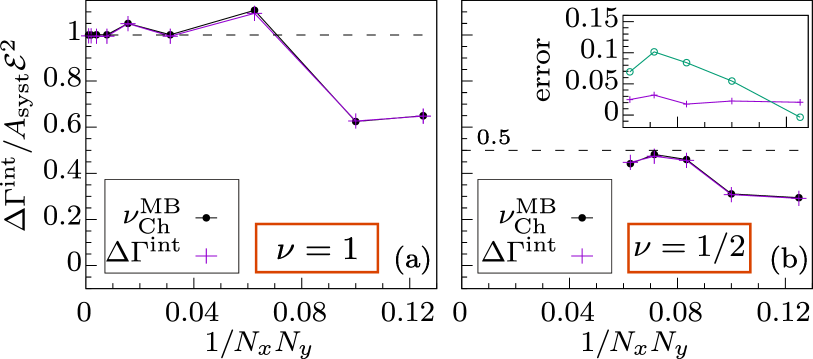
This quantity allows for a faithful evaluation of the Hall conductance entering Eqs. (2)-(3), as can be obtained through the Kubo formula Niu et al. (1985); Kudo et al. (2018); Watanabe2018 . We stress that is not quantized, however it converges towards in the thermodynamic limit Hastings and Michalakis (2015); Koma (2015); Bachmann et al. (2018). As a byproduct of our analysis, we will hereby provide the scaling of with respect to the system size, in the FCI regime.
Microscopic model
We explore the relation in Eq. (3) by studying the bosonic Harper-Hofstadter Hamiltonian,
| (7) |
which describes the hopping of bosons over a square lattice, with tunneling amplitude , in the presence of a flux per plaquette Hofstadter (1976) and on-site interactions . Here, we set the flux , as was recently realized in cold-atom experiments Aidelsburger et al. (2013, 2015); Tai et al. (2017), and impose periodic boundary conditions the exploration of Eq. .
We consider the ground-state properties of this model for a fixed filling fraction , where denotes the total number of particles and is the number of magnetic unit cells. In the present case, where and the Chern number of the lowest band is , we are specifically interested in the filling of bosons in the presence of strong repulsive interactions. For the sake of simplicity and numerical performance, we suppose that the interaction is much larger than the band gap and we include this effect in the form of a hard-core constraint for the bosons. The ground state of this system was found to be a FCI Sorensen et al. (2005); Hafezi et al. (2007); Repellin et al. (2017); He et al. (2017); Motruk and Pollmann (2017), akin to the Laughlin state exhibiting the FQH effect Yoshioka (2002). Its most striking signatures of topological order include a non-trivial (twofold) degeneracy and a fractional many-body Chern number, .
In order to probe the topological nature of the ground state () through circular dichroism [Eq. (3)], we analyze its response to a circular perturbation [Eq. (4)]. This study is performed in a moving frame where the total Hamiltonian in Eq. (4) is translationally invariant, as generated by the operator . Note that the (on-site) interactions in Eq. (7) are not affected by this change of frame. The resulting time-dependent Hamiltonian reads
| (8) | ||||
where the hard-core constraint is henceforth implicit, except otherwise stated.
Numerical results
Our numerical protocol starts with the calculation of the ground state associated with the Hamiltonian in Eq. (7) using exact diagonalization. We subsequently turn on the periodic drive and perform a stroboscopic time-evolution of the system, by repeatedly applying the time-evolution operator associated with Eq. (8) over small time steps. Interacting-boson calculations are performed for various finite-size clusters, made of up to lattice sites (or magnetic unit cells).
As a benchmark, we first apply the protocol to the case of non-interacting fermions at filling , hence forming a Chern insulator Qi and Zhang (2011); Bernevig and Hughes (2013). The circular dichroism of a Chern insulator was previously analyzed based on a two-band model Tran et al. (2017); Asteria et al. (2018). We hereby extend these results to the multi-band Hofstadter model in the first line of Eq. (7), whose energy spectrum is illustrated in Fig. 1b. Figure 1c shows the numerical excitation rates , for a system formed of magnetic unit cells. An intense absorption peak is clearly identified around , which corresponds to excitations to the middle band [Fig. 1b]; this peak is associated with a large dichroic signal . In contrast, transitions to the highest band do not contribute to the differential rate , as can be seen from the absence of any signal above in Fig. 1c. This phenomenon is due to a special symmetry between the lowest and highest bands of the Harper-Hofstadter model Aidelsburger et al. (2015), which is found for any flux ; see see Supplementary Material for details. Using the methods described above, we finely extract the DIR , and compare it to the finite-size Chern number defined in Eq. (6): as shown in Fig. 3a, the dichroic signal perfectly overlaps with , and these quantities both converge towards the quantized value , in perfect agreement with Eq. (2).
We now turn to the case of strongly interacting (hard-core) bosons at filling fraction . The ground state of this system has an (approximate) twofold degeneracy on the torus, which is characteristic of a Laughlin-type FCI at this filling factor. Similarly to the definition of in Eq. (6), we evaluate the dichroic signal by performing an average over the ground-state manifold; we found that the contributions of the two relevant states can be estimated individually, any residual mixing between them contributing negligibly to the dichroic signal. In order to explore the law in Eq. (3), we analyzed the real-time depletion of the ground-state manifold upon the circular drive; we extracted from the quasi-linear curves obtained by integrating the excitation probabilities over [Fig. 2b]. As a central result of our studies, we demonstrate in Fig. 3 that the resulting dichroic signal is in excellent agreement with the finite-size Chern number in Eq. (6), for all system sizes. These results provide good indications that the value will be reached in the thermodynamic limit, as expected for a Laughlin-type FCI.
While excitations are simple inter-band transitions in the non-interacting Chern-insulator case, they may be richer in the FCI due to its intrinsic many-body nature. In this regard, the absorption spectrum in Fig. 1d, which characterizes the FCI and its excitations, delivers interesting insights. In our perturbative framework, the rates in Eq. (5) are associated with single absorption processes, hence, the probed excitations are limited to single-particle excitations of the FCI. This explains the limited range () over which the dichroic signal is observed, which sets a small upper bound for the frequency integration window. The “activation” frequency is predictably close to the many-body gap Repellin et al. (2017, 2014), which corresponds to the minimum of the magneto-roton mode GMP . The response associated with this collective mode, which was identified as a single-particle modulation of Laughlin-type states GMP ; Repellin et al. (2014), appears as a low-frequency peak in the absorption spectrum in Fig. 1d. Besides, the large absorption peak at , which coincides with the main signal of Fig. 1c, suggests the predominance of inter-band transitions in the dichroic signal. To confirm this observation, we have isolated the exact contribution of inter-band transitions to by evaluating the dynamical repopulation of the bands upon circular driving. The results are summarized in the inset of Fig. 3, which shows the relative error to the dichroic signal when restricting its evaluation to inter-band transitions only. For all considered, we find that the inter-band transitions constitute more than of the DIR ( for the smallest system size, ). This finding is of crucial experimental importance, as band repopulations are routinely measured in cold atoms through band-mapping techniques Aidelsburger et al. (2015); Asteria et al. (2018). As a byproduct of our study, we also obtain the transverse optical conductivity of the FCI, by inserting the signal into Eq. (1); see see Supplementary Material .
Phase transition
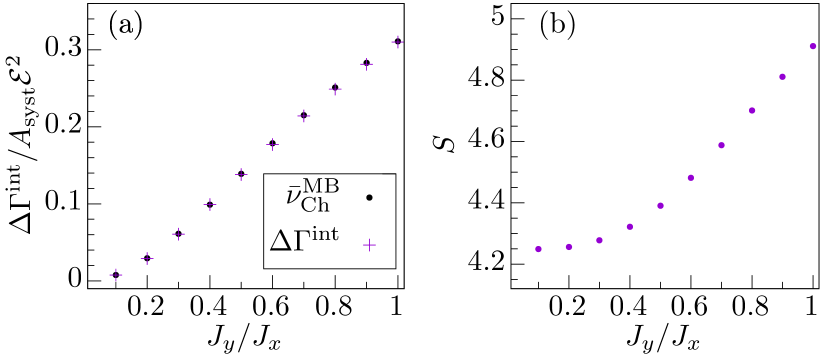
In the thermodynamic limit, the fractional value of the Chern number is an unambiguous signature of topological order Niu et al. (1985). However, the actual values of may significantly differ from the quantized when restricting the analysis to small system sizes [Fig. 3]; this fact could alter the ability of the dichroic signal to distinguish topologically-ordered phases (FCIs) from competing phases in cold-atom experiments based on small atomic ensembles. To address this issue, we analyze the behavior of these observables across a phase transition. We consider a situation where the tunneling amplitudes along the two directions of the lattice, , can be tuned independently from (decoupled Luttinger liquids) to : at small enough ratio , the ground state shares characteristics of a charge density wave (CDW) in the lowest Bloch band (as observed in the “thin-torus” limit of FCIs Budich and Ardonne (2013); Bernevig and Regnault (2012)); this phase transition was proposed as a method to prepare atomic FCIs He et al. (2017). Despite the absence of topological order in the CDW, some of its signatures are similar to those of a FCI, e.g. a twofold degeneracy on the torus due to the spontaneous breaking of discrete translation symmetry. Our results show that the circular-dichroic signal distinguishes the CDW from FCI phases, even for very small systems [Fig. 4a]. These results are compared with entanglement signatures in Fig. 4b, which can also distinguish between these two competing phases Budich and Ardonne (2013); Bernevig and Regnault (2012), but are not directly accessible in experiments we have further studied the entanglement spectrum on either side of the CDW-FCI phase transition .
Concluding remarks
Several schemes have been proposed to generate atomic FCIs Sorensen et al. (2005); Cooper and Dalibard (2013); Yao et al. (2013); Motruk and Pollmann (2017); Repellin et al. (2017); He et al. (2017); Grusdt and Höning (2014). The circular-dichroic probe can be readily applied to any of these cold-atom configurations. Indeed, the protocol described in the previous paragraphs only requires two main ingredients: (a) the implementation of a circular perturbation [Eq. (4)], which can be induced by shaking a 2D optical lattice Struck et al. (2013); Jotzu et al. (2014); Asteria et al. (2018); and (b) a probe for the excitation rates . Since the DIR entering Eqs. (2)-(3) has predominant contributions from inter-band transitions, the related rates can be simply evaluated using band-mapping techniques Asteria et al. (2018). When intra-band transitions are significant, a more sophisticated probe should be considered; e.g. one could exploit pulsed magnetic field gradients Xu et al. (2013); Anderson et al. (2013); Goldman and Dalibard (2014) to generate a circular drive , which simultaneously changes the internal state () of the atoms, hence allowing for a complete read-out of the excited fraction through state-dependent imaging Goldman et al. (2012). In principle, the probe in Eq. (4) could also be considered as an alternative to transport measurements in solid state: there materials would be irradiated by circularly-polarized light Bennett and Stern (1965) and the resulting DIR extracted from optical absorption or photoemission measurements Wang and Gedik (2013); Kim et al. (2016); Schüler and Werner (2017).
Acknowledgements.
Acknowledgments
We acknowledge fruitful discussions with N.R. Cooper, J. Dalibard, M. Dalmonte, F. Grusdt, A. Grushin, G. Jotzu, D.T. Tran, C. Weitenberg and P. Zoller. We also thank A. Sterdyniak and T. Yefsah for an earlier collaboration on a related topic. Work in Brussels is supported by the FRS-FNRS (Belgium) and the ERC Starting Grant TopoCold. C.R. is supported by the Marie Sklodowska-Curie program under EC Grant agreement 751859.
References
- Cooper (2008) N. R. Cooper, Advances in Physics 57, 539 (2008).
- Goldman et al. (2016) N. Goldman, J. C. Budich, and P. Zoller, Nature Physics 12, 639 (2016).
- Cooper et al. (2018) N. R. Cooper, J. Dalibard, and I. B. Spielman, ArXiv e-prints (2018), arXiv:1803.00249 [cond-mat.quant-gas] .
- Parameswaran et al. (2013) S. A. Parameswaran, R. Roy, and S. L. Sondhi, Comptes Rendus Physique 14, 816 (2013).
- Bergholtz and Liu (2013) E. J. Bergholtz and Z. Liu, International Journal of Modern Physics B 27, 1330017 (2013).
- Dalibard et al. (2011) J. Dalibard, F. Gerbier, G. Juzeliūnas, and P. Öhberg, Rev. Mod. Phys. 83, 1523 (2011).
- Goldman et al. (2014) N. Goldman, G. Juzeliūnas, P. Öhberg, and I. B. Spielman, Reports on Progress in Physics 77, 126401 (2014).
- Aidelsburger et al. (2011) M. Aidelsburger, M. Atala, S. Nascimbène, S. Trotzky, Y.-A. Chen, and I. Bloch, Phys. Rev. Lett. 107, 255301 (2011).
- Aidelsburger et al. (2013) M. Aidelsburger, M. Atala, M. Lohse, J. T. Barreiro, B. Paredes, and I. Bloch, Phys. Rev. Lett. 111, 185301 (2013).
- Miyake et al. (2013) H. Miyake, G. A. Siviloglou, C. J. Kennedy, W. C. Burton, and W. Ketterle, Phys. Rev. Lett. 111, 185302 (2013).
- Struck et al. (2013) J. Struck, M. Weinberg, C. Ölschläger, P. Windpassinger, J. Simonet, K. Sengstock, R. Höppner, P. Hauke, A. Eckardt, M. Lewenstein, and L. Mathey, Nature Physics 9, 738 (2013).
- Jotzu et al. (2014) G. Jotzu, M. Messer, R. Desbuquois, M. Lebrat, T. Uehlinger, D. Greif, and T. Esslinger, Nature (London) 515, 237 (2014).
- Aidelsburger et al. (2015) M. Aidelsburger, M. Lohse, C. Schweizer, M. Atala, J. T. Barreiro, S. Nascimbène, N. R. Cooper, I. Bloch, and N. Goldman, Nature Physics 11, 162 (2015).
- Kennedy et al. (2015) C. J. Kennedy, W. C. Burton, W. C. Chung, and W. Ketterle, Nature Physics 11, 859 (2015).
- Wu et al. (2016) Z. Wu, L. Zhang, W. Sun, X.-T. Xu, B.-Z. Wang, S.-C. Ji, Y. Deng, S. Chen, X.-J. Liu, and J.-W. Pan, Science 354, 83 (2016), http://science.sciencemag.org/content/354/6308/83.full.pdf .
- Huang et al. (2016) L. Huang, Z. Meng, P. Wang, P. Peng, S.-L. Zhang, L. Chen, D. Li, Q. Zhou, and J. Zhang, Nature Physics 12, 540 (2016).
- Tai et al. (2017) M. E. Tai, A. Lukin, M. Rispoli, R. Schittko, T. Menke, Dan Borgnia, P. M. Preiss, F. Grusdt, A. M. Kaufman, and M. Greiner, Nature (London) 546, 519 (2017).
- Fläschner et al. (2018) N. Fläschner, D. Vogel, M. Tarnowski, B. S. Rem, D.-S. Lühmann, M. Heyl, J. C. Budich, L. Mathey, K. Sengstock, and C. Weitenberg, Nature Physics 14, 265 (2018).
- Tarnowski et al. (2017) M. Tarnowski, F. Nur Ünal, N. Fläschner, B. S. Rem, A. Eckardt, K. Sengstock, and C. Weitenberg, ArXiv e-prints (2017), arXiv:1709.01046 [cond-mat.quant-gas] .
- Asteria et al. (2018) L. Asteria, D. Thanh Tran, T. Ozawa, M. Tarnowski, B. S. Rem, N. Fläschner, K. Sengstock, N. Goldman, and C. Weitenberg, ArXiv e-prints (2018), arXiv:1805.11077 [cond-mat.quant-gas] .
- Cooper and Dalibard (2013) N. R. Cooper and J. Dalibard, Phys. Rev. Lett. 110, 185301 (2013).
- Motruk and Pollmann (2017) J. Motruk and F. Pollmann, Phys. Rev. B 96, 165107 (2017).
- Repellin et al. (2017) C. Repellin, T. Yefsah, and A. Sterdyniak, Phys. Rev. B 96, 161111 (2017).
- Reitter et al. (2017) M. Reitter, J. Näger, K. Wintersperger, C. Sträter, I. Bloch, A. Eckardt, and U. Schneider, Phys. Rev. Lett. 119, 200402 (2017).
- Näger et al. (2018) J. Näger, K. Wintersperger, M. Bukov, S. Lellouch, E. Demler, U. Schneider, I. Bloch, N. Goldman, and M. Aidelsburger, ArXiv e-prints (2018), arXiv:1808.07462 [cond-mat.quant-gas] .
- Boulier et al. (2018) T. Boulier, J. Maslek, M. Bukov, C. Bracamontes, E. Magnan, S. Lellouch, E. Demler, N. Goldman, and J. V. Porto, ArXiv e-prints (2018), arXiv:1808.07637 [quant-ph] .
- Messer et al. (2018) M. Messer, K. Sandholzer, F. Görg, J. Minguzzi, R. Desbuquois, and T. Esslinger, Phys. Rev. Lett. 121, 233603 (2018).
- Yoshioka (2002) D. Yoshioka, The Quantum Hall Effect, 1st ed., Vol. 133 (Springer-Verlag Berlin, 2002).
- Lebrat et al. (2018) M. Lebrat, P. Grišins, D. Husmann, S. Häusler, L. Corman, T. Giamarchi, J.-P. Brantut, and T. Esslinger, Phys. Rev. X 8, 011053 (2018).
- Salerno et al. (2018) G. Salerno, H. M. Price, M. Lebrat, S. Häusler, T. Esslinger, L. Corman, J.-P. Brantut, and N. Goldman, ArXiv e-prints (2018), arXiv:1811.00963 [cond-mat.mes-hall] .
- Cazalilla et al. (2005) M. A. Cazalilla, N. Barberán, and N. R. Cooper, Phys. Rev. B 71, 121303 (2005).
- Liu et al. (2010) X.-J. Liu, X. Liu, C. Wu, and J. Sinova, Phys. Rev. A 81, 033622 (2010).
- Stanescu et al. (2010) T. D. Stanescu, V. Galitski, and S. Das Sarma, Phys. Rev. A 82, 013608 (2010).
- Goldman et al. (2012) N. Goldman, J. Beugnon, and F. Gerbier, Phys. Rev. Lett. 108, 255303 (2012).
- Goldman et al. (2013) N. Goldman, J. Dalibard, A. Dauphin, F. Gerbier, M. Lewenstein, P. Zoller, and I. B. Spielman, Proceedings of the National Academy of Science 110, 6736 (2013).
- Goldman et al. (2016) N. Goldman, G. Jotzu, M. Messer, F. Görg, R. Desbuquois, and T. Esslinger, Phys. Rev. A 94, 043611 (2016).
- Irsigler et al. (2019) B. Irsigler, J.-H. Zheng, and W. Hofstetter, Phys. Rev. Lett. 122, 010406 (2019).
- Umucallar et al. (2018) R. Umucallar, E. Macaluso, T. Comparin, and I. Carusotto, Physical Review Letters 120, 230403 (2018).
- Taddia et al. (2017) L. Taddia, E. Cornfeld, D. Rossini, L. Mazza, E. Sela, and R. Fazio, Phys. Rev. Lett. 118, 230402 (2017).
- Wang et al. (2018) B. Wang, F. N. Ünal, and A. Eckardt, Phys. Rev. Lett. 120, 243602 (2018).
- Račiūnas et al. (2018) M. Račiūnas, F. N. Ünal, E. Anisimovas, and A. Eckardt, Phys. Rev. A 98, 063621 (2018).
- Grusdt et al. (2016) F. Grusdt, N. Y. Yao, D. Abanin, M. Fleischhauer, and E. Demler, Nature Communications 7, 11994 (2016).
- Tran et al. (2017) D. T. Tran, A. Dauphin, A. G. Grushin, P. Zoller, and N. Goldman, Science Advances 3, e1701207 (2017).
- Tran et al. (2018) D. T. Tran, N. R. Cooper, and N. Goldman, Phys. Rev. A 97, 061602 (2018).
- Bennett and Stern (1965) H. S. Bennett and E. A. Stern, Phys. Rev. 137, A448 (1965).
- Hu (1989) B. Y. Hu, American Journal of Physics 57, 821 (1989).
- Souza and Vanderbilt (2008) I. Souza and D. Vanderbilt, Phys. Rev. B 77, 054438 (2008).
- Bernevig and Hughes (2013) B. A. Bernevig and T. L. Hughes, Topological insulators and topological superconductors (Princeton university press, 2013).
- Anderson et al. (2017) R. Anderson, F. Wang, P. Xu, V. Venu, S. Trotzky, F. Chevy, and J. H. Thywissen, ArXiv e-prints (2017), arXiv:1712.09965 [cond-mat.quant-gas] .
- Brown et al. (2018) P. T. Brown, D. Mitra, E. Guardado-Sanchez, R. Nourafkan, A. Reymbaut, C.-D. Hébert, S. Bergeron, A.-M. S. Tremblay, J. Kokalj, D. A. Huse, P. Schauß, and W. S. Bakr, Science (2018) .
- Niu et al. (1985) Q. Niu, D. J. Thouless, and Y.-S. Wu, Phys. Rev. B 31, 3372 (1985).
- Cohen-Tannoudji et al. (1992) C. Cohen-Tannoudji, J. Dupont-Roc, and G. Grynberg, Atom-Photon Interactions: Basic Processes and Applications (Wiley, 1992).
- Qi and Zhang (2011) X.-L. Qi and S.-C. Zhang, Reviews of Modern Physics 83, 1057 (2011).
- Hafezi et al. (2007) M. Hafezi, A. S. Sørensen, E. Demler, and M. D. Lukin, Phys. Rev. A 76, 023613 (2007).
- Kudo et al. (2018) K. Kudo, H. Watanabe, T. Kariyado, and Y. Hatsugai, arXiv preprint arXiv:1808.10248 (2018).
- (56) H. Watanabe, Phys. Rev. B 98, 155137 (2018).
- Hastings and Michalakis (2015) M. B. Hastings and S. Michalakis, Communications in Mathematical Physics 334, 433 (2015).
- Koma (2015) T. Koma, ArXiv e-prints (2015), arXiv:1504.01243 [math-ph] .
- Bachmann et al. (2018) S. Bachmann, A. Bols, W. De Roeck, and M. Fraas, Annales Henri Poincaré 19, 695 (2018).
- Hofstadter (1976) D. R. Hofstadter, Physical review B 14, 2239 (1976).
- (61) The exploration of Eq. 2 in realistic systems with boundaries requires the annihilation of bulk-to-edge transitions upon the drive Tran et al. (2017, 2018). Such a bulk-edge separation, which is naturally present in harmonically-trapped gases forming an insulating state GoldmanEPJTS , can also be enhanced by releasing the cloud before performing the dichroic measurement Tran et al. (2017) .
- (62) N. Goldman, J. Beugnon, and F. Gerbier, Eur. Phys. J. Special Topics 217, 135 (2013).
- Sorensen et al. (2005) A. S. Sorensen, E. Demler, and M. D. Lukin, Phys. Rev. Lett. 94, 086803 (2005).
- He et al. (2017) Y.-C. He, F. Grusdt, A. Kaufman, M. Greiner, and A. Vishwanath, Phys. Rev. B 96, 201103 (2017).
- (65) see Supplementary Material, for more details on the chiral symmetry of the Harper-Hofstadter model, and on the transverse optical conductivity of the fractional Chern insulator at .
- Repellin et al. (2014) C. Repellin, T. Neupert, Z. Papić, and N. Regnault, Phys. Rev. B 90, 045114 (2014).
- (67) S. M. Girvin, A. H. MacDonald, and P. M. Platzman, Phys. Rev. Lett. 54, 581 (1985).
- Budich and Ardonne (2013) J. C. Budich and E. Ardonne, Phys. Rev. B 88, 035139 (2013).
- Bernevig and Regnault (2012) B. A. Bernevig and N. Regnault, ArXiv e-prints (2012), arXiv:1204.5682 [cond-mat.str-el] .
- (70) We have further studied the entanglement spectrum on either side of the CDW-FCI phase transition, and we have verified that it has the features expected for these respective two phases. The variation of the entanglement entropy across the phase transition [Fig.4b] reflects these characteristic features .
- Yao et al. (2013) N. Y. Yao, A. V. Gorshkov, C. R. Laumann, A. M. Läuchli, J. Ye, and M. D. Lukin, Physical review letters 110, 185302 (2013).
- Grusdt and Höning (2014) F. Grusdt and M. Höning, Physical Review A 90, 053623 (2014).
- Xu et al. (2013) Z.-F. Xu, L. You, and M. Ueda, Physical Review A 87, 063634 (2013).
- Anderson et al. (2013) B. M. Anderson, I. B. Spielman, and G. Juzeliūnas, Physical review letters 111, 125301 (2013).
- Goldman and Dalibard (2014) N. Goldman and J. Dalibard, Physical review X 4, 031027 (2014).
- Wang and Gedik (2013) Y. Wang and N. Gedik, physica status solidi (RRL)–Rapid Research Letters 7, 64 (2013).
- Kim et al. (2016) C.-J. Kim, A. Sánchez-Castillo, Z. Ziegler, Y. Ogawa, C. Noguez, and J. Park, Nature nanotechnology 11, 520 (2016).
- Schüler and Werner (2017) M. Schüler and P. Werner, Physical Review B 96, 155122 (2017).
- Kohmoto (1989) M. Kohmoto, Physical Review B 39, 11943 (1989).
- Xiao et al. (2010) D. Xiao, M.-C. Chang, and Q. Niu, Reviews of modern physics 82, 1959 (2010).
- Morimoto et al. (2009a) T. Morimoto, Y. Hatsugai, and H. Aoki, Physical review letters 103, 116803 (2009a).
- Morimoto et al. (2009b) T. Morimoto, Y. Hatsugai, and H. Aoki, in Journal of Physics: Conference Series, Vol. 150 (IOP Publishing, 2009) p. 022060.
Supplementary material
.1 Chiral symmetry and circular dichroism
in Hofstadter bands
Analyzing the circular dichroism of the non-interacting Harper-Hofstadter model led to a surprising result: As observed in Fig.1c (main text), the dichroic signal only involves transitions from the lowest to the middle bands; in other words, the highest band of the model [Fig.1b; main text] does not contribute to this circular dichroic effect. In fact, this property is due to a special (chiral) symmetry that relates the lowest and highest bands of the Harper-Hofstadter model, and which is present for any value of the flux . It is the aim of this Appendix to provide the detailed proof of this assertion.
We start by briefly reviewing the chiral symmetry inherent to the Harper-Hofstadter model and we discuss how it affects the Berry curvature in the lowest band. In this Appendix, we consider the Harper-Hofstadter model with a generic flux , where are relative primes. The corresponding single-particle Hamiltonian can be written as [79]
where we considered both the real-space and momentum-space representations. Here the state represents an orbital localized at lattice site of the square lattice, whereas denote the momenta. Diagonalizing this Hamiltonian yields Bloch bands [60]; we will denote the corresponding eigenstates as and eigenvalues as , where is the band index.
.1.1 Chiral symmetry in the Hofstadter model
To highlight the aforementioned chiral symmetry, we introduce a “checkerboard” bipartition of the square lattice, such that the neighbors of all sites are sites and vice versa, and we define the following operator
| (9) |
where and project onto the and sites, respectively. One readily verifies that the Harper-Hofstadter Hamiltonian anticommutes with , , which leads to the “particle-hole” symmetry of the whole spectrum: Any eigenstate of with energy has a partner eigenstate with energy .
In order to make this statement more specific, in particular, with respect to the quasi-momentum of the eigenstates, let us examine the commutation relations involving and the magnetic-translation operators along the and directions, which we denote , respectively. If the magnetic unit cell comprises an even number of lattice sites ( even), the action of leaves the bipartition unchanged, such that . Conversely, if is odd, exchanges the positions of and , such that , however, the operators satisfy . Then, the following symmetry property between the wave functions of the highest () and lowest () bands follows
| (10) | ||||
| (11) |
where corresponds to a shift of momentum along the and directions [Eq. (9)]; an alternative demonstration of this result is provided in the Supplementary Information of Ref. [13].
.1.2 Chiral symmetry and the Berry curvature
We now analyze how these symmetries affect the Berry curvature in the lowest band (). By definition, the latter can be expressed as a sum of contributions from all the other bands [80]
| (12) |
Let us first consider the case where is even (as in the main text, where ). In this case, the contribution of the highest band () to the Berry curvature in Eq. (12) reads
| (13) |
where we first used the symmetry property in Eq. (10), and then the fact that the diagonal matrix elements of any skew-hermitian operator are purely imaginary (we note that the product is skew-hermitian since ). Consequently, in the Harper-Hofstadter model with even, the highest band never contributes to the local Berry curvature of the lowest band.
In the case where is odd, we find a less restrictive condition
| (14) |
which can be obtained by observing that the matrix elements and energies entering Eq. (12) satisfy
| (15) | |||
| (16) |
We point out that the relations in Eqs. (15)-(16) result from the chiral symmetry discussed in the previous paragraph. From Eqs. (13)-(14), we deduce that the highest band never contributes to the integrated Berry curvature (Chern number) of the lowest band, for any value of the flux ( odd or even).
.1.3 Circular dichroism in Hofstadter bands
These observations have a striking impact on the circular dichroism of a Chern insulator that is prepared in the lowest band of the Harper-Hofstadter model. To see this, we recall how the dichroic signal relates to the Berry curvature. Considering a completely filled lowest band, the dichroic signal can be expressed as [43]
| (17) |
where the function is defined in the main text [Eq. (5)]. In the long-time limit [52], is replaced by a delta distribution and the (constant) dichroic signal reads
where we introduced the quantity defined in Eq. (12), and then used the result obtained in Eqs. (13)-(14) together with the symmetry in Eq. (16).
This demonstrates that the dichroic signal has no contribution from the higher band, for any value of the flux. Specifically, this explains the absence of signal in Fig.1c (main text) in the frequency regime .
We point out that the results derived in this Appendix entirely rely on the sublattice (chiral) symmetry of the model [Eq. (9)], and hence, they remain valid for any lattice model that satisfies a similar property.
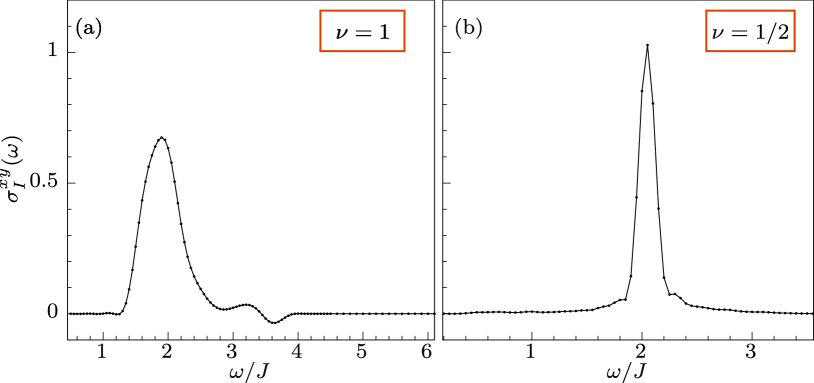
.2 Transverse optical conductivity of a fractional Chern insulator
In the main text, we have emphasized the significance of the integrated dichroic signal , as a probe for topological order in strongly-correlated matter. However, the dependency of the dichroic signal on the drive frequency is also of interest: it is proportional to the imaginary part of the antisymmetric optical conductivity [43, 45, 47]
| (18) |
In Fig. 5, we show the optical conductivity associated with the Chern insulator () and the fractional Chern insulator () realized in our model. We note that these results complement studies of the optical conductivity in the integer quantum Hall effect [81, 82]. Interestingly, the plot presented in Fig. 5b shows that the optical conductivity of the FCI is strongly peaked around the frequency , which indicates that this transport coefficient has dominant contributions from inter-band transitions; see also the main text for a similar analysis of the DIR .