77email: federica.savini@hs.uni-hamburg.de
A LOFAR study of non-merging massive galaxy clusters
Centrally located diffuse radio emission has been observed in both merging and non-merging galaxy clusters. Depending on their morphology and size, we distinguish between giant radio haloes, which occur predominantly in merging clusters, and mini haloes, which are found in non-merging, cool-core clusters. In recent years, cluster-scale radio emission has also been observed in clusters with no sign of major mergers, showing that our knowledge of the mechanisms that lead to particle acceleration in the intra-cluster medium (ICM) is still incomplete. Low-frequency sensitive observations are required to assess whether the emission discovered in these few cases is common in galaxy clusters or not. With this aim, we carried out a campaign of observations with the LOw Frequency ARay (LOFAR) in the frequency range 120 - 168 MHz of nine massive clusters selected from the Planck SZ catalogue, which had no sign of major mergers. In this paper, we discuss the results of the observations that have led to the largest cluster sample studied within the LOFAR Two-metre Sky Survey, and we present Chandra X-ray data used to investigate the dynamical state of the clusters, verifying that the clusters are currently not undergoing major mergers, and to search for traces of minor or off-axis mergers. We discover large-scale steep-spectrum emission around mini haloes in the cool-core clusters PSZ1G139.61+24 and RXJ1720.1+2638, which is not observed around the mini halo in the non-cool-core cluster A1413. We also discover a new 570 kpc-halo in the non-cool-core cluster RXCJ0142.0+2131. We derived new upper limits to the radio power for clusters in which no diffuse radio emission was found, and we discuss the implication of our results to constrain the cosmic-ray energy budget in the ICM. We conclude that radio emission in non-merging massive clusters is not common at the sensitivity level reached by our observations and that no clear connection with the cluster dynamical state is observed. Our results might indicate that the sloshing of a dense cool core could trigger particle acceleration on larger scales and generate steep-spectrum radio emission.
Key Words.:
Galaxy clusters - low radio frequency1 Introduction
Diffuse radio emission in galaxy clusters is caused by relativistic electrons that emit synchrotron radiation in the intra-cluster magnetic field (see Feretti et al. 2012 and references therein).
This emission has a low surface brightness ( 0.1 - 1 Jy arcsec-2 at 1.4 GHz) and, depending on its morphology, location, and size (hundreds of kpc up to few Mpc), it is classified as radio relic, radio halo, or mini halo. In this paper, we are only concerned with radio haloes and mini haloes, which are sources that are located at the centres of galaxy clusters. Both type of sources are commonly characterised by a steep radio spectrum with a spectral index of 111The spectrum is defined by . .
Giant radio haloes ( Mpc-scale) have predominantly been found in merging clusters (e.g. Buote 2001, Cassano et al. 2010, Cuciti et al. 2015) that typically do not have a cool core, i.e. a core characterised by a peaked X-ray surface brightness, high gas density, and significant drop in temperature within the inner kpc. Haloes indicate the presence of a cluster-wide particle acceleration mechanism, such as in situ re-acceleration (see Brunetti & Jones 2014 for a review).
Mini haloes ( 500 kpc-scale) are detected in cool-core clusters that have not been disrupted or disturbed by major mergers. Often, the brightest cluster galaxy (BCG) resides at the centre of the mini halo and, when the BCG is radio loud, its radio lobes are embedded in the mini halo. The origin of the relativistic cosmic-ray electrons (CRe) of mini haloes is still unclear. The main contending theories are either leptonic (re-acceleration) models and hadronic models. Leptonic models involve the re-acceleration of a lower energy population of CRe by turbulent motions in the intra-cluster medium (ICM; (Gitti et al. 2002)). The turbulence can be caused by the sloshing of the low-entropy gas falling inside the dark matter potential well of the cluster. The sloshing can be instigated, for example, by a minor merger with a lower mass galaxy cluster or group. When the gas meets the higher entropy ICM, a cold front, i.e. a discontinuity in the X-ray emissivity, is formed (ZuHone et al. 2013). Hadronic models involve the injection of secondary electrons produced continuously by inelastic collisions of relativistic cosmic-ray protons (CRp) with the cluster thermal proton population (Pfrommer & Enßlin 2004). The CRp are expected to be present in the ICM, therefore some level of synchrotron emission from secondary electrons is expected in galaxy clusters, especially in non-merging clusters with a dense cool core, where the rate of hadronic interactions should be the highest.
| Name | RA | DEC | LoTSS obs. | LoTSS obs. | Radio flux | Chandra obs. | Chandra clean |
|---|---|---|---|---|---|---|---|
| (h m s, J2000) | (∘ ′ ′′, J2000) | ID | date | calibrator | ID | exp. time (ks) | |
| RXCJ0142.0+2131 | 01 42 02.6 | +21 31 19.0 | LC9_011 (P) | 21-02-18 | 3C196 | 10440 | 19.9 |
| A478 | 04 13 20.7 | +10 28 35.0 | LC8_006 (P) | 7/21-11-17 | 3C196 | 1669, 602, 6928 | 139.3 |
| 6929, 7217, 7128 | |||||||
| 7222, 7231, 7232 | |||||||
| 7233, 7234, 7235 | |||||||
| PSZ1G139.61+24 | 06 22 04.6 | +74 40 51.6 | LC8_022 | 27-07-17 | 3C295 | 15139, 15297 | 23.1 |
| A1413 | 11 55 18.9 | +23 24 31.0 | LC9_020 (P) | 25-01-18 | 3C295 | 537, 1661, 5002 | 127.8 |
| 5003, 7696 | |||||||
| A1423 | 11 57 22.5 | +33 39 18.0 | LC8_022 | 21-09-17 | 3C196 | 528, 11724 | 33.3 |
| A1576 | 12 37 59.0 | +63 11 26.0 | LT5_007 | 04-04-16 | 3C196 | 7938, 15127 | 28.5 |
| RXJ1720.1+2638 | 17 20 10.1 | +26 37 29.5 | LC7_004 (P) | 25-01-17 | 3C295 | 1453, 3224, 4361 | 42.3 |
| A2261 | 17 22 27.1 | +32 08 02.0 | LC6_015 | 27-07-17 | 3C295 | 550, 5007 | 30.6 |
| A2390 | 21 53 34.6 | +17 40 11.0 | LC9_030 | 18-12-17 | 3C196 | 500, 501, 4193 | 99.1 |
| Name | Scale | X-ray | Radio | Telescope & frequency | Ref. | |||
|---|---|---|---|---|---|---|---|---|
| (kpc/′′) | () | (keV cm2) | ||||||
| RXCJ0142.0+2131 | 0.280 | 4.28 | 6.07 | 131 | nCC | UL | GMRT: 235/610 MHz | 1 |
| A478 | 0.088 | 1.66 | 7.06 | 8 | CC | MH | VLA: 1.4 GHz | 2 |
| PSZ1G139.61+24 | 0.270 | 4.17 | 7.09 | 10 | CC | cMH | GMRT: 610 MHz | 3 |
| A1413 | 0.143 | 2.53 | 5.98 | 64 | nCC | cMH | VLA: 1.4 GHz | 4 |
| A1423 | 0.214 | 3.50 | 6.09 | 27 | CC | UL | GMRT: 610 MHz | 5 |
| A1576 | 0.302 | 4.51 | 5.98 | 186 | nCC | UL | GMRT: 610 MHz | 1 |
| RXJ1720.1+2638 | 0.164 | 2.84 | 6.34 | 21 | CC | MH | GMRT: 317/617 MHz, 1.28 GHz | 6 |
| VLA: 1.5, 4.9, 8.4 GHz | 6 | |||||||
| A2261 | 0.224 | 3.63 | 7.39 | 61 | nCC | H | VLA: 1.4 GHz | 7 |
| A2390 | 0.234 | 3.75 | 9.48 | 15 | CC | H | VLA: 1.4 GHz | 7 |
Recent observations with the Giant Metrewave Radio Telescope (GMRT) and the Very Large Array (VLA) have revealed the presence of radio haloes in a few clusters that are not undergoing major mergers, and that - in some cases - host a cool core (i.e. CL1821+643, Bonafede et al. 2014; A2261, A2390, Sommer et al. 2017; A2142, Venturi et al. 2017), challenging the notion that radio haloes only form in major mergers. It has been proposed that these sources might be connected to the occurrence of minor/off-axis mergers, although it remains unclear how minor mergers could initiate continuum emission on megaparsec scales. Models (e.g. Cassano et al. 2006) predict that minor mergers can generate ultra-steep spectrum (USS) emission () due to the smaller amount of energy available compared to major mergers. However, flatter spectrum sources such as that in CL1821+643, where -1.1, are difficult to explain in this scenario. Finally, we note that signatures of minor-merging activities and gas-sloshing mechanisms have been detected in clusters containing mini haloes (e.g. Gitti et al. 2007; Giacintucci et al. 2014a, Savini et al. 2018a). To assess whether the emission discovered in these few cases is common in galaxy clusters or not if looking at low radio frequencies, we selected and studied a sample of nine non-merging galaxy clusters. The observations were carried out with the LOw Frequency ARray (LOFAR; van Haarlem et al. 2013) with the aim of studying large-scale radio emission to shed light on the non-thermal phenomena in galaxy clusters and the connection with cluster dynamics. Sensitive low-frequency observations allow us to detect steep-spectrum emission that cannot be observed at higher frequencies and are fundamental in the case of slightly disturbed clusters.
In case of the non-detection of large-scale diffuse sources, we provide new upper limits on the radio power of haloes. These constraints demonstrate the importance of low-frequency observations to determine the cosmic-ray pressure and energy budget in clusters.
In this paper, we assume a flat, CDM cosmology with matter density and Hubble constant km s-1 Mpc-1 (Planck Collaboration et al. 2016). All our images are in the J2000 coordinate system.
2 The sample
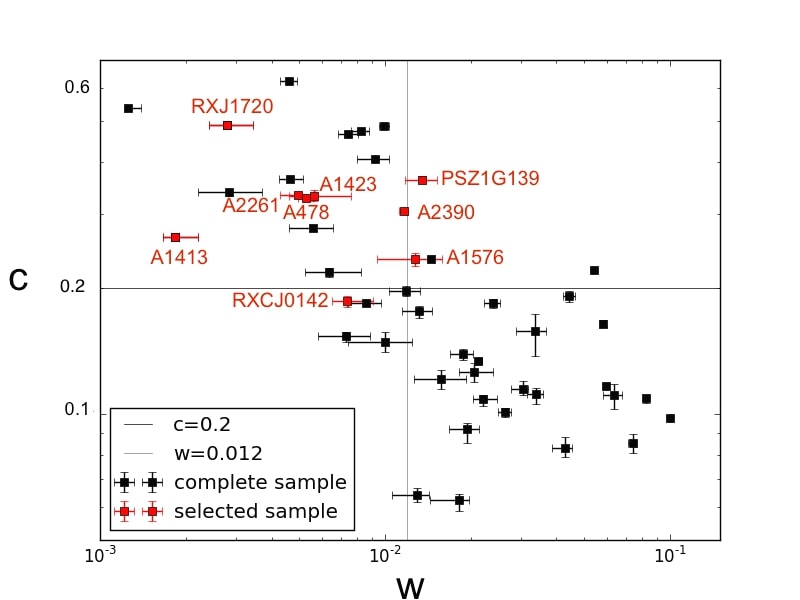
In order to investigate the presence of diffuse emission in non-merging systems at low radio frequencies, we selected a sample of galaxy clusters (listed in Tab. 1) on the basis of their cluster-scale X-ray morphology and lack of evidence of a recent major merger. Cuciti et al. (2015) and Cassano et al. (2016) studied a sample of clusters selected from the Planck Sunyaev–Zel’dovich catalogue (PSZ; Planck Collaboration et al. 2014) with a mass of in the redshift range222 The sample in Cuciti et al. (2015) consists of clusters with available radio and X-ray data. The sample in Cassano et al. (2016), although covering a smaller range in redshift, also includes clusters with available X-ray data but without radio observations. In total, a completeness in mass greater than 80% is achieved. and , respectively. For this study, we selected the clusters whose dynamical status has been classified as non-merging from Chandra X-ray observations. In particular, we focus on two morphological indicators: the concentration parameter and centroid shift, which have been shown to be the most sensitive to the cluster dynamical state Lovisari et al. (2017), We briefly describe these two parameters, as follows:
-
•
the concentration parameter, , is defined as the ratio of the X-ray surface brightness within 100 kpc over the X-ray surface brightness within 500 kpc. It helps to select clusters with a compact core, i.e. clusters whose core has not been disrupted by a merger (Santos et al. 2008),
(1) -
•
and the emission centroid shift, , defined as the standard deviation of the projected separation between the peak and the cluster X-ray centroid computed within N circles of increasing radius R (e.g. Böhringer et al. 2010),
(2)
High values of indicate a dynamically disturbed system, while high values of indicate a peaked core that is typical of non-merging systems. We selected the clusters labelled as “relaxed” in Cassano et al. (2016) and Cuciti et al. (2015). In addition, we added the constraint that clusters must be easily observed with LOFAR, i.e. with declination greater than . The selected clusters, which are shown as red symbols in Fig. 1 (together with the clusters belonging to the complete sample), lie in the top left region of the plot (non-merging clusters). We note that many of these clusters lie near the merging/non-merging boundary (defined with the values and in Cassano et al. (2010), where is derived at 500 kpc.). These clusters are more likely to be slightly disturbed systems, thus through their observations we can search for low-frequency steep-spectrum emission powered by minor/off-axis mergers.
3 Data reduction
3.1 Radio: LOFAR observations
Five of the targets were observed as part of the deep imaging survey LoTSS (LOFAR Two-metre Sky Survey; Shimwell et al. 2017). The remaining four were observed as part of dedicated proposals (LC7_004, LC8_006, LC9_011, LC9_020), adopting the LoTSS observing set-up 333We note that the clusters observed for the proposals lie at the centre of the pointings and the clusters observed within LoTSS lie at a maximum distance from the phase centre of the pointing of , where the primary beam response is . This allows us to reach a consistent sensitivity to diffuse emission for the whole sample.. The observations were carried out at 120 - 168 MHz using the high band antenna (HBA) with a total on-source time of 8 h preceded and followed by a flux density calibrator observation for 10 minutes. More details can be found in Tab. 1. The calibration and imaging procedure is based on the facet calibration scheme presented in van Weeren et al. (2016b). A complete outline of the procedure can be found in Savini et al. (2018b). The main steps are as follows:
-
•
Preliminary pre-processing, which was performed by the Radio Observatory (ASTRON) and has been applied to the data
-
•
Direction-independent calibration, which was obtained by executing the Prefactor pipeline444https://github.com/lofar-astron/prefactor, following the strategy outlined in De Gasperin et al. (2018)
-
•
Direction-dependent calibration using the FACTOR pipeline555https://github.com/lofar-astron/factor
Each field of view was divided into a discrete number of facets that are separately calibrated. The calibrator for each facet was selected with a minimum flux density specified by the user in a range between 0.3 Jy and 0.6 Jy. The facets are usually processed in order of calibrator flux density, before processing those bordering the cluster facet. The cluster facet is the last to be processed, so that it could benefit from the calibration of the preceding facets. The facet images are stitched together to form a mosaic and the mosaicked final image is corrected for the primary beam. In line with other LOFAR HBA studies, we adopted a systematic calibration error of on all the measured flux densities (Shimwell et al. 2016, van Weeren et al. 2016a, Savini et al. 2018b). Radio imaging was performed through the WSClean package (Offringa et al. 2014) implemented in FACTOR, varying the robust values of the Briggs weighting (Briggs 1995) and uv-taper to obtain different resolutions and increase the sensitivity to diffuse emission. To obtain specific images, such as spectral index maps, compact-source-subtracted images, and halo-injected images, we used the Common Astronomy Software Applications (CASA, version 4.5.2; McMullin et al. 2007) with the multi-scale option of the clean task and took the w-projection parameter into account.
3.2 Radio: GMRT observation
We processed archival GMRT observations at 610 MHz of the clusters A478 and RXJ1720.1+2638 using the Source Peeling and Atmospheric Modeling (SPAM) pipeline (see Intema et al. 2017 for details) to perform a detailed spectral analysis with the LOFAR observations. A478 and RXJ1720.1+2638 were observed, respectively, on October 10, 2011 (under project code 21_017) and July 24, 2011 (under project code 11MOA01). Visibilities at 610 MHz were recorded in one polarisation (RR) over a bandwidth of 32 MHz, as part of a dual-frequency observation. The on-source time was 3.4 h for A478 and 5.2 h for RXJ1720.1+2638. The primary calibrator used for flux and bandpass calibrations in both observations was 3C 48. We adopted the same flux standard as for LOFAR (Scaife & Heald 2012). A gain correction of for A478 and for RXJ1720.1+2638 was derived using the all-sky map at 408 MHz by Haslam et al. (1995); this gain correction was subsequently applied. The pipeline removed of the data of A478 due to Radio Frequency Interferences (RFI) and various telescope issues and the pipline removed for RXJ1720.1+2638. The pipeline output visibilities were imported into CASA for final imaging, using the multi-scale option of the clean task. Our highest fidelity images reach a sensitivity of Jy beam-1 with a beam and Jy beam-1 with a beam, for A478 and RXJ1720.1+2638 respectively. We adopted a 10% scale error on all flux density measurements (Chandra et al. 2004).
3.3 X-ray: Chandra observation
To investigate the connection between the thermal and non-thermal components in the ICM, we reprocessed Chandra X-ray observations for each cluster in the sample. The ID and clean exposure time of each observation can be found in Tab. 1. We carried out a standard data reduction using CIAO v4.9 and Chandra CALDB v4.7.3 to produce the exposure-corrected images in the keV band shown in the paper (see Botteon et al. (2017) for the procedure outline).
The Chandra X-ray density and temperature profiles of the clusters we selected were already obtained and combined by Giacintucci et al. (2017) to derive the specific entropy at the cluster centre, . We used the values of for the clusters in our sample to distinguish between cool-core or non-cool-core clusters following Giacintucci et al. (2017): clusters with low central entropies ( keV cm2) are expected to host a cool core. The values relevant for our sample are reported in Tab. 2, where we specify whether the clusters host a cool core or not, according to the above classification.
4 Results
In the following, each cluster is described in a separate subsection. The information from the literature is summarised in Tab. 2, while the LOFAR results are summarised in Tab. 3. In Fig. 2 - 12, we present the images obtained at low frequencies in our campaign of LOFAR observations: a high- and a low-resolution image at the central frequency of 144 MHz for each cluster and overlays with the X-ray images taken by Chandra and optical images taken within the Sloan Digital Sky Survey (SDSS) or the Panoramic Survey Telescope and Rapid Response System (Pan-STARRS). Our high-resolution LOFAR images with a larger field of view, which show the quality of the facet calibration and the presence of additional sources in the cluster periphery, can be found in the Appendix. The size of the diffuse emission is given by , where and are the minimum and maximum diameter of the 3 surface brightness isocontours (e.g. Cassano et al. 2008; Giacintucci et al. 2017), as measured from the low-resolution LOFAR images.
In some cases, to reveal diffuse emission, it is necessary to subtract the contribution of compact sources in the cluster centre. Therefore, we image the sources at high resolution applying a cut in the uv-range, subtract them from the uv-data, and re-image the data sets at lower resolution (see Wilber et al. (2018) for details on the subtraction procedure). The value of the uv-cut varies from target to target, depending on the extension of the sources that we attempt to subtract. The error on the total flux density is computed as , where is equal to of the measured flux density and is the subtraction error. The latter is derived by varying the range of the uv-cut that is used for modelling the compact sources. We can then quantify the error on the total flux density of the diffuse emission after subtracting different models.
When no hint of cluster-scale radio emission is detected, we provide upper limits on the radio power through the mock halo injection procedure (e.g. Venturi et al. 2008, Bonafede et al. 2017). We created a mock radio halo with a central brightness and an -folding radius derived from the total radio power at 1.4 GHz () and halo size () following the known power-mass correlation found by Cassano et al. (2013) for haloes. We used the relation found by Bonafede et al. (2017), who compared the values of and of the clusters; these values are both in the samples of Cassano et al. (2007) and Murgia et al. (2009). We then carried out a Fourier transform of the mock source into the uv-data of the LOFAR observation, which is then imaged taking into account the w-projection parameter. We chose a relatively empty region near the cluster centre, void of bright sources or artefacts, to host the injected flux density. We decreased the total flux density of the mock halo until it could not be detected in the LOFAR image, i.e. when the surface brightness above has a maximum linear size following Bonafede et al. (2017) and Wilber et al. (2018). Assuming the typical spectral index value for the haloes (), we then rescaled the total flux density of the mock halo to 1.4 GHz and computed the limit to the total radio power at 1.4 GHz, which can be compared with values present in the literature.
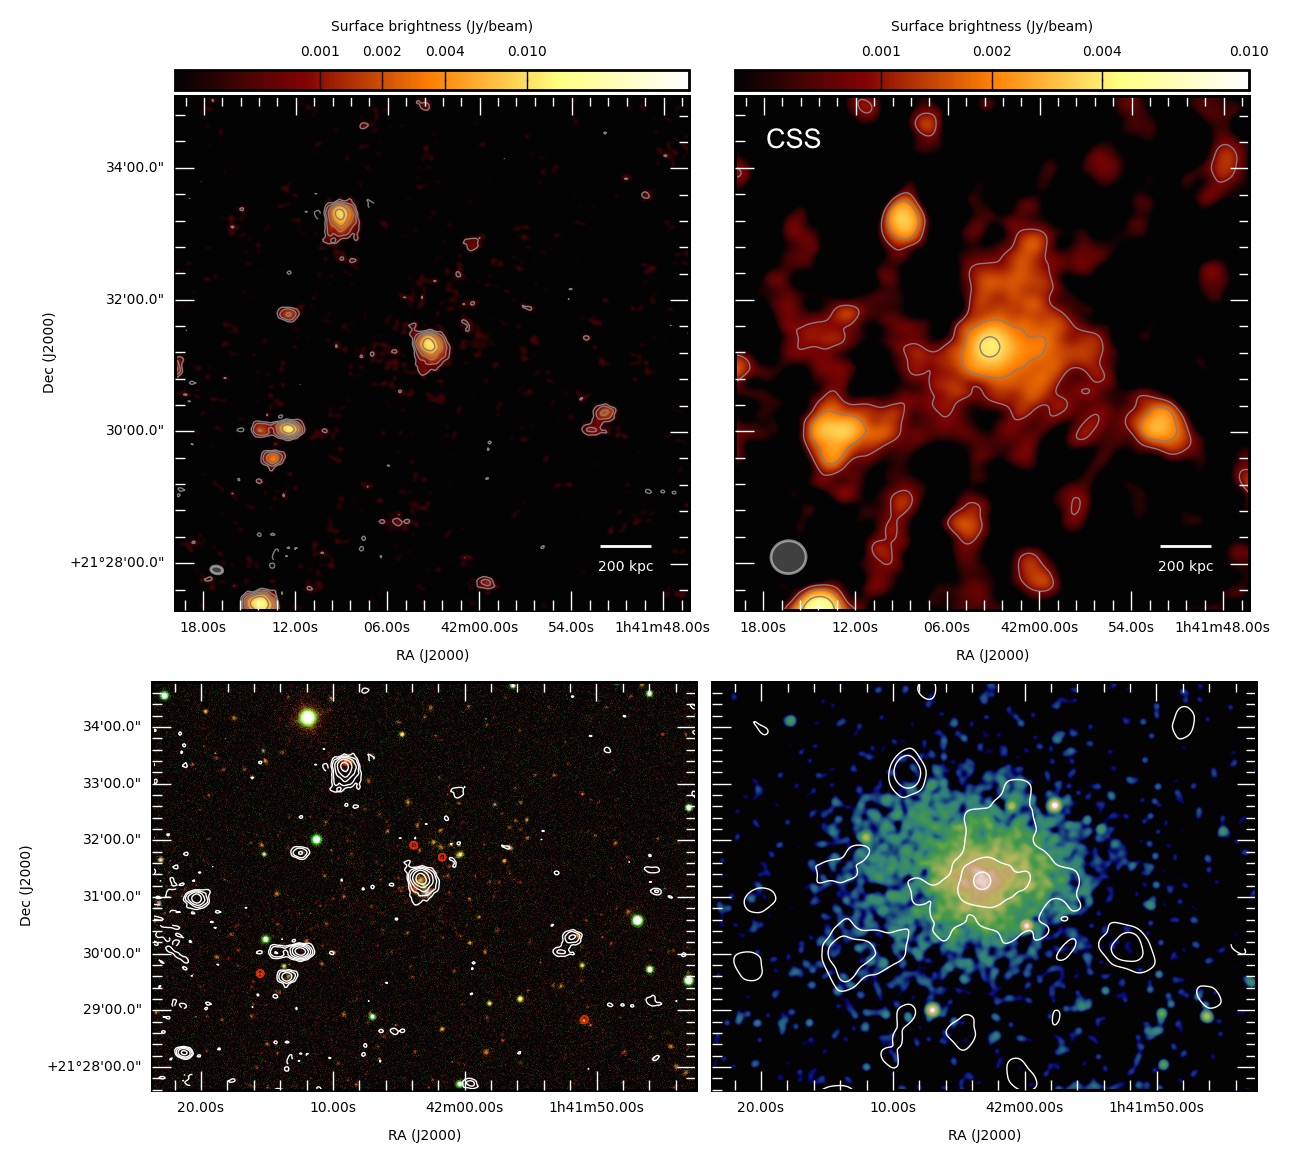
4.1 RXCJ0142.0+2131
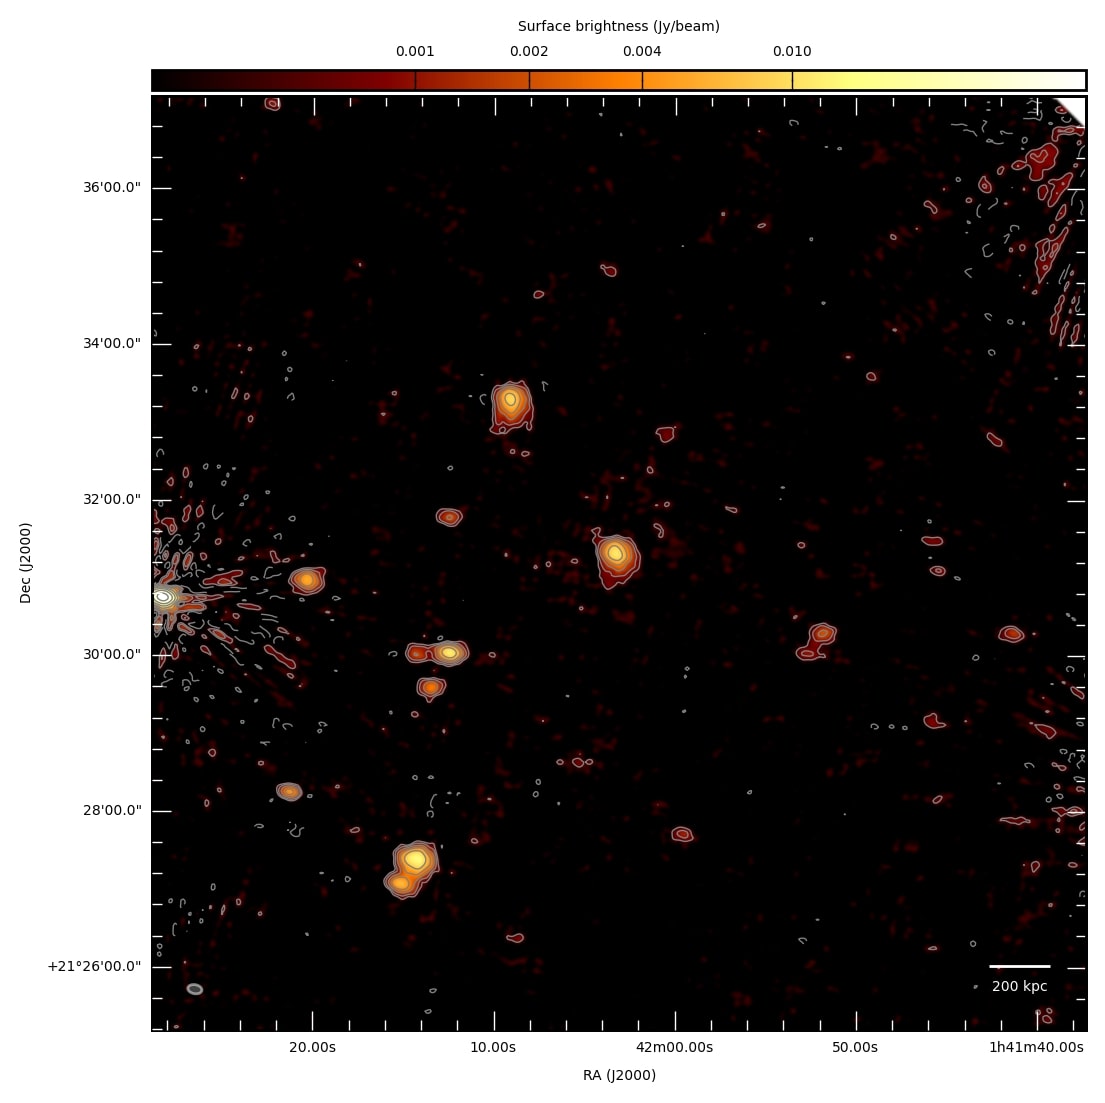
The non-cool-core cluster RXCJ0142.0+2131 is known to host a radio source at the cluster centre, that is coincident with the peak of the X-ray emission. Several bright radio sources in the field are visible in the image of the cluster (Kale et al. 2013). The X-ray distribution has a relatively disturbed morphology with no strong features. We note that this cluster exhibits the smallest value of in the sample.
Based on optical data, the occurrence of a possible merger event was inferred Barr et al. (2006), considering the presence of the second BCG (to the north-east) at z=0.283 located at kpc from the cluster centre and the X-ray morphology elongated in the same direction (von der Linden et al. 2014).
Since no diffuse radio emission has been detected in this cluster, an upper limit on the radio power was derived by Kale et al. (2013) using GMRT observations at 610 MHz and 235 MHz. The upper limit rescaled at 1.4 GHz is W Hz-1 (Cassano et al. 2013).
The high-resolution LOFAR image we obtained (left panel of Fig. 2) is consistent with the 610 MHz GMRT image in Kale et al. (2015) with a central radio source and few other radio sources to the north-east and south-west.
We subtracted the contribution of the sources detected at high resolution using only the longer baselines with a uv-cut of (that corresponds to 500 kpc) and re-imaged the data at lower resolution to search for diffuse emission. We were then able to see the presence of centrally located diffuse emission with kpc, as shown in the right panel of Fig. 2. The total flux density is mJy corresponding to a total radio power at 144 MHz of W Hz-1. Using the upper limit at 1.4 GHz placed by Kale et al. (2013), we can estimate the spectral index to be . We note that this is a conservative estimate, since the upper limit is computed considering a 1 Mpc halo, while the halo we detect is on a scale of less than 600 kpc. We can use the power-luminosity plot in Fig. 3 in Brunetti et al. (2007), where upper limits for 500 kpc-haloes are also derived for the typical GMRT observations of the radio halo survey. At the redshift of this cluster, a limit evaluated on a size of 500 kpc would be 1.6 - 1.8 times deeper than that on a size of 1 Mpc. Hence, we derive a more stringent limit on the spectrum of , which would lead to an USS halo classification.
The size, although smaller than that of giant haloes, and the estimated spectral index value are consistent with the properties of a radio halo, likely an USS halo. We note that the power measured with LOFAR and extrapolated at 1.4 GHz lies below the known power-mass correlation of Cassano et al. (2013) (see Fig. 14).
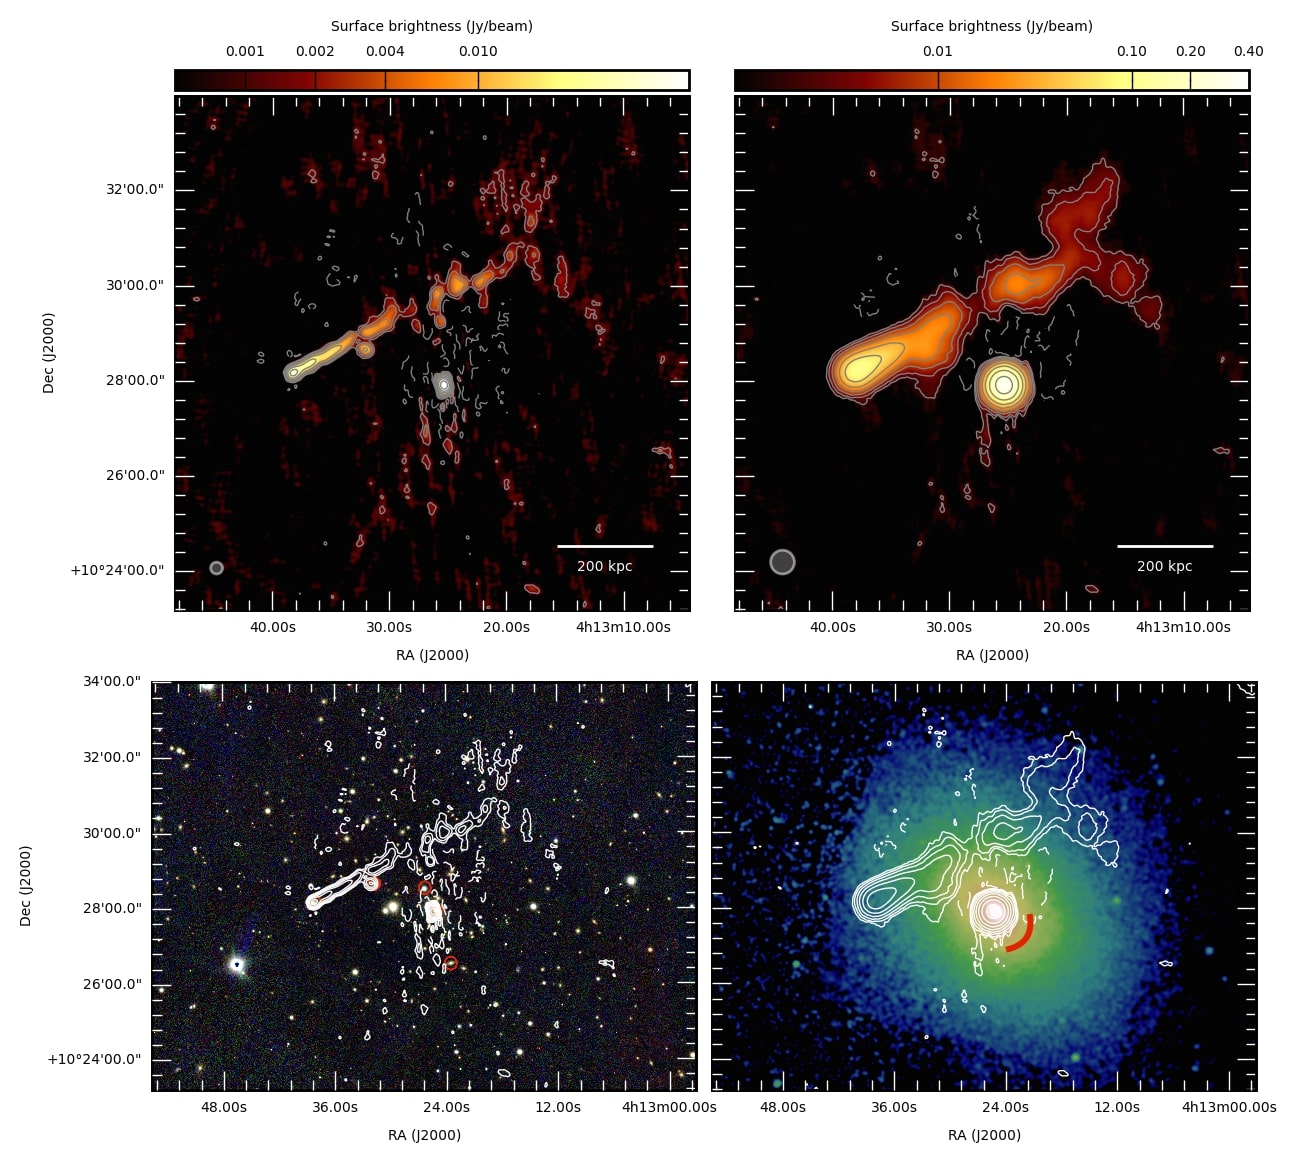
4.2 A478
A478 is a cool-core cluster with a relaxed X-ray morphology and a spherically symmetric temperature distribution on large scales.
A number of X-ray substructures at the cluster centre, such as small cavities with sizes of few kpc, are found by Sun et al. (2003). Giacintucci et al. (2014b) presented
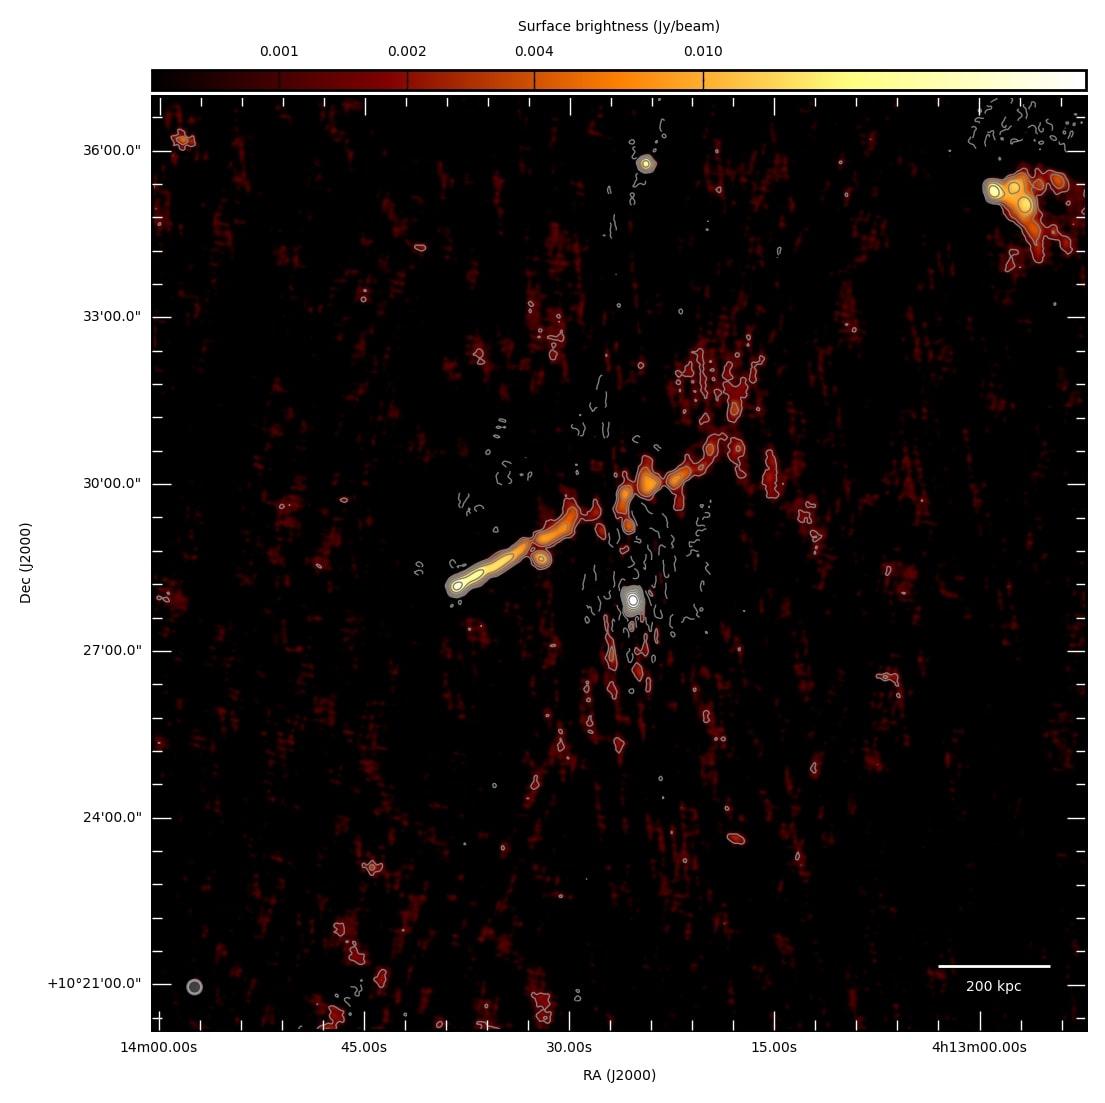
VLA radio images at 1.4 GHz and reveal the presence of a central double-lobe radio galaxy with a size of 13 kpc. The hosting galaxy is the BCG, as can be seen in the optical overlay. Diffuse, low-brightness radio emission encompassing the central active galactic nucleus (AGN) and extending on a scale of 300 kpc is also detected and classified as a mini halo. The low-resolution image at 1.4 GHz (Fig. 1c in Giacintucci et al. 2014b) shows that the mini halo blends with the tail of a cluster-member head-tail radio galaxy located to the north-east of the cluster centre. The tail extends for 200 kpc and encompasses an unresolved source, which is also a cluster member. A second unresolved source to the north with no optical identification is thought to be a background galaxy.
Markevitch et al. (2003) reported the presence of a cold front in the Chandra image at 60 kpc to the south-west of the cluster, which we show in the X-ray image of Fig. 3. Its position seems to indicate that the radio emission is confined by the front, as expected in simulations of mini haloes (ZuHone et al. 2013).
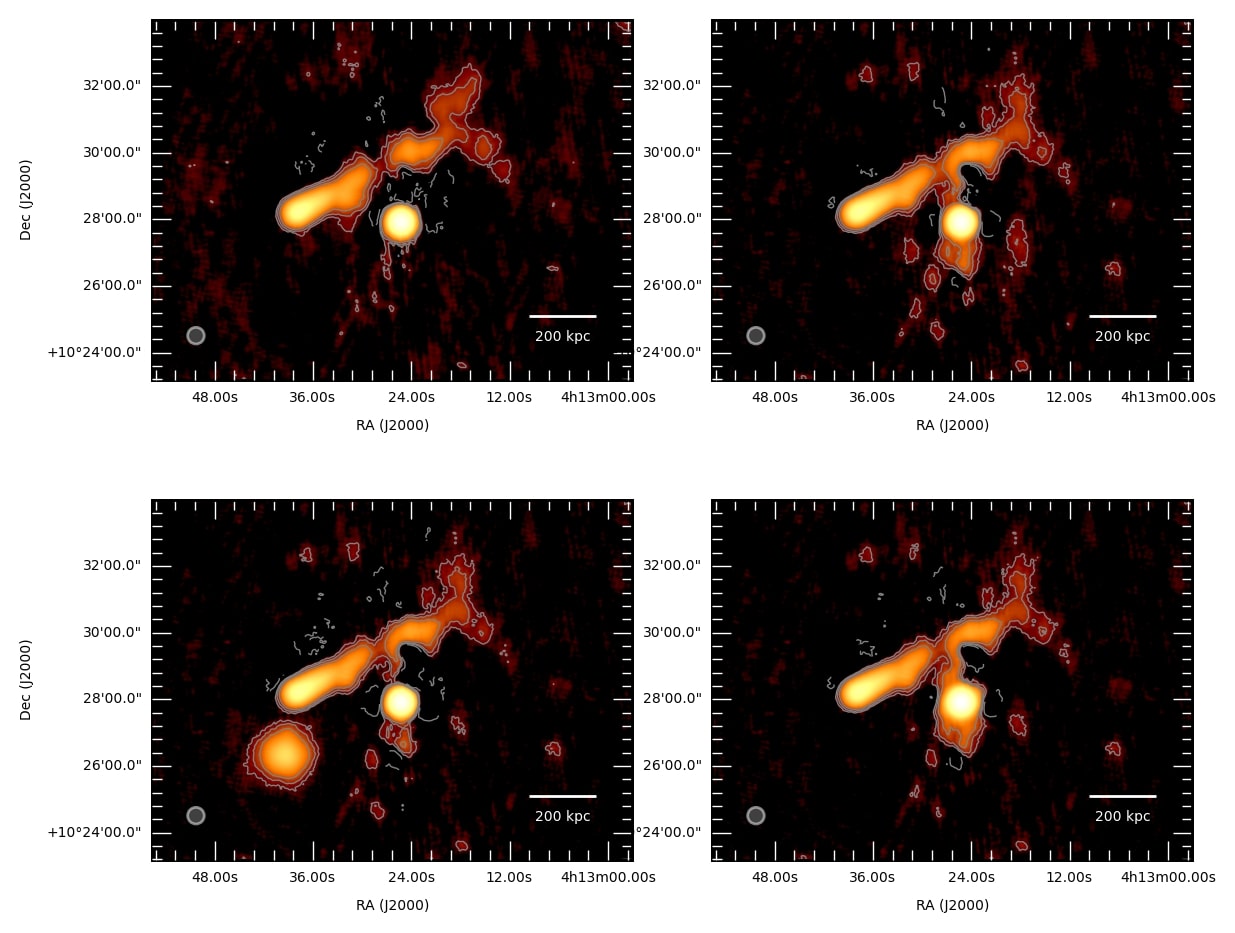
The calibration of the LOFAR data set was difficult owing to the presence of a 3C source (3C109; 04h13m40.37s, +11∘12′13.8′′) with a flux density of 21 Jy located at from the target. We created a sky model of this double-lobe radio galaxy using a high-resolution VLA image at 4.8 GHz to improve its calibration. However, the image sensitivity is limited by the dynamic range, therefore we consider the caveats relative to the presence of negative holes around the central source, and the higher noise of the target facet (460 Jy beam-1) compared to that obtained for the other clusters. Nevertheless, the final image of A478 at 144 MHz (Fig. 3) confirms the presence of the central AGN; the head-tail radio galaxy to the north-east with a tail is overall much longer than previously seen, extending for more than 650 kpc. Interestingly, the tail appears to be divided into two regions. This is seen in the case of A1033 de Gasperin et al. (2017), in which the authors have proposed the gentle re-energisation of electrons as the mechanism that justifies the brightness of the second part of the radio tail, which is only visible at low frequencies.
With LOFAR, we do not see hints of centrally located diffuse emission. As a further argument, we injected mock mini haloes with different sizes and flux densities in the data set, both at the cluster centre and in a void close-by region, to rule out the possibility that the calibration artefacts are responsible for the absence of the mini halo (see Fig. 16 in the Appendix section). We used the minimum and maximum values for , i.e. 25 and 100 kpc, and for at 1.4 GHz, i.e. and Jy beam-1, respectively, found by Murgia et al. (2009) for a sample of mini haloes. Considering the flux density reported in Giacintucci et al. (2017) for the mini halo in A478, the recovered flux density of the mock mini halo indicates that the limit on the spectral index of the source would be , which is unusually flat for a mini halo.
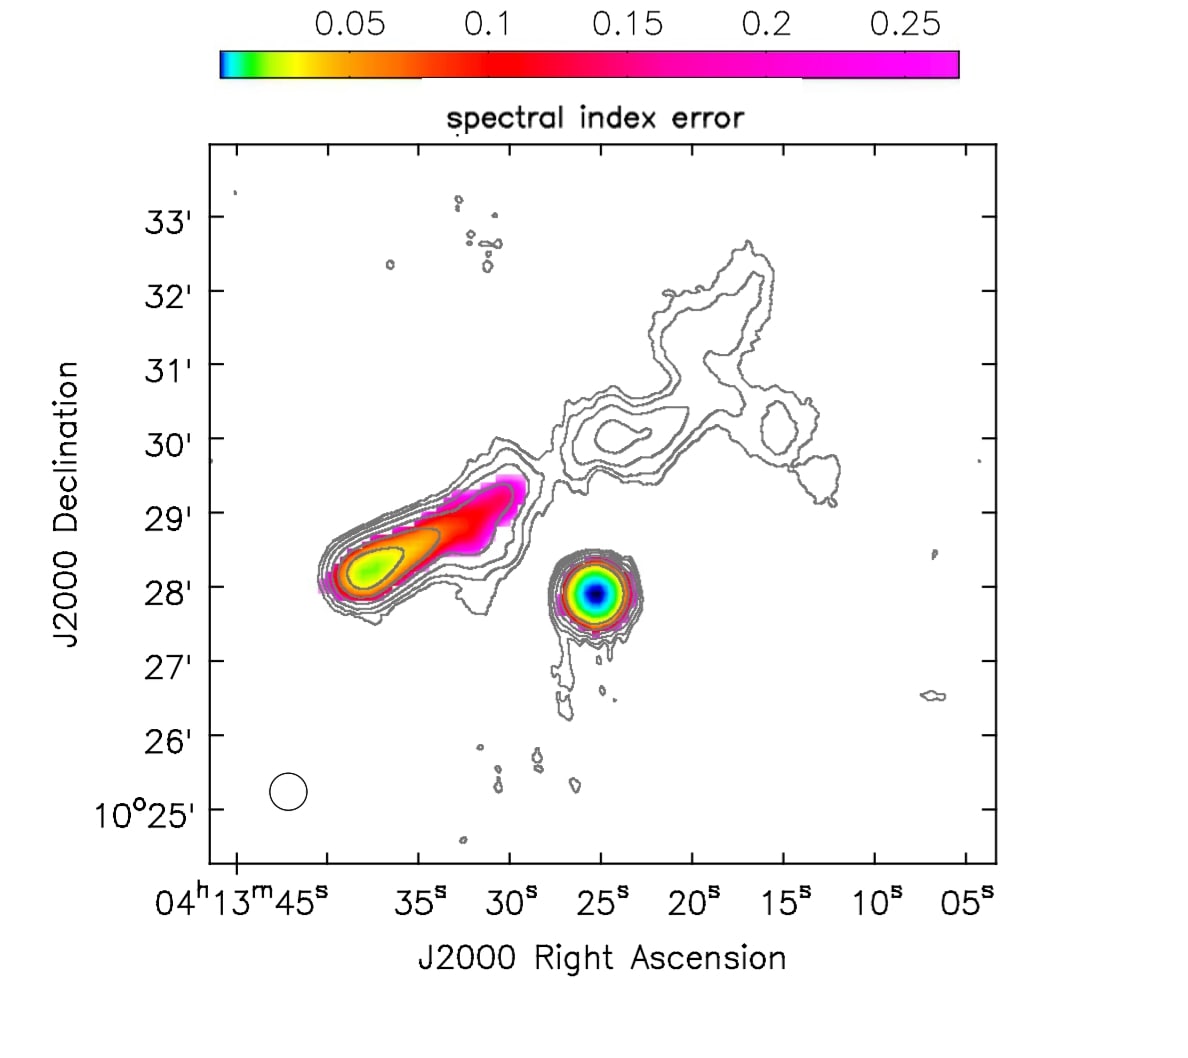
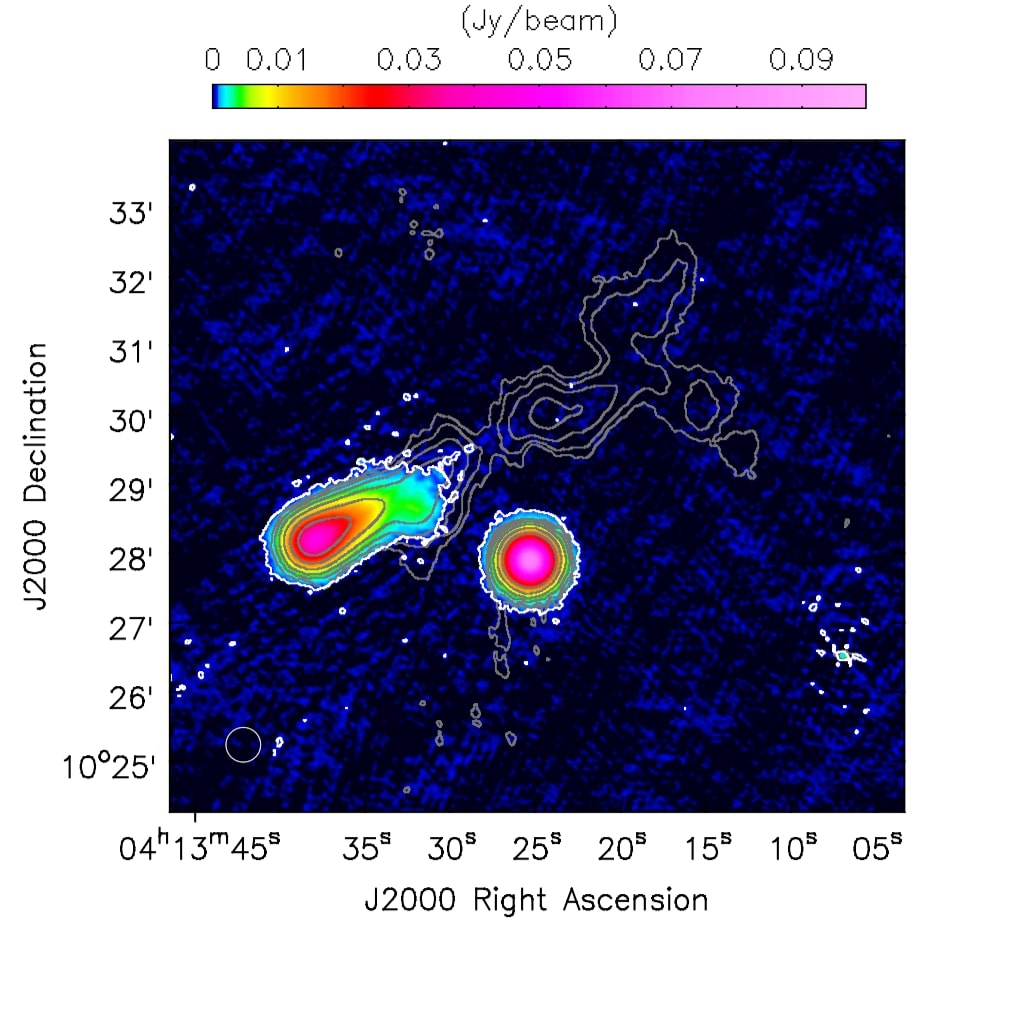
We processed an archival GMRT observation at 610 MHz and obtain the low-resolution image shown in the left panel of Fig. 4. Neither diffuse emission nor the second portion of the tail is visible. We re-imaged the LOFAR and GMRT data sets with a Gaussian taper of 30′′ and with the same pixel size, baseline range (200 - 40000), and uniform weighting scheme to minimise the differences in the uv-coverage of the two observations, and we obtain the spectral index map that is shown in the right panel of Fig. 4. The central emission has a spectral index of and the head-tail radio galaxy has the typical trend of an active radio galaxy with a flat core () and a steepening along the tail up to . We can provide an upper limit on the spectrum of the second portion of the tail, using the mean flux density from the LOFAR image and the rms noise from the GMRT image. This results in a spectral index .
4.3 PSZ1G139.61+24
The cool-core cluster PSZ1G139.61+24 has been studied in detail in a dedicated paper by Savini et al. (2018a). Giacintucci et al. (2017) have reported the detection of a tentative mini halo with an overall source size of 100 kpc located at the cluster centre, and the LOFAR image presented in Savini et al. (2018a) reveals new diffuse emission extending for more than 500 kpc. The radio source associated with the cluster consists of a central bright component surrounded by halo-like emission extending beyond the cool core. The two components become apparent in a spectral analysis performed between 144 MHz LOFAR and 610 MHz GMRT images that reveals a central component with -1.3, whilst the large-scale faint emission exhibits an USS with an upper limit of -1.7. Although the cluster core has a low entropy, typical of non-merging cool-core systems, the X-ray analysis shows that the cluster is slightly disturbed and hosts a cold front (shown in the bottom panel of Fig. 5) suggesting the presence of gas sloshing. Savini et al. (2018a) have argued that the large-scale radio emission outside the core is produced by a minor merger that powers electron re-acceleration without disrupting the cool core.
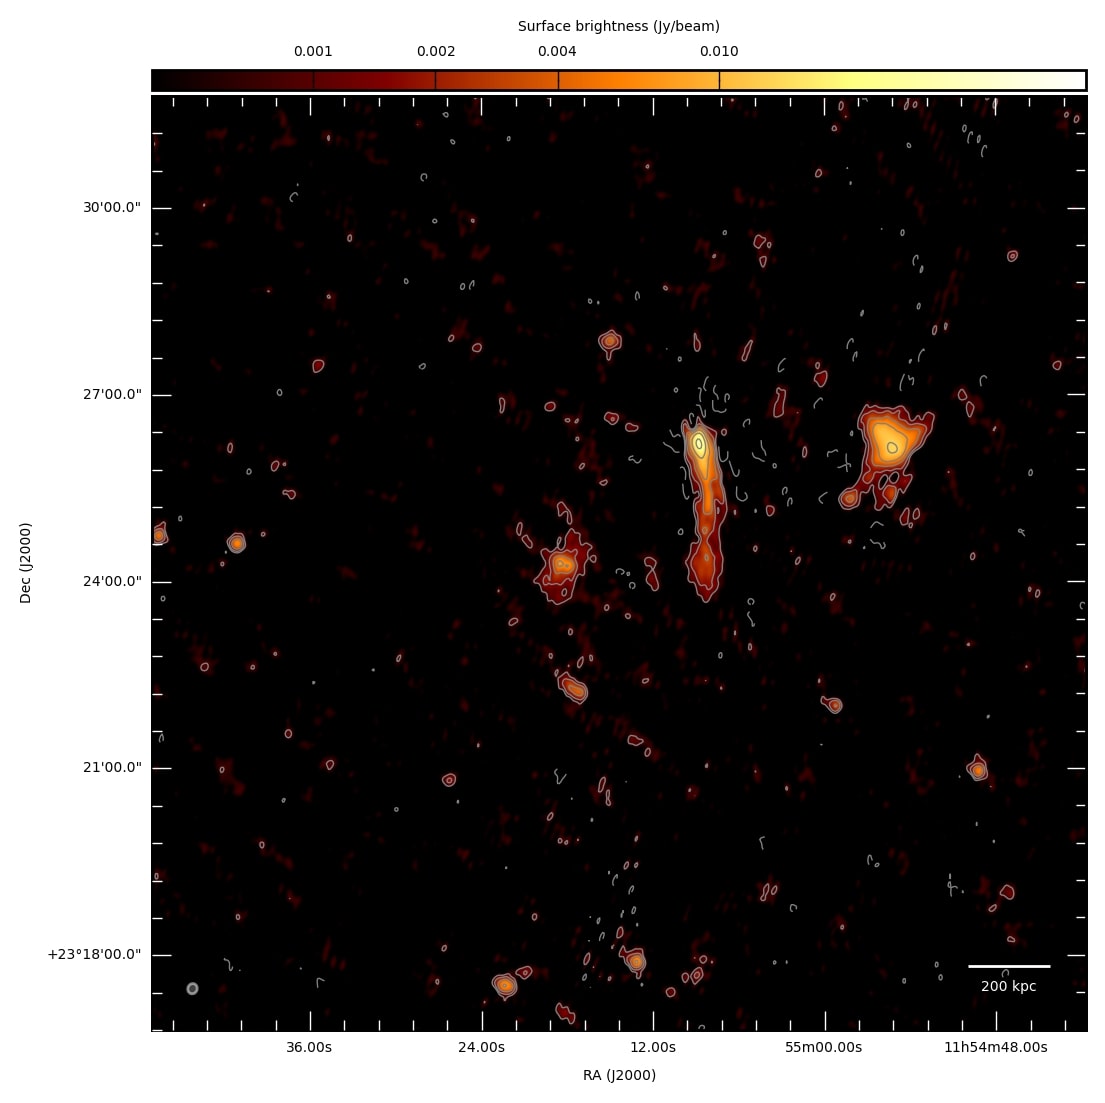
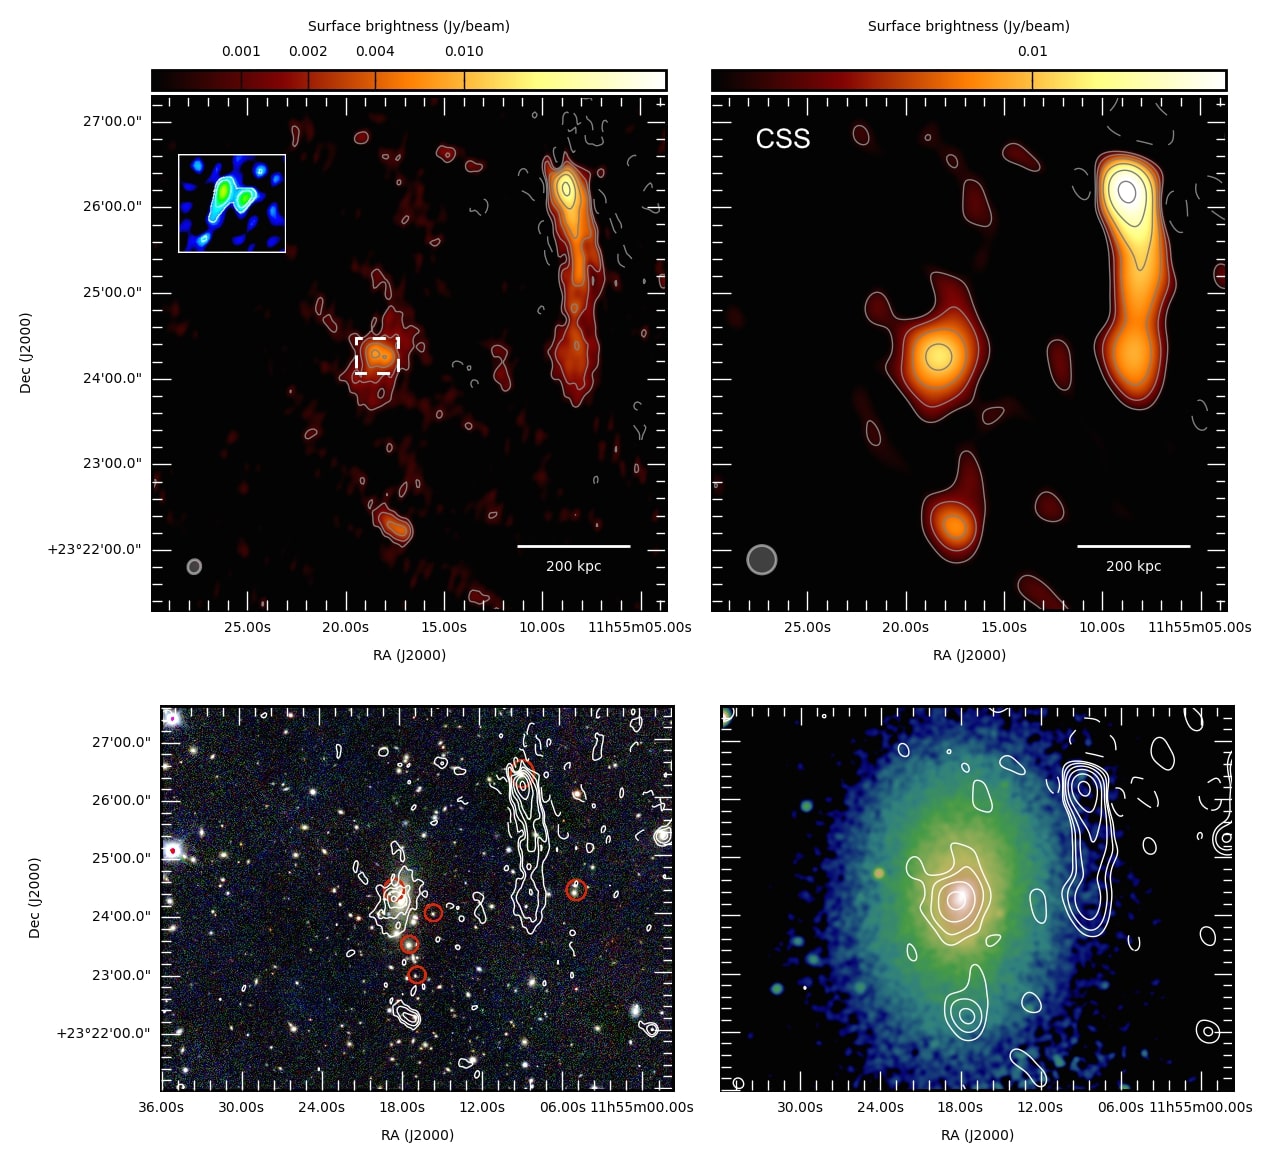
4.4 A1413
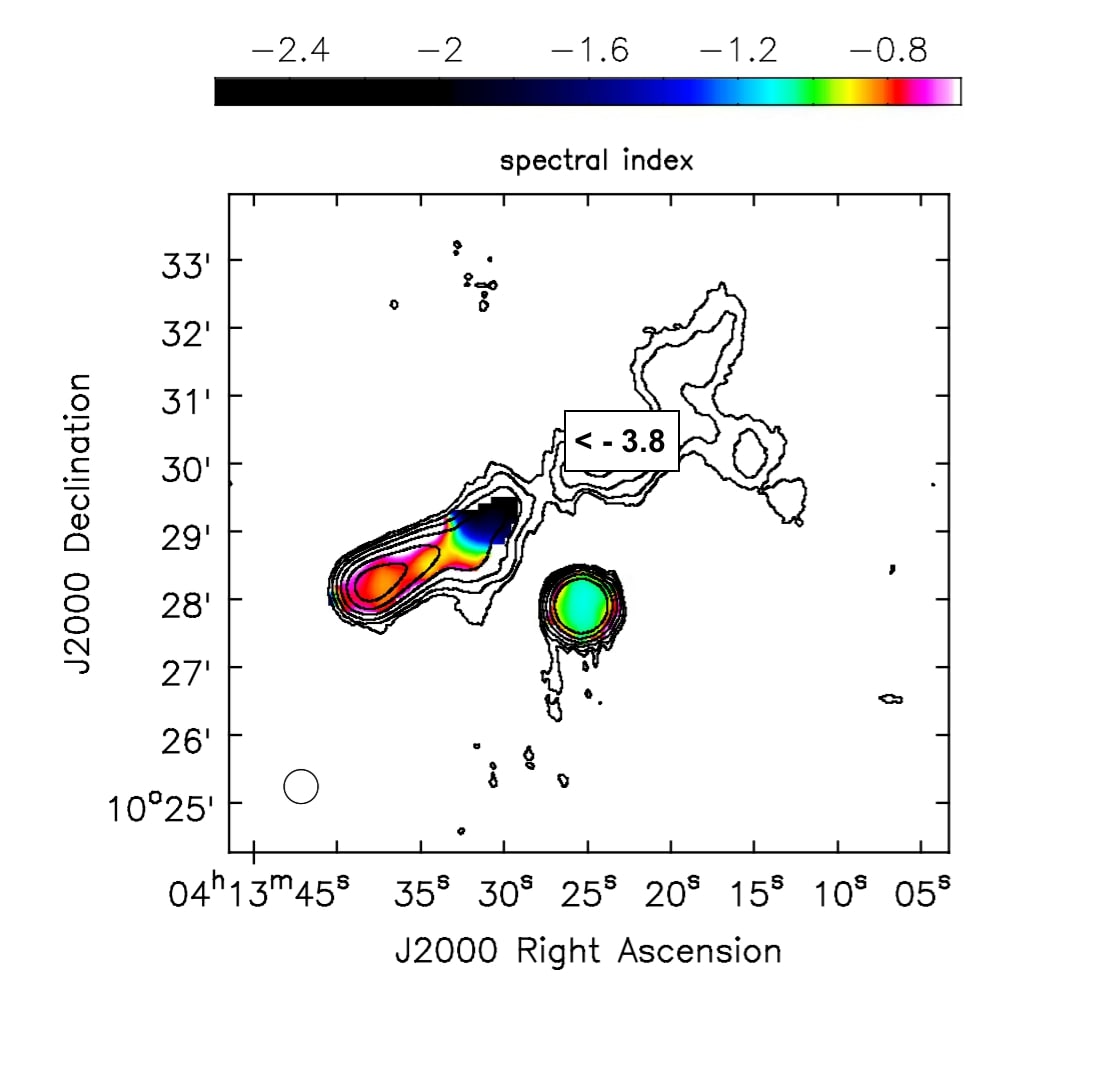
The 1.4 GHz VLA image in Govoni et al. (2009) reveals the presence of diffuse emission at the centre of the cool-core cluster A1413, extending on a scale of 220 kpc with a total flux density of mJy. At the sensitivity limit of the FIRST survey (Becker et al. 1995), the central optical galaxy does not contain a compact radio source (Fig. 2 in Govoni et al. 2009), and the authors suggested that the source might be a candidate mini halo, speculating about a scenario in which the central galaxy has switched off while the mini halo continues to emit. Govoni et al. (2009) also reported an offset between the emission peak of this radio source and both the central galaxy and the X-ray emission peak.
The X-ray morphology is slightly elongated in the north-south direction and shows a bright core with a moderate entropy value (, Giacintucci et al. 2017) that indicates the absence of a cool core. We note that this cluster is the only (candidate) mini halo found in a non-cool-core cluster in the sample studied in Giacintucci et al. (2017).
With the LOFAR image in Fig. 6, we confirm the presence of centrally located diffuse emission. A head-tail radio galaxy, not mentioned or shown in Govoni et al. (2009), can be seen at the west of the cluster. The optical counter part is a galaxy member at . We obtain a high-resolution image using only the longer baselines with a uv-cut of (corresponding to 200 kpc) to model the central compact sources (shown in the box within the top left panel of Fig. 6). We note that two sources are actually visible in the central region, one of which is co-located with the X-ray centre, hence no offset is present. We then subtract the compact sources, imaging the central radio diffuse emission that is shown in the low-resolution image of Fig. 6; we classify this source as a mini halo. The size of the diffuse emission is 210 kpc with a total flux density of mJy at 144 MHz. The implied spectral index value is -1.3. We note that the spectral index might be steeper, considering that the flux reported by Govoni et al. (2009) is likely overestimated, since the authors subtracted only the contribution of one of the central sources, i.e. that visible at 1.4 GHz with FIRST.
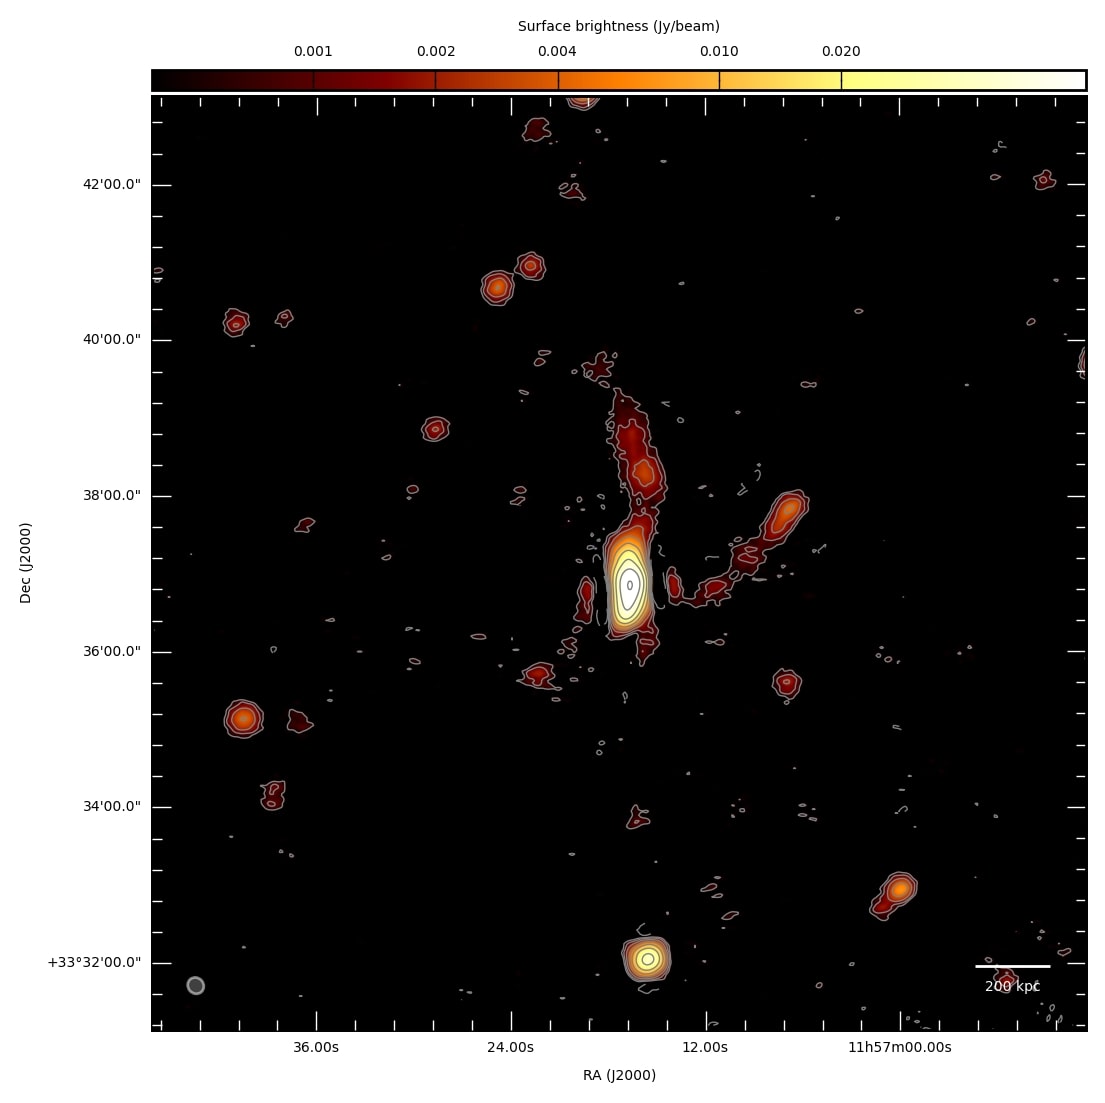
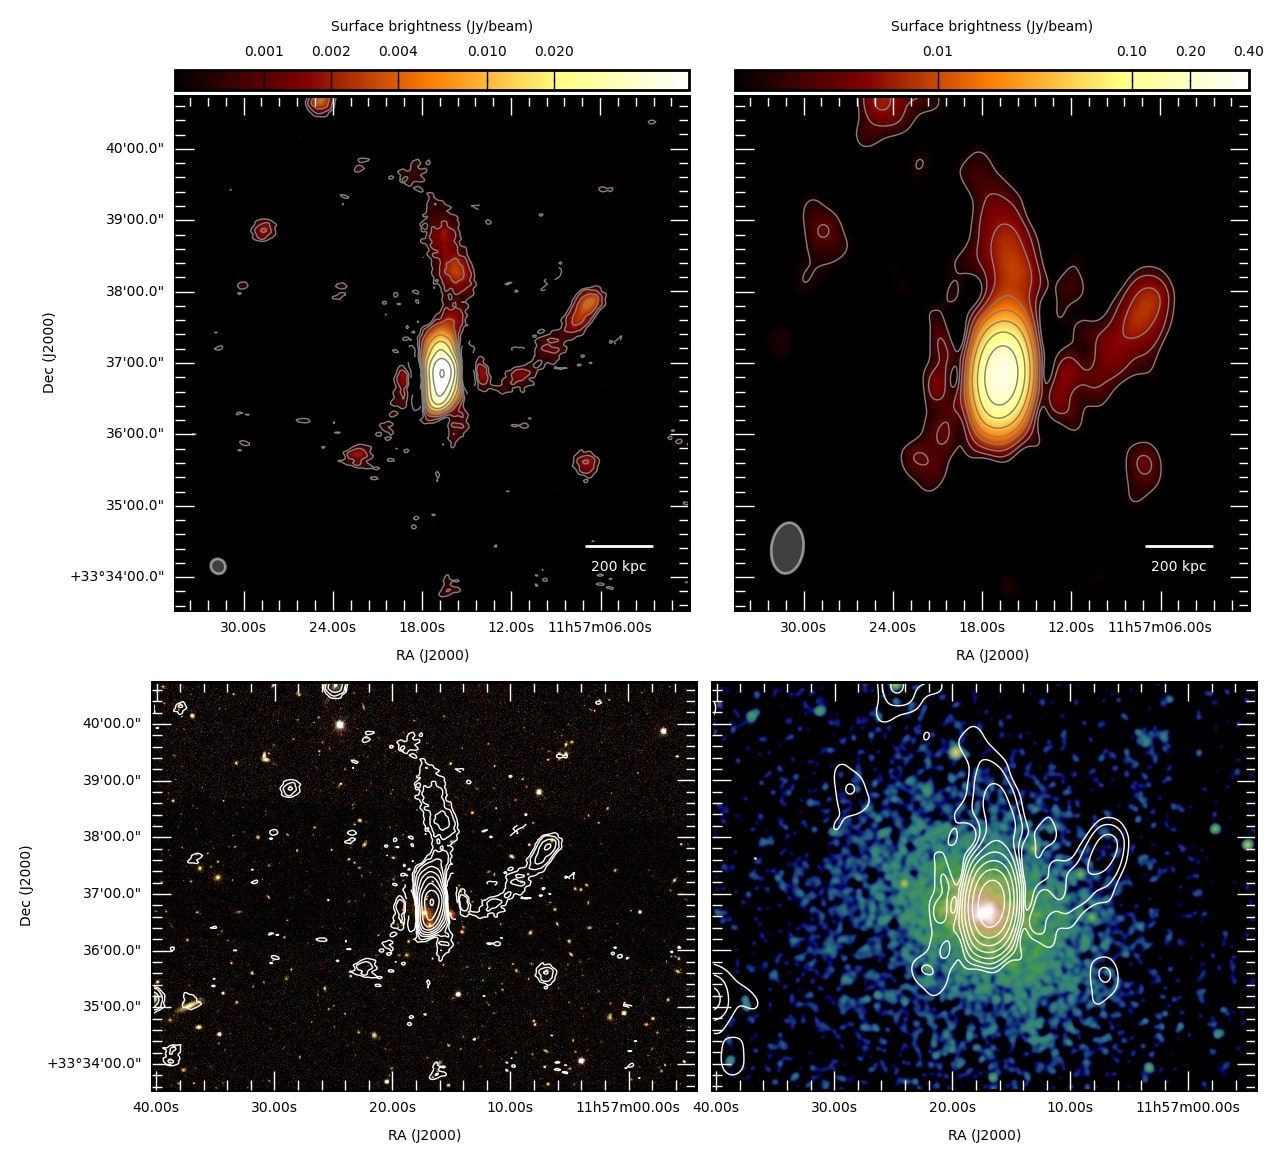
4.5 A1423
No hint of diffuse radio emission has ever been observed in the cool-core cluster A1423 and no radio images are available in the literature. An upper limit on the radio power was derived by Venturi et al. (2008) using a GMRT observation at 610 MHz. The upper limit rescaled at 1.4 GHz is W Hz-1 (Cassano et al. 2013).
Our high-resolution LOFAR image of A1423 (Fig. 7) shows a bright central radio source ( 0.38 Jy) that is likely connected to the BCG visible in the optical image. This radio source is elongated in the north-south direction with a tail extending to the north for 400 kpc, which might be remnant emission connected to the central source. A second tailed source is found to the north-west of the cluster centre and might be connected to an optical galaxy of unknown redshift. Subtracting the bright and extended central source was not possible since it would leave residuals that cannot be distinguished from diffuse emission. The low-resolution LOFAR observation does not show additional emission. Moreover, no spatial correlation between radio and X-ray emission is found since the X-ray morphology appears disturbed along the east-west axis, whilst the radio emission is elongated along the north-south axis.
We computed a new upper limit on the radio power by injecting a mock halo in the data set (see Sec. 4). The integrated flux density of the mock halo computed within a region centred on the injected halo with a radius equal to kpc is mJy at 144 MHz, which corresponds to a total radio power at 144 MHz of W Hz-1. Assuming the typical spectral index value used in the power-mass correlation for haloes (), we derive a new upper limit to the radio power at 1.4 GHz, which we plot in Fig. 14. The new upper limit is W Hz-1, i.e. almost a factor of 2 deeper than that derived in literature.
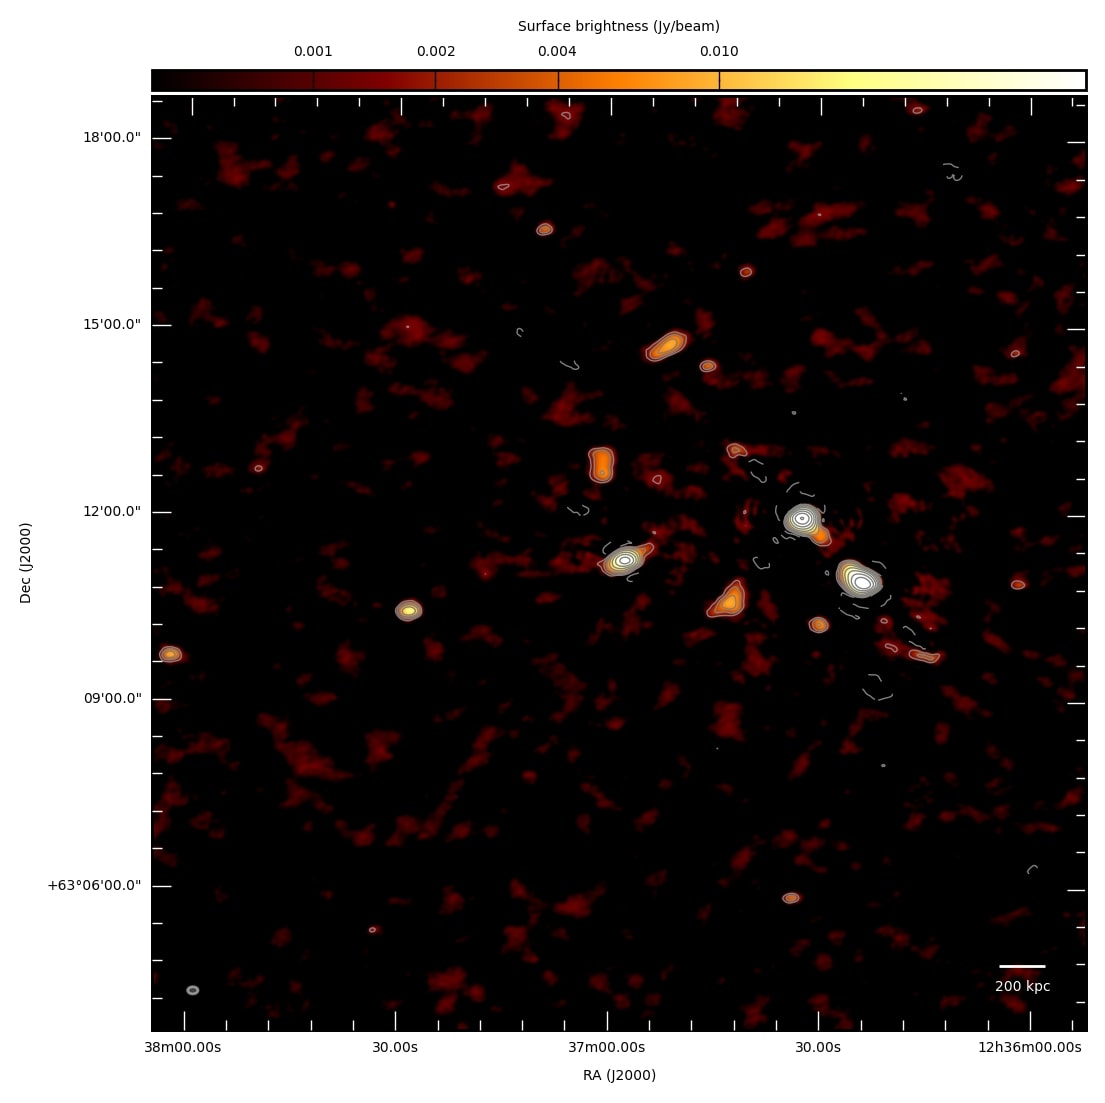
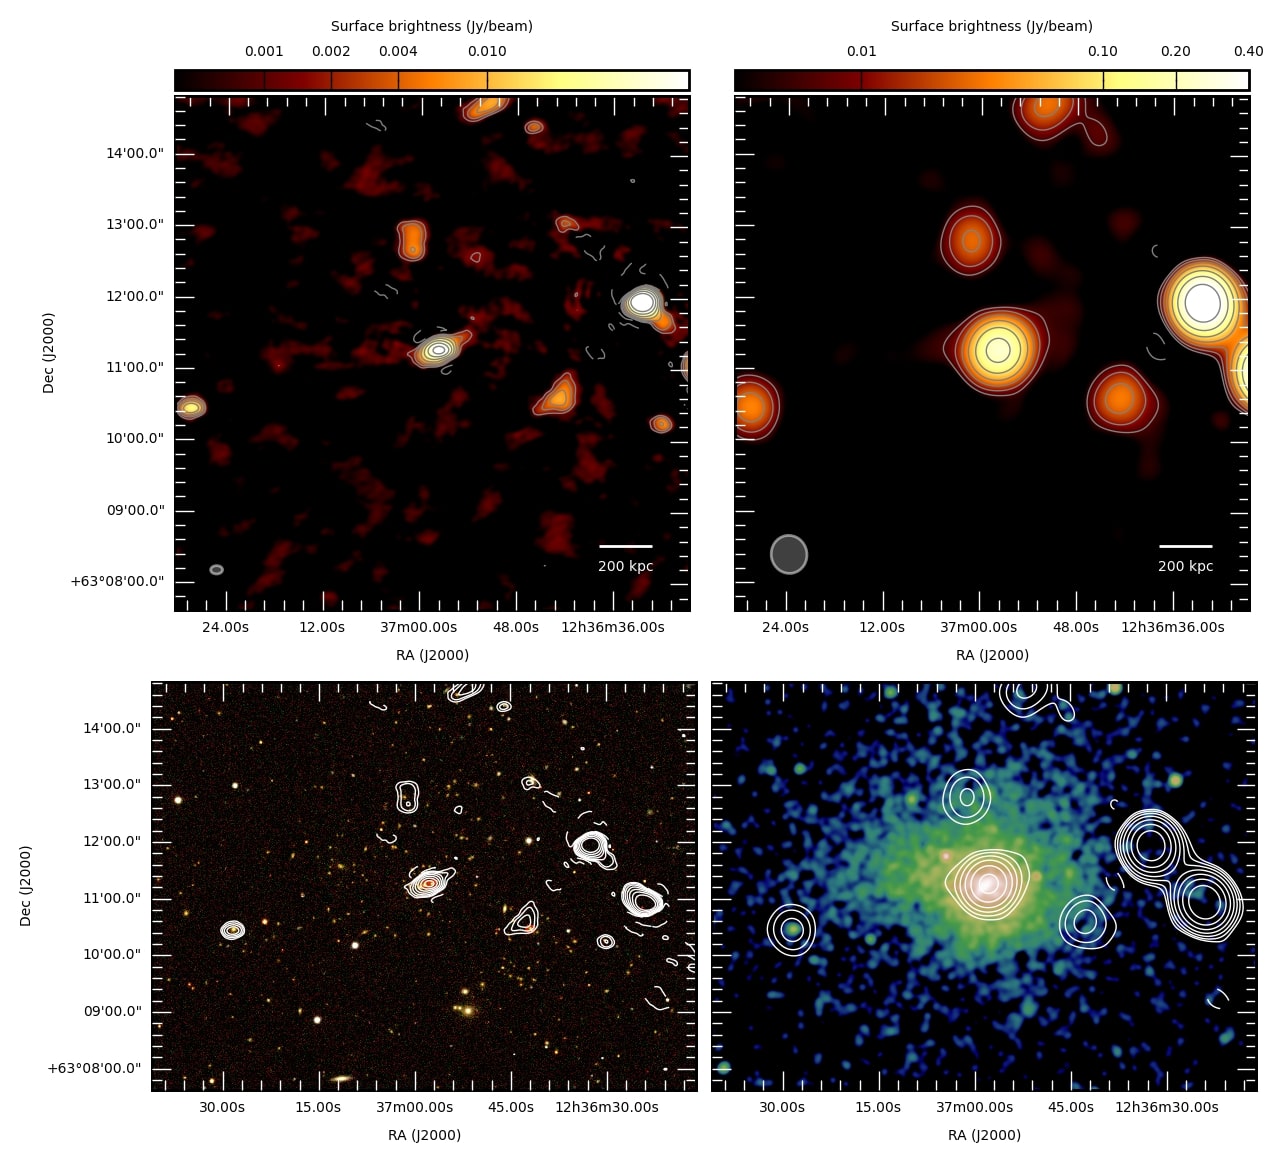
4.6 A1576
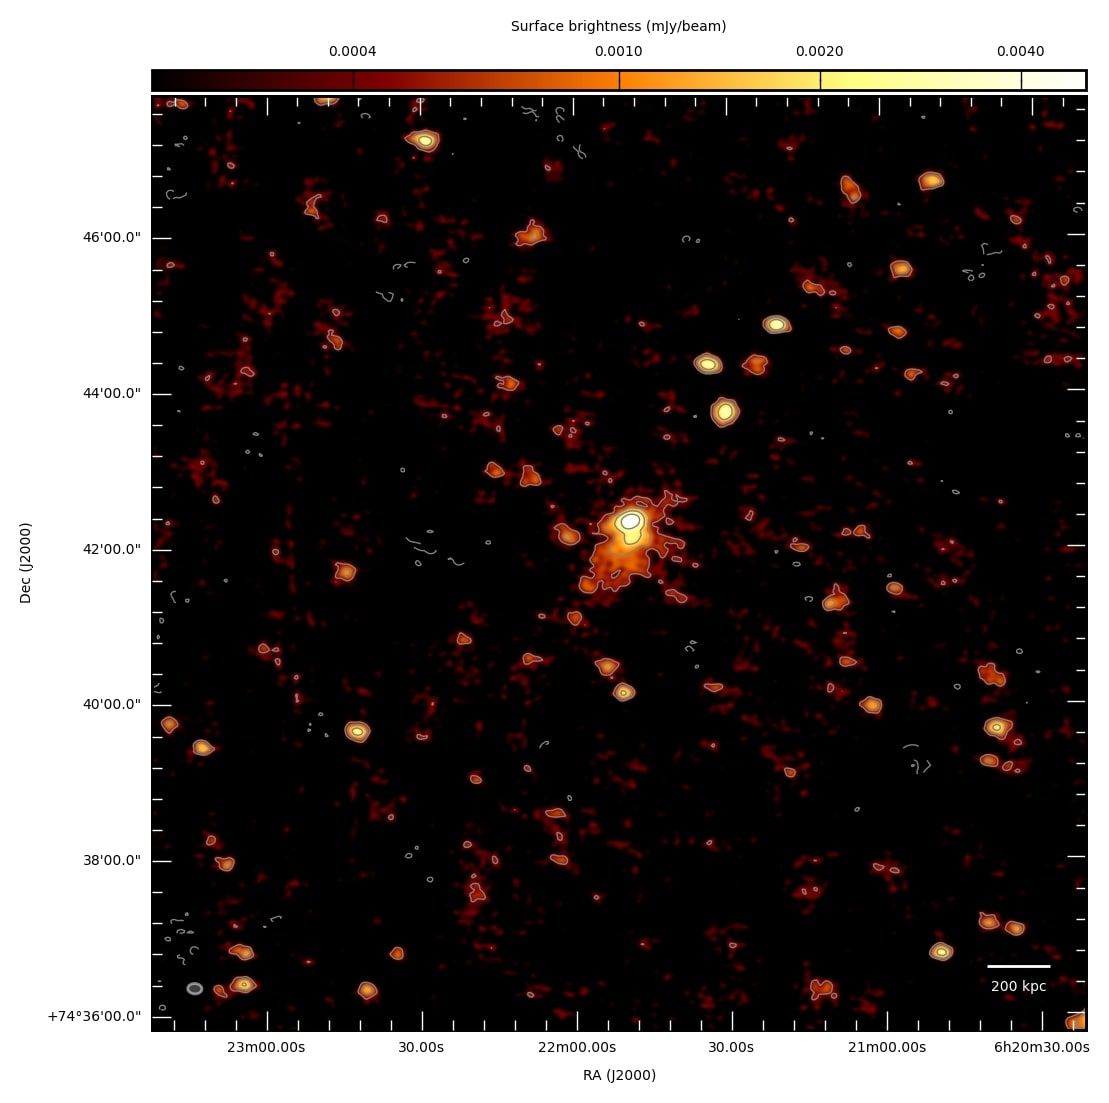
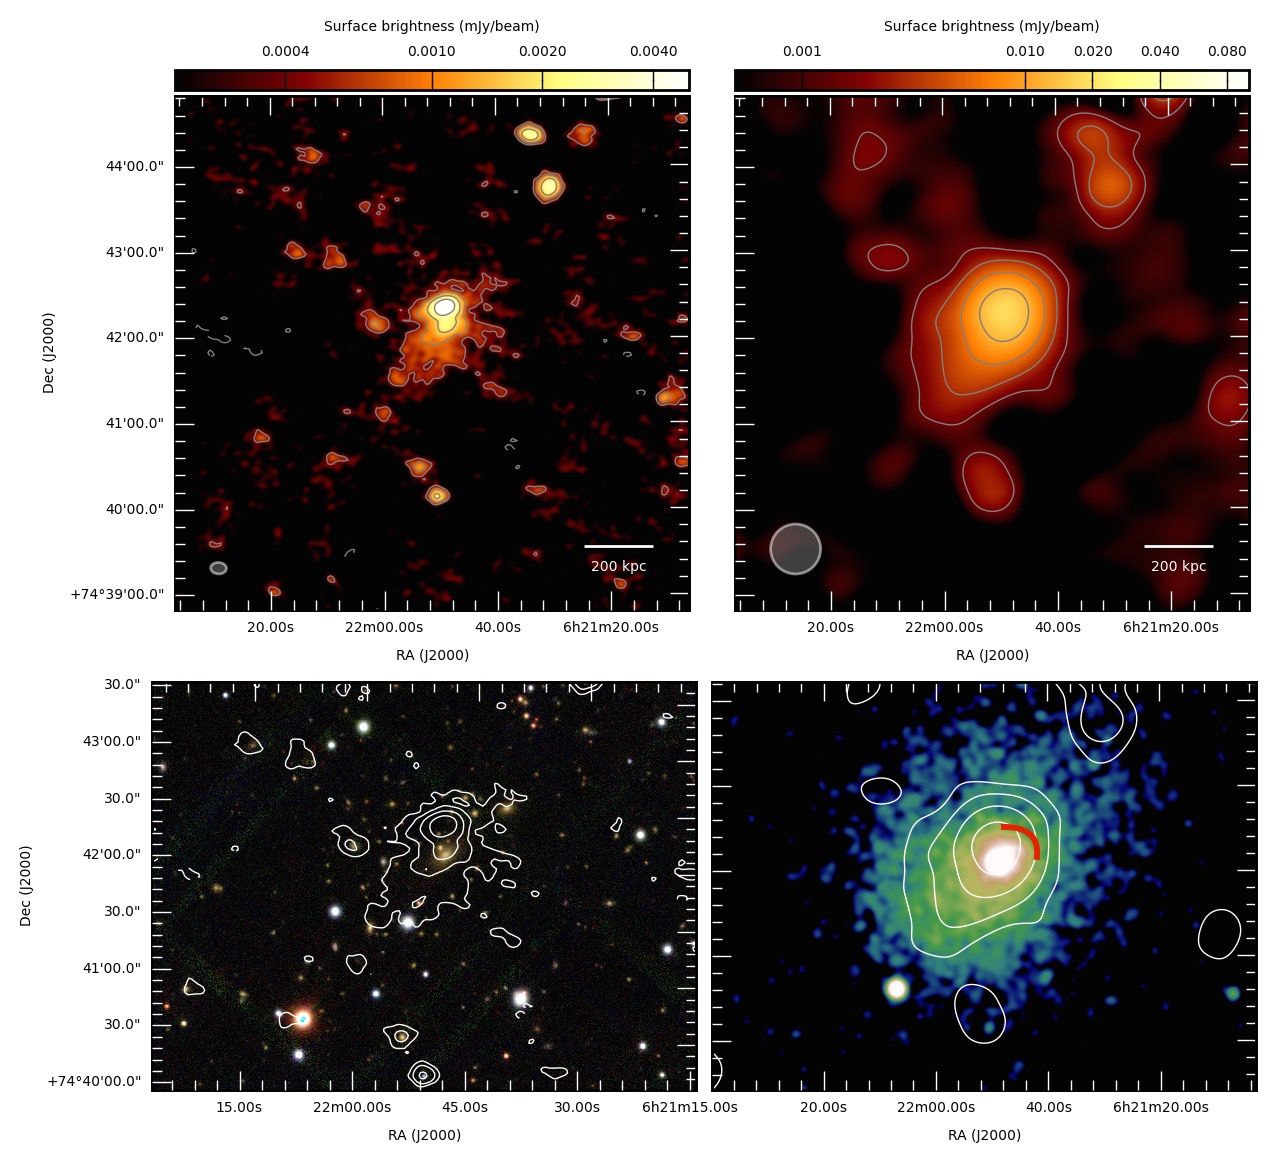
As in the case of A1423, no hint of diffuse radio emission has so far been observed in non-cool-core cluster A1576. A central radio galaxy with indications of a jet and three optical counterparts, which create a multiple core system, is reported by Kale et al. (2013).
Two other radio sources are visible in the field to the north (co-located with an optical source with unknown redshift) and to the south-west (likely connected to a cluster-member galaxy). The X-ray morphology is elongated in the east-west direction and does not show a strong central peak. Moreover, based on weak lensing analysis, Dahle et al. (2002) inferred significant dynamical activity. An upper limit on the radio power was derived by Venturi et al. (2008) using a GMRT observation at 610 MHz. The upper limit rescaled at 1.4 GHz is W Hz-1 (Cassano et al. 2013).
During the LOFAR observation of this cluster, the ionosphere was very active and we reached a noise of 500 Jy beam-1 (Fig. 8). At this sensitivity level, no radio diffuse emission is detected at 144 MHz either after subtracting the contribution of the compact sources. Hence, we compute a new upper limit on the radio power by injecting a mock halo in the data set (see Sec. 4). The integrated flux density of the mock halo computed within a region centred on the injected halo with a radius of kpc is mJy at 144 MHz, which corresponds to a total radio power at 144 MHz of W Hz-1. Assuming the typical spectral index value used in the power-mass correlation for haloes (), we derived the radio power that we plot in Fig. 14. The new upper limit on the radio power at 1.4 GHz is W Hz-1, i.e. comparable with that derived in literature.
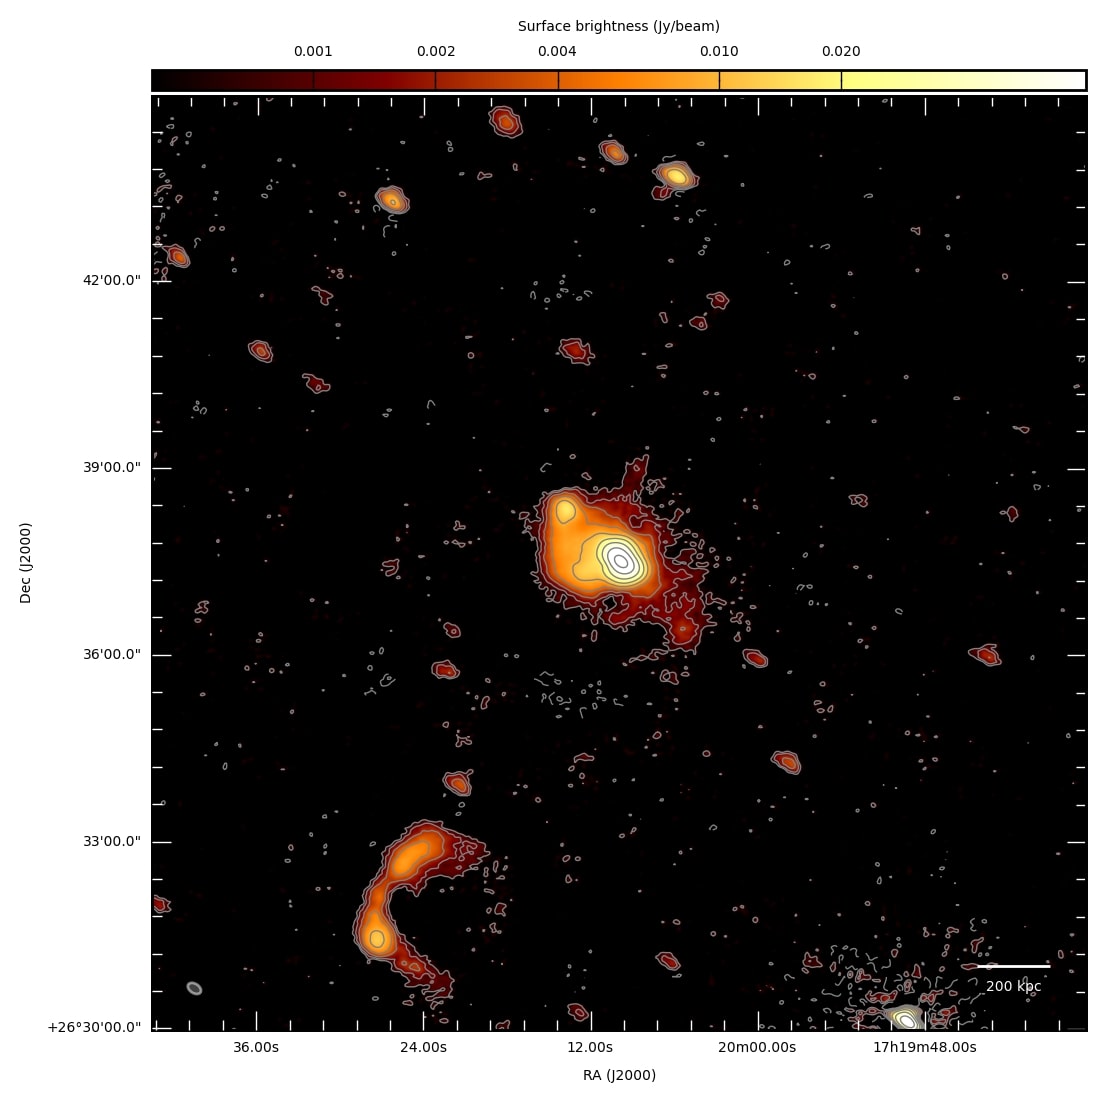
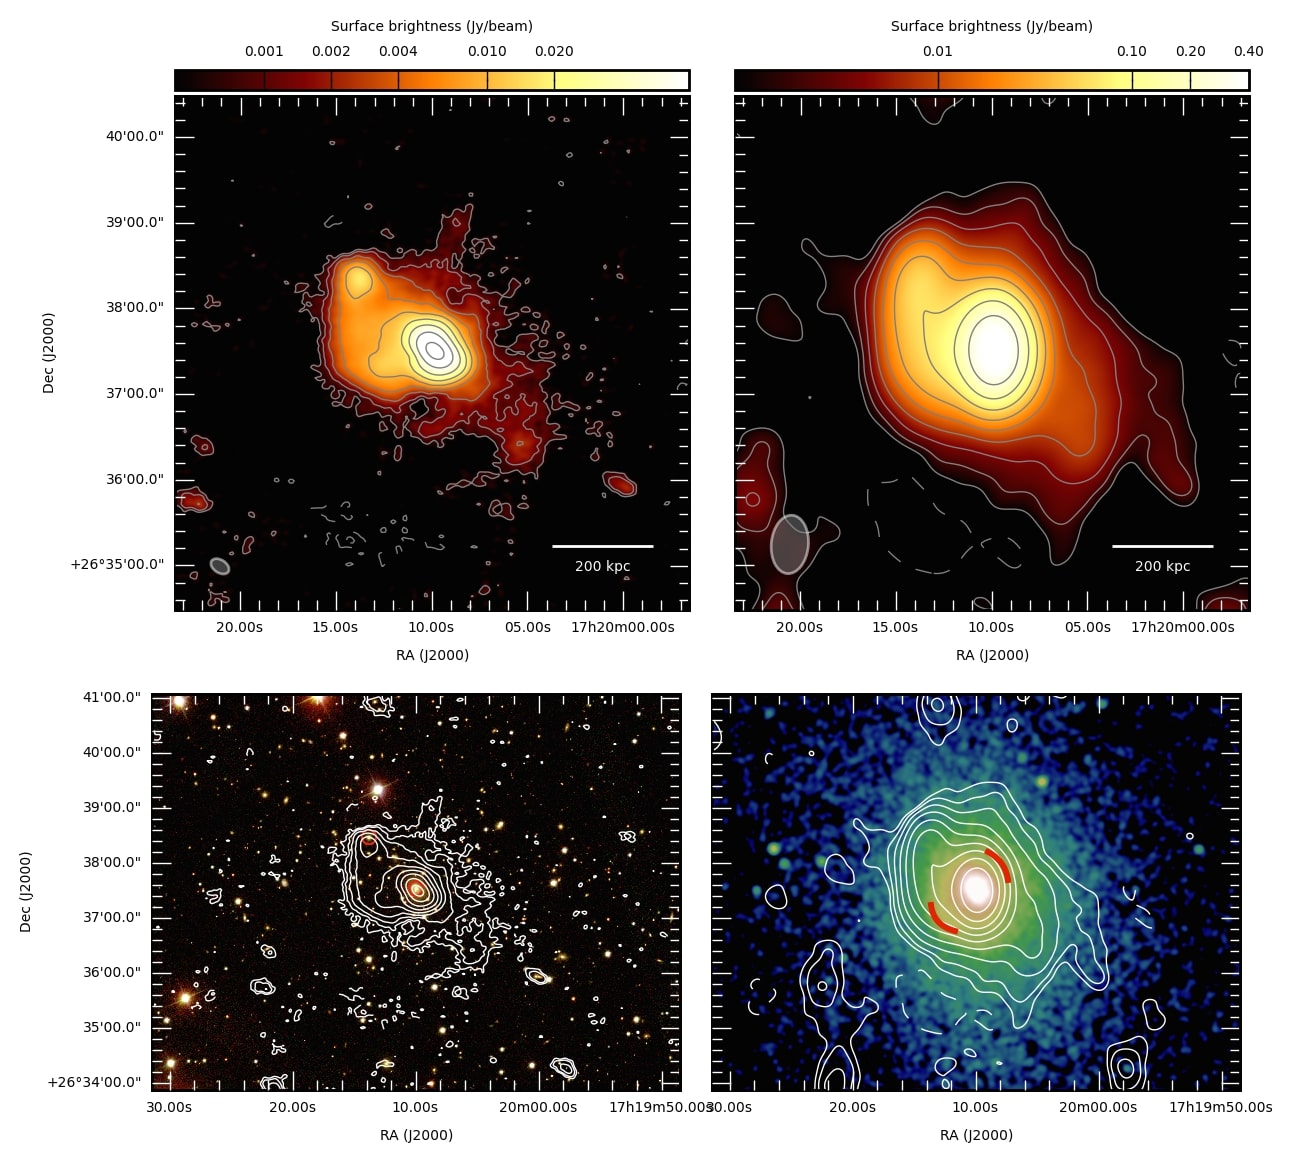
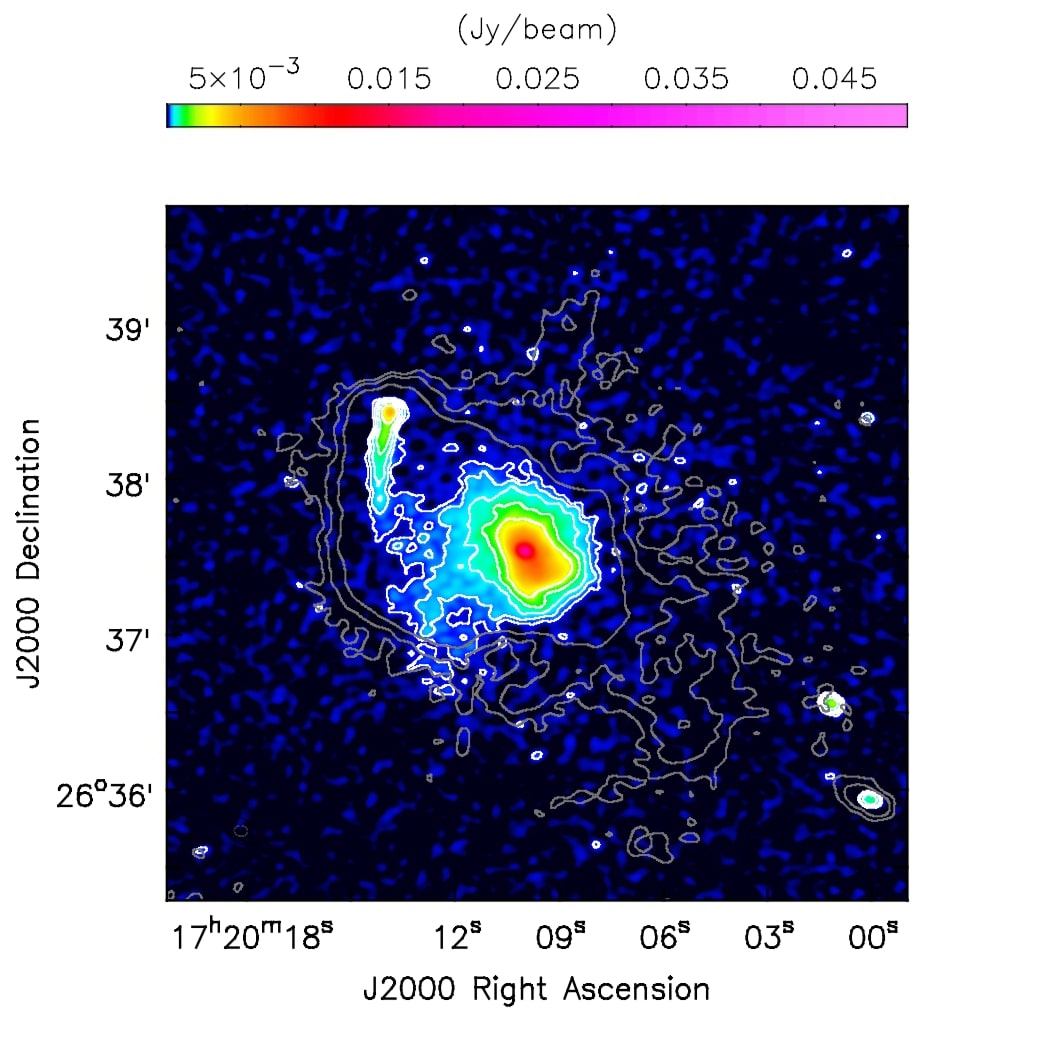
4.7 RXJ1720.1+2638
The cool-core cluster RXJ1720.1+2638 has been studied in detail by Giacintucci et al. (2014a) using VLA and GMRT observations.
The central source is classified as a mini halo consisting of a bright central component with a size of 160 kpc, and a fainter spiral-shaped tail of emission extending towards the south for more than kpc. Two cold fronts detected in the Chandra X-ray image of the cluster appear to confine the mini halo.
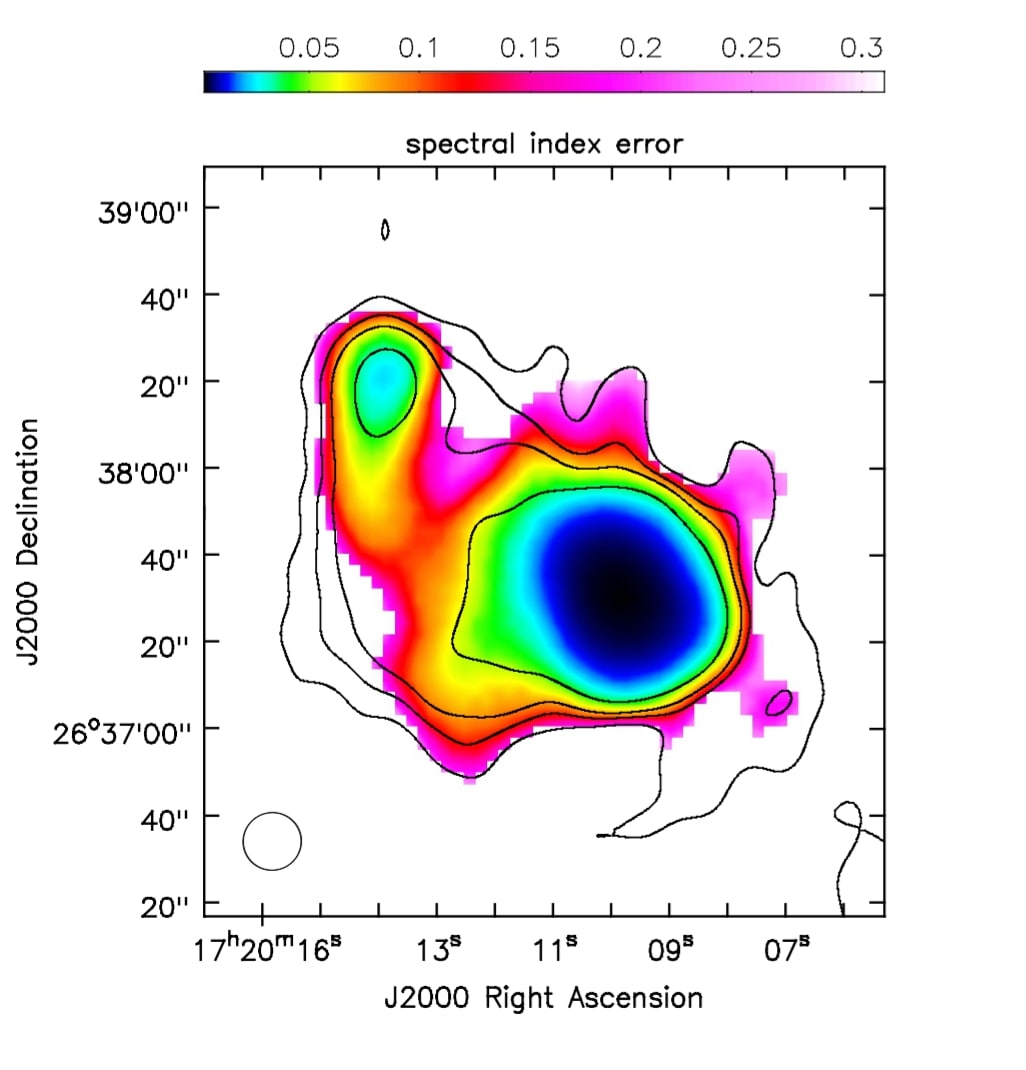
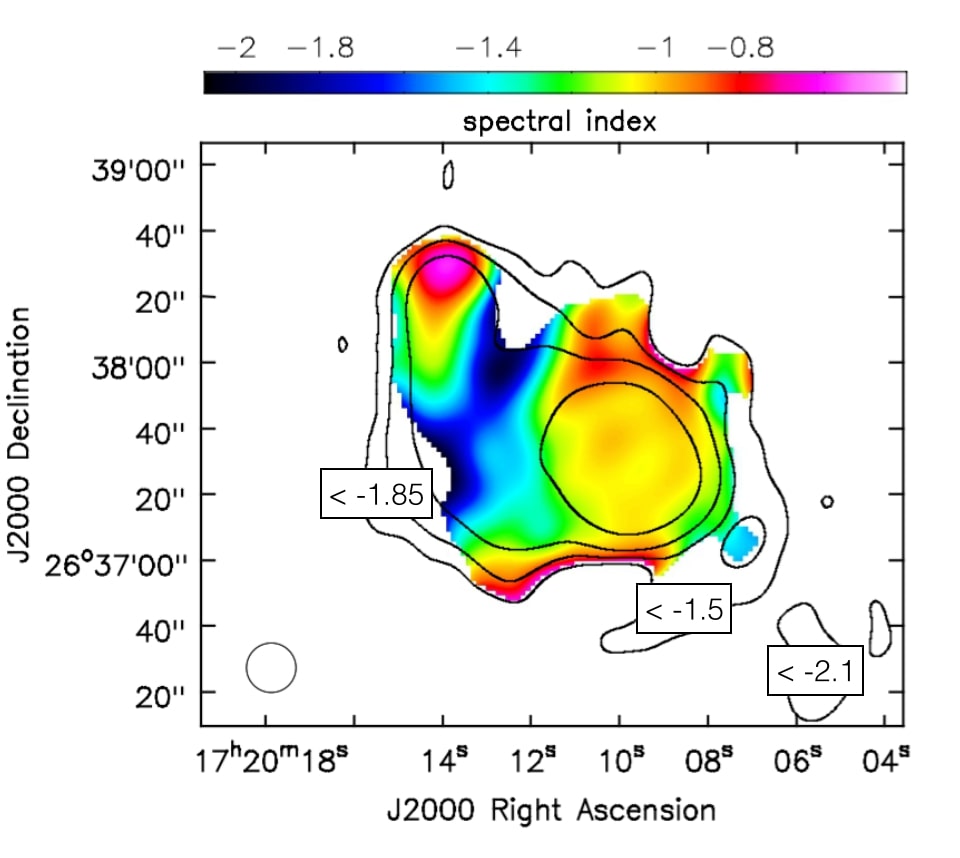
The LOFAR images, shown in Fig. 9, reveal a new diffuse component extending beyond the cold fronts, not visible at higher frequencies. The emission extends towards the south-west with an overall size of 600 kpc. We reprocessed the GMRT observation at 610 MHz and obtained the high-resolution image shown in the left panel of Fig. 10. The head-tail radio galaxy to the north-east of the cluster is clearly visible and a connection between the central diffuse emission and the tail is already seen at this frequency. We re-imaged the LOFAR and GMRT data sets with a Gaussian taper of 20′′ and with the same pixel size, baseline range (200 - 40000), and uniform weighting scheme to minimise the differences in the uv-coverage of the two observations and obtained a spectral index map that is shown in the right panel of Fig. 10. The mini halo appears to have a constant spectrum with a spectral index of , whilst the head-tail radio galaxy has the typical trend of an active radio galaxy with a flat core and a steepening along the tail. The emission connecting the tail and the mini halo is steep, ranging between -1.4 and -1.8. The cluster-scale diffuse emission, which cannot be seen at 610 MHz, is ultra steep, and we can only provide upper limits, as shown in Fig. 10, using the mean flux density from the LOFAR image and the rms noise from the GMRT image. The radio emission in RXJ1720.1+2638 resembles that of PSZ1G139.61+24 (Savini et al. 2018a) with an inner, flatter component in the form of the already-known mini halo, and an outer part with a steeper-spectrum halo-like emission on larger scales, with -1.5. The two inner cold fronts (reported in the X-ray image of Fig. 9) appear to separate the two components. Interestingly, the cluster A2142 (Venturi et al. 2017) also shows a two-component emission, and the presence of cold fronts both in the inner and outer region. However, because of the scarcity of X-ray counts in the outer cluster regions, we are not able to search for cold fronts on a larger scale.
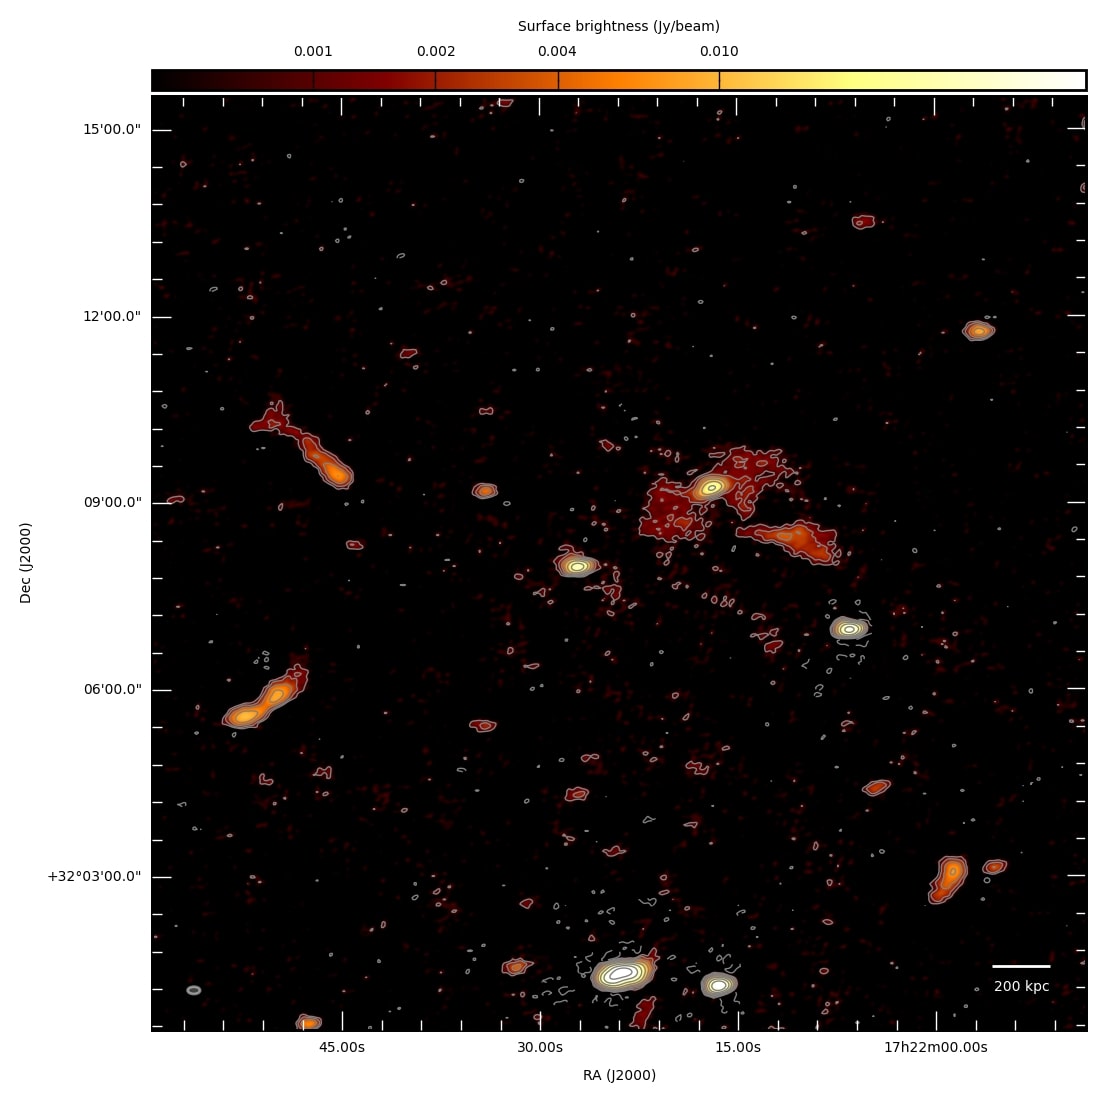
4.8 A2261
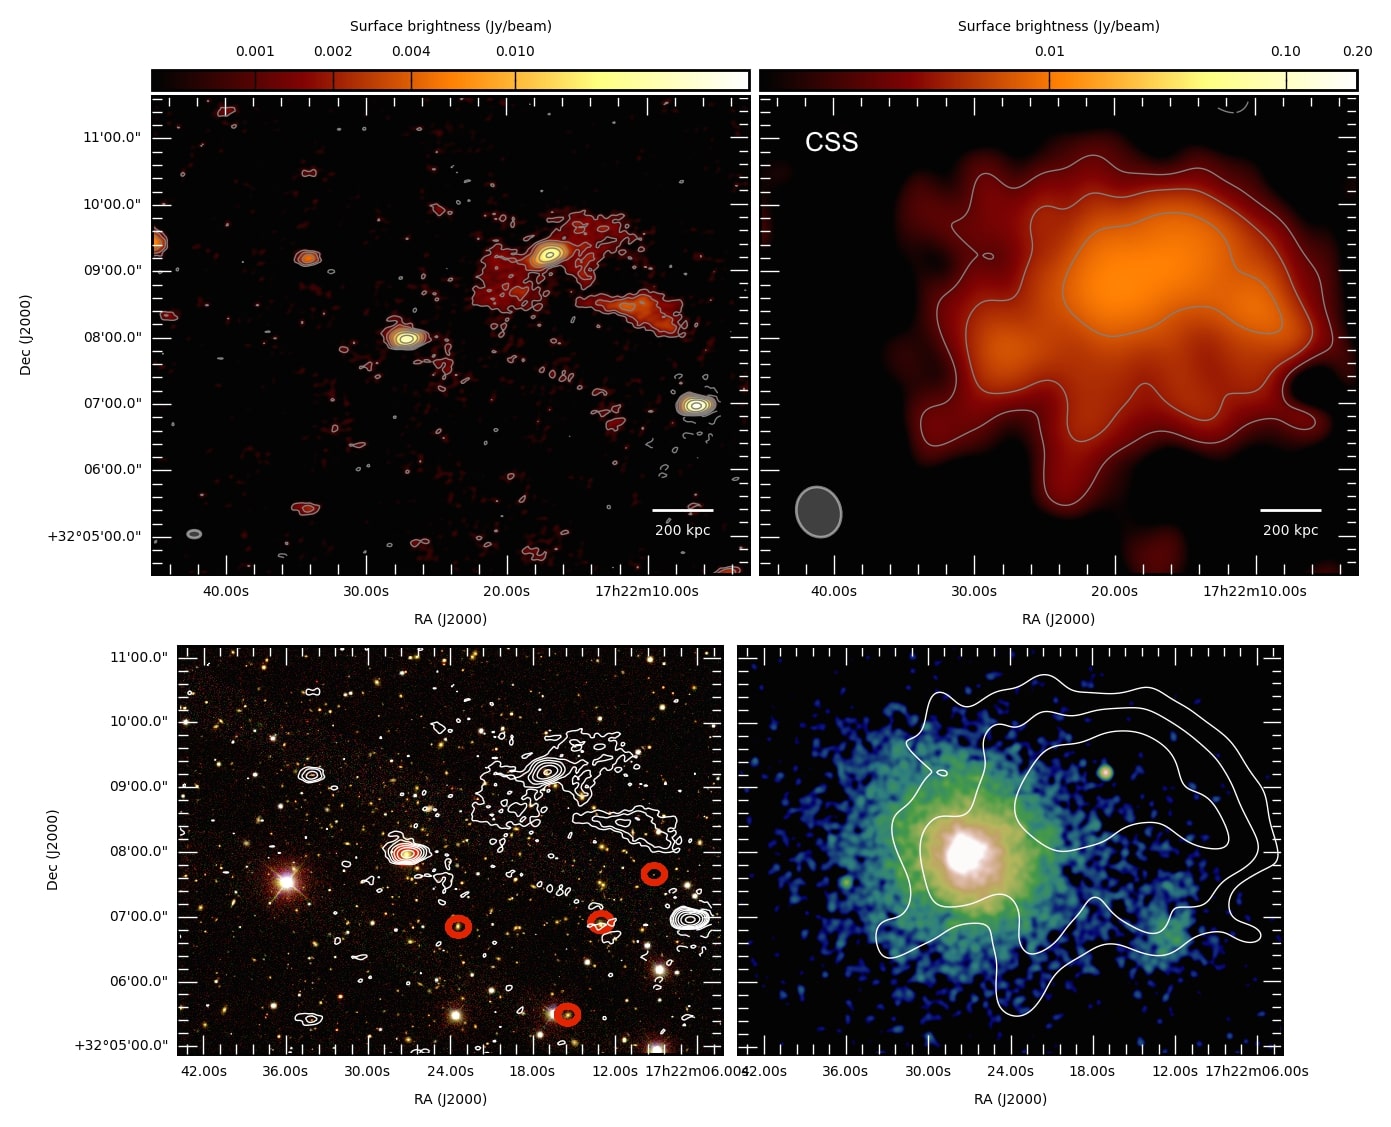
A2261 is a non-cool-core cluster with a central radio source coincident with the BCG. The cluster has a relaxed morphology in X-rays in the central 500 kpc-radius region, while showing a diffuse patch of X-ray emission towards the west of the cluster; this is likely an infalling group, which suggests a possible minor merger (von der Linden et al. 2014). Sommer et al. (2017) found a centrally located diffuse component on a scale of 1 Mpc using VLA observations at 1.4 GHz and classified the large-scale source as a radio halo.
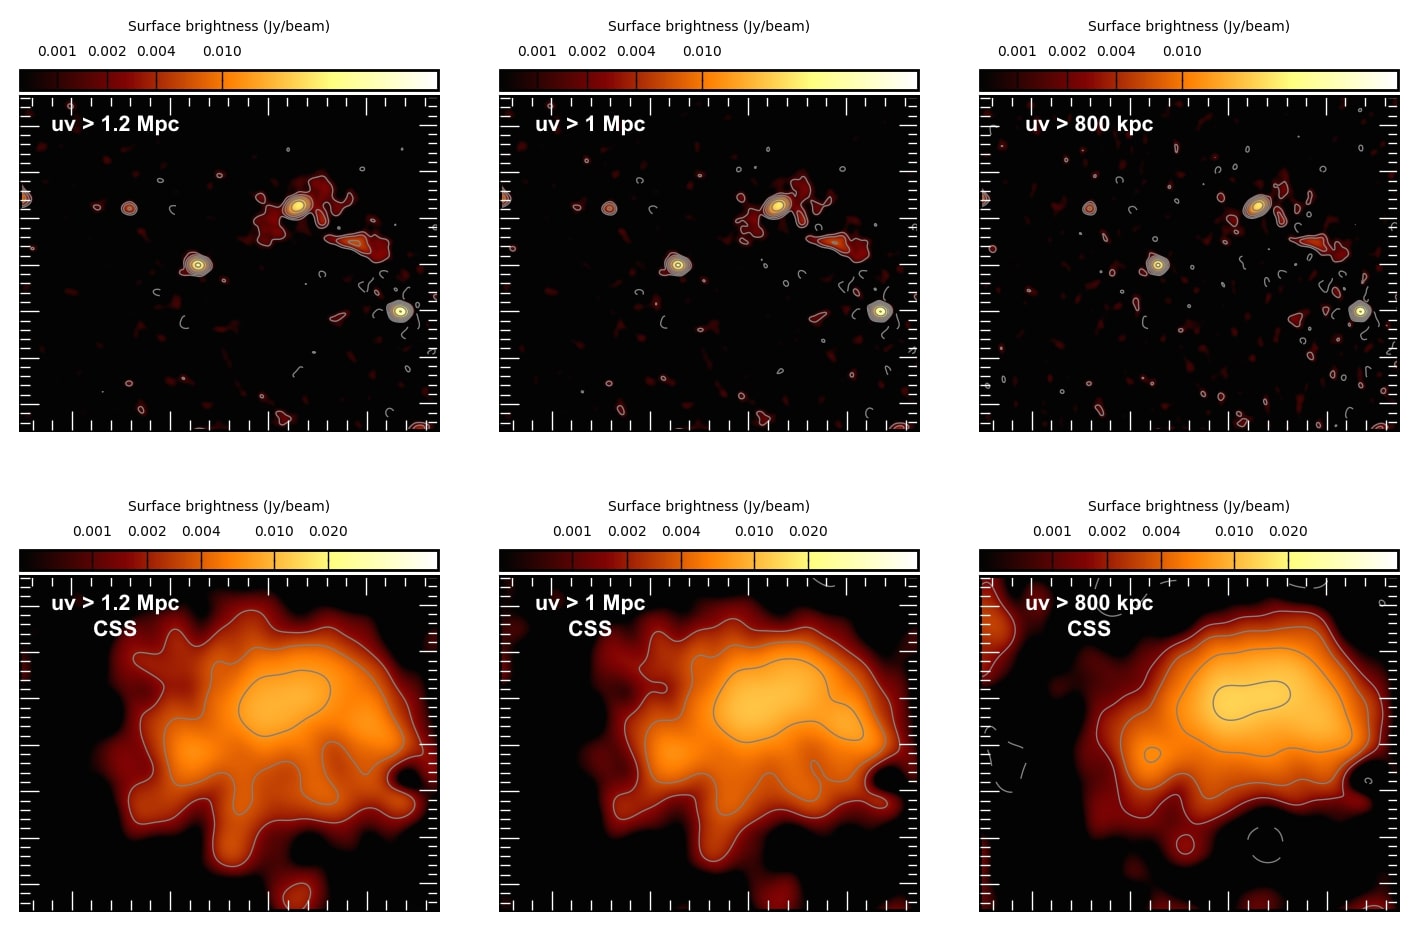
The high-resolution LOFAR image (left panel of Fig. 11) shows the presence of a central compact radio source and a radio galaxy located at 540 kpc towards the north-west of the cluster centre; this radio galaxy has a faint, diffuse emission, symmetric with respect to its core, which could be the two remnant radio lobes. The core is identified with an X-ray source and an optical galaxy whose redshift is unknown. At the cluster redshift, the radio galaxy would extend up to 590 kpc. A patch of diffuse radio emission with no clear origin, which might be a relic or a dying AGN, is seen to the west of the cluster centre. After modelling these compact sources using only the longer baselines with a uv-cut of (that corresponds to 1 Mpc), we subtracted their contribution, revealing the presence of diffuse emission extending up to 1.2 Mpc. In general, the uv-subtraction method is not indicated for extended sources and in this case the remaining contribution of the diffuse lobes of the radio galaxy can be clearly seen. This affects the morphology of the diffuse emission that shows the brightness peak and an extension at the location of the radio galaxy and the unknown patch of diffuse emission. We note that the image obtained by Sommer et al. (2017) (Fig. 2) shows a different morphology of the large-scale diffuse source, which is likely due to the result of the uv-subtraction at a different frequency. For instance, the fact that the radio galaxy lobes are better subtracted might be related to their probable steep spectrum that contributes at high frequencies to a much smaller extent compared to what is observed at low frequencies. However, the radio source as seen at 144 MHz extends on a larger scale than the single radio sources, around the cluster centre, and also towards west and south-west, where the patch of X-ray emission is located, which might indicate a minor merger. This could also explain the offset between radio and X-ray emission peaks, also visible in the 1.4 GHz image.
We obtained images using different uv-cut for subtraction corresponding to 800 kpc, 1 Mpc, and 1.2 Mpc. We show in Fig. 20 in the Appendix, models, and resulting images. Although the uv-subtraction is not entirely reliable as for the case of a compact point source, we can state that diffuse emission that is not related to the radio galaxy is clearly visible. Hence, the LOFAR image at 144 MHz confirms the presence of a radio halo, as suggested by the VLA observation at 1.4 GHz, although its morphology and radio power are hard to determine. We estimate the contribution of the flux densities of the radio galaxy and unknown patch of emission, re-imaging the LOFAR uv-subtracted data set with the same taper and weighting scheme used for the halo (Fig.11 in the paper), keeping, in addition, the uv-cut of used for modelling the single sources. Subtracting this value of mJy from the total flux density of the large-scale diffuse emission that is 185 mJy; the radio halo has 165 mJy corresponding to a total radio power at 144 MHz of W Hz-1.
Considering the total flux density at 240 MHz, 610 MHz, and 1.4 GHz reported in Tab. 3 in Sommer et al. (2017), we can provide an approximate estimate of the spectral index of the halo including LOFAR measurements to be , which makes the radio halo in A2261 a candidate USS halo.
| Name | LOFAR class. | Notes | |||
|---|---|---|---|---|---|
| (kpc) | (mJy) | ( W Hz-1) | |||
| RXCJ0142.0+2131 | H | 570 | new H discovered | ||
| A478 | uncertain | - | - | - | no diffuse emission |
| PSZ1G139.61+24 | MH+USSH | 550 | 4 | MH: 3 W Hz-1, USSH: 4 W Hz-1 | |
| A1413 | MH | 210 | MH confirmed | ||
| A1423 | UL | - | mock H injection; W Hz-1 () | ||
| A1576 | UL | - | mock H injection; W Hz-1 () | ||
| RXJ1720.1+2638 | MH+USSH | 600 | MH: 64 W Hz-1, USSH: 8 W Hz-1 | ||
| A2261 | H | 1200 | H confirmed | ||
| A2390 | uncertain | 1100 | - | - | 600 kpc-central double radio galaxy |
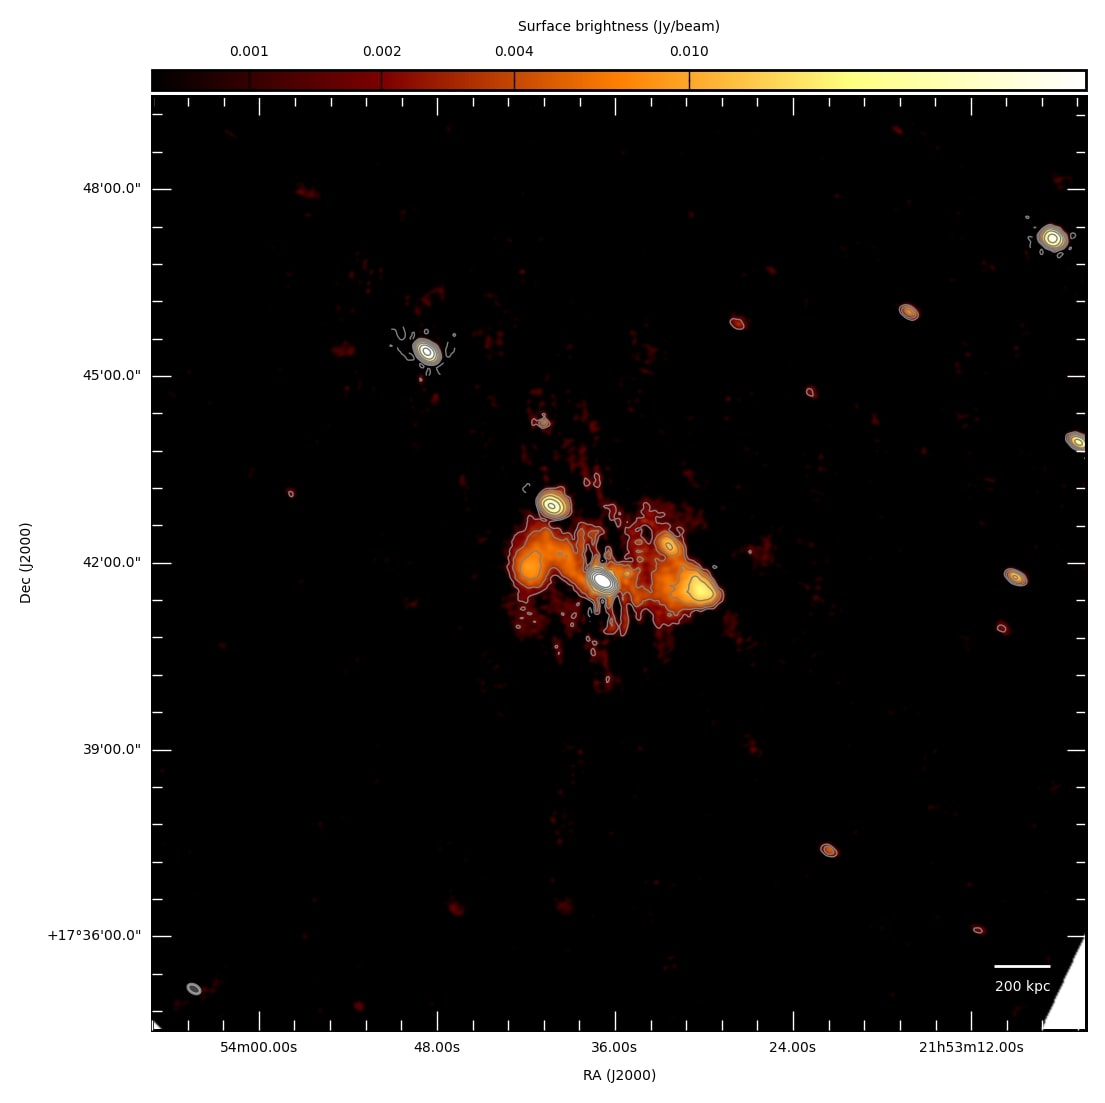
4.9 A2390
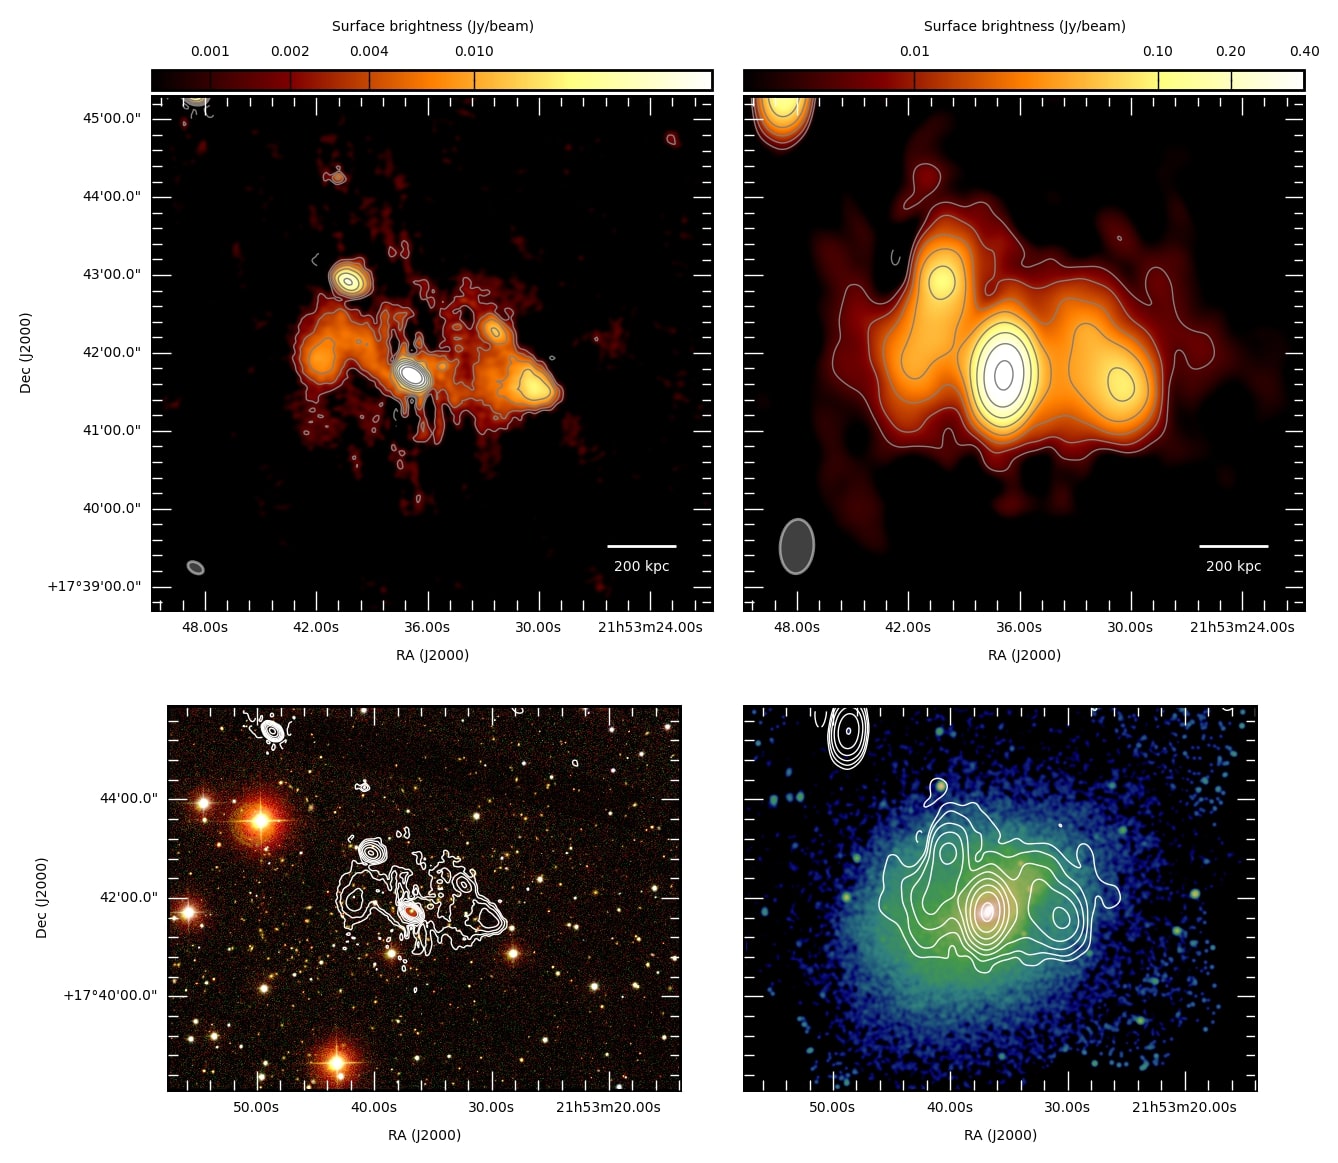
The cool-core cluster A2390 is particularly interesting for its large mass (), which sets it apart from the other clusters in the sample (see top left panel of Fig. 15). A2390 has been observed at 1.4 GHz with the VLA. The data were analysed by Bacchi et al. (2003), who classified the detected emission as a mini halo with an integrated flux density of mJy and an extension of 550 kpc. Using deeper Jansky VLA observations in the 1-2 GHz frequency band and re-analysing the VLA observation in Bacchi et al. (2003), Sommer et al. (2017) discovered diffuse radio emission on a larger scale extending for 800 kpc in the form of a radio halo, after subtracting the compact source contribution. A spectral in-band analysis was also performed, finding a steep spectrum of .
Our high-resolution LOFAR image shows that the central radio source is a double radio galaxy with the lobes extending in the east-west axis for 600 kpc. The morphology indicates the presence of a bright core and fading lobes. Radio galaxies of such a size are not common at the centre of clusters, where the ICM usually prevents the expansion of the lobes to such large scales. The absence of emission in the north-south axis around the galaxy core had already been pointed out in previous works by Bacchi et al. (2003) and Sommer et al. (2017). We note that there are some imaging artefacts due to the imperfect calibration of the galactic core that is brighter than the diffuse lobes and causes the image sensitivity to be limited by the dynamic range. The low-resolution LOFAR image shows the presence of diffuse emission on a larger scale with a total extension of Mpc.
The lowest contour of the low-resolution image might still be interpreted as cluster-scale diffuse emission or old lobes emission. It is not possible to disentangle this emission from that of the fading lobes of the radio galaxy, neither it is possible to accurately subtract its core to search for the presence of an underlying radio halo. Hence, we can only conclude that the radio emission is mostly dominated by the contribution of the radio galaxy whose morphology is clearly visible with LOFAR.
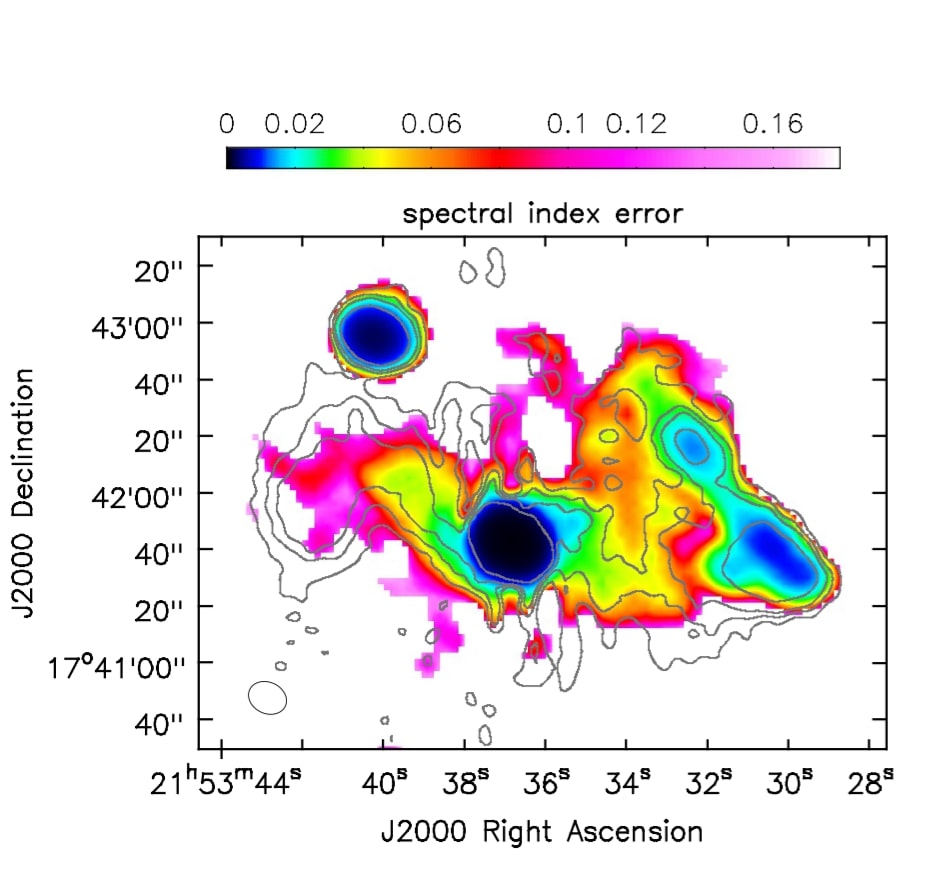
In the left panel of Fig. 13, we show the image of the VLA data set that was calibrated in Sommer et al. (2017). We re-imaged this data set to match666In this case we did not apply a uv-cut and the uniform weighting parameter (as we did for the spectral analysis of A2261) because this would prevent us from recovering the morphology of the diffuse lobes. However, we note that the shortest baselines of the VLA and LOFAR observations are able to detect large-scale emission up to few arcminutes, larger than the emission in A2390. the LOFAR imaging parameters, such as cell size and resolution, and obtain the spectral index map shown in the right panel of Fig. 13. The core appears to have a flat spectrum with -0.5, which is a typical value for the core of an active radio galaxy, whilst the lobes are much steeper with ranging between -1.3 and -2. We can speculate on the type and evolutionary phase of the radio galaxy. It could be an FR-II radio galaxy that has recently restarted (which would explain the flat core), still showing old lobes and relic hotspots from a previous activity cycle (e.g. Shulevski et al. 2015, Brienza et al. 2016). Interestingly, Augusto et al. (2006) classified the radio galaxy of A2390 as an FR-II with a flat-spectrum core and a compact twin-jet structure in a north–south direction on a sub-arcsec scale, as seen in the 1.7 - 43 GHz frequency range with very long baseline interferometry (VLBI) observations. They also note that the orientation of the jets is misaligned with respect to the ionisation cones and dust disc of the host galaxy on larger scales. They suggest that the misalignment might be due to a precession of the central super massive black hole, and that the radio source might be an example of a bubble being blown into the ICM at its early stage ( yr duration). This is in line with our interpretation that the east-west jets are originated by a previous AGN active phase. The AGN might then be experiencing a second episode of activity with the jets growing in the north-south direction after a precession. With this scenario we expect the presence of X-ray cavities and bubbles. Four inner cavities are found by Sonkamble et al. (2015) and coincide with the location of the inner jets (east-west and north-south). Further cavities on large scales at the location of the old lobes are also expected and could be searched in future studies.
5 Discussion
On the basis of the X-ray morphology, the nine clusters presented in this work are not currently undergoing a major merger. As shown in the top panels of Fig. 15, five of these clusters host a cool core, whilst the remaining host a warm core, according to the classification based on the central gas entropy value (Giacintucci et al. 2017). The overall picture as seen in the low-frequency radio band by LOFAR is very diverse with the presence of radio diffuse emission in the form of two radio haloes, three mini haloes, and two uncertain cases, while two clusters do not host diffuse emission at all. Even though the sample we studied is not large enough to derive statistical results, we note that this is the largest sample of galaxy clusters studied within LoTSS, and we can draw a number of conclusions that can also be indicative for future low-frequency observations. In our sample, the diffuse radio emission appears to be uncorrelated with the dynamical state as indicated by the centroid shifts, , of the X-ray emission computed at kpc. Even looking at on smaller scales, from 200 to 500 kpc, as shown in the bottom left panel of Fig. 15, no correlation between the radio emission and is found. Clusters that possess similar dynamical properties do not show the same radio properties, for example the non-cool-core clusters RXC0142.0+2131 and A1576, which have similar X-ray properties (relaxed morphology, comparable and ) and also comparable cluster masses, host a radio halo and no diffuse emission, respectively. Also plotting the power at 144 MHz versus the ratio of the X-ray concentration parameter, , to (see bottom right panel of Fig. 15) does not reveal a clear connection between the radio emission and the dynamical state of the cluster. Haloes are not necessary found in clusters with low and high ; see for example A2261.
In the top right panel of Fig. 15, we plot versus for each cluster. Two-component radio haloes (MH+USSH) are found in clusters with high and low , while giant haloes are detected in clusters with low and higher . Clusters for which no radio emission is found at the sensitivity level of these observations are found in both sides of the plot. Finally, a mini halo, which is the only mini halo found in a non-cool-core cluster that is also in the sample studied in Giacintucci et al. (2017), is found in a cluster with low and high .
Our observations show that the two clusters, PSZ1G139.61+24 and RXJ1720.1+2638, that host a mini halo and have the largest value of , also show larger-scale ultra-steep diffuse emission that extends beyond the cold fronts. In our sample, the only mini halo that is confined to the central region of a cluster is hosted by A1413, which is not a cool-core cluster. This might indicate that the presence of a dense cool core is required to initiate the re-acceleration of CRe in the regions surrounding the core through gas sloshing triggered by a minor merger, as suggested for PSZ1G139.61+24 by Savini et al. (2018a). The observation that mini haloes can have a flatter core that is surrounded by a faint, steep corona is helpful in resolving their origin. A contribution from hadronic collisions cannot be excluded for the central region of cool-core clusters, but this contribution cannot explain the large-scale ultra-steep emission (e.g. Brunetti et al. 2008, Macario et al. 2010). Hence, different scenarios for the cosmic-ray origin might co-exist in these clusters that show hints of gas sloshing, with a distinction between the region within and outside the core.
In our sample, no giant radio haloes in cool-core clusters are found. A2261 and RXC0142.0+2131, where haloes are found, do not host a cool core and the extended emission in A2390 is likely to merely originate from the central radio galaxy, whose very diffuse lobes could have accidentally been classified as a halo at 1.4 GHz in Sommer et al. (2017). We also note that both A2261 and RXC0142.0+2131 show traces of the occurrence of minor mergers. However, the non-cool-core cluster A1576, which presents hints of a minor merger, does not host diffuse emission.
Many head-tail radio galaxies have been observed in the cluster environment, however a clear connection with the central diffuse emission is only seen in the case of RXJ1720.1+2638, where the tail might provide seed electrons for re-acceleration.
5.1 Limits on cosmic-ray protons
In this section, we aim to use some of our results to constrain the energy density of relativistic protons in the ICM by computing the maximum possible radio emission that can originate from hadronic collisions (Blasi & Colafrancesco 1999; Dolag & Enßlin 2000). We use a similar albeit more complicated procedure as in Brunetti et al. (2007), which we describe in the following.
The total admissible energy density of cosmic rays is given by requiring that this radio emission does not exceed our upper limit, given a model for the thermal gas pressure and the magnetic fields.
In this work, we place new upper limits on the radio power for the clusters A1576 and A1423. While the new upper limit for A1576 is comparable to the value previously derived in literature, for A1423 we were able to obtain a limit that is almost a factor of two deeper. Hence, we created a model for the gas density and temperature of A1423 following Ghirardini et al. (2018), who presented best-fit formulas for the thermodynamical properties of cool-core and non-cool-core clusters based on the analysis of a sample of clusters observed with XMM-Newton. We rescaled the values to the cluster mass and temperature777We used the core-excised temperature given by Giacintucci et al. (2017). of A1423, and keV.
We assumed that the magnetic field in A1423 is similar to the best-fit 3D model of the magnetic field in the Coma cluster presented in Bonafede et al. (2010) owing to the similarity in the cluster total mass. We generated a power-law distribution of the magnetic vector potential in Fourier space for a grid with a fixed resolution of kpc that is randomly drawn from the Rayleigh distribution. The magnetic field in real space follows , which ensures that by construction.
As in Coma, we assumed that the maximum coherence scale of the field is 40 kpc, the power law of fluctuations exhibits a Kolmogorov spectrum and the average magnetic field strength in the centre is G. The volume-averaged magnetic field within a radius equal to (i.e. the radius used for the upper limit,
kpc for A1423) is G.
To be self-consistent with the profile of the mock halo that we injected, we assumed that the ratio of the spatial distribution of the cosmic-ray energy density, , over the gas energy density profile, , is
where the index indicates the ratio computed at the cluster centre, and is a shape parameter that allows for the non-linear scaling between cosmic rays and gas matter, as in Donnert et al. (2010) and Brunetti et al. (2012). We fixed based on the requirement that the profile of the simulated radio emission within 1 (see below) matches the input halo model used in Sec. 4.5. We also imposed that the ratio is no larger than 0.1.
The radio emission from hadronic collisions was derived following Pfrommer & Enßlin (2004), i.e. assuming a Dermer model to compute the cross section of the proton-proton interaction, and integrating the CRp population from GeV to GeV for a particle spectrum of , corresponding to a radio spectral index of -1.3. Finally, we projected the emission and measured the flux density within a radius from the cluster centre, and compared it to the upper limit we derived from the LOFAR observation of A1423.
Through this procedure, we find that yields , averaged on the volume of a sphere of radius .
A comparison with the limit derived from the lack of hadronic -ray emission reported by the Fermi satellite for a sample of galaxy clusters (e.g. Ackermann et al. 2014) is not straightforward, and would require, for instance, a more detailed treatment of the cosmic-ray energy density distribution. However, we note that the limit we derived is of the same order of magnitude. Our constrain demonstrates the great potential of future, deeper LOFAR observations to constrain the energy budget of CRp in the ICM.
6 Summary
In this paper, we have presented the results of the largest campaign of LOFAR observations targeting galaxy clusters so far. The mass-selected sample consists of clusters with no sign of major mergers observed in the frequency range between 120 MHz and 168 MHz. Data reduction was performed following the facet calibration scheme. Below we summarise our main results:
-
1.
We find central, diffuse emission in the form of mini haloes surrounded by USS haloes in the cool-core clusters RXJ1720.1+2638 and PSZ1G139.6+24. Hence, we argue that the sloshing of the dense core after a minor merger can be responsible for the formation, not only of a central mini halo, but also of larger-scale emission that is visible at low radio frequencies. Moreover, the presence of a cool core, indicated by high values of the concentration parameter, , and low values of the central entropy, , might be significant for the formation of radio diffuse emission on scales larger than the cluster core that hosts a mini halo.
-
2.
We confirm the presence of a mini halo in the non-cool-core cluster A1413 as proposed by Govoni et al. (2009).
-
3.
We discover a radio halo in the non-cool-core cluster RXCJ0142.0+2131 with a scale of kpc and a spectral index of .
-
4.
We confirm the presence of a radio halo in the non-cool-core cluster A2261 as proposed by Sommer et al. (2017).
-
5.
The central radio galaxy discovered in the massive cool-core cluster A2390 might account for most or even all the radio flux that was attributed to the giant radio halo proposed by Sommer et al. (2017); high-resolution observations in the frequency range between 144 GHz and 1.4 GHz are needed to confirm the morphology of the two radio jets and lobes and exclude the presence of the giant radio halo.
-
6.
At LOFAR frequencies no centrally-located diffuse emission is observed in the cool-core cluster A478. We injected a mock mini halo, and placed a limit on the spectrum, i.e. .
-
7.
No cluster-scale diffuse radio emission is found in the cluster A1576 and in the cool-core cluster A1423 at the sensitivity of the observations, hence we derive new upper limits on the total radio power.
-
8.
We use the limit on the radio power of A1423 to constrain the energy budget of CRp in the ICM and compare the result with the constraints derived from the lack of hadronic -ray emission reported by the FERMI satellite. We find that our LOFAR observations are competitive with the deepest limits derived by FERMI for the Coma cluster.
-
9.
We discover head-tail radio galaxies in the clusters A1423 and A1413. We note also the presence of head-tail radio galaxies in A478, and in RXJ1720.1+2638, where the tail appears to be connected to the central source, and it might be a possible source of seed particles that can be re-accelerated.
-
10.
No giant radio haloes in the cool-core clusters of our sample are found.
Low-frequency radio observations are ideal for discovering diffuse emission, in particular steep-spectrum emission from low-energy CRe in galaxy clusters. Future studies performed on a larger sample of clusters will provide statistical information and help to further investigate the connection between the formation of radio emission from the ICM and its dynamical state.
Acknowledgements.
This paper is based (in part) on data obtained with the International LOFAR Telescope (ILT) under the project codes listed in Tab.2. LOFAR (van Haarlem et al. 2013) is the LOw Frequency ARray designed and constructed by ASTRON. It has observing, data processing, and data storage facilities in several countries, which are owned by various parties (each with their own funding sources) and are collectively operated by the ILT foundation under a joint scientific policy. The ILT resources have benefitted from the following recent major funding sources: CNRS-INSU, Observatoire de Paris and Université d’Orléans, France; BMBF, MIWF-NRW, MPG, Germany; Science Foundation Ireland (SFI), Department of Business, Enterprise and Innovation (DBEI), Ireland; NWO, The Netherlands; The Science and Technology Facilities Council, UK; Ministry of Science and Higher Education, Poland. Part of this work was carried out on the Dutch national e-infrastructure with the support of the SURF Cooperative through grant e-infra 160022 & 160152. The LOFAR software and dedicated reduction packages on https://github.com/apmechev/GRID_LRT were deployed on the e-infrastructure by the LOFAR e-infragroup, consisting of J. B. R. Oonk (ASTRON & Leiden Observatory), A. P. Mechev (Leiden Observatory) and T. Shimwell (Leiden Observatory) with support from N. Danezi (SURFsara) and C. Schrijvers (SURFsara).This research made use of the NASA/IPAC Extragalactic Database (NED), which is operated by the Jet Propulsion Laboratory, California Institute of Technology, under contract with the National Aeronautics and Space Administration.
A. Bonafede acknowledges support from the ERC-StG grant DRANOEL, n. 714245. F. Vazza acknowledges financial support from the ERC Starting Grant MAGCOW, no.714196. H. Rottgering and R. van Weeren acknowledge support from the ERC Advanced Investigator programme NewClusters 321271 and the VIDI research programme with project number 639.042.729, which is financed by the Netherlands Organisation for Scientific Research (NWO). F. de Gasperin is supported by the VENI research programme with project number 1808, which is financed by the Netherlands Organisation for Scientific Research (NWO). A. Drabent acknowledges support by the BMBF Verbundforschung under the grant 05A17STA.
References
- Ackermann et al. (2014) Ackermann, M., Ajello, M., Albert, A., et al. 2014, ApJ, 787, 18
- Augusto et al. (2006) Augusto, P., Edge, A. C., & Chandler, C. J. 2006, MNRAS, 367, 366
- Bacchi et al. (2003) Bacchi, M., Feretti, L., Giovannini, G., & Govoni, F. 2003, A&A, 400, 465
- Barr et al. (2006) Barr, J., Jørgensen, I., Chiboucas, K., Davies, R., & Bergmann, M. 2006, ApJ, 649, L1
- Becker et al. (1995) Becker, R. H., White, R. L., & Helfand, D. J. 1995, ApJ, 450, 559
- Blasi & Colafrancesco (1999) Blasi, P. & Colafrancesco, S. 1999, Astropart. Phys., 122, 169
- Böhringer et al. (2010) Böhringer, H., Pratt, G. W., Arnaud, M., et al. 2010, A&A, 514, A32
- Bonafede et al. (2017) Bonafede, A., Cassano, R., Brüggen, M., et al. 2017, MNRAS, 470, 3465
- Bonafede et al. (2010) Bonafede, A., Feretti, L., Murgia, M., et al. 2010, A&A, 513, A30
- Bonafede et al. (2014) Bonafede, A., Intema, H. T., Brüggen, M., et al. 2014, MNRAS, 444, L44
- Botteon et al. (2017) Botteon, A., Gastaldello, F., & Brunetti, G. 2017, ArXiv e-prints [arXiv:1707.07038]
- Brienza et al. (2016) Brienza, M., Morganti, R., Shulevski, A., Godfrey, L., & Vilchez, N. 2016, Astronomische Nachrichten, 337, 31
- Briggs (1995) Briggs, D., S. 1995, New Mexico Institute of Mining Technology, Socorro, New Mexico, USA
- Brunetti et al. (2012) Brunetti, G., Blasi, P., Reimer, O., et al. 2012, MNRAS, 426, 956
- Brunetti et al. (2008) Brunetti, G., Giacintucci, S., Cassano, R., et al. 2008, Nat, 455, 944
- Brunetti & Jones (2014) Brunetti, G. & Jones, T. W. 2014, International Journal of Modern Physics D, 23, 1430007
- Brunetti et al. (2007) Brunetti, G., Venturi, T., Dallacasa, D., et al. 2007, ApJ, 670, L5
- Buote (2001) Buote, D. A. 2001, ApJ, 553, L15
- Cassano et al. (2016) Cassano, R., Brunetti, G., Giocoli, C., & Ettori, S. 2016, A&A, 593, A81
- Cassano et al. (2006) Cassano, R., Brunetti, G., & Setti, G. 2006, MNRAS, 369, 1577
- Cassano et al. (2007) Cassano, R., Brunetti, G., Setti, G., Govoni, F., & Dolag, K. 2007, MNRAS, 378, 1565
- Cassano et al. (2008) Cassano, R., Brunetti, G., Venturi, T., et al. 2008, A&A, 480, 687
- Cassano et al. (2013) Cassano, R., Ettori, S., Brunetti, G., et al. 2013, ApJ, 777, 141
- Cassano et al. (2010) Cassano, R., Ettori, S., Giacintucci, S., et al. 2010, ApJ, 721, L82
- Chandra et al. (2004) Chandra, P., Ray, A., & Bhatnagar, S. 2004, ApJ, 612, 974
- Cuciti et al. (2015) Cuciti, V., Cassano, R., Brunetti, G., et al. 2015, A&A, 580, A97
- Dahle et al. (2002) Dahle, H., Kaiser, N., Irgens, R. J., Lilje, P. B., & Maddox, S. J. 2002, ApJS, 139, 313
- de Gasperin et al. (2017) de Gasperin, F., Intema, H. T., Shimwell, T. W., et al. 2017, ArXiv e-prints [arXiv:1710.06796]
- Dolag & Enßlin (2000) Dolag, K. & Enßlin, T. A. 2000, A&A, 362, 151
- Donnert et al. (2010) Donnert, J., Dolag, K., Brunetti, G., Cassano, R., & Bonafede, A. 2010, MNRAS, 401, 47
- Feretti et al. (2012) Feretti, L., Giovannini, G., Govoni, F., & Murgia, M. 2012, A&A Rev., 20, 54
- Ghirardini et al. (2018) Ghirardini, V., Eckert, D., Ettori, S., et al. 2018, ArXiv e-prints [arXiv:1805.00042]
- Giacintucci et al. (2014a) Giacintucci, S., Markevitch, M., Brunetti, G., et al. 2014a, ApJ, 795, 73
- Giacintucci et al. (2017) Giacintucci, S., Markevitch, M., Cassano, R., et al. 2017, ApJ, 841, 71
- Giacintucci et al. (2014b) Giacintucci, S., Markevitch, M., Venturi, T., et al. 2014b, ApJ, 781, 9
- Gitti et al. (2002) Gitti, M., Brunetti, G., & Setti, G. 2002, A&A, 386, 456
- Gitti et al. (2007) Gitti, M., Ferrari, C., Domainko, W., Feretti, L., & Schindler, S. 2007, A&A, 470, L25
- Govoni et al. (2009) Govoni, F., Murgia, M., Markevitch, M., et al. 2009, A&A, 499, 371
- Haslam et al. (1995) Haslam, C. G. T., Salter, C. J., Stoffel, H., & Wilson, W. E. 1995, Astronomy Data Image Library
- Intema et al. (2017) Intema, H. T., Jagannathan, P., Mooley, K. P., & Frail, D. A. 2017, A&A, 598, A78
- Kale et al. (2015) Kale, R., Venturi, T., Giacintucci, S., et al. 2015, A&A, 579, A92
- Kale et al. (2013) Kale, R., Venturi, T., Giacintucci, S., et al. 2013, A&A, 557, A99
- Lovisari et al. (2017) Lovisari, L., Forman, W. R., Jones, C., et al. 2017, ApJ, 846, 51
- Macario et al. (2010) Macario, G., Venturi, T., Brunetti, G., et al. 2010, A&A, 517, A43
- Markevitch et al. (2003) Markevitch, M., Vikhlinin, A., & Forman, W. R. 2003, in Astronomical Society of the Pacific Conference Series, Vol. 301, Matter and Energy in Clusters of Galaxies, ed. S. Bowyer & C.-Y. Hwang, 37
- Martinez Aviles et al. (2016) Martinez Aviles, G., Ferrari, C., Johnston-Hollitt, M., et al. 2016, A&A, 595, A116
- McMullin et al. (2007) McMullin, J. P., Waters, B., Schiebel, D., Young, W., & Golap, K. 2007, in Astronomical Society of the Pacific Conference Series, Vol. 376, Astronomical Data Analysis Software and Systems XVI, ed. R. A. Shaw, F. Hill, & D. J. Bell, 127
- Murgia et al. (2009) Murgia, M., Govoni, F., Markevitch, M., et al. 2009, A&A, 499, 679
- Offringa et al. (2014) Offringa, A. R., McKinley, B., Hurley-Walker, N., et al. 2014, MNRAS, 444, 606
- Pfrommer & Enßlin (2004) Pfrommer, C. & Enßlin, T. A. 2004, A&A, 413, 17
- Planck Collaboration et al. (2014) Planck Collaboration, Ade, P. A. R., Aghanim, N., et al. 2014, A&A, 571, A29
- Planck Collaboration et al. (2016) Planck Collaboration, Ade, P. A. R., Aghanim, N., et al. 2016, A&A, 594, A13
- Santos et al. (2008) Santos, J. S., Rosati, P., Tozzi, P., et al. 2008, A&A, 483, 35
- Savini et al. (2018a) Savini, F., Bonafede, A., Brueggen, M., et al. 2018a, ArXiv e-prints [arXiv:1805.01900]
- Savini et al. (2018b) Savini, F., Bonafede, A., Brüggen, M., et al. 2018b, MNRAS, 474, 5023
- Scaife & Heald (2012) Scaife, A. M. M. & Heald, G. H. 2012, MNRAS, 423, L30
- Shimwell et al. (2016) Shimwell, T. W., Luckin, J., Brüggen, M., et al. 2016, MNRAS, 459, 277
- Shimwell et al. (2017) Shimwell, T. W., Röttgering, H. J. A., Best, P. N., et al. 2017, A&A, 598, A104
- Shulevski et al. (2015) Shulevski, A., Morganti, R., Barthel, P. D., et al. 2015, A&A, 579, A27
- Sommer et al. (2017) Sommer, M. W., Basu, K., Intema, H., et al. 2017, MNRAS, 466, 996
- Sonkamble et al. (2015) Sonkamble, S. S., Vagshette, N. D., Pawar, P. K., & Patil, M. K. 2015, Ap&SS, 359, 21
- Sun et al. (2003) Sun, M., Jones, C., Murray, S. S., et al. 2003, ApJ, 587, 619
- van Haarlem et al. (2013) van Haarlem, M. P., Wise, M. W., Gunst, A. W., et al. 2013, A&A, 556, A2
- van Weeren et al. (2016a) van Weeren, R. J., Brunetti, G., Brüggen, M., et al. 2016a, ApJ, 818, 204
- van Weeren et al. (2016b) van Weeren, R. J., Williams, W. L., Hardcastle, M. J., et al. 2016b, ApJS, 223, 2
- Venturi et al. (2008) Venturi, T., Giacintucci, S., Dallacasa, D., et al. 2008, A&A, 484, 327
- Venturi et al. (2017) Venturi, T., Rossetti, M., Brunetti, G., et al. 2017, A&A, 603, A125
- von der Linden et al. (2014) von der Linden, A., Mantz, A., Allen, S. W., et al. 2014, MNRAS, 443, 1973
- Wilber et al. (2018) Wilber, A., Brüggen, M., Bonafede, A., et al. 2018, MNRAS, 476, 3415
- ZuHone et al. (2013) ZuHone, J. A., Markevitch, M., Brunetti, G., & Giacintucci, S. 2013, ApJ, 762, 78