Spitzer observations of interstellar object 1I/‘Oumuamua
Abstract
1I/‘Oumuamua is the first confirmed interstellar body in our Solar System. Here we report on observations of ‘Oumuamua made with the Spitzer Space Telescope on 2017 November 21–22 (UT). We integrated for 30.2 hours at 4.5 µm (IRAC channel 2). We did not detect the object and place an upper limit on the flux of 0.3 Jy (3). This implies an effective spherical diameter less than [98, 140, 440] meters and albedo greater than [0.2, 0.1, 0.01] under the assumption of low, middle, or high thermal beaming parameter , respectively. With an aspect ratio for ‘Oumuamua of 6:1, these results correspond to dimensions of [240:40, 341:57, 1080:180] meters, respectively. We place upper limits on the amount of dust, CO, and CO2 coming from this object that are lower than previous results; we are unable to constrain the production of other gas species. Both our size and outgassing limits are important because ‘Oumuamua’s trajectory shows non-gravitational accelerations that are sensitive to size and mass and presumably caused by gas emission. Our results extend the mystery of ‘Oumuamua’s origin and evolution.
1 Introduction
‘Oumuamua (1I/2017 U1) was discovered on 2017 October 18. One week later it was announced that ‘Oumuamua’s orbit was unbound (Bacci et al., 2017) and that this was the first ever discovered interstellar body — an object that originated outside our Solar System.
It has long been thought that comets and asteroids exist in other planetary systems. Most current models of our own Solar System suggest that today’s small bodies are leftovers from the era of planet formation (e.g., Dones et al., 2015), implying that other planetary systems also produced comet and/or asteroid populations. Until now, it has been impossible to connect our own local small body populations to the large, but unresolved, groups of comets and asteroids found in exoplanetary circumstellar disks (e.g., Lisse et al., 2007, 2017).
‘Oumuamua was the subject of an intense, though brief, observing campaign (Jewitt et al., 2017; Ye et al., 2017; Knight et al., 2017; Bannister et al., 2017; Meech et al., 2017; Masiero, 2017; Bolin et al., 2018; Fitzsimmons et al., 2018; Belton et al., 2018; Fraser et al., 2018; Drahus et al., 2018; Micheli et al., 2018). In summary, ‘Oumuamua has a red, featureless visible/near infrared spectral slope; no directly-detected emission of gas or dust, though activity may be required to explain the presence of non-gravitational perturbations affecting its motion; a very elongated shape; and an excited rotation state. The color, spectral slope, density, and lack of apparent activity all suggest something like a D-type (primitive) asteroid, though the implied low-level activity points to a comet-like body. (The shape and rotation state do not particularly imply any specific analog in our Solar System.) Assuming the object to have asteroidal density, McNeill et al. (2018) showed that no significant cohesive strength is required for ‘Oumuamua to resist rotational fission, .
The existence of ‘Oumuamua has implications for its formation and origin and on the small body populations in other planetary systems (Trilling et al., 2017; Ćuk, 2018; Feng & Jones, 2018; Do et al., 2018; Raymond et al., 2018a, b; Zwart et al., 2018; Gaidos, 2018; Jackson et al., 2018; Katz, 2018). Overall, these formation models generally prefer a comet-like body for interstellar interlopers.
As part of the observational campaign carried out before ‘Oumuamua became too faint, we observed this body with the Spitzer Space Telescope. Spitzer observations offered the best possibility to determine the diameter and albedo of this object by measuring its emitted thermal infrared radiation as our team has done for thousands of Near Earth Objects (NEOs) (Trilling et al., 2010, 2016)
Here we present the results of our Spitzer observations. We did not convincingly detect ‘Oumuamua and are left with an upper limit on its flux that corresponds to an upper limit on diameter and a lower limit on albedo. In Section 2 we present our observational approach and data reduction steps; details of the ephemeris and uncertainty calculations; and our observational results. In Section 3 we present our thermal modeling and the resulting limits on diameter and albedo, which strongly depend on choice of model parameters. We discuss our model results and search for activity in Section 4.
2 Observations and results
2.1 Observations and data reduction
Observations were obtained with Spitzer/IRAC (Fazio et al., 2004) as part of the DDT program 13249. Seven Astronomical Observing Requests (AORs) were used, six of 5 hour duration with 166100 second frames, and a final 2.9 hour AOR with 94100 second frames, for a total of 1090 frames and 30.2 hours on-source frame time . The observations were divided in this way because of limits in the number of commands and data allowed in a single AOR. The data were taken with the “Moving Single” target mode with Full Array readouts, using a small cycling dither pattern. Two frames were taken at each dither position, to reduce the overhead of moving after each frame. Images were obtained in both arrays, but only the 4.5 µm channel was nominally centered on the target position, since the object was expected to be brightest in that IRAC channel. With the information known at that time, we estimated that with this integration time we could achieve a 3 or better detection of the object if it was at its expected maximum brightness during the time of observation.
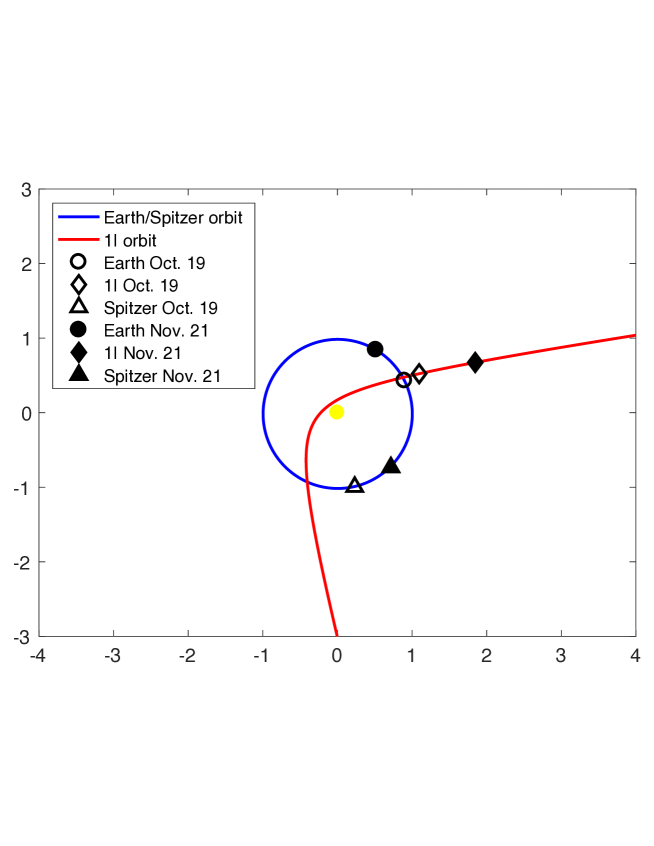
‘Oumuamua was discovered on 2017 October 19 , but because of the constraints of the Spitzer observability zone, the earliest that the Spitzer observations could begin was late on November 20 (Figure 1). The ephemeris used to develop the original Spitzer observation sequence was based on ground-based astrometric data through the end of October and had a prediction uncertainty larger than the Spitzer FOV. On November 9 the Magdalena Ridge Observatory collected additional ground-based observations, which we used together with preliminary high-precision astrometry from Micheli et al. (2018) to refine the orbit of ‘Oumuamua. We found that the revised predicted positions could potentially put the object very close to or off the edge of the array for many frames in the AORs constructed with the original ephemeris. The Spitzer Science Center (SSC) was able to replan the observations with the latest orbit information. The first AOR began executing at 2017-11-21 10:13:26 UT, and the last AOR completed at 2017-11-22 18:52:06 UT; this is around 2.5 months after ‘Oumuamua’s perihelion passage. The average heliocentric distance of ‘Oumuamua during the observations was 2.0 au and the average Spitzer-centric distance was 1.8 au; the average phase angle was around 31 degrees . This geometry changed only very slightly during the 33 hours of clock time needed to carry out these observations. The rate of motion on-sky in these observations was around 68 arcsec/hour.
The data reduction method used was similar to that described in Mommert et al. (2014b). A mosaic of the field was constructed from the data set itself and then subtracted from the individual basic calibrated data (BCD) frames. After subtraction of the background mosaic, residual background sources and bright cosmic ray artifacts were masked in the individual BCDs before being mosaicked in the reference frame of the moving object.
2.2 Ephemeris and positional uncertainties
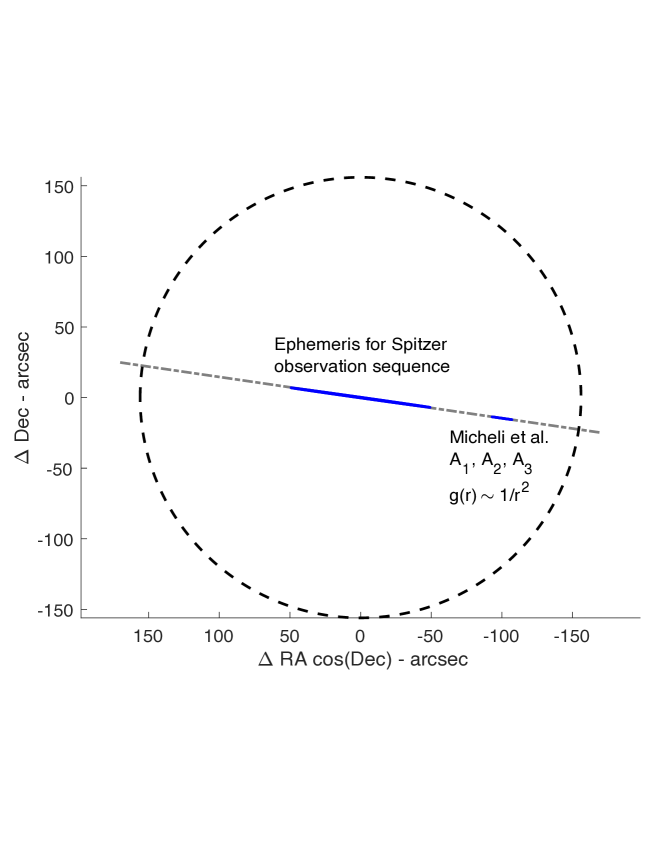
Micheli et al. (2018) later collected ground-based Hubble Space Telescope astrometry of ‘Oumuamua, eventually extending the observational arc through 2018 January 2. Based on this longer sampling of the trajectory, they reported a 30 detection of a non-gravitational acceleration acting on the motion of the object, inferred from position measurements over time. This acceleration was not visible or expected when the Spitzer observation sequence was built in November and would have resulted in an ephemeris correction of about 100 arcseconds at the time of the Spitzer observations (Figure 2). This correction is along the Line of Variation (Milani et al., 2005), i.e., the direction corresponding to the semimajor axis of the uncertainty ellipse, which corresponds to a position angle (north to east) of 81.8 degrees. Though this correction is a statistically significant deviation (7.7) from the gravity-only ephemeris used to build the Spitzer observation sequence, the updated ephemeris still falls inside the Spitzer field of view, which is 5.2 arcmin on each side.
2.3 Observational results
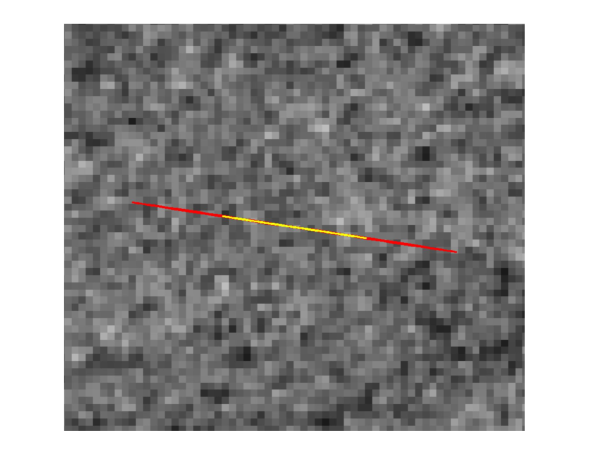
Our final mosaic is shown in Figure 3 along with the predicted location of ‘Oumuamua. There are no bright coherent sources in this image, so we conclude that we did not confidently detect the source. The 1 noise level in the final mosaic is 0.1 Jy per PSF. This noise level was determined by recovering synthetic sources of various brightnesses that were injected in the final mosaic. Sources as faint as 0.3 Jy could be reliably found and extracted with an error of 0.1 Jy. This noise floor is consistent with our expectations from Spitzer observations of other very faint moving objects (Mommert et al., 2014a, b).
There are several 2 “blobs” (essentially, single pixels) in the image, and a “source” that is around 1 that is located within the uncertainty ellipse. Since our final image is stacked in the moving frame of the target, the likelihood of any of these blobs corresponding to a true astrophysical object, which would have to be moving at the same rate as ‘Oumuamua over 30 hours, is vanishingly small. Nevertheless, the presence of these blobs in the image at the 1 or 2 level implies that there is correlated noise somewhere in our data stream. The final image has residuals from background stars not fully removed from the mosaics, which cause some streaking across the image. There are likely also fainter cosmic rays and other low-level array effects that survive our filtering and enter into the final image. These residuals get smeared out because of the offsets and mapping between the instrument pixels and the final image pixels on a smaller scale that will lead to correlated “noise.” The final image does not look like an image with only random pixel values in each pixel, but is consistent with what we would expect for the object of interest being too faint to detect. Alternately, this could be a tenuous detection of ‘Oumuamua at 1, or around 0.1 Jy. In the analysis below, we use a 3 upper limit for our calculations, which implies non-detection, or, at best, a weak detection.
3 Thermal modeling and interpretation of the non-detection
We rule out any detections of ‘Oumuamua at greater than 3 (0.3 Jy). Given the geometry of the observations, we have created a model spectral energy distribution that fits the available data: this 4.5 m upper limit and (the Solar System absolute magnitude in V band), which we take to be 22.4 (Meech et al., 2017) with an uncertainty of 0.09 (using the fractional uncertainty given in Meech et al. (2017)). At 4.5 microns and 1–2 au from the Sun the flux from this object is generally dominated by thermal emission (Trilling et al., 2016) , so a non-detection provides an upper limit on diameter and a lower limit on albedo.
We simulate the expected brightness of ‘Oumuamua in Spitzer IRAC Channel 2 in order to interpret our upper limit detection. Using the Near-Earth Asteroid Thermal Model (NEATM, Harris (1998)), we estimate the target’s brightness as a function of its absolute magnitude and a range in geometric albedo (). Since the physical properties of ‘Oumuamua are unknown, we consider a range of values for the thermal infrared beaming parameter: =[0.8, 1.1, 2.5]. The justification for these values, which span the range of plausible values for almost all NEOs (Trilling et al., 2016) and comets (Fernandez et al., 2013), is given in Section 4.3. We account for the target’s geometry at the time of our Spitzer observations and contributions from reflected solar light in IRAC Channel 2 (Mueller et al., 2011), assuming an infrared to optical reflectance ratio of 1.4 (Trilling et al., 2016). Furthermore, we account for color corrections of the thermal component of the target’s flux.
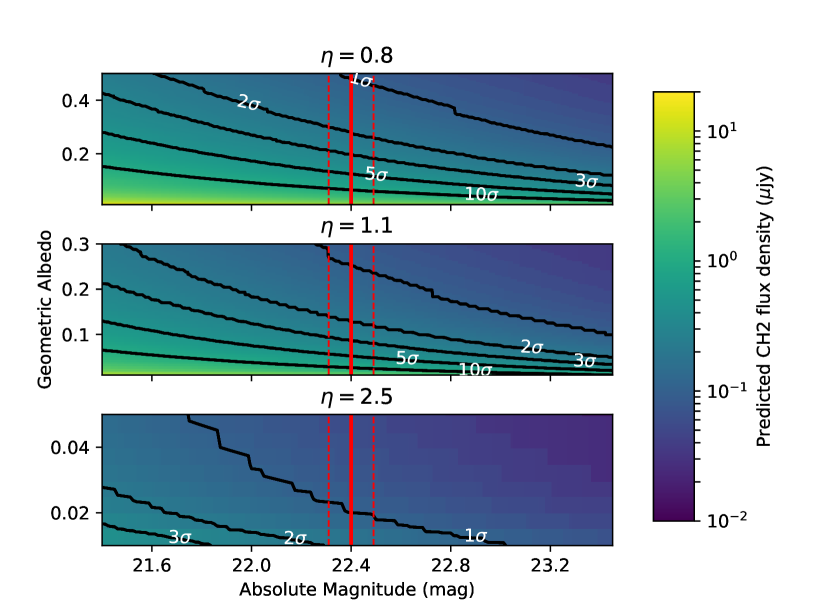
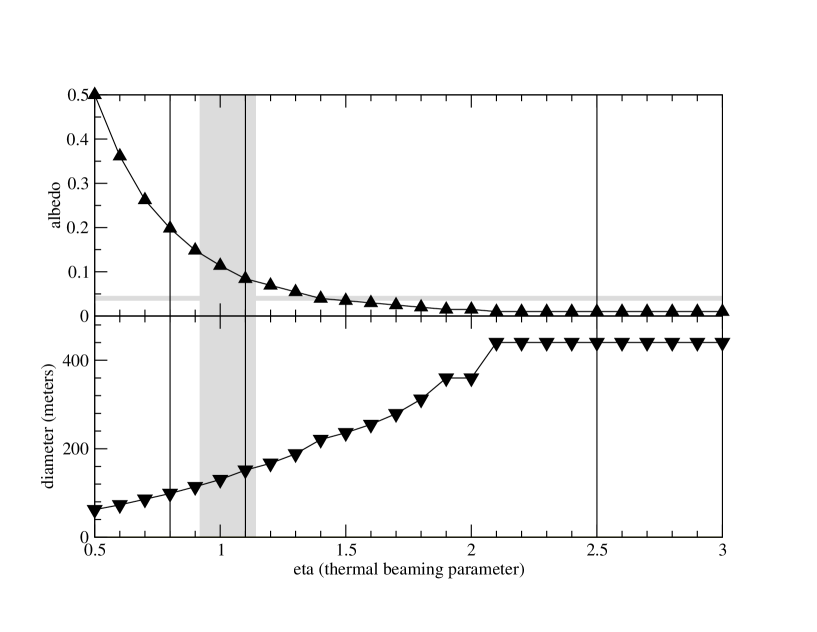
Figure 4 shows the distribution of predicted IRAC Channel 2 flux densities for the three different beaming parameters . Black lines indicate levels that are equal to integer multiples of the flux density noise level measured from our data. For = [0.8, 1.1, 2.5], the 3 lower limit on the target’s geometric albedo is [0.2, 0.1, 0.01], respectively (Figure 5). (Technically, any albedo is allowed for the case; we set here the minimum value to be 0.01 to allow for finite diameters.) Correspondingly, we find a diameter upper limit of [98, 140, 440] meters, respectively (Figure 5).
4 Discussion
4.1 Search for activity
Based on the discovery of non-gravitational accelerations acting upon the orbit of ‘Oumuamua (Micheli et al., 2018), we investigate the possibility of dust and gas activity in this object during our observations. Our non-detection enables the placement of upper limits on the production rates of dust, as well as CO and CO2 gas; we are unable to constrain the production of other gas species. We use the same formalism that we used in detecting cometary behavior in the NEO Don Quixote (Mommert et al., 2014c) and our measured 3 4.5 micron flux density limit (0.3 Jy). Within a 6 pixel (5.2 arcsec) radius aperture (our standard size) we derive Af cm following the definition of A’Hearn et al. (1984), where A is albedo, f is the filling factor, and is the linear radius of the emission (here, an upper limit). Assuming a dust particle radius of 10 m, a dust bulk density of 1 g cm-3, an albedo of 0.03 that is comparable with cometary dust and compatible with the range of possible albedos that we derived for ‘Oumuamua, and a dust ejection velocity equal to the expansion velocity of gas at this distance from the Sun (Ootsubo et al., 2012), we find a 3 upper limit on the dust production rate of 9 kg s-1. Similarly, we calculate the 3 upper limit on the CO2 gas production rate as 91022 molecules s-1. This can be scaled into a 3 upper limit for the production of CO (91021 molecules s-1) based on the ratio of the CO2 and CO fluorescence efficiencies (Crovisier & Encrenaz, 1983).
This CO upper limit is much lower than the Micheli et al. (2018) value of 4.5 molecules/s (the most sensitive search in the literature) and implies that the outgassing from ‘Oumuamua cannot have CO (or, presumably, CO2) as a significant component, though the Micheli et al. (2018) CO production rate assumes a relative large body and albedo of 4%. If ‘Oumuamua’s size were 10–20 times smaller than the Micheli et al. (2018) diameter of 220 meters then the amount of CO outgassing at the upper limit would produce sufficient acceleration. However, an effective spherical diameter of 10–20 meters would require an unacceptably high albedo and unacceptably low , as described below, so this argument is rejected. Overall, we find these upper limit production rates and our upper limit of Af to be very low compared to the ensemble of comets (A’Hearn et al., 1995; Ootsubo et al., 2012), supporting the inactivity of ‘Oumuamua during our observations.
4.2 Uncertainties
Our analysis of ‘Oumuamua’s physical properties is based on a measured flux density upper limit and thermal modeling performed with the NEATM. This model has been specifically designed for use on near-Earth asteroid observations and has been shown to be reasonably accurate over a wide range of cases (Harris et al., 2011; Mommert et al., 2018). It is applicable to thermal emission from any airless body and has been used extensively for comet nuclei as well (Lisse et al., 2005, 2009; Fernandez et al., 2013). A more sophisticated thermophysical model (Mommert et al., 2014a, b, 2018) is not appropriate here due to the lack of information on the target (e.g., spin pole orientation and complex rotation state; shape is somewhat known but not uniquely so) and the upper-limit nature of the flux density measurement.
‘Oumuamua is known to have a high-amplitude lightcurve (e.g., Jewitt et al., 2017; Knight et al., 2017; Meech et al., 2017; Bolin et al., 2018; Micheli et al., 2018) with, most likely, a period of 6–8 hours. Since our observations spanned 33 hours (clock time) any lightcurve effects are smoothed out and we observe only the average flux. Furthermore, even though the Spitzer viewing geometry of ‘Oumuamua is very different from that seen by observatories on and near the Earth, because ‘Oumuamua is in an excited rotation state (Fraser et al., 2018; Belton et al., 2018; Drahus et al., 2018), we likely observed the same time-averaged projected surface area that would have been seen from Earth.
We do not include uncertainties on the ratio of infrared to optical reflectances, as the impact of this ratio barely affects the overall results of this study, especially in the light of the large uncertainties on the beaming parameter and hence the geometric albedo .
We investigate the applicability of NEATM for this study given the high aspect ratio of ‘Oumuamua (Meech et al., 2017; McNeill et al., 2018) and the assumption of sphericity in NEATM. For this purpose, we use an asteroid thermophysical model (Mommert et al., 2014b, a, 2018) to derive the thermal and reflected solar flux density of the body, . Based on McNeill et al. (2018), we assume a triaxial ellipsoidal shape with semi major axes 6:1:1 for the highly elongated shape and 1:: for the highly oblate shape, both in arbitrary units. We furthermore use the geometry during our Spitzer observations, the period (7.34 hr) derived by Meech et al. (2017), and assume a geometric albedo of 0.03 (in agreement with our NEATM-derived lower limit) and typical small-body values for thermal inertia and surface roughness. We simulate the flux density observed at Spitzer over one quarter of the target’s rotation and derive the average flux density, which is the quantity measured in our observations by combining all available data. Finally, we form the ratio of the average flux density derived for a spherical body (NEATM assumption) to the average flux density derived from the elongated shape and oblate shape models. Deriving this ratio minimizes the effects of the choice of the geometric albedo, surface roughness, and thermal inertia used in the simulation.
We find that this flux density ratio varies as a function of the target’s spin axis latitude (as a proxy for the aspect angle of our observations). a spin axis latitude of 90°(equator-on view), the ratio is 1, and rotational effects are averaged out during our observations. The ratio decreases to 0.5 for spin axis latitudes approaching 0 (pole-on view), which represents an extreme case. As no information on the spin axis orientation of ‘Oumuamua is available, we . This mismatch between the flux densities of is insignificant compared to the uncertainties introduced by the lack of knowledge of the surface properties () of ‘Oumuamua. We therefore conclude that our use of NEATM is acceptable. We also note that the uncertainties in the results from the uncertainties are small compared to the uncertainties from our lack of constraints on .
4.3 Discussion of possible solutions
4.3.1 Low albedo solution
Since ‘Oumuamua is in an excited rotation state, absorption of solar energy could be significantly more uniform around the surface than for rotation around a single axis. This implies the temperature distribution would be smoother than a single axis rotator, requiring a higher than would otherwise be appropriate (Myhrvold, 2016). The exact influence of the excited rotation state on the thermal emission of ‘Oumuamua is difficult to model given our ignorance on its exact rotation state and overall shape. The extreme of the high case would be represented by the Fast Rotator thermal model (FRM) (Mommert et al., 2018). The FRM for this case produces virtually the same result as (Figure 4). While the FRM is technically not suitable for complex rotation, it should be a reasonable approximation (especially since the rotation period is not very short).
Under the conservative assumption of (the high solution) any albedo is allowed (Figure 4 and Figure 5). This includes arbitrarily low values. A comet-like value of 0.04 (Lamy et al., 2004), as was assumed in Micheli et al. (2018), implies a diameter of 220 meters, and D-type asteroids have similarly low albedos (Thomas et al., 2011). This relatively large body can still experience non-gravitational accelerations but requires relatively large impulses and, consequently, relatively high activity rates that are not commensurate with our CO/CO2 outgassing limits presented above.
4.3.2 Mid-range albedo solution
The default approach used in our Spitzer NEO program is to derive from phase angle; Trilling et al. (2016) present in some detail the correlation and dispersion in the correlation between those two parameters. In this case, the phase angle of 31 degrees implies around 1.1. This value yields and diameter less than 140 meters. These values are intermediate in the range of acceptable solutions for ‘Oumuamua (Figure 5). However, even this moderate albedo is generally inconsistent with cometary albedos.
4.3.3 High albedo solution
Finally, a lower value appears to be more appropriate for comets (Fernandez et al., 2013). As our bounding case we take . This implies diameter less than 98 meters and albedo greater than 0.2 (Figure 5). This small size is preferred from an activity and non-gravitational acceleration perspective, but the high albedo is unexpected since radiolysis of the surface during its interstellar passage would presumably have darkened the surface (and reddened it; a red color is indeed observed). One possible explanation is that ‘Oumuamua’s recent passage by the sun was sufficient to emplace a thin layer of bright, fresh ice on the surface, as discussed below.
If ‘Oumuamua has a high albedo then its inferred size (98 meter diameter) is substantially smaller than the 220 meter diameter that was assumed by Micheli et al. (2018), and its mass is smaller by the cubed ratio of these solutions (). With a smaller mass, greater acceleration is produced for a given force (i.e., outgassing). However, force is proportional to the production rate, and the CO production rate derived here is times less than that used by Micheli et al. (2018) to explain the measured astrometry. This rules out the the possibility that CO or CO2 outgassing was responsible for the non-gravitational acceleration that Micheli et al. (2018) detected.
4.4 Summary of results and a possible interpretation
‘Oumuamua could have a high , which would not be unusual for asteroids but would be very unusual for comets — although a body in an excited rotation state might have a higher than expected value. In the high case, the albedo is low, which means the diameter is large. However, a large body implies a large outgassing rate, which we do not see for CO and CO2 and for dust. Conversely, ‘Oumuamua could have a low , in accordance with expectations for cometary bodies. However, this requires an albedo that is much higher than that expected for comets. This high albedo corresponds to a small diameter, which is favored, considering our upper limits on gas and dust production. Intermediate values of , albedo, and diameter are also possible, though these are not really consistent with any expectations.
In conclusion, there is no simple asteroidal or cometary physical model that agrees with expectations and previous work (including non-gravitational acceleration) and our results for all of , albedo, and diameter. One plausible explanation is that ‘Oumuamua was a dormant comet nucleus reactivated, after millions of years in interstellar space, by heating during its close passage by the Sun. This reactivation either destroyed the thin dark mantle expected to be created by cosmic rays and galactic ultraviolet radiation (e.g., Lisse et al., 1998, 2004) and/or coated the surface with an optically thick layer of new, fresh ice. In the latter case, the bright coating could plausibly have come from CO, CO2, or water, as follows.
We assume that ‘Oumuamua is outgassing molecules of CO2 per second (see above). In the high albedo case, the effective spherical diameter of ‘Oumuamua is around 98 meters, and the surface area is therefore around m2 (taking 49 meters as the radius of the equivalent sphere). If we require a uniform surface layer that is 10 microns thick — so that the surface appears bright with CO2 ice for observations made at 4.5 microns — then the volume of this surface layer is around 0.3 m3.
The density of CO2 ice is approximately 1.5 g/cm3. The mass required to create a surface layer of 0.3 m3 is therefore g. We calculate the number of CO2 molecules required as
which is around molecules of CO2. At molecules/sec that corresponds to around 67,000 seconds, or around 0.8 days — far less than the few weeks of ‘Oumuamua’s perihelion passage time. Thus, even if the efficiency of this process is small, it is still quite plausible that a low level of activity — induced by solar heating of a near-subsurface CO2 reservoir — could produce enough material to coat the surface with bright, fresh CO2 and increase the albedo to the relatively high value required in our high-albedo case.
4.5 Possible analogies
Unfortunately, we do not have pre-perihelion observations to compare to these post-perihelion observations to test the hypothesis that ‘Oumuamua brightened during its perihelion passage. Further modeling of ‘Oumuamua’s outgassing — whether CO, CO2, or some other species — would be very beneficial.
5 Conclusions
We observed interstellar body ‘Oumuamua for 30 hours of integration time at 4.5 microns with the Spitzer Space Telescope. We did not convincingly detect the object and place upper limits on its flux during our observations. Depending on the assumptions used in our thermal model, we find low-, medium-, and high-albedo solutions (and corresponding limits on the effective spherical diameter). We do not detect any activity from ‘Oumuamua and place upper limits for emission that are far lower than were derived by Micheli et al. (2018) under the assumption of a body with 4% albedo; . The nature of the gas emission and the origin of the non-gravitational accelerations are still unknown.
It is not clear what type of body in our Solar System is the most similar to ‘Oumuamua, as there are significant failures with both comets and primitive (D-type) asteroids as end-member analogs. One possible scenario that appears to explain many of the observed properties of ‘Oumuamua, including our observations, is However, due to the geometry of ‘Oumuamua’s passage through the Solar System, there will be no more observations of this object, so it is likely that we will never know the true nature of this interstellar interloper.
References
- A’Hearn et al. (1984) A’hearn, M. F., Schleicher, D. G., Millis, R. L., et al. 1984, AJ, 89, 579
- A’Hearn et al. (1995) A’Hearn, M. F., Millis, R. C., Schleicher, D. O., et al. 1995, Icarus, 118, 223
- Astropy Collaboration et al. (2013) Astropy Collaboration, Robitaille, T. P., Tollerud, E. J., et al. 2013, A&A, 558, A33
- Bacci et al. (2017) Bacci, P., Maestripieri, M., Tesi, L., et al. 2017, Minor Planet Electronic Circulars, 2017-U181
- Bannister et al. (2017) Bannister, M. T., Schwamb, M. E., Fraser, W. C., et al. 2017, ApJ, 851, L38
- Bauer et al. (2015) Bauer, J. M., Stevenson, R., Kramer, E., et al. 2015, ApJ, 814, 85
- Belton et al. (2018) Belton, M. J. S., Hainaut, O. R., Meech, K. J., et al. 2018, ApJ, 856, L21
- Bolin et al. (2018) Bolin, B. T., Weaver, H. A., Fernandez, Y. R., et al. 2018, ApJ, 852, L2
- Crovisier & Encrenaz (1983) Crovisier, J. & Encrenaz, T. 1983, A&A, 126, 170
- Ćuk (2018) Ćuk, M. 2018, ApJ, 852, L15
- Do et al. (2018) Do, A., Tucker, M. A., Tonry, J. 2018, ApJ, 855, L10
- Dones et al. (2015) Dones, L., Brasser, R., Kaib, N., et al. 2015, SSR, 197, 191
- Drahus et al. (2018) Drahus, M., Guzik, P., Waniak, W., et al. 2018, Nature Astronomy, 2, 407
- Fazio et al. (2004) Fazio, G. G., Hora, J. L., Allen, L. E. et al. 2004, ApJS, 154, 10
- Feng & Jones (2018) Feng, F., & Jones, H. R. A. 2018, ApJ, 852, L27
- Fernandez et al. (2013) Fernandez, Y. R., Kelley, M. S. P., Lamy, P., et al. 2013, Icarus, 226, 1138
- Fitzsimmons et al. (2018) Fitzsimmons, A., Snodgrass, C., Rozitis, B., et al. 2018, Nature Astronomy, 2, 133
- Fraser et al. (2018) Fraser, W. C., Pravec, P., Fitzsimmons, A., et al. 2018, Nature Astronomy, 2, 383
- Gaidos (2018) Gaidos, E. 2018, MNRAS, 477, 5692
- Giorgini et al. (1996) Giorgini, J. D., Yeomans, D. K., Chamberlin, A. B., et al. 1996, Bulletin of the American Astronomical Society, 28, 25.04
- Harris (1998) Harris, A. W. 1998, Icarus, 131 291
- Harris et al. (2011) Harris, A. W., Mommert, M., Hora, J. L., et al. 2011, AJ, 141, 75
- Jackson et al. (2018) Jackson, A. P., Tamayo, D., Hammond, N., et al. 2018, MNRAS, 478, L49
- Jewitt et al. (2017) Jewitt, D., Luu, J., Rajagopal, J., et al. 2017, ApJ, 850, L36
- Katz (2018) Katz, J. I. 2018, MNRAS, 478, L95
- Keller et al. (2017) Keller, H. U., Mottola, S., Hviid, S. F., et al. 2017, MNRAS, 469, S357
- Knight et al. (2017) Knight, M. M., Protopapa, S., Kelley, M. S. P., et al. 2017, ApJ, 851, L31
- Lamy et al. (2004) Lamy, P., Toth, I., Fernandez, Y. R., & Weaver, H. A. 2004, in Comets II, eds. Festou et al. (U. Arizona Press), 223
- Liao et al. (2018) Liao, Y., Marschall, R., Su, C. C., et al. 2018, Planet. & Space Science, 157, 1
- Lisse et al. (1998) Lisse, C. M., A’Hearn, M. F., Hauser, M. G., et al. 1998, ApJ, 496, 971
- Lisse et al. (2004) Lisse, C. M., Fernandez, Y. R., A’Hearn, M. F., et al. 2004, Icarus, 171, 444
- Lisse et al. (2005) Lisse, C. M., A’hearn, M. F., Groussin, O., et al. 2005, ApJ, 625, L139
- Lisse et al. (2007) Lisse, C. M., Beichman, C. A., Bryden, G., & Wyatt, M. C. 2007, ApJ, 658, 584
- Lisse et al. (2009) Lisse, C. M., Fernandez, Y. R., Reach, W. T., et al., 2009, PASP, 121, 968
- Lisse et al. (2017) Lisse, C. M., Sitko, M. L., Marengo, M. et al. 2017, AJ, 154, 182
- Makovoz et al. (2006) Makovoz, D., Roby, T., Khan, I., & Booth, H. 2006, Proc. SPIE, 6274, 62740C
- Masiero (2017) Masiero, J. 2017, arXiv: 1710.09977
- McNeill et al. (2018) McNeill, A., Trilling, D., E., & Mommert, M. 2018, ApJ, 857, L1
- Meech et al. (2017) Meech, K. J., Weryk, R., Micheli, M., et al. 2017, Nature, 552, 378
- Micheli et al. (2018) Micheli, M., Farnocchia, D., Meech, K. et al. 2018, Nature, 2018 doi: 10.1038/s41586-018-0254-4
- Milani et al. (2005) Milani, A., Sansaturio, M. E., Tommei, G., Arratia, O., & Chesley, S. R. 2005, A&A, 431, 729
- Mommert et al. (2014a) Mommert, M., Farnocchia, D., Hora, J. L. et al. 2014a, ApJ, 789, L22
- Mommert et al. (2014b) Mommert, M., Hora, J. L., Farnocchia, D., et al. 2014b, ApJ, 786, 148
- Mommert et al. (2014c) Mommert, M., Hora, J. L., Harris, A. W., et al. 2014c, ApJ, 781, 25
- Mommert et al. (2018) Mommert, M., Jedicke, R. J., & Trilling, D. E. 2018, AJ, 155, 74
- Mueller et al. (2011) Mueller, M., Delbo’, M., Hora, J. L., et al. 2011, AJ, 141, 109
- Myhrvold (2016) Myhrvold, N. 2016, PASP, 128, 962
- Ootsubo et al. (2012) Ootsubo, T., Kawakita, H., Hamada, S., et al. 2012, ApJ, 752, 15
- Raymond et al. (2018a) Raymond, S. N., Armitage, P. J., & Veras, D. 2018a, ApJ, 856, L7
- Raymond et al. (2018b) Raymond, S. N., Armitage, P. J., Veras, D., et al. 2018b, MNRAS, 476, 3031
- Schuster et al. (2006) Schuster, M. T., Marengo, M., & Patten, B. M. 2006, Proc. SPIE, 6270, 627020
- Sekanina (1995) Sekanina, Z. 1995, A&A, 304, 296
- Thomas et al. (2011) Thomas, C. A., Trilling, D. E., Emery, J. P., et al. 2011, AJ, 142, 85
- Trilling et al. (2010) Trilling, D. E., Mueller, M, Hora, J. L., et al. 2010, AJ, 140, 770
- Trilling et al. (2016) Trilling, D. E., Mommert, M., Hora, J., et al. 2016, AJ, 152, 172
- Trilling et al. (2017) Trilling, D. E., Robinson, T. D., Roegge, A., et al. 2017, ApJ, 850, L38
- Ye et al. (2017) Ye, Q.-Z., Zhang, Q., Kelley, M. S. P., & Brown, P. G. 2017, ApJ, 851, L5
- Zwart et al. (2018) Zwart, S. P., Torres, S., Pelupessy, I., et al. 2018, MNRAS, in press (doi: 10.1093/mnrasl/sly088)