Do Spectroscopic Dense Gas Fractions Track Molecular Cloud Surface Densities?
Abstract
We use ALMA and IRAM 30-m telescope data to investigate the relationship between the spectroscopically-traced dense gas fraction and the cloud-scale (120 pc) molecular gas surface density in five nearby, star-forming galaxies. We estimate the dense gas mass fraction at 650 pc and 2800 pc scales using the ratio of HCN (1-0) to CO (1-0) emission. We then use high resolution (120 pc) CO (2-1) maps to calculate the mass-weighted average molecular gas surface density within 650 pc or 2770 pc beam where the dense gas fraction is estimated. On average, the dense gas fraction correlates with the mass-weighted average molecular gas surface density. Thus, parts of a galaxy with higher mean cloud-scale gas surface density also appear to have a larger fraction of dense gas. The normalization and slope of the correlation do vary from galaxy to galaxy and with the size of the regions studied. This correlation is consistent with a scenario where the large-scale environment sets the gas volume density distribution, and this distribution manifests in both the cloud-scale surface density and the dense gas mass fraction.
1 Introduction
Star formation is tied to the presence of dense gas. We observe this in the Milky Way, where stars form primarily in dense substructures within molecular clouds (e.g., Lada & Lada, 2003; Lada et al., 2010, 2012; Heiderman et al., 2010; Evans et al., 2014; André et al., 2014). We also observe this in external galaxies. There the dense gas mass, traced by high effective critical density molecular lines, correlates with the star formation rate (e.g., see Gao & Solomon, 2004; García-Burillo et al., 2012; Usero et al., 2015; Chen et al., 2015; Bigiel et al., 2016; Gallagher et al., 2018; Kepley et al., 2018). Both Galactic and extragalactic observations also indicate that gas volume density and its relationship to star formation change as a function of environment (e.g., Gao & Solomon, 2004; Longmore et al., 2013; Kruijssen et al., 2014; Usero et al., 2015; Bigiel et al., 2016; Gallagher et al., 2018). Measuring the gas volume density across many environments is key to understand what drives these variations.
Observers use two main methods to gauge the distribution of volume densities in the molecular interstellar medium (ISM) of other galaxies. First, one can estimate the surface density of molecular clouds by imaging of a line that traces the bulk molecular gas mass, such as CO emission (e.g., Hughes et al., 2013; Colombo et al., 2014). Given an estimate of the line-of-sight depth, e.g. from a cloud size or adopted scale height, we can convert this surface density to a volume density. This method requires high physical resolution ( pc) to avoid bias from beam dilution.
One can also infer the distribution of gas volume density111Unless otherwise stated, ”density” refers to gas volume density throughout the paper. from observations of multiple molecular emission lines that are excited at different effective critical densities, (e.g., Gao & Solomon, 2004; García-Burillo et al., 2012). To first order, the luminosity of a line traces the mass of gas above its . Changes in the ratio of intensities between lines with different can indicate a changing ratio in the mass above each density (though there are subtleties, see Krumholz & Thompson, 2007; Leroy et al., 2017). This method constrains the volume density distribution within the beam without the need to resolve individual clouds. In the simple case of a bulk gas tracer (here we use CO (1-0) with cm-3) and a dense gas tracer (here we use HCN (1-0) with cm-3, e.g., Onus et al., 2018), this method traces the dense gas fraction (). Because high effective critical density lines also tend to be faint, this method has been mostly employed in low resolution, high sensitivity data sets, which average over scales much larger than that of an individual cloud (e.g., Gao & Solomon, 2004; Usero et al., 2015; Chen et al., 2015; Bigiel et al., 2016; Gallagher et al., 2018).
These two methods trace density in different ways at different scales but they should be related. If the mean volume density (and thus also the mean surface density) of a cloud increases or decreases, then we might expect the fraction of gas above some effective density (e.g., that of HCN) to rise or drop in parallel. Exactly this prediction arises from turbulent cloud models (e.g., Padoan & Nordlund, 2002; Krumholz & Thompson, 2007; Federrath & Klessen, 2013). In these models, increasing the mean volume density of a cloud “slides” the density distribution to a higher range of values and thus should increase . This work represents the first observational test of this correlation.
In this Letter, we leverage the results of recent observing campaigns using the Institute for Radio Astronomy in the Millimeter range (IRAM) 30-m222This work is partially based on observations carried out with the IRAM 30-m telescope. IRAM is supported by INSU/CNRS (France), MPG (Germany) and IGN (Spain). and the Atacama Large Millimeter/submillimeter Array (ALMA) to compare these two density estimates. We estimate the cloud-scale molecular gas surface density from the PHANGS-ALMA survey333http://phangs.org (P.I. E. Schinnerer; A. K. Leroy et al. in preparation). PHANGS-ALMA is mapping CO (2-1) at high resolution ( pc) across 74 nearby galaxies. We compare this to estimated using HCN (1-0) and CO (1-0) (hereafter referred to as HCN and CO, respectively) maps from ALMA (Gallagher et al., 2018) and the IRAM Large Program EMPIRE (Bigiel et al., 2016, Jimenez Donaire et al. in prep.).
Section 2 summarizes how we calculate the HCN/CO ratio (§2.1), the characteristic cloud-scale CO intensity with a larger kpc-scale aperture (§2.2), and the mean relation between the two (§2.3). Section 3 presents the observed correlation (§3.1) and discusses its physical implications (§3.2). We compare our results to simple density distribution models (§3.3). Section 4 summarizes our findings.
2 Data and Methods
| Galaxy | HCN Survey | High Res. CO | Distance | Resolution | Resolution |
|---|---|---|---|---|---|
| (Mpc) | (kpc) | (kpc) | |||
| NGC 3351 | ALMA | PHANGS-ALMA | 10.0 | 0.39 | |
| NGC 3627 | ALMA, EMPIRE | PHANGS-ALMA | 8.28 | 0.32 | 1.36 |
| NGC 4254 | ALMA, EMPIRE | PHANGS-ALMA | 16.8 | 0.65 | 2.77 |
| NGC 4321 | ALMA, EMPIRE | PHANGS-ALMA | 15.2 | 0.59 | 2.51 |
| NGC 5194 | EMPIRE | PAWS | 8.39 | 1.38 | |
Note. — HCN Data: ALMA—Gallagher et al. (2018), EMPIRE—IRAM 30-m Large Program (Bigiel et al., 2016, Jimenez-Donaire et al. in prep.). High Res. CO Data: PAWS CO (1-0)—Schinnerer et al. (2013). PHANGS-ALMA CO (2-1)—Leroy et al. in prep. and Sun et al. (2018). Distance: adopted distance in Mpc from the Extragalactic Distance Database (Tully et al., 2009). 8′′ (34′′) Resolution: physical resolution corresponding to and at our adopted distances.
Table 1 lists our targets. We consider two samples, based on the availability of HCN (1-0) data, which we analyze separately. The EMPIRE sample has resolution HCN maps from the IRAM 30-m. The ALMA sample has HCN maps. NGC 3627, NGC 4254, and NGC 4321 appear in both samples. NGC 3351 appears only in the ALMA sample and NGC 5194 appears only in the EMPIRE sample.
2.1 HCN (1-0) to CO (1-0) Ratio
EMPIRE HCN Data: EMPIRE (Bigiel et al., 2016) used the IRAM 30-m telescope to map HCN emission from nine galaxies, four of which have high resolution CO maps suitable for our experiment. The EMPIRE maps cover the whole star-forming disk of each galaxy, but have relatively poor () angular resolution.
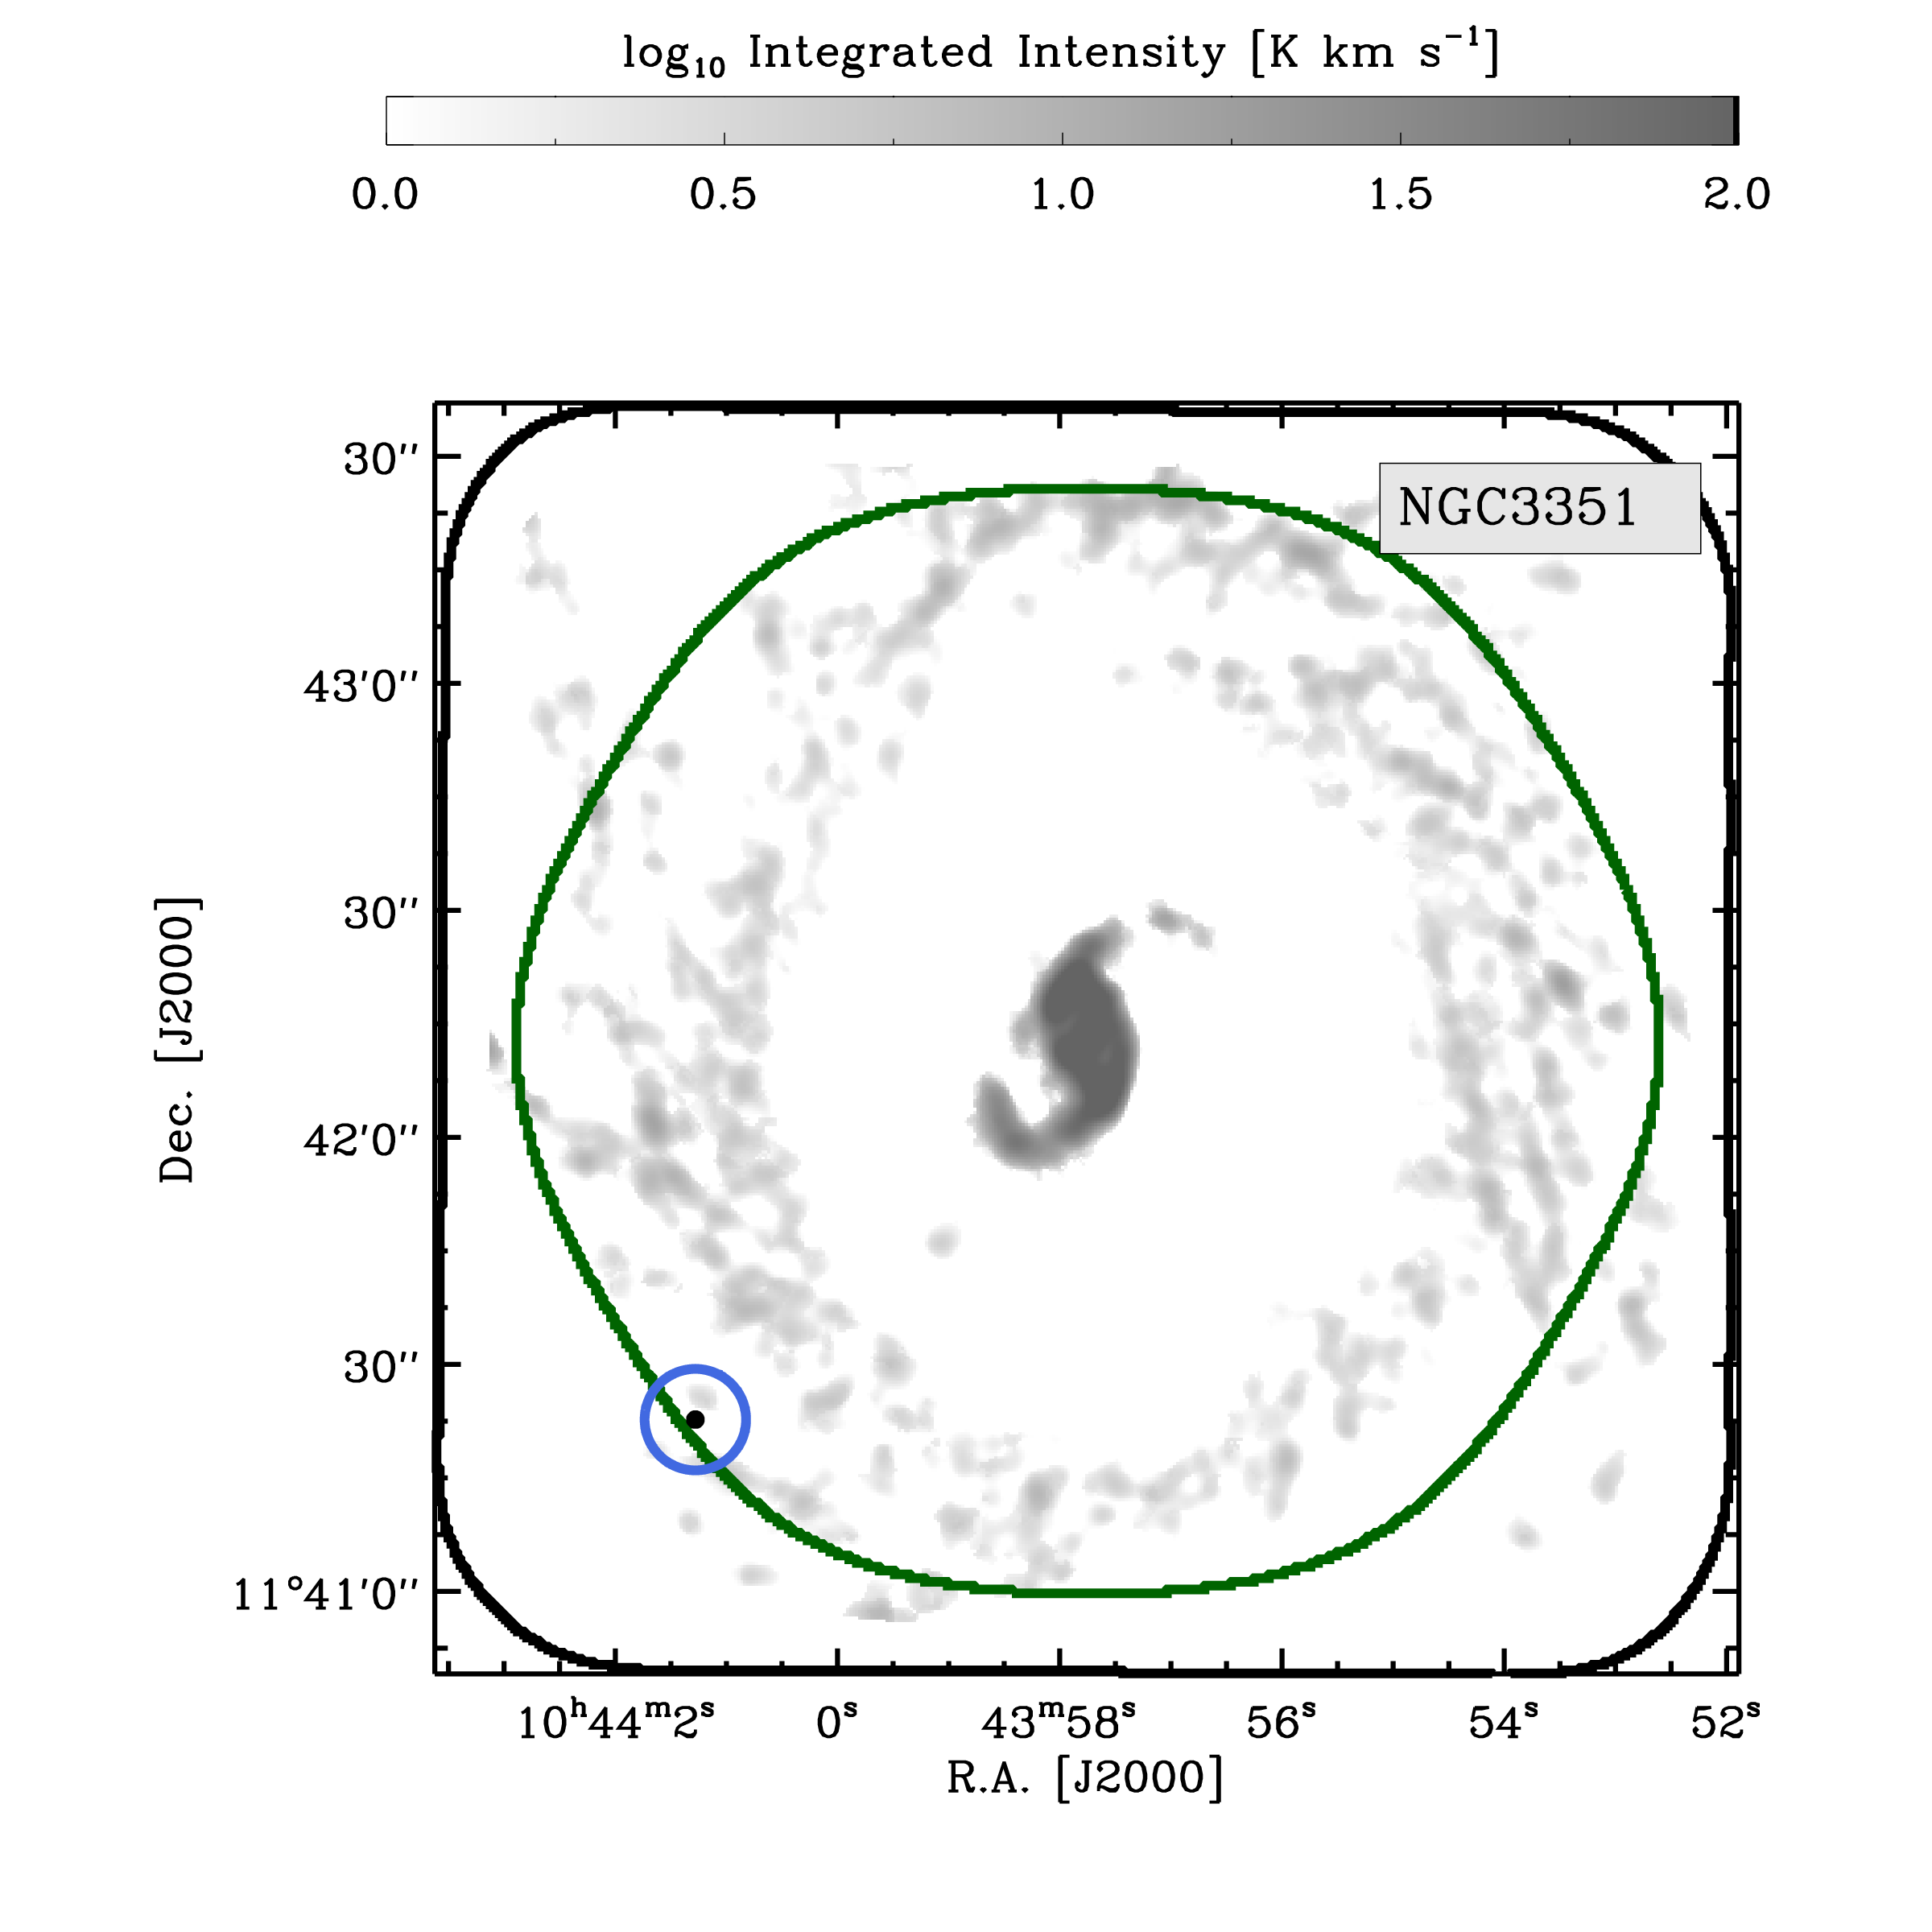
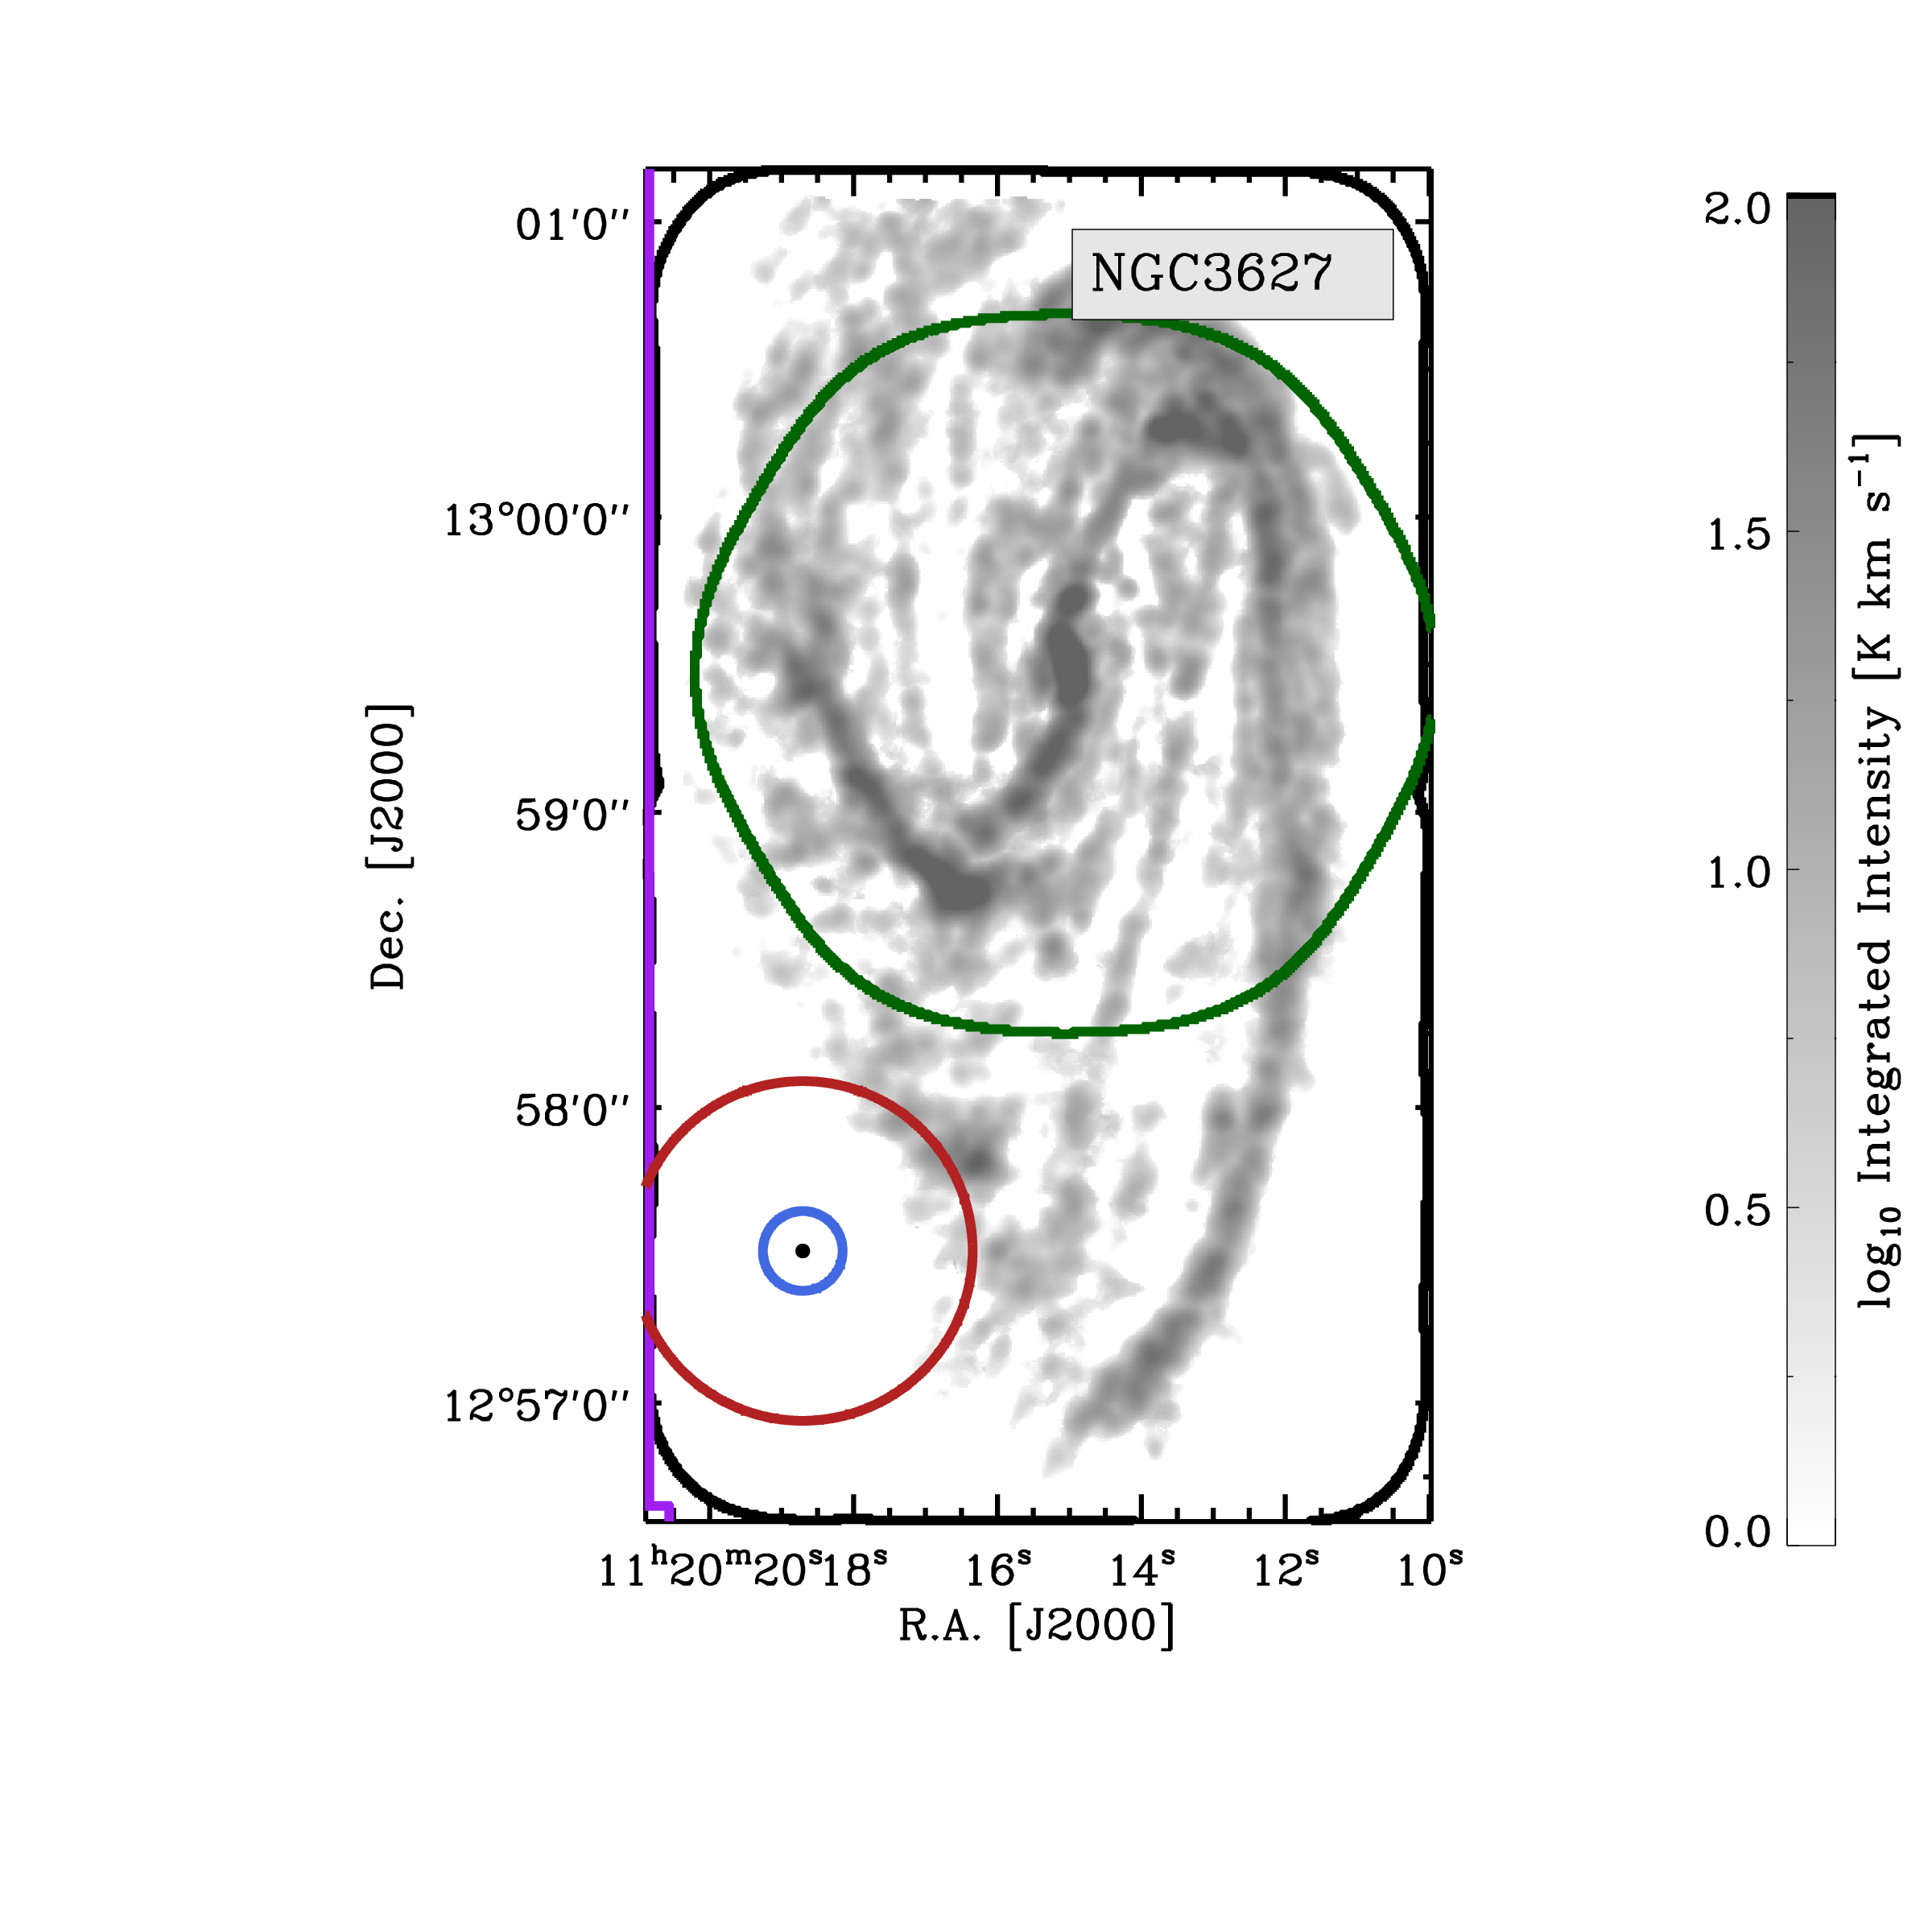
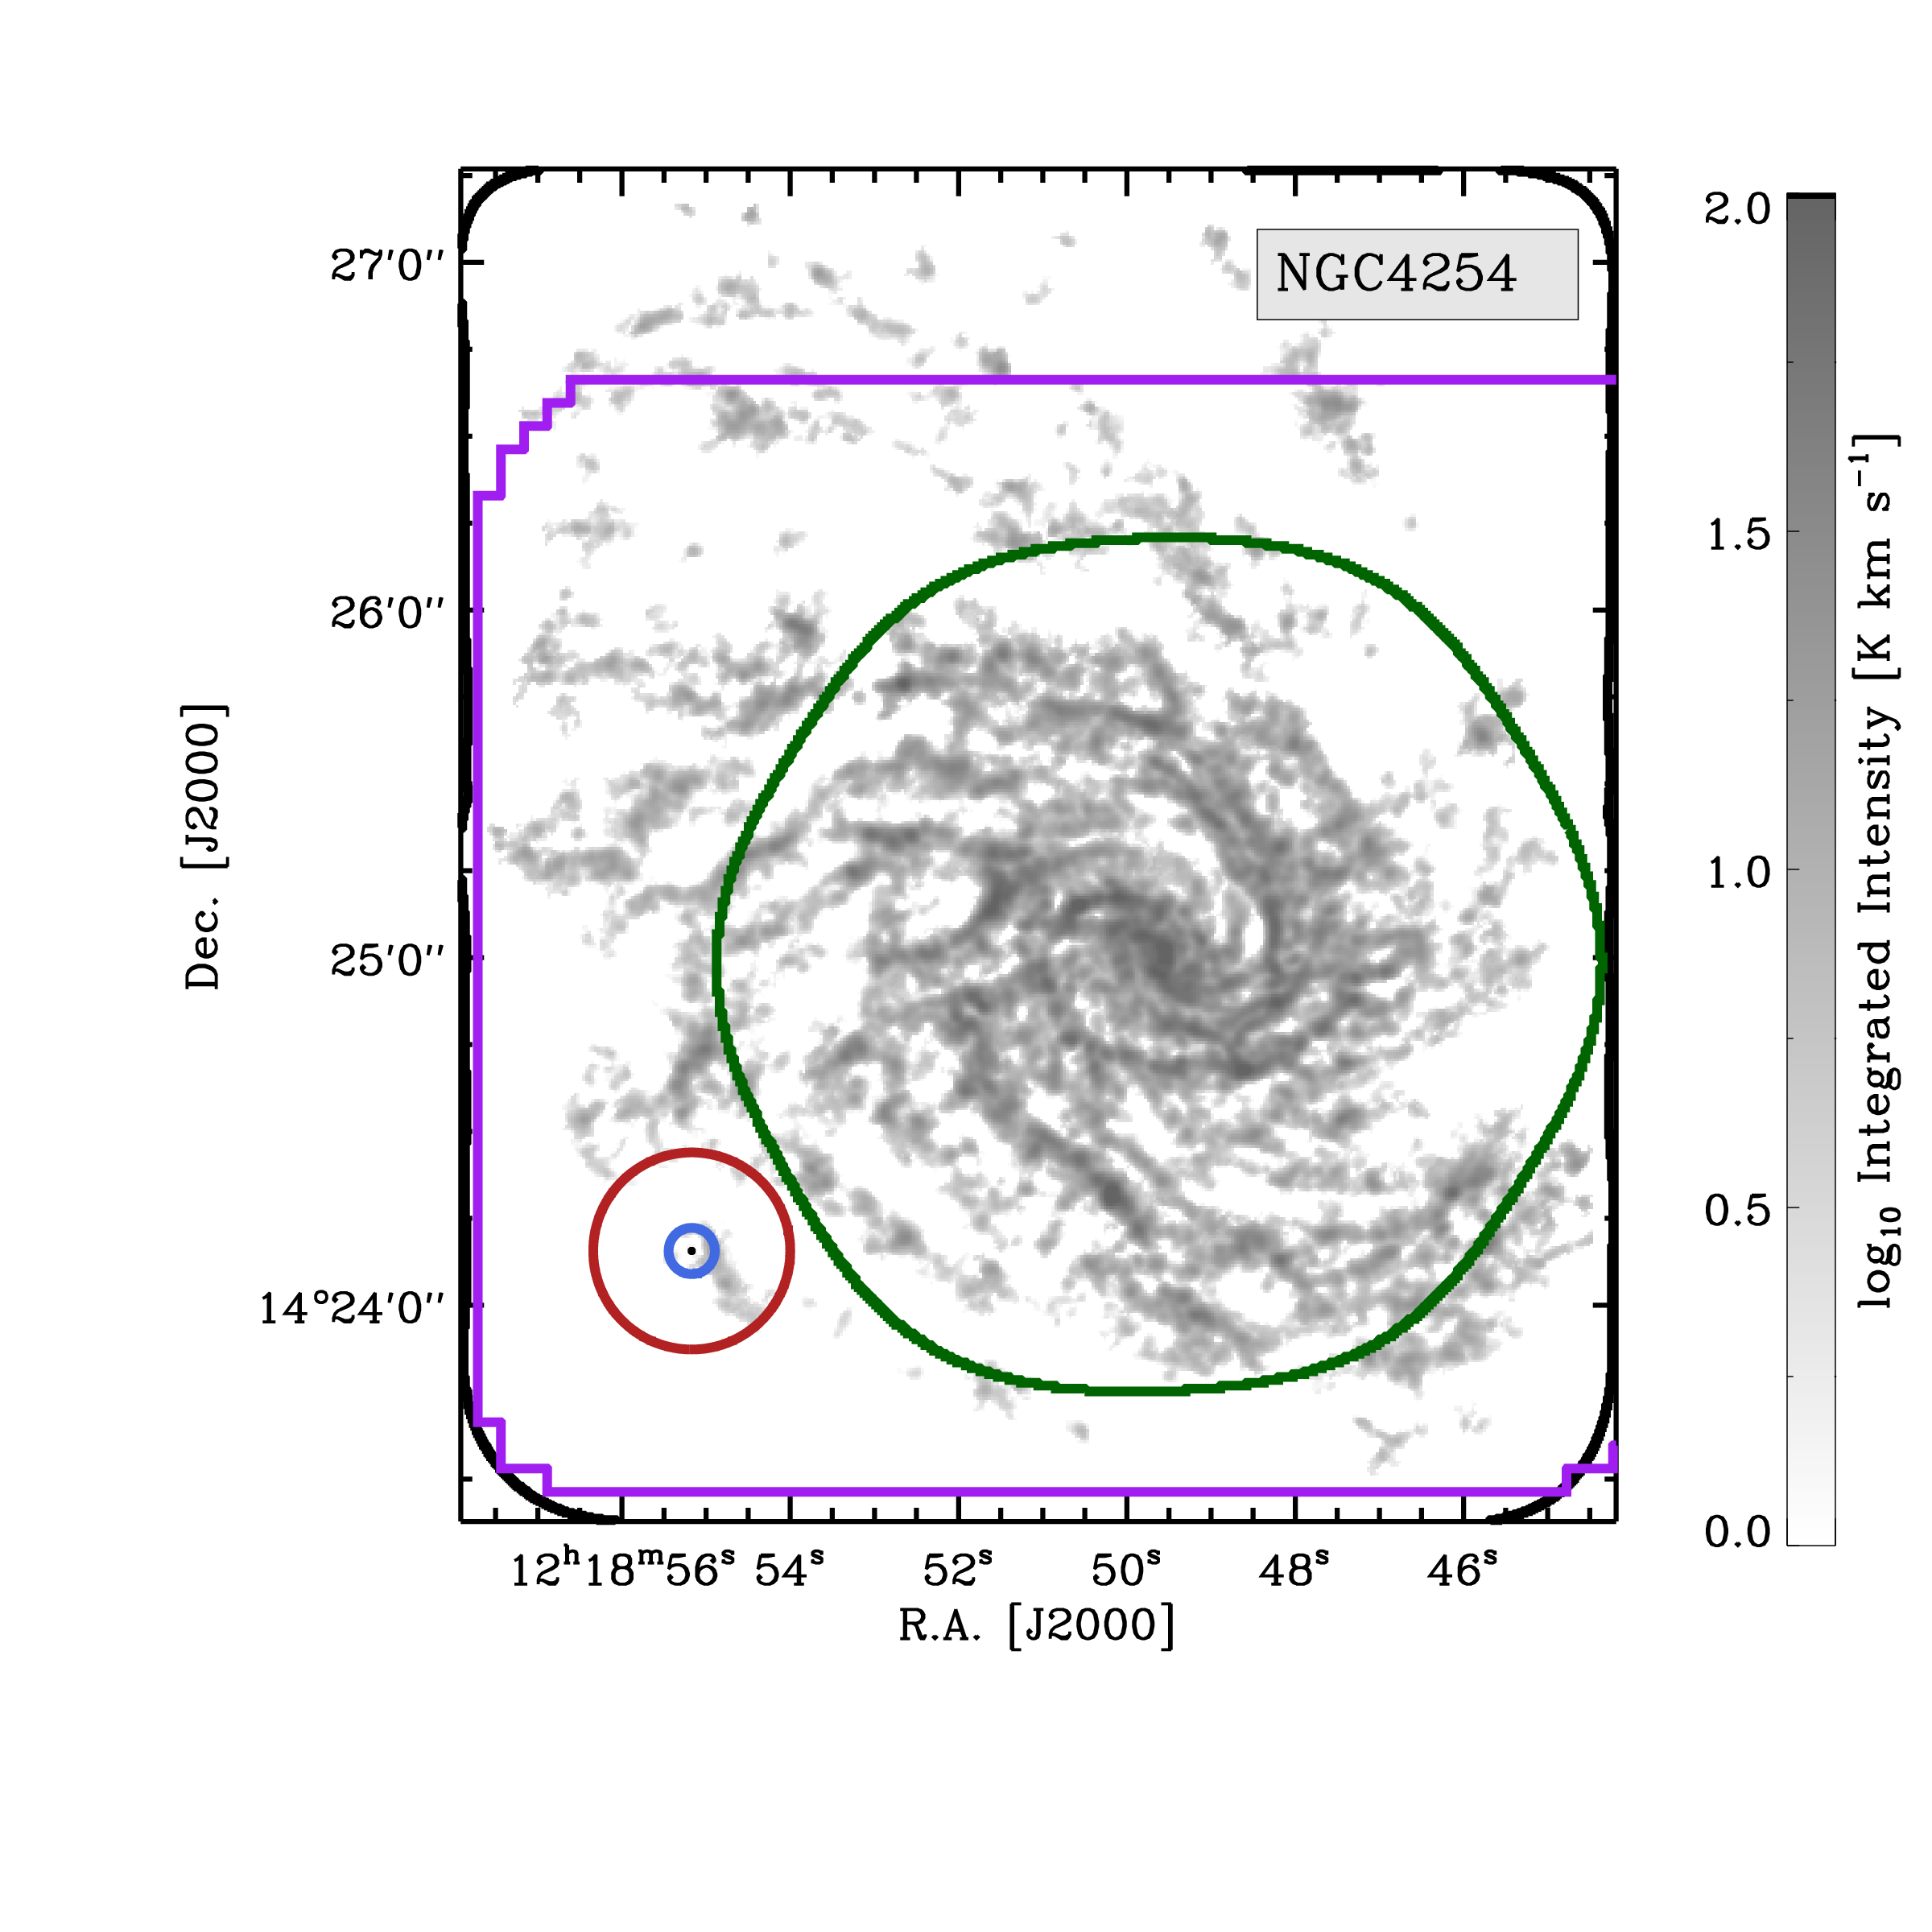
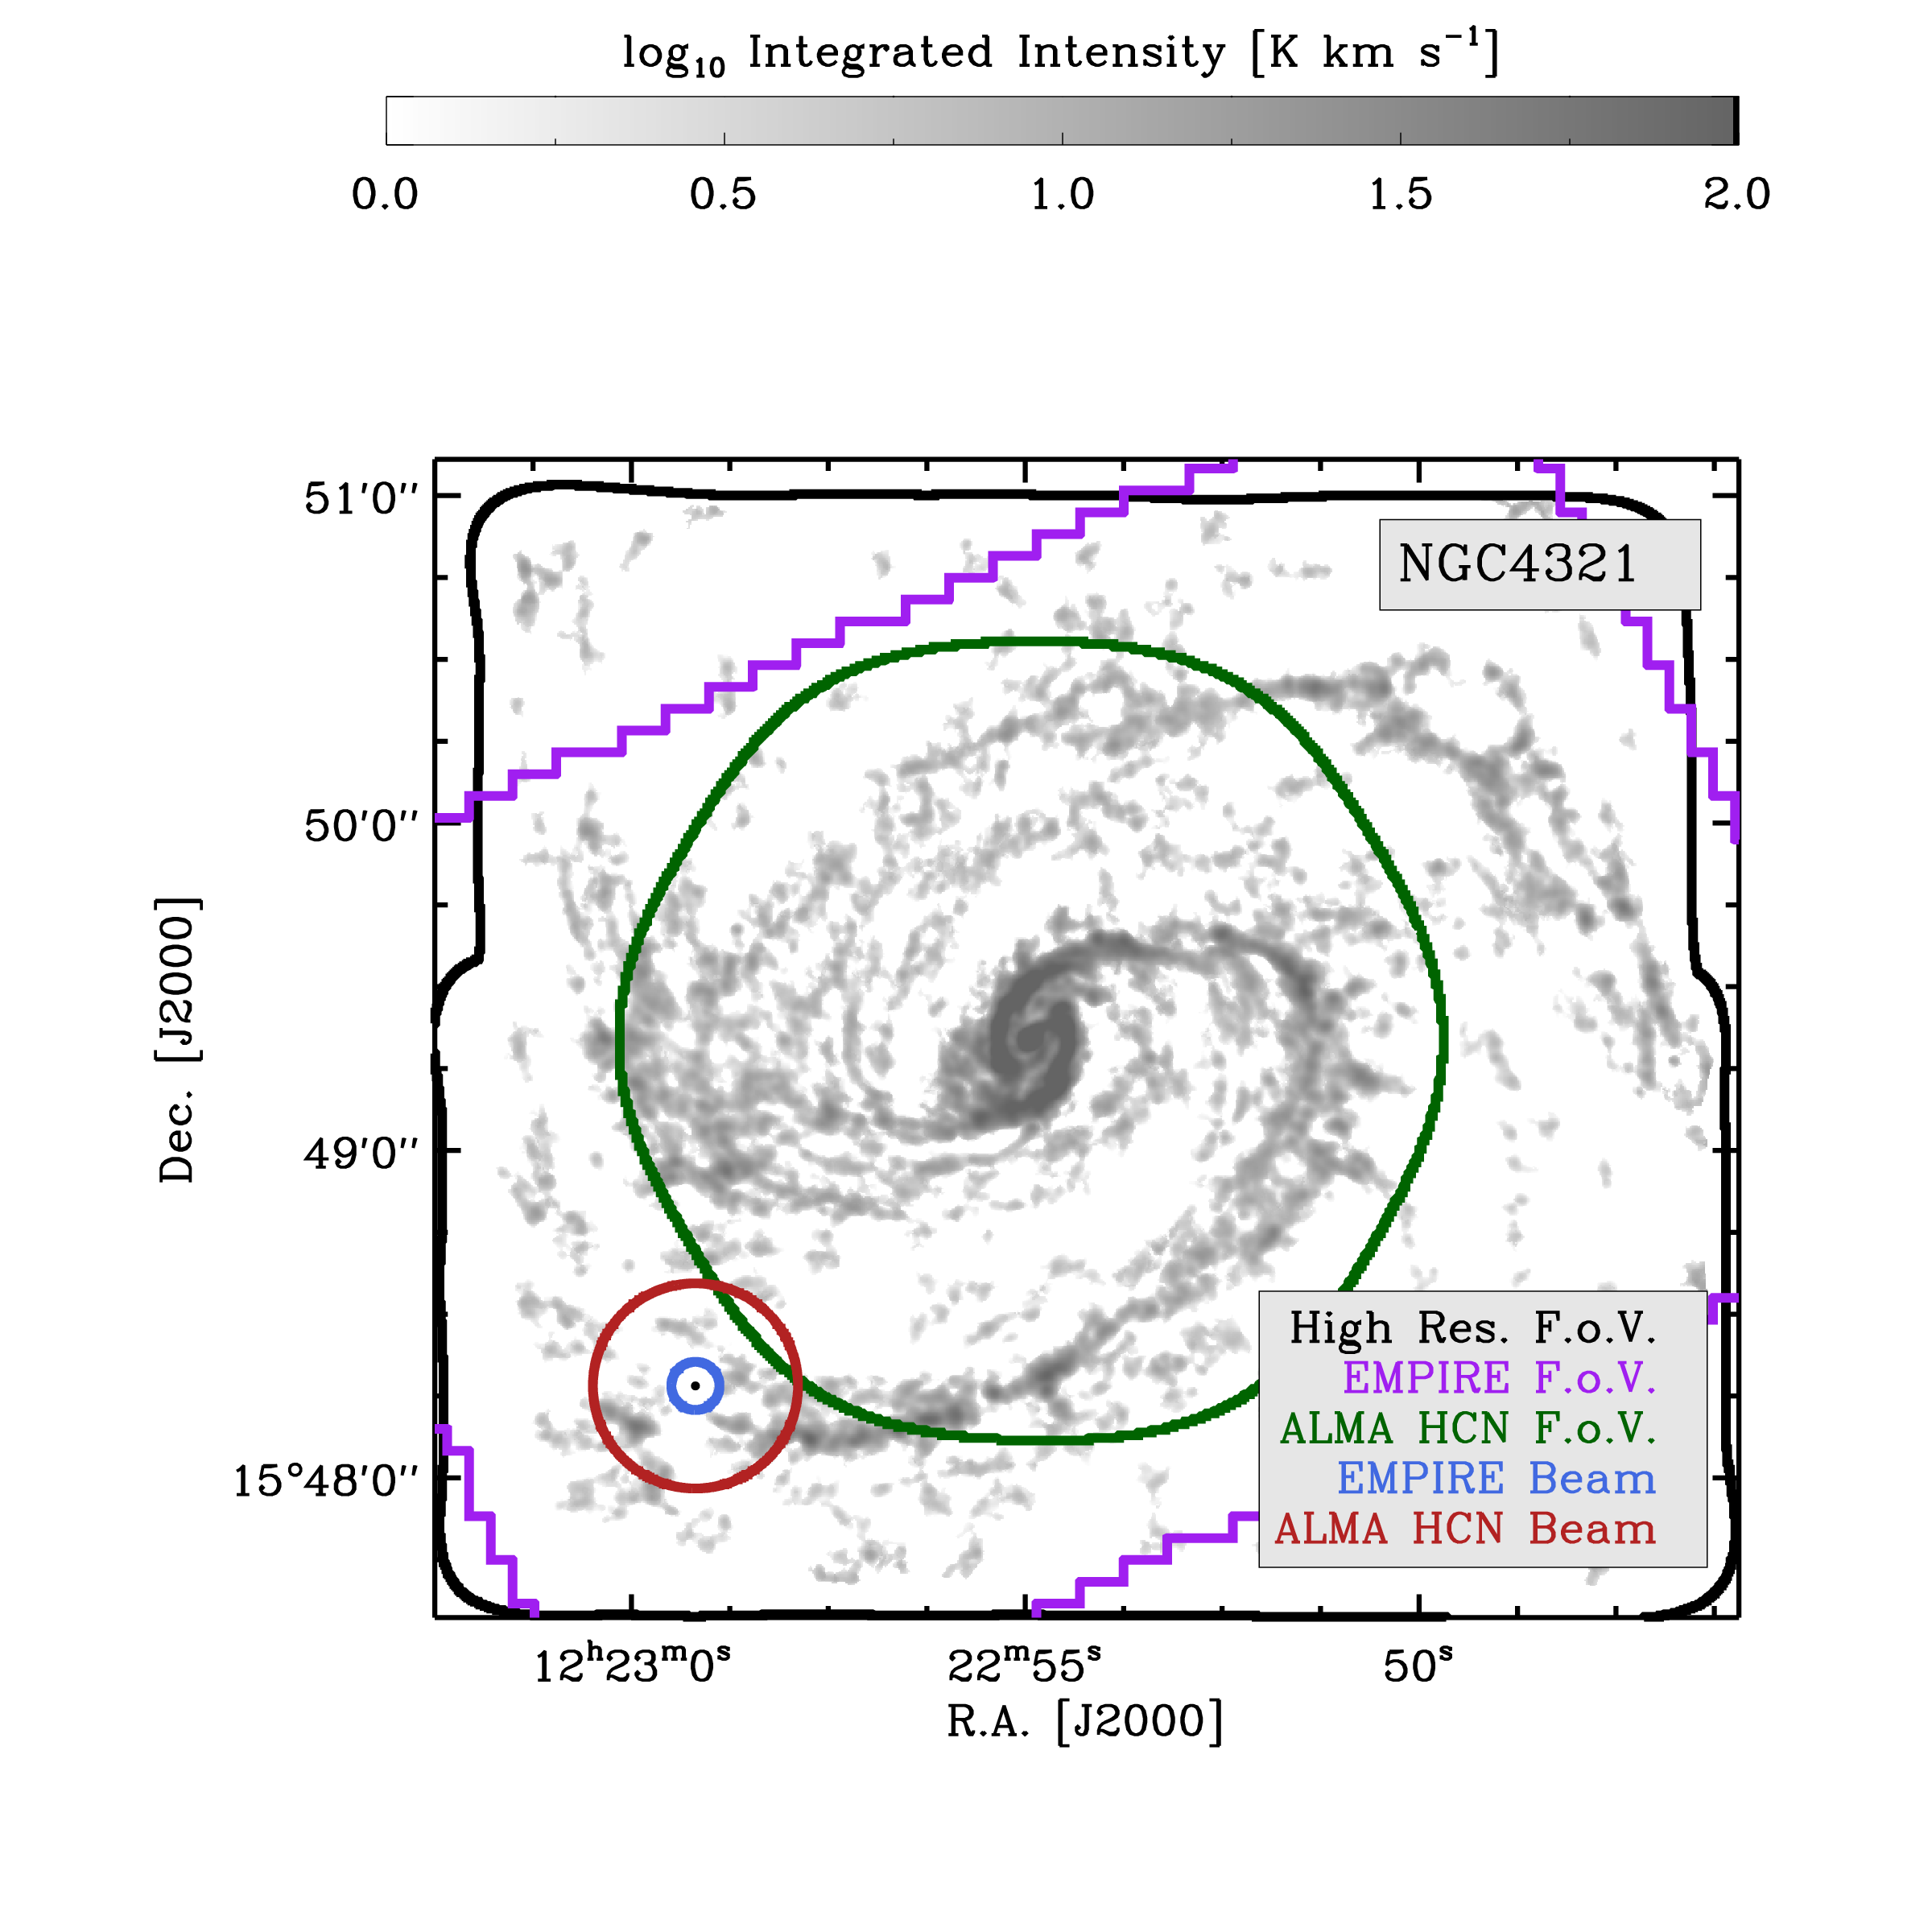
Jimenez Donaire et al. (in prep.) present a full description of EMPIRE, including the new CO (1-0) maps (see also Cormier et al., 2018), which we pair with the HCN maps to measure the HCN (1-0) to CO (1-0) ratio. Briefly, EMPIRE uses the IRAM 30-m in on-the-fly mapping mode to cover the area of active star formation in each target (see Figure 1). Observations were conducted from 2012 to 2016. The data were calibrated using GILDAS, extracted at km s-1 spectral resolution and then further reduced using an in-house pipeline. The pipeline fits and subtracts a second order polynomial baseline, avoiding regions of the spectrum known to have bright CO emission. It rejects spectra with measured noise significantly larger than that predicted by the radiometer equation. Then it projects the data on to grids with pixel size of . The adopted gridding kernel convolved with the IRAM 30-m beam yields a final angular resolution of . Finally, the pipeline converts the data to main beam temperature units, assuming main beam and forward efficiencies of 0.78 and 0.94 (Kramer, Penalver, & Greve 2013, IRAM calibration papers).
ALMA HCN Data: Gallagher et al. (2018) mapped HCN emission from four galaxies and assembled matched-resolution CO (1-0) maps from the literature444The matched-resolution CO (1-0) maps come from ALMA, CARMA, and BIMA. All include short and zero spacing data. Gallagher et al. (2018) give more details. The ALMA maps cover out to kpc, a smaller area than EMPIRE (Figure 1) but have a sharper resolution.
We take CO observations from BIMA SONG (Helfer et al. 2003) for NGC3351 and NGC3627. These cubes include data from both the BIMA interferometer and short-spacing data from the NRAO 12m single dish telescope on Kitt Peak. We take interferometric CO observations from CARMA STING (Rahman et al. 2011) for NGC4254. We combine this with single dish data from the CO extension to the IRAM EMPIRE survey (Cormier et al., 2018, M. Jiménez-Donaire et al. in prepation). We take CO data from the ALMA science verification program for NGC4321. This includes both main 12-m array and Atacama Compact Array (ACA) short spacing and total power data. We take the CO data from EMPIRE for NGC5194.
ALMA observed HCN (1-0) using a seven-field mosaic centered on the nucleus of the galaxy. The data were reduced using the CASA (McMullin et al., 2007) package and observatory-provided calibration scripts. They were then imaged using natural weighting with a small taper and a velocity resolution of 10 km s-1. Using the CASA task feather, the ALMA cubes were combined with the IRAM-30m maps (mostly from EMPIRE) to correct for missing short spacing data. The resulting cubes were convolved to a resolution of , chosen to match archival CO and infrared data (see Gallagher et al., 2018). The statistical noise in each km s-1 channel is mK.
For each sample, we convolve the HCN (1-0) and CO (1-0) data from the literature for all targets to a common physical resolution set by the physical beam size at the most distant target. This is 650 pc for ALMA and 2770 pc for EMPIRE. At this common resolution, we measure HCN/CO, the ratio of the HCN(1-0) to CO(1-0) integrated intensities. We constructed integrated intensity map of HCN using a mask defined in position-position-velocity space from the CO (1-0) cube. We then measure HCN/CO everywhere withing the fields of view that CO is detected (see Gallagher et al., 2018).
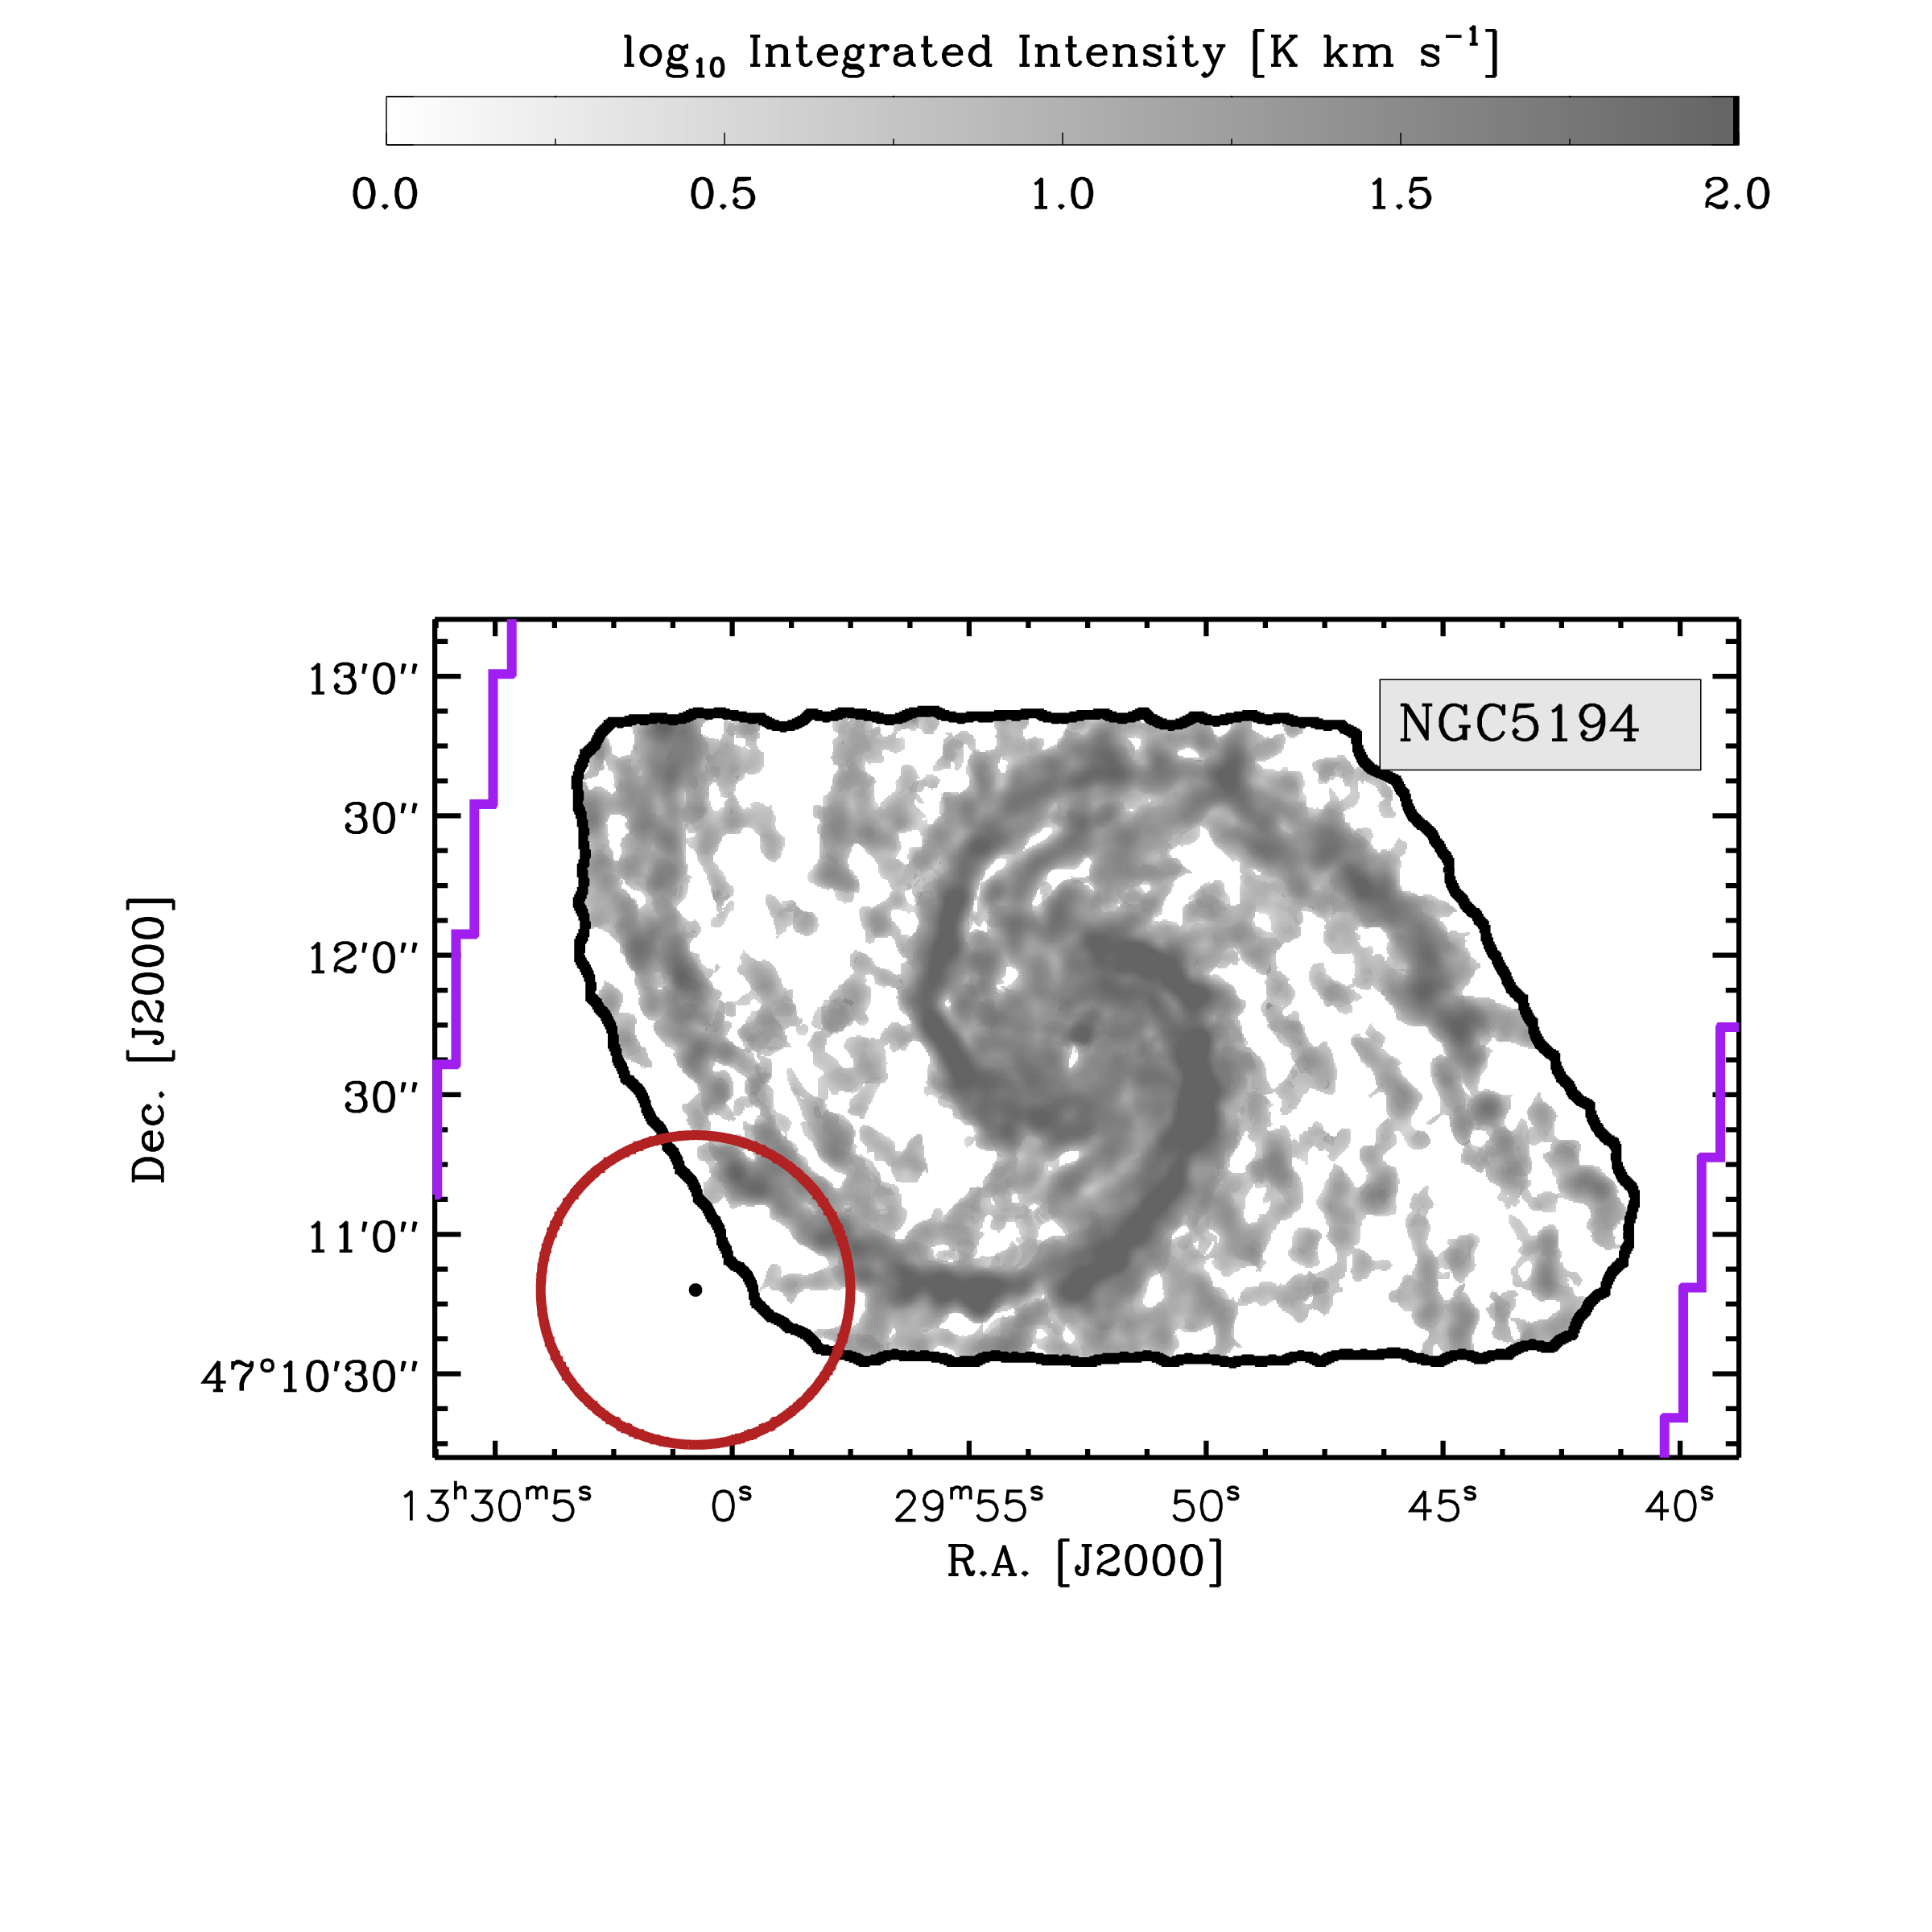
2.2 Average Cloud-Scale CO Intensity in each HCN Beam
We estimate the cloud-scale surface density from PHANGS-ALMA CO (2-1) and (for NGC 5194) PAWS CO (1-0) data at 120 pc resolution (see Figure 1). PHANGS ALMA produces CO (2-1) line maps with resolution, km s-1 velocity resolution, K noise per channel, and including short spacing and total power information from ALMA’s Morita Atacama Compact Array (ACA). Data reduction and imaging for PHANGS-ALMA are described in A. K. Leroy et al. in preparation. Details regarding the creation of moment maps, noise, and completeness for the four targets studied here appear in Sun et al. (2018). Given the distances and angular resolutions of these data, pc represents the common physical resolution for our high resolution CO data. We convolve all four CO (2-1) maps to share this common physical resolution.
For NGC 5194, we also convolve the PAWS CO (1-0) moment-zero map (Schinnerer et al., 2013; Pety et al., 2013) to 120 pc resolution. To place these measurements on the same CO (2-1) intensity scale as our other targets, we then multiply the PAWS CO (1-0) intensities by a typical CO (2-1)/CO (1-0) ratio of (uncertain by dex, see Leroy et al., 2013).
We measure HCN/CO at coarser resolution than we measure the CO (2-1) intensity, . To connect the two measurements, we calculate the intensity-weighted average within each larger HCN beam. This weighted average, , measures the mean 120 pc resolution from which CO photons emerge. Formally,
| (1) |
Here, is the CO map at 120 pc resolution, the asterisk represents convolution, and indicates the Gaussian kernel used to change the resolution of the map from 120 pc to the final resolution (650 pc for the ALMA sample and 2770 pc for the EMPIRE sample).
is the expectation value of CO intensity weighted by itself within each coarser HCN beam. In practice, given some conversion between light and mass (i.e., ), captures the mass-weighted 120 pc resolution surface density of molecular gas inside each larger HCN beam, .
The advantage of this approach, which is discussed at length by Leroy et al. (2016) (and see Ossenkopf & Mac Low, 2002; Utomo et al., 2018) is that it preserves the high resolution information and down-weights empty regions. Compared to the unweighted average, this intensity-weighted average, is dex higher at 650 pc resolution and dex higher at 2770 pc resolution. The intensity weighting is not equivalent to smoothing, as it effectively leverages the high resolution information and yields characteristic surface densities that are times higher than smoothed maps. The difference reflects beam dilution due to the large amount of empty space in the CO maps, which is also visible from Figure 1.
Uncertainty: We estimate the uncertainty in via a Monte-Carlo calculation. We begin with the original CO (2-1) cubes, add randomly generated Gaussian noise with the correct mean amplitude, and then run these noise-added cubes through our full analysis procedure. We repeat this process 100 times, and calculate the standard deviation in over all realizations. The mean error calculated in this way is K km s-1. As a result, all values in this paper have a signal-to-noise ratio .
The distances to our targets are uncertain by . The angular scale corresponding to pc is correspondingly uncertain, adding an additional uncertainty to our calculation. Using the same data that we use here, Sun et al. (2018) showed that changing from a physical resolution of 80 pc to 120 pc (i.e., by ) alters the mean in a galaxy by dex.
2.3 Binned Relation
Our EMPIRE and ALMA surveys only detect HCN along individual lines of sight at high signal-to-noise in the brightest regions of our targets. However, our data also contain a large amount of information at lower signal-to-noise.
We recover at high signal-to-noise across a wide area. Therefore, to access the fainter HCN emission, we measure the average HCN/CO in bins of . We report the integrated HCN divided by the integrated CO in each bin, with the statistical uncertainty on this binned ratio propagated from the original maps following Gallagher et al. (2018). This binning increases the signal-to-noise in HCN/CO via averaging and extends the dynamic range in our measured correlation dramatically.
Following Gallagher et al. (2018), our HCN integrated intensity maps are created by integrating the cube over the region with bright CO emission, whether or not that region shows HCN emission at high signal-to-noise. As a result, this averaging approach is almost equivalent to spectral stacking using the CO velocity field as a prior (as in Schruba et al., 2011; Jiménez-Donaire et al., 2017). We verify this by comparing the two approaches directly. After shifting the HCN cubes to the local mean CO velocity and averaging, we derive stacked line ratios in bins of . On average, the spectral stacking yields the same results as our mask-and-average approach within %, with no systematic offset.
2.4 Interpretation in Terms of Physical Quantities
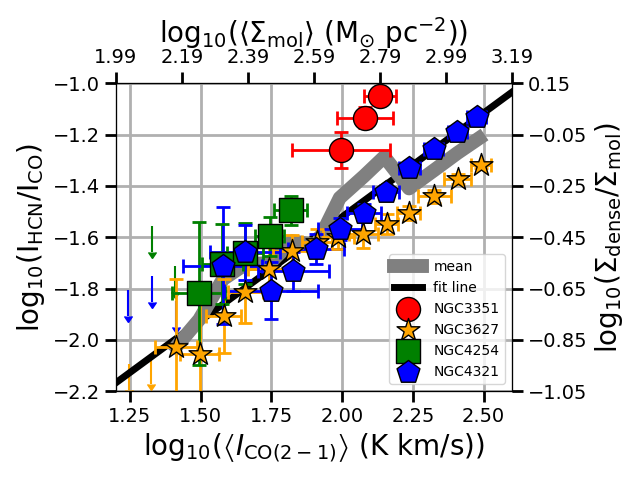
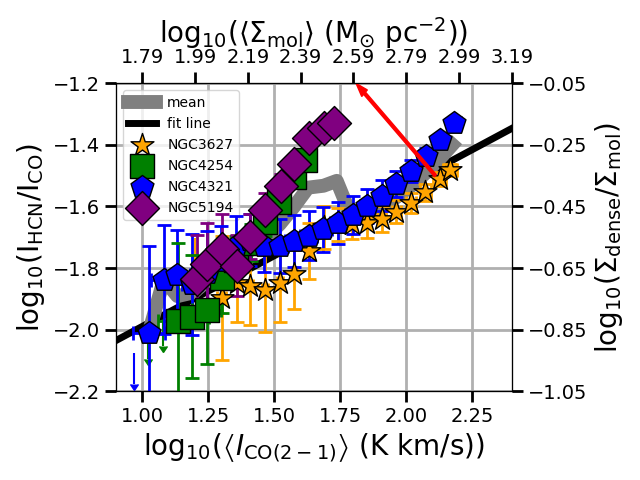
We report the observed HCN/CO ratio as a function of . These quantities are interesting because they trace the fraction of dense gas and the mean surface density of molecular clouds. Adopting simple translations from observables, we indicate these two physical quantities on the alternative right and top axes of Figures 2 and 3.
To translate HCN/CO to , we assume M⊙ pc-2 (K km s-1)-1 (Bolatto et al., 2013) and a more uncertain M⊙ pc-2 (K km s-1)-1 to convert HCN to the mass of gas above a density of cm-3 (Onus et al., 2018). For comparison, many previous studies have assumed M⊙ pc-2 (K km s-1)-1 for gas above cm-3 (following Gao & Solomon, 2004).
Both the density of gas traced by HCN (1-0) and the conversion from HCN emission to a dense gas mass remain uncertain. The effective critical density of HCN changes as a function of temperature and optical depth, which are hard to measure (Jiménez-Donaire et al., 2017). Moreover, gas at densities below the effective critical density still emits HCN, rendering the density traced by HCN a product of the emissivity and density distribution (Leroy et al., 2017). For more discussion, see Gao & Solomon (2004), Usero et al. (2015), Leroy et al. (2017), Onus et al. (2018), and Gallagher et al. (2018), as well as the Milky Way studies by Kauffmann et al. (2017), Mills & Battersby (2017), and Pety et al. (2017).
Similarly, we report as our primary measurement and the 120 pc resolution molecular gas surface density, , as an alternative axis. For a typical CO (2-1)/CO (1-0) ratio of , the Galactic CO-to-H2 conversion factor is M⊙ pc-2 (K km s-1)-1.
2.5 Additional Checks
To check our results, we also analyzed the ALMA HCN data at the EMPIRE common physical resolution of 2770 pc. At a fixed , the ALMA and EMPIRE data differ by a mean of 15% in HCN/CO. Mostly, this offset reflects that the two data sets cover different area (see Figure 1). When we match the areal coverage (i.e., consider EMPIRE only over the ALMA area), a smaller difference remains.
Our CO (1-0) data (used in the denominator of HCN/CO) come from different sources for EMPIRE and the ALMA sample. We estimate the uncertainty associated with our choice of CO map by considering NGC 4321, for which we have ALMA, BIMA, and IRAM 30-m CO (1-0) maps. We only have CARMA data for NGC4254 so we cannot explore how CARMA compares to our other CO (1-0) sources. We repeat our complete analysis with each NGC 4321 CO (1-0) map. At 650 pc resolution, the HCN/CO ratios measured using the ALMA CO map are dex lower than those measured using the BIMA map. At 2770 pc resolution, the ALMA map yields HCN/CO ratios dex lower than BIMA, while the EMPIRE maps yields ratios dex lower than BIMA. The ALMA and EMPIRE results agree within dex. Overall, we have good confidence in the EMPIRE and ALMA measurements, but the two BIMA-based CO maps may have results uncertain by dex at 650 pc resolution. While there are offsets between the ratio values calculated using different input data, these offsets do not change the nature of the observed trends.
3 Results
| HCN Data | Resolution | Rank. Corr. | Fit Slope, Intercept |
|---|---|---|---|
| ALMA | 650 pc | ||
| ALMA | 2770 pc | ) | |
| EMPIRE | 2770 pc |
Note. — Relation between mean 120 pc CO (2-1) intensity, , tracing cloud-scale mean surface density, and HCN/CO, tracing . HCN Data: the source of the HCN data. Rank Corr.: Spearman’s rank correlation coefficient relating HCN/CO to across all bins for all galaxies. All have values . Fit: Linear fit to the logarithmic data (i.e., power law fit), normalized at the lower end of the range for each sample. Shown in the table are the slope () and intercept () with associated uncertainties for the following equation: . To convert into an approximate relation between and surface density, use HCN/CO and .


3.1 Observed Correlation Between HCN/CO and Cloud-Scale Surface Density
Figures 2 and 3 show binned HCN (1-0)/CO (1-0) as a function of for our two subsamples. HCN (1-0)/CO (1-0) and are strongly positively correlated for all galaxies in both samples. Spearman’s rank correlation coefficient, , is high for both individual galaxies () and the entire sample (; Table 2). The corresponding low values indicate that this correlation is unlikely to be produced by random noise. Our measurements offer strong evidence for a significant underlying relationship between our (traced by HCN/CO) and cloud scale surface density (traced by ).
Table 2 reports power law fits (fit via the bisector method) that offer a reasonable description of each sample. We plot these as black lines in Figures 2 and 3.
These fits offer a good first-order description of the observed trends. However, we do observe substantial galaxy-to-galaxy variations in HCN/CO at fixed . The standard deviation in HCN/CO at fixed is 0.11 dex for the ALMA sample and 0.08 dex for the EMPIRE sample. Because of our binning approach, this reflects only the galaxy-to-galaxy scatter. If we were in a position to measure the cloud-to-cloud or region-to-region scatter within each , we would expect to find more variation.
NGC 3627 and NGC 4321 in the EMPIRE data (Figure 3) also exhibit different behavior at high and low . For these galaxies, the slope relating HCN/CO to steepens near ( K km s-1 M⊙) and these galaxies show higher and lower HCN/CO compared to the other two targets. Though we do not find similar curvature, the same two targets show a similar offset from NGC4254 to high and lower HCN/CO in the ALMA observations (Figure 2). Below, we suggest that “starburst”- like conversion factors in the centers of these galaxies offer a likely explanation for this behavior.
3.2 Implications
The correlation between HCN/CO and supports the idea that both quantities trace the density distribution of molecular gas. This suggests that the mean surface density of a molecular cloud and its dense gas content both reflect an underlying, environment-dependent gas density distribution.
Below, we show that this would be expected from simple models as long as cloud-scale mean surface density traces cloud-scale mean volume density. In fact, as discussed in Leroy et al. (2017, see their Figure 5), surface and volume density do correlate in recent molecular cloud catalogs. Moreover, the molecular gas scale height in the Milky Way appears relatively constant over the inner kpc (Heyer & Dame, 2015). In short, current evidence appears to support the idea that at high resolution molecular gas surface density tracks molecular gas volume density to first order (see also Utomo et al., 2018).
Connection to Environment: The regions of galaxies with high gas and stellar surface densities and high interstellar gas pressure also tend to have high dense gas fractions, (Usero et al., 2015; Bigiel et al., 2016; Gallagher et al., 2018). These also tend to be in the inner parts of galaxies, so the binned results in Figures 2 and 3 also roughly map to radius and stellar surface density, with the central regions of each galaxy mostly contributing to the top right part of the relationship.
At the same time, many recent studies have shown an environmental dependence of the cloud-scale properties of molecular gas (e.g., Hughes et al., 2013; Colombo et al., 2014; Leroy et al., 2016; Sun et al., 2018; Faesi et al., 2018). Broadly, these results have the same sense as those for . The internal pressure of molecular clouds appears to correlate with large scale environmental gas pressure, radius, and the stellar mass of the host galaxy (Hughes et al., 2013; Sun et al., 2018; Schruba et al., 2018).
Our results directly connect these two lines of evidence. The correlation that we observe suggests that the properties of the bulk molecular gas (e.g., Hughes et al., 2013; Colombo et al., 2014; Leroy et al., 2016; Sun et al., 2018; Faesi et al., 2018; Schruba et al., 2018) and (Gao & Solomon, 2004; Usero et al., 2015; Bigiel et al., 2016; Gallagher et al., 2018) reflect different aspects of the same environment-dependent density distribution. The sense of this correlation should broadly be that high pressure, high surface density, inner parts of galaxies have both high and high cloud-scale mean surface density.
Does Drive Galaxy-to-Galaxy Variations? Sandstrom et al. (2013) found that the CO-to-H2 conversion factor () is often lower than the standard Galactic value in the inner regions of galaxies with dense, bar-fed centers. Specifically, they found times lower in the center of NGC 3627 and NGC 4321 compared to the disks. NGC 4254 (Sandstrom et al., 2013) and NGC 5194 Leroy et al. (2017) do not show central depressions, and NGC 4254 may even show a central rise in . An arrow in Figure 3 indicates the effect of lowering (but not ) by a factor of . Adjusting the inner (high ) NGC 3627 and NGC 4321 points in this way would bring the different galaxies into better agreement. If and change in the same way, then the points only move horizontally.
Though not a unique explanation, a low due to bright diffuse (but not dense) molecular gas offers a feasible explanation for some of the offset among our targets. This change in as a function of ) could also explain the curvature in the EMPIRE results for NGC 3627 and NGC 4321.
Indirect Evidence That Both Axes Trace Density: A number of recent studies have raised concerns about the ability of HCN to trace dense gas (e.g., Pety et al., 2017; Leroy et al., 2017; Kauffmann et al., 2017; Rathborne et al., 2015). The unknown abundance of the molecule, its uncertain opacity (Jiménez-Donaire et al., 2017), and possible excitation effects (Shimajiri et al., 2017) all are likely to affect the HCN-to-dense gas conversion factor. Similarly, at 120 pc resolution may suffer from excitation effects (Koda et al., 2012). Variations in the line of sight depth could also introduce scatter in the relationship between mean volume density and mean surface density.
Despite these concerns, these two observables remain among our most practical tracers of and mean cloud-scale surface density for observations of external galaxies. Our finding that they track each other is a powerful, though still indirect, evidence that both the HCN/CO ratio and the cloud-scale CO intensity are meaningful tracers of gas density. FurtherMoreover, even if HCN traces lower density gas than is commonly assumed, the contrast between the HCN and CO lines still captures the shape of the density distribution to some extent.
3.3 Expectations From Simple Models
Our observed correlation would be expected if (1) HCN/CO traces the fraction of gas above some threshold density, (2) traces the mean surface density of molecular clouds, and (3) the mean surface density of a molecular cloud traces its mean volume density. Here we illustrate this by integrating over some simple models of gas density distributions.
We calculate as a function of mean density for three model gas volume density distributions555In our notation refers to the probability of finding a given piece of volume in the cloud to have density . refers to the probability density distribution as a function of density. The mass of material at a density will be . In figures we plot , illustrating the distribution of mass as a function of density.: (1) a “bottom heavy” power law with a slope of , such that ; (2) a power law with and a width of 2 dex; such a distribution has equal mass per logarithmic bin (i.e., a “top hat” in mass); and (3) a lognormal distribution with width of dex. Power law and lognormal distributions are currently the most popular ways to represent volume and column density distributions (e.g., Padoan & Nordlund, 2002; Kainulainen et al., 2009; Lombardi et al., 2015).
Figure 4 shows the shape of each model distribution for several mean densities. To calculate the dense gas mass fraction, we take the ratio of mass above two thresholds, one at low density (teal) and one at high density (light green). These thresholds correspond to the of the two lines. Dividing the mass above the high density threshold by the mass above the low density threshold we construct a model “dense gas fraction” similar to what we expect to find using the HCN/CO ratio.
To predict how depends on mean density, we repeat the exercise for many distributions. We leave the width (when applicable) and slope of each distribution fixed, keep the CO and HCN density thresholds fixed, and vary only the mean density of the cloud. The lines in the bottom right panel of Figure 4 shows the resulting as a function of mean density (the points indicate the specific cases illustrated in the other panels).
For all distributions, Figure 4 shows that as the mean density increases, a larger and larger fraction of the gas sits above the effective density of HCN (1-0) (the light green region). As a result, we expect a correlation between mean density and . At intermediate densities, where the mean density lies between the low (CO) and high (HCN) density threshold, power-law-like scaling relations between mean density and are common. If our observed , tracing the mean cloud-scale surface density, also traces the mean cloud-scale volume density then our observations would match the expectation from these simple models.
4 Summary
We measure how the ratio of HCN (1-0) to CO (1-0) emission depends on the 120 pc scale CO intensity, , in five nearby galaxies. HCN/CO traces the dense gas mass fraction, while measures the cloud-scale molecular gas mass surface density.
We find a strong correlation between these two quantities, albeit with differences in the shape and normalization from galaxy to galaxy. This could be expected if these two quantities trace different aspects of the same underlying distribution of gas densities. We illustrate this using simple model density distributions.
This result supports a view in which the large-scale structure of a galaxy shapes the local gas density distribution. Both the mean cloud-scale gas surface density, which is often measured as a property of molecular clouds, and the dense gas fraction, which is probed via spectroscopy, reflect this distribution. In this case, recent results tracing the environmental dependence of molecular cloud properties (e.g., Hughes et al., 2013; Colombo et al., 2014; Sun et al., 2018) and those showing a dependence of dense gas fraction on local disk structure (e.g., Usero et al., 2015; Bigiel et al., 2016; Gallagher et al., 2018) capture highly related aspects of the coupling between the physical state of cold gas and galactic environment.
Our analysis only scratches the surface of what can be done comparing cloud properties to density sensitive spectroscopy. In the near future, it should be possible to expand this sample by combining PHANGS-ALMA CO maps with new HCN observations from ALMA, the Green Bank Telescope, and the IRAM 30-m. Expanding the analysis to a suite of lines with a wide range of critical densities will better constrain the volume density distribution (Leroy et al., 2017; Gallagher et al., 2018). The CO imaging also includes information on cloud-scale dynamics, which will allow us to test how the the cloud-scale velocity dispersion and virial parameter relate to gas density and the star formation. Finally, as mentioned above, our knowledge of how HCN and similar lines trace dense gas is improving rapidly thanks to ongoing theoretical (e.g., Onus et al., 2018), extragalactic (e.g., Jiménez-Donaire et al., 2017), and Galactic studies (e.g., Pety et al., 2017; Kauffmann et al., 2017; Mills & Battersby, 2017).
References
- André et al. (2014) André, P., Di Francesco, J., Ward-Thompson, D., et al. 2014, Protostars and Planets VI, 27
- Bigiel et al. (2016) Bigiel, F., Leroy, A. K., Jiménez-Donaire, M. J., et al. 2016, ApJ, 822, L26
- Bolatto et al. (2013) Bolatto, A. D., Wolfire, M., & Leroy, A. K. 2013, ARA&A, 51, 207
- Chen et al. (2015) Chen, H., Gao, Y., Braine, J., & Gu, Q. 2015, ApJ, 810, 140
- Colombo et al. (2014) Colombo, D., Hughes, A., Schinnerer, E., et al. 2014, ApJ, 784, 3
- Cormier et al. (2018) Cormier, D., Bigiel, F., Jiménez-Donaire, M. J., et al. 2018, MNRAS, 475, 3909
- de Blok et al. (2008) de Blok, W. J. G., Walter, F., Brinks, E., et al. 2008, AJ, 136, 2648
- Dicaire et al. (2008) Dicaire, I., Carignan, C., Amram, P., et al. 2008, MNRAS, 385, 553
- Evans et al. (2014) Evans, II, N. J., Heiderman, A., & Vutisalchavakul, N. 2014, ApJ, 782, 114
- Faesi et al. (2018) Faesi, C. M., Lada, C. J., & Forbrich, J. 2018, ApJ, 857, 19
- Federrath & Klessen (2013) Federrath, C., & Klessen, R. S. 2013, ApJ, 763, 51
- Gallagher et al. (2018) Gallagher, M. J., Leroy, A. K., Bigiel, F., et al. 2018, ApJ, 858, 90
- Gao & Solomon (2004) Gao, Y., & Solomon, P. M. 2004, ApJ, 606, 271
- García-Burillo et al. (2012) García-Burillo, S., Usero, A., Alonso-Herrero, A., et al. 2012, A&A, 539, A8
- Gong et al. (2018) Gong, M., Ostriker, E. C., & Kim, C.-G. 2018, ApJ, 858, 16
- Heiderman et al. (2010) Heiderman, A., Evans, II, N. J., Allen, L. E., Huard, T., & Heyer, M. 2010, ApJ, 723, 1019
- Helfer et al. (2003) Helfer, T. T., Thornley, M. D., & Regan, M. W. 2003, ApJS, 145, 259
- Heyer & Dame (2015) Heyer, M., & Dame, T. M. 2015, ARA&A, 53, 583
- Hughes et al. (2013) Hughes, A., Meidt, S. E., Colombo, D., et al. 2013, ApJ, 779, 46
- Jiménez-Donaire et al. (2017) Jiménez-Donaire, M. J., Bigiel, F., Leroy, A. K., et al. 2017, MNRAS, 466, 49
- Kainulainen et al. (2009) Kainulainen, J., Beuther, H., Henning, T., & Plume, R. 2009, A&A, 508, L35
- Kauffmann et al. (2017) Kauffmann, J., Goldsmith, P. F., Melnick, G., et al. 2017, A&A, 605, L5
- Kennicutt et al. (2011) Kennicutt, R. C., Calzetti, D., Aniano, G., et al. 2011, PASP, 123, 1347
- Kepley et al. (2018) Kepley, A. A., Bittle, L., Leroy, A. K., et al. 2018, ArXiv e-prints, arXiv:1806.07973
- Koda et al. (2012) Koda, J., Scoville, N., Hasegawa, T., et al. 2012, ApJ, 761, 41
- Kruijssen et al. (2014) Kruijssen, J. M. D., Longmore, S. N., Elmegreen, B. G., et al. 2014, MNRAS, 440, 3370
- Krumholz & Thompson (2007) Krumholz, M. R., & Thompson, T. A. 2007, ApJ, 669, 289
- Lada et al. (2012) Lada, C. J., Forbrich, J., Lombardi, M., & Alves, J. F. 2012, ApJ, 745, 190
- Lada & Lada (2003) Lada, C. J., & Lada, E. A. 2003, ARA&A, 41, 57
- Lada et al. (2010) Lada, C. J., Lombardi, M., & Alves, J. F. 2010, ApJ, 724, 687
- Leroy et al. (2013) Leroy, A. K., Walter, F., Sandstrom, K., et al. 2013, AJ, 146, 19
- Leroy et al. (2016) Leroy, A. K., Hughes, A., Schruba, A., et al. 2016, ApJ, 831, 16
- Leroy et al. (2017) Leroy, A. K., Usero, A., Schruba, A., et al. 2017, ApJ, 835, 217
- Leroy et al. (2017) Leroy, A. K., Schinnerer, E., Hughes, A., et al. 2017, ApJ, 846, 71
- Lombardi et al. (2015) Lombardi, M., Alves, J., & Lada, C. J. 2015, A&A, 576, L1
- Longmore et al. (2013) Longmore, S. N., Bally, J., Testi, L., et al. 2013, MNRAS, 429, 987
- McMullin et al. (2007) McMullin, J. P., Waters, B., Schiebel, D., et al. 2007, ASPC, 376, 127
- Mills & Battersby (2017) Mills, E. A. C., & Battersby, C. 2017, ApJ, 835, 76
- Muñoz-Mateos et al. (2009) Muñoz-Mateos, J. C., Gil de Paz, A., Boissier, S., et al. 2009, ApJ, 701, 1965
- Onus et al. (2018) Onus, A., Krumholz, M. R., & Federrath, C. 2018, MNRAS, 479, 1702
- Ossenkopf & Mac Low (2002) Ossenkopf, V., & Mac Low, M.-M. 2002, A&A, 390, 307
- Padoan & Nordlund (2002) Padoan, P., & Nordlund, Å. 2002, ApJ, 576, 870
- Pety et al. (2013) Pety, J., Schinnerer, E., Leroy, A. K., et al. 2013, ApJ, 779, 43.
- Pety et al. (2017) Pety, J., Guzmán, V. V., Orkisz, J. H., et al. 2017, A&A, 599, A98
- Rathborne et al. (2015) Rathborne, J. M., Longmore, S. N., Jackson, J. M., et al. 2015, ApJ, 802, 125
- Rahman et al. (2011) Rahman, N., Bolatto, A. D., Wong, T., et al. 2015, ApJ, 802, 125
- Sandstrom et al. (2013) Sandstrom, K. M., Leroy, A. K., Walter, F., et al. 2013, ApJ, 777, 5
- Schinnerer et al. (2013) Schinnerer, E., Meidt, S. E., Pety, J., et al. 2013, ApJ, 779, 42
- Schruba et al. (2011) Schruba, A., Leroy, A. K., Walter, F., et al. 2011, AJ, 142, 37.
- Schruba et al. (2018) Schruba, A., Kruijssen, J. M. D., & Leroy, A. K. 2018, ApJ submitted
- Shimajiri et al. (2017) Shimajiri, Y., André, P., Braine, J., et al. 2017, A&A, 604, A74
- Sun et al. (2018) Sun, J., Leroy, A. K., Schruba, A., et al. 2018, ApJ, 860, 172
- Tully et al. (2009) Tully, R. B., Rizzi, L., Shaya, E. J., et al. 2009, AJ, 138, 323
- Usero et al. (2015) Usero, A., Leroy, A. K., Walter, F., et al. 2015, AJ, 150, 115
- Utomo et al. (2015) Utomo, D., Blitz, L., Davis, T., et al. 2015, ApJ, 803, 16
- Utomo et al. (2018) Utomo, D., Sun, J., Leroy, A. K., et al. 2018, ApJ, 861, L18.