11email: botteon@ira.inaf.it 22institutetext: INAF - IRA, via P. Gobetti 101, I-40129 Bologna, Italy 33institutetext: ASTRON, the Netherlands Institute for Radio Astronomy, Postbus 2, NL-7990 AA Dwingeloo, The Netherlands 44institutetext: Leiden Observatory, Leiden University, PO Box 9513, NL-2300 RA Leiden, The Netherlands 55institutetext: Hamburger Sternwarte, Universität Hamburg, Gojenbergsweg 112, D-21029 Hamburg, Germany 66institutetext: INAF - IASF Milano, via E. Bassini 15, I-20133 Milano, Italy 77institutetext: Max Planck Institut für Extraterrestrische Physik, Giessenbachstrasse 1, D-85748 Garching, Germany 88institutetext: Thüringer Landessternwarte, Sternwarte 5, D-07778 Tautenburg, Germany 99institutetext: Mbarara University of Science & Technology, PO Box 1410 Mbarara, Uganda 1010institutetext: Anton Pannekoek Institute for Astronomy, University of Amsterdam, Postbus 94249, NL-1090 GE Amsterdam, The Netherlands 1111institutetext: European Southern Observatory, Karl-Schwarzschild-Str. 2, D-85748 Garching, Germany
The spectacular cluster chain Abell 781 as observed with LOFAR, GMRT, and XMM-Newton
Abstract
Context. A number of merging galaxy clusters show the presence of large-scale radio emission associated with the intra-cluster medium (ICM). These synchrotron sources are generally classified as radio haloes and radio relics.
Aims. Whilst it is commonly accepted that mergers play a crucial role in the formation of radio haloes and relics, not all the merging clusters show the presence of giant diffuse radio sources and this provides important information concerning current models. The Abell 781 complex is a spectacular system composed of an apparent chain of clusters on the sky. Its main component is undergoing a merger and hosts peripheral emission that is classified as a candidate radio relic and a disputed radio halo.
Methods. We used new LOw Frequency ARay (LOFAR) observations at 143 MHz and archival Giant Metrewave Radio Telescope (GMRT) observations at 325 and 610 MHz to study radio emission from non-thermal components in the ICM of Abell 781. Complementary information came from XMM-Newton data, which allowed us to investigate the connection with the thermal emission and its complex morphology.
Results. The origin of the peripheral emission is still uncertain. We speculate that it is related to the interaction between a head tail radio galaxy and shock. However, the current data allow us only to set an upper limit of on the Mach number of this putative shock. Instead, we successfully characterise the surface brightness and temperature jumps of a shock and two cold fronts in the main cluster component of Abell 781. Their positions suggest that the merger is involving three substructures. We do not find any evidence for a radio halo either at the centre of this system or in the other clusters of the chain. We place an upper limit to the diffuse radio emission in the main cluster of Abell 781 that is a factor of 2 below the current radio power-mass relation for giant radio haloes.
Key Words.:
radiation mechanisms: non-thermal – radiation mechanisms: thermal – galaxies: clusters: general – galaxies: clusters: individual: A781 – galaxies: clusters: intracluster medium – radio continuum: general1 Introduction

Mergers between galaxy clusters are the most energetic phenomena in the Universe after the Big Bang with the total kinetic energy of the collision reaching erg in a crossing timescale ( Gyr). Part of this energy is dissipated in non-thermal processes in the intra-cluster medium (ICM), i.e. in the (re)acceleration of relativistic particles and amplification of the magnetic field (e.g. Dolag et al., 2008; Brunetti & Jones, 2014, for reviews). The observation of diffuse synchrotron radio emission in some merging galaxy clusters probes the presence of non-thermal components spread on Mpc-scale in the ICM. These non-thermal sources are characterised by steep spectra (i.e. , with ), and are commonly classified as radio haloes and radio relics (e.g. Feretti et al., 2012, for and observational overview).
Radio haloes are generally centrally located, show roundish morphologies roughly tracing the X-ray thermal emission, and are apparently unpolarised. According to the favoured scenario, radio haloes are produced by the turbulence injected into the ICM during major merger events (Brunetti et al., 2001; Petrosian, 2001). This model seems to be supported by the connection observed between clusters hosting radio haloes and dynamically disturbed systems (e.g. Buote, 2001; Cassano et al., 2010b; Cuciti et al., 2015). Nonetheless, the details of the mechanisms that channel the energy released on large scales to collisionless small scales in the ICM are still poorly understood (e.g. Brunetti & Lazarian, 2011; Miniati, 2015; Brunetti, 2016).
Radio relics are polarised and elongated sources that are usually found in the outskirts of galaxy clusters. Shocks generated in cluster mergers have been proposed to explain the origin of radio relics (Enßlin et al., 1998; Roettiger et al., 1999). Indeed, the relic–shock connection is supported by the increasing number of shocks detected at the location of radio relics (e.g. Botteon et al., 2016b; Eckert et al., 2016b; Akamatsu et al., 2017, for recent works). However, the luminosity of some radio relics is much higher than expected from the presumed acceleration efficiency of thermal electrons owing to diffuse shock acceleration (DSA) at low Mach number () shocks (see Brunetti & Jones 2014 and Botteon et al. 2016a; Eckert et al. 2016b; van Weeren et al. 2016a; Hoang et al. 2018 for more recent papers). In this respect, the presence of an existing population of relativistic electrons to re-accelerate is a prerequisite of some more recent models (e.g. Kang & Ryu, 2011, 2016; Pinzke et al., 2013; Caprioli & Zhang, 2018) that seems to be corroborated by a number of observations (e.g. Bonafede et al., 2014; Shimwell et al., 2015; van Weeren et al., 2017).
Observations at low frequencies with the LOw Frequency ARray (LOFAR; van Haarlem et al., 2013), Murchison Widefield Array (MWA; Tingay et al., 2013), and, in the future, with the Square Kilometre Array (SKA; Dewdney et al., 2009), are expected to detect many new diffuse radio sources in galaxy clusters that can be used to increase our knowledge of non-thermal phenomena in the ICM (e.g. Röttgering et al., 2006, 2011; Cassano et al., 2010a; Nuza et al., 2012). In particular, the LOFAR Two-metre Sky Survey (LoTSS; Shimwell et al., 2017) is observing the northern sky at MHz and will produce images with unprecedented resolution ( ′′) and sensitivity ( Jy beam-1) in this frequency range.
Abell 781 is a complex system with multiple galaxy cluster components (Wittman et al., 2006, 2014; Abate et al., 2009; Geller et al., 2010; Cook & Dell’Antonio, 2012). In X-ray wavelengths, it appears as a chain with four prevailing clusters that extends over in the E-W direction (Wittman et al., 2006; Sehgal et al., 2008). Fig. 1 shows an XMM-Newton image of the system where we labelled the clusters following Sehgal et al. (2008) and reported the redshifts from Geller et al. (2010). These four clusters lie in two different redshift planes: the “Main” (hereafter referred to as A781) and “Middle” are located at whereas the “East” and “West” are located at ; therefore they are not related to the other two clusters of the system. The mass of the main cluster is , as reported in the second Planck catalogue of Sunyaev-Zel’dovich sources (PSZ2; Planck Collaboration XXVII, 2016).
Observations taken with the Giant Metrewave Radio Telescope (GMRT) at 610 MHz revealed the presence of a peripheral source at the boundary of the X-ray thermal emission of A781, which was suggested to be a candidate radio relic by Venturi et al. (2008). Although this interpretation would be in agreement with the location of the emission in the cluster outskirts, the source morphology is puzzling: neither arc-like nor elongated, its morphology changes from 610 to 325 MHz (Venturi et al., 2011, hereafter V11). The source is also detected with the Very Large Array (VLA) at 1.4 GHz (Govoni et al., 2011, hereafter G11). The presence of a central radio halo in A781 is also disputed, it was observed at high frequency with the VLA (G11) but not at lower frequencies with the GMRT (Venturi et al., 2008, 2011, 2013).
In this work, we present a new LOFAR observation at MHz and the reanalysis of archival GMRT and XMM-Newton observations of the cluster chain Abell 781. In particular, we focus on the main merging cluster of the complex to study the peripheral source and shed light on the presence of the radio halo that has been reported in the literature.
Throughout the paper, we assume a CDM cosmology with , and km s-1 Mpc-1, for which the luminosity distance is Mpc and 1′′ equals kpc at the redshift of A781 (). Uncertainties are provided at the confidence level for one parameter, unless stated otherwise.
2 Observations and data reduction
| LOFAR | GMRT | GMRT | |
| Project code | LC6_015 | 11TVA01 | 08RCA01 |
| Observation date | 2016 Dec 02 | 2007 Jan 29 | 2005 Oct 02 |
| Total on-source time (hr) | 8.0 | 9.2 | 3.4 |
| Flux calibrator | 3C196 | 3C286 | 3C48 |
| Total on-calibrator time (min) | 10 | 30 | 34 |
| Central frequency (MHz) | 143 | 325 | 610 |
| Bandwidth (MHz) | 48 | 33 | 33 |
2.1 LOFAR
We analysed the LoTSS (Shimwell et al., 2017, 2018) pointing closest to A781 (offset by ). The observation is 8 hr long and used the Dutch High Band Antenna (HBA) array operating at MHz (see Tab. 1 for more details).
The data reduction performed in this work follows the facet calibration scheme developed to analyse LOFAR HBA data (van Weeren et al., 2016b; Williams et al., 2016; de Gasperin et al., 2018). This procedure consists of two steps, and can be summarised as follows.
-
1.
In the first step, direction-independent calibration is performed via prefactor111https://github.com/lofar-astron/prefactor. Data are averaged and flagged to reduce the data set size and excise bad quality data. The flux density calibrator 3C196 is used to calibrate complex gains and clock offsets between different antenna stations adopting the absolute flux density scale of Scaife & Heald (2012). After the transfer of amplitude and clock solutions to the target, an initial phase calibration is performed using a Global Sky Model for LOFAR222https://support.astron.nl/LOFARImagingCookbook. This is followed by a preliminary low- and high-resolution imaging of the entire field of view (FOV). Compact and diffuse sources are detected in these images with the PYthon Blob Detector and Source Finder (pybdsf; Mohan & Rafferty 2015) and then subtracted from the uv-data creating “blank” field data sets in preparation of the next step of the data reduction.
-
2.
In the second step, direction-dependent calibration is performed via factor333https://github.com/lofar-astron/factor. The large primary beam of LOFAR requires that phase and amplitude calibration solutions are computed in small portions of the sky because of the different distortions introduced by the ionosphere and because of the beam model errors over the FOV. For this reason, the FOV is tessellated in facets where a facet calibrator (generally a bright source or a group of closely spaced sources) is used to evaluate the gain and phase solutions in a restricted area of the sky. A number of self-calibration cycles are performed on the facet calibrator, then its solutions are used to calibrate the faint sources subtracted in the previous step that are added back to the data after the self-calibration of the facet. Before moving to the subsequent facet,which generally has a fainter flux density calibrator, the clean components of the processed facet are subtracted from the uv- data to reduce the systematics and effective noise in the data set. This procedure is repeated for all the directions leaving the facet containing A781 at the end. In this way the target facet benefits from the subtraction of the previous facets, in principle allowing us to achieve nearly thermal noise limited images.
The LOFAR images reported in the paper were produced with WSClean v2.4 (Offringa et al., 2014) and have a central observing frequency of 143 MHz. The imaging was carried out using the multi-scale multi-frequency deconvolution algorithm described in Offringa & Smirnov (2017). Data were calibrated (and subsequently imaged) applying an inner uv-cut of to eliminate the noise from the shortest baselines. The largest angular scale that is possible to recover with this uv-cut is , larger than the separation between each cluster of the chain. The uv-tapering of visibilities and the Briggs weighting scheme (Briggs, 1995) with different robust values were used to obtain two images with different resolutions. The low-resolution image of the cluster chain is shown in Fig. 2.
It is known that the LOFAR flux density scale can show systematic offsets and needs to be corrected relying on other surveys (e.g. van Weeren et al., 2016b; Hardcastle et al., 2016). In this respect, we cross-matched a catalogue of LOFAR point sources extracted in the facet containing A781 with the WEsterbork Northern Sky Survey at 325 MHz (WENSS; Rengelink et al., 1997). We rescaled the WENSS flux densities at 143 MHz assuming a spectral index . The adopted correction factor of 0.85 on LOFAR flux densities was derived from the mean flux density ratio LOFAR/WENSS143. We conservatively set a systematic uncertainty of 20% on LOFAR flux density measurements.


2.2 GMRT
Venturi et al. (2008, 2011) presented GMRT observations of A781 at 325 MHz and at 610 MHz. In this work, we reanalysed these data sets with the Source Peeling and Atmospheric Modeling (spam) package (Intema et al., 2009) and produced new images of the cluster. The details of the observations are shown in Tab. 1. The data reduction with spam consists of a standard-automated pipeline that includes data averaging, instrumental calibration, multiple cycles of self-calibration, and flagging of bad data. Furthermore, the bright sources within the primary beam are selected and used to perform a direction-dependent calibration, whose solutions are interpolated to build a global ionospheric model to suppress ionospheric phase errors. The calibrated data are then reimaged with WSClean v2.4 (Offringa et al., 2014), as described at the end of Section 2.1. Further details on the spam pipeline are provided in Intema et al. (2009, 2017). The flux density scale in the images was set by calibration on 3C48 (at 610 MHz) and 3C286 (at 325 MHz) using the models from Scaife & Heald (2012). No flux scale offset (e.g. from the system temperature; see Sirothia 2009) was found by cross-matching a catalogue of GMRT sources with the WENSS (Rengelink et al., 1997). Residual amplitude errors are estimated to be 15% at 325 MHz and 10% at 610 MHz, which agrees with other studies (e.g. Chandra et al., 2004).
2.3 XMM-Newton
The Abell 781 complex was observed twice with XMM-Newton (ObsID: 0150620201 and 0401170101), for a total exposure time of 98.7 ks. Data reduction was performed using the pipeline developed to analyse the observations of the XMM-Newton Cluster Outskirts Project (X-COP; Eckert et al., 2017), which is fully described in Ghirardini et al. (2018). The pipeline uses the Extended Source Analysis Software (esas) developed within the XMM-Newton Scientific Analysis System (sas v14.0.0) to analyse European Photon Imaging Camera (EPIC) observations. Briefly, the tasks mos-filter and pn-filter were used to filter out observation periods affected by soft proton flares. Residual soft proton flare contamination was checked by measuring in a hard band the count rates of the MOS and pn cameras in the exposed and unexposed parts of the detectors FOV (inFOV/outFOV; see Leccardi & Molendi 2008). The results of this procedure are summarised in Tab. 2. For MOS cameras, values of inFOV/outFOV below 1.15 indicate absence of residual soft proton flares while values between 1.15 and 1.30 indicate a slight contamination of soft proton flares. Single detector count images were then combined to produce the mosaic EPIC background-subtracted and exposure-corrected images in the keV band shown in Figs. 1 and 2. The tasks ewavelet and cheese were used to detect and exclude point sources before the spectral region extraction and surface brightness profile fitting. The output files of the routines were checked for missed sources and/or false detections; therefore contaminating point sources were excised.
Spectra of the two ObsIDs were extracted in the same regions and jointly fitted in the keV band (MOS detectors) and in the keV band (pn detector) with xspec v12.9.0o (Arnaud, 1996) adopting Cash statistics (Cash, 1979). The energy range keV was excluded in the fit owing to strong instrumental emission lines; for the pn detector, we also excluded the range keV for the same reason. The non-X-ray background was modelled with a phenomenological model that includes a number of fluorescence lines (see Ghirardini et al., 2018). The local sky background was estimated in a cluster free region adopting a model composed of a cosmic X-ray background component, which was modelled with an absorbed power law with photon index (De Luca & Molendi, 2004), and of a Galactic foreground component, which was modelled with two thermal plasmas (one unabsorbed and the other absorbed) with solar metallicity and temperatures keV and keV (McCammon et al., 2002). The ICM emission was modelled with an absorbed thermal model with normalization, metallicity, and temperature free to vary in the fit. Galactic absorption in the direction of the cluster was set to cm-2 (Kalberla et al., 2005).
Surface brightness profiles were extracted and fitted with proffit v1.5 (Eckert et al., 2011) from the EPIC mosaic image in the keV band. All the profiles reported in the paper were convolved for the XMM-Newton point spread function that was modelled with the psf task (for more details, see Appendix C in Eckert et al., 2016a).
| Exposure | inFOV/outFOV | |
| (ks) | ||
| ObsID | 0150620201 | |
| MOS1 | 14.5 | |
| MOS2 | 14.2 | |
| pn | 10.5 | |
| ObsID | 0401170101 | |
| MOS1 | 58.6 | |
| MOS2 | 60.8 | |
| pn | 47.5 | |
3 Results


3.1 The peripheral emission in A781


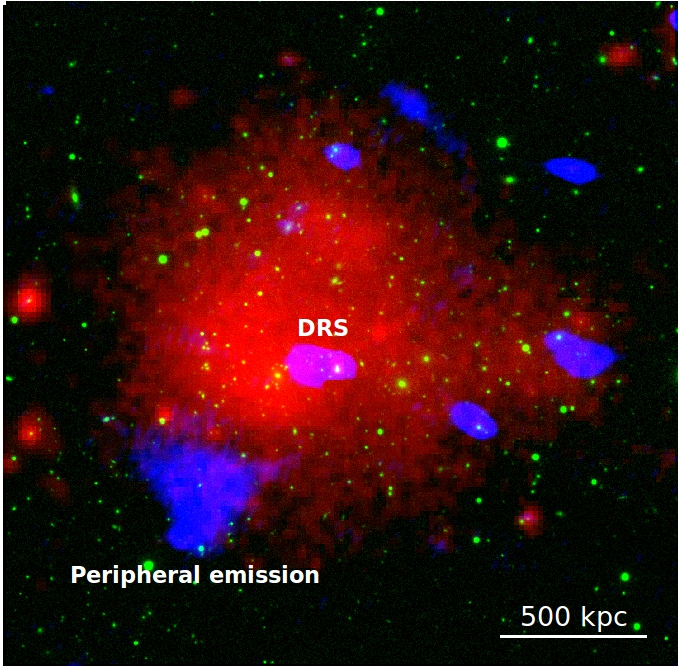
The peripheral diffuse radio emission in the SE outskirts of the main cluster (Fig. 3) was classified as a candidate radio relic by Venturi et al. (2008). The source has been observed with the GMRT (Venturi et al., 2008, 2011, 2013) and VLA (G11); it is also detected in the NRAO VLA Sky Survey (NVSS; Condon et al., 1998) but not in the Faint Images of the Radio Sky at Twenty-cm survey (FIRST; Becker et al., 1995).
In Fig. 4, we show our images of the peripheral emission at three frequencies with comparable resolution obtained from the new LOFAR data and from the reanalysis of the archival GMRT observations. The flux densities measured within the LOFAR contour in these images are mJy, mJy, and mJy, where the quoted errors are given by the uncertainty in the flux density scale and the noise of the images weighted for the number of beams added in quadrature. The source morphology is consistent between 143 MHz and 610 MHz, appears slightly more extended at low frequency, and has a largest linear size of kpc. The source displays a peculiar wedge shape characterised by a bright knot of emission in the SE that is attached to a high surface brightness spine that is extended NW in the direction of the central double radio source (DRS; cf. Fig. 3). The radio emission shows a sharper edge towards the E direction where the X-ray thermal emission also fades away.
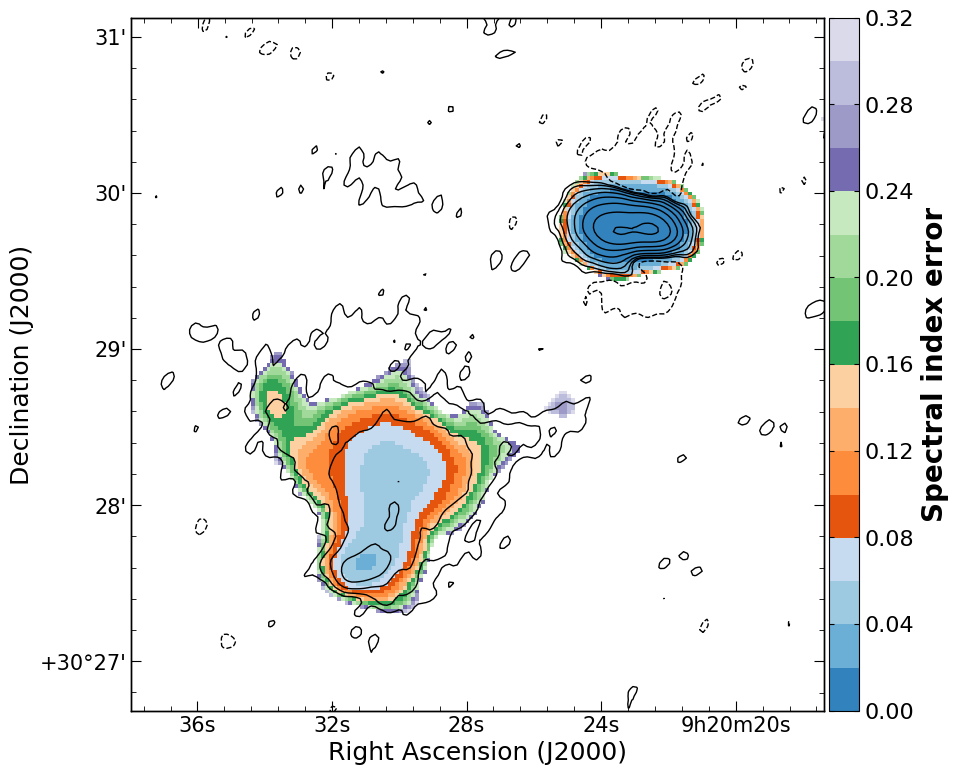
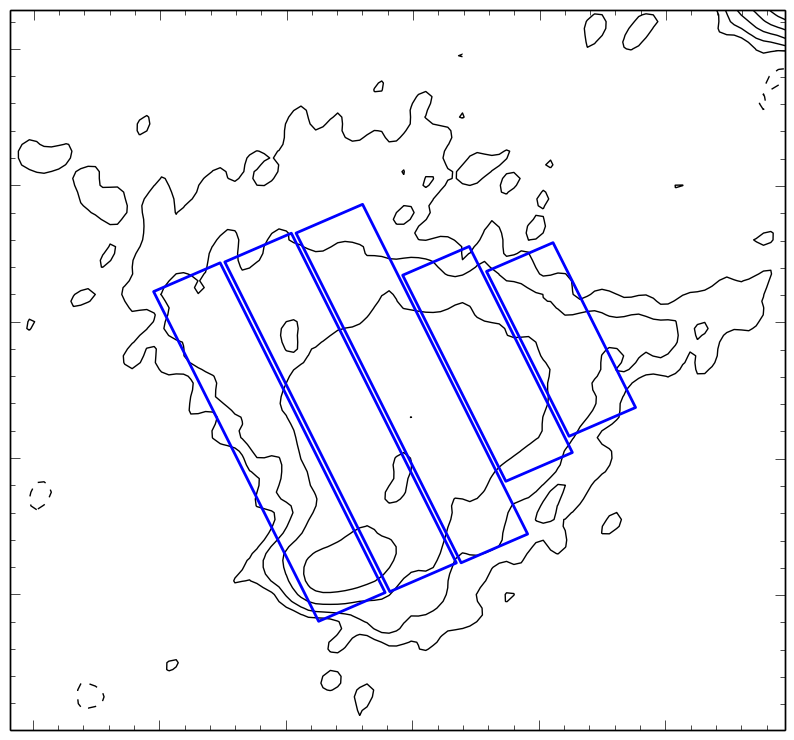
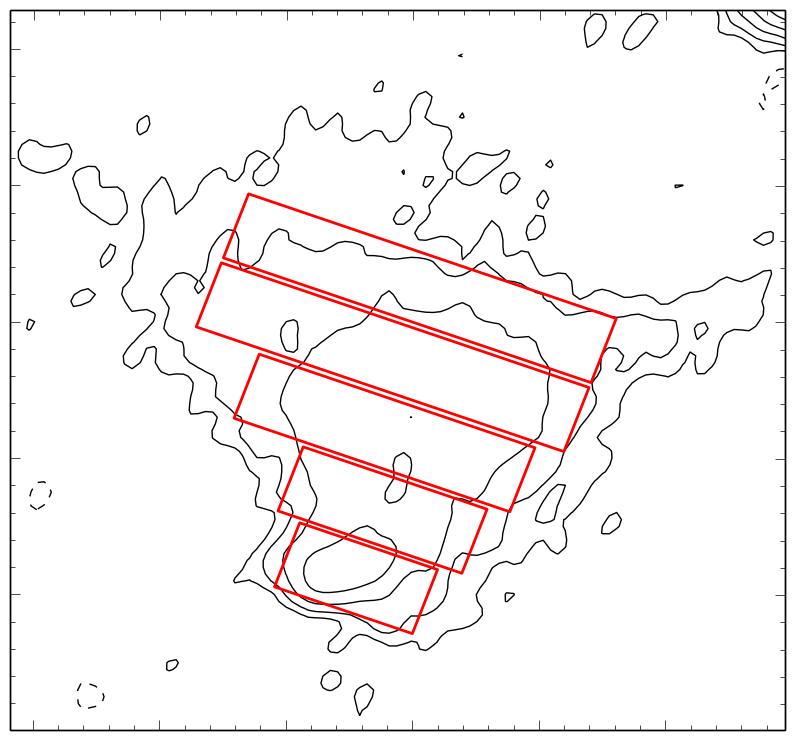
We measured the spectral index properties of the source from images produced with a uniform weighting scheme and with matched uv-range. The integrated spectral index computed between the three frequencies is (Fig. 5), which is consistent within the errors with that reported by V11. The -corrected and spectral index rescaled radio power of the source at 1.4 GHz is W Hz-1, assuming that it is located at the cluster redshift . The spectral index map calculated from the 143 MHz and 610 MHz images convolved to the same resolution of , corrected for any position misalignment, and regridded to identical pixel size, is shown in Fig. 6 (the error map is reported in Appendix A). This map shows that the SE bright knot of emission also has a flatter spectral index, possibly arising from the radio emission of an active galactic nucleus (AGN). In the Sloan Digital Sky Survey (SDSS; York et al., 2000), two possible optical counterparts are observed in this position (see inset panel in Fig. 6); these are discussed in Section 4.1. The absence of significant compact emission at a level of 0.5 mJy beam-1 in the FIRST data suggests that the AGN is not active anymore. The diffuse source exhibits a hint of spectral index flattening in coincidence with the E edge of the radio emission. The spectral index gradually steepens in the direction of the DRS, where . A similar spectral trend can be inferred also from Fig. 5 of G11, despite the lower resolution () of their spectral index map. As a further check, we evaluated the spectral index of the peripheral source in sectors, as shown in Fig. 7. This confirms a spectral gradient in both the E-W and S-N directions. We mention that spectral index steepening towards the cluster centre has been observed in a number of radio relics (e.g. Giacintucci et al., 2008; van Weeren et al., 2010; de Gasperin et al., 2015; Hoang et al., 2018).
3.2 X-ray discontinuities in the ICM
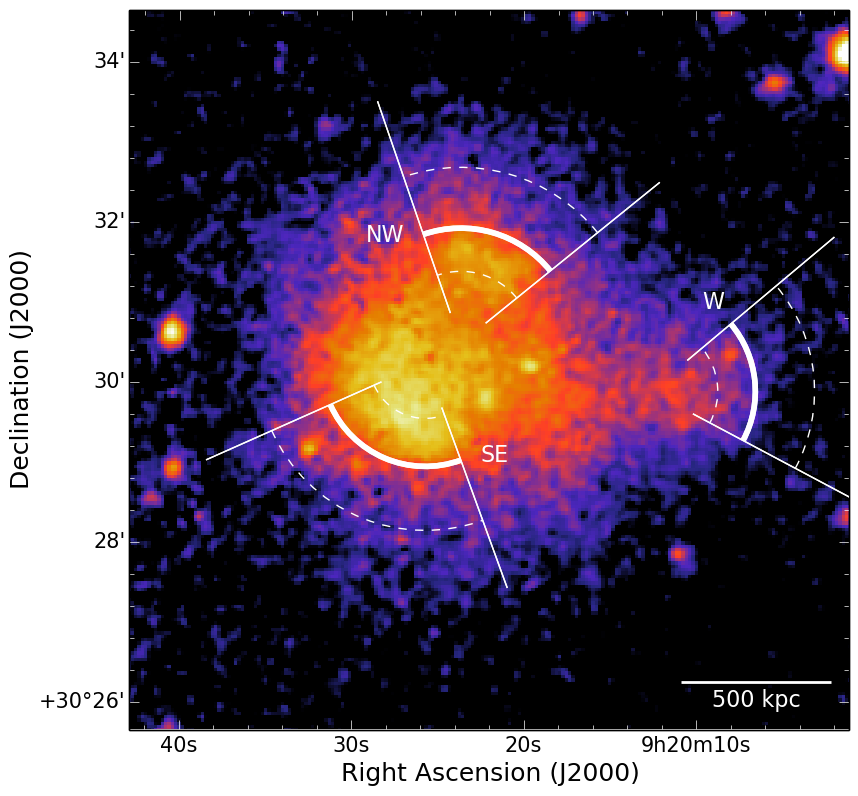
The visual inspection of the XMM-Newton image in the keV band suggests the presence of three surface brightness jumps in A781, towards the SE, NW, and W directions, that have not been studied in the literature so far. We investigated the possible features with the fitting of the surface brightness profiles extracted in the sectors highlighted in Fig. 8. A broken power-law model was assumed to fit the data as it generally provides a good description of discontinuities in the ICM, namely shocks and cold fronts (e.g. Markevitch & Vikhlinin, 2007; Owers et al., 2009; Botteon et al., 2018a). A single power-law model was also fitted for comparison. The three profiles are shown in Fig. 9. The broken power-law models always yield the best description of the data, confirming the existence of drops in surface brightness. The compression ratios between the downstream and upstream density are (SE), (NW), and (W).
| SE | NW | W | |
|---|---|---|---|
| (keV) | |||
| (keV) | |||
In order to determine the nature of the edges (shocks or cold fronts), a careful spectral analysis is necessary. Shocks are characterised by higher temperature and pressure in the downstream region than in the upstream region. Instead, the temperature jump is inverted and the pressure is almost continuous across cold fronts. We extracted and fitted spectra in the downstream and upstream regions delimited by the dashed and solid lines in Fig. 8. The pressure jump at the discontinuity can be computed as the product between the density and temperature ratios444Although this procedure combines a deprojected density jump with a temperature evaluated along the line of sight, previous studies have shown that projection effects do not have a strong impact (e.g. Botteon et al., 2018a). achieved with the spatial and spectral analysis, respectively. Results are summarised in Tab. 3. All the surface brightness discontinuities are associated with temperature jumps. For the SE and NW edges, the downstream temperature is lower and the pressure is consistent to be constant across the discontinuities, as expected in the case of cold fronts. For the W edge, the downstream gas is hotter and a pressure jump is observed, revealing the shock nature of the discontinuity. We applied the Rankine-Hugoniot equations (e.g. Landau & Lifshitz, 1959) to derive independent constraints of the shock Mach number from the temperature and density jumps, leading to consistent values of and , respectively.


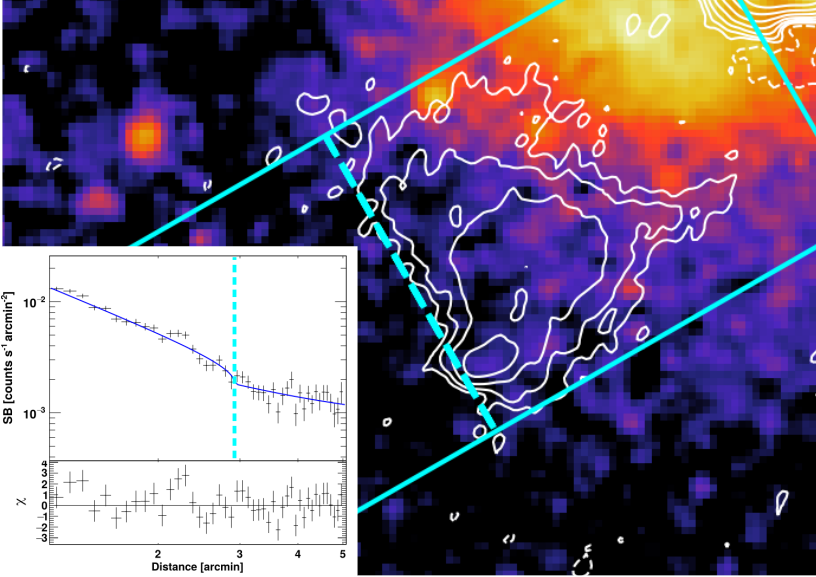
Finally, we searched for a possible X-ray discontinuity at the position of the peripheral diffuse radio emission. In particular, a shock could be responsible for the peculiar morphology and the observed spectral index trend of the source (Fig. 6). Moreover, a number of merger shocks have been found ahead of cold fronts (e.g. Vikhlinin et al., 2001; Markevitch et al., 2002; Russell et al., 2010, 2012; Emery et al., 2017), and it is also possible that the SE cold front detected in A781 follows a shock. In this respect, we extracted and fitted a surface brightness profile in a box across the radio edge in the E that shows a hint of spectral index flattening, as shown in Fig. 10. However, the current XMM-Newton data is not deep enough to characterise this potential feature as a consequence of the low count statistics of this region. We used the MultiNest Bayesian nested sampling algorithm (Feroz et al., 2009) interfaced in proffit to determine an upper limit of (90% confidence level) on the compression factor by fitting a broken power law and assuming that the discontinuity is locate at the edge of the radio emission. This implies that if a shock exists, it is weak (). Projection effects (if any) should play a small role as the detection of the two diametrically opposite cold fronts in the NW and SE directions suggests that the merger occurs approximately on the plane of the sky.
3.3 Constraints on the radio halo emission
The presence of diffuse radio emission at the centre of A781 was previously uncertain. Originally, A781 was classified as one of the few dynamically disturbed without evidence of a radio halo in the GMRT 610 MHz sample of Venturi et al. (2008). However, G11 claimed the presence of a radio halo using VLA observations and recorded a flux density mJy at 1.4 GHz. Nonetheless, this detection remained uncertain as V11 found only a low level of residuals in the cluster centre with the GMRT at 325 MHz (consistent with our reanalysis of the same data set performed with the spam pipeline), which would imply an unusual flat spectrum for a diffuse cluster source when combined with the claim of G11. The LOFAR has the sensitivity required to shed light on this point: our images have a brightness sensitivity times better than the GMRT at 325 MHz and the VLA at 1.4 GHz assuming a typical value of for the radio halo spectrum555This estimate is also conservative as it does not account for the fact that the uv-coverage at short baselines of LOFAR is much better than that of the GMRT and VLA.. With this spectral index and considering the flux density reported with the VLA by G11, the flux density expected at 143 MHz is mJy. This should be clearly observable in the LOFAR image. However, a radio halo is not visible and only a low level of residuals is measured in the central region of A781 at 143 MHz. The origin of these residuals is unclear. They may well be patches of emission due to unresolved sources in the cluster or possible contamination of spurious emission due to the central bright DRS ( Jy).
| () | (W Hz-1) | (mJy) | (kpc) | (kpc) |
| 5.0 | 437 | 168 |
To further quantify the limits of our non-detection, we used the technique of injecting mock radio haloes in the data set to infer an upper limit on the diffuse emission flux density (e.g. Brunetti et al., 2007; Venturi et al., 2008; Kale et al., 2013, 2015; Bonafede et al., 2017; Cuciti et al., 2018). Specifically, we applied this method to A781 following the procedure described in Bonafede et al. (2017). The mock haloes were injected in a region close to the cluster centre, avoiding bright radio sources and selecting a region with similar noise properties to that within the cluster region. The surface brightness of the mock radio haloes is assumed to follow an exponential law in the form , where is the central surface brightness and denotes the -folding radius (e.g. Orrù et al., 2007; Murgia et al., 2009). We first injected a halo with the properties reported in Tab. 4, i.e. consistent with that expected from the relation of Cassano et al. (2013) starting from the value of reported in the PSZ2 catalogue (Planck Collaboration XXVII, 2016). We verified that this mock radio halo was clearly detected by our LOFAR observation at 143 MHz (assuming a spectral index , the implied flux density is mJy). We then reduced the flux density of the injected haloes until we recovered a flux density that matches the level of residuals measured in the cluster centre. This occurred when mJy, and we consider this as the upper limit on the radio halo emission. This converts into a limit of W Hz-1 for the radio halo power at 143 MHz. Whilst the LOFAR brightness sensitivity is much better than that of the GMRT, this limit is similar to that derived by Venturi et al. (2008). Indeed, the residuals due to the contamination from the DRS constrain the depth of our measurement. The upper limit is a factor of 2 below the values expected by the relation. We note that the Planck estimate of for A781 could be slightly biased high because of the presence of the “Middle” cluster in the Planck beam (see Botteon et al., 2018b, for a similar case).
There is evidence that a fraction of merging clusters do not show radio haloes and this fraction is seen to increase at smaller cluster masses (Cuciti et al., 2015). According to current models, a fraction of these low-mass merging clusters should glow at low radio frequencies and host haloes with very steep spectra (e.g. Cassano et al., 2006; Brunetti et al., 2008) that are also typically less luminous in the plane than radio haloes with flatter spectrum (e.g. Cassano, 2010; Wilber et al., 2018). Unfortunately, the artefacts around the DRS prevent us from exploring the presence of a halo less luminous than a halo in line with the Cassano et al. (2013) relation.
We also searched our low-resolution LOFAR image for emission from the other clusters in the Abell 781 chain (Fig. 2). There are no clear detections towards any of the other clusters but this is to be expected given the low mass of these components (cf. Tab. 1 in Wittman et al., 2014). Owing to the expected non-detections we did not determine precise upper limits on the diffuse radio emission.
4 Discussion
4.1 Nature of peripheral radio emission

The most striking feature in the composite image of A781 (Fig. 3) is the peculiar peripheral radio source in the SE. Whilst its nature is still uncertain, two possible explanations for its origin can be proposed based on the results coming from the joint radio and X-ray analysis presented in this work.
The first possibility is that the source traces a radio relic, as already hypothesised by Venturi et al. (2008). This scenario agrees with the location of the emission in the cluster outskirts and the overall steepening of the spectral index towards the cluster centre (Fig. 6 and 7). Although the source has an edge that coincides with a region with flatter spectral index as observed in almost the totality of radio relics, the global morphology does not recall the typical arc-shaped structure observed for this class of sources (e.g. van Weeren et al., 2010). In particular, the presence of the high surface brightness spine and the bright knot of emission with flat spectral index are difficult to explain in the radio relic scenario even assuming strong projection effects (e.g. Slee et al., 2001; Hoeft et al., 2008).
Alternatively, the source could be associated with a radio galaxy just turned off (as suggested by the lack of a bright core in the FIRST). Whilst its morphology does not befit directly to any of the typical classes of radio galaxies (e.g. Miley, 1980), the structure observed in Fig. 4 vaguely resembles a head tail source. In this case, it is natural to associate the core emission with the bright knot in the SE that displays a flatter spectral index (Fig. 6). Thus, the high surface brightness spine would result from the relativistic plasma trailed behind the host galaxy during its motion towards the cluster outskirts. As a consequence of particle ageing, the spectral index gets steeper along the tail; however, in A781, the spectral index also shows a transversal trend (Fig. 7). We tentatively interpret this gradient as the signature of a shock passing through the radio galaxies from the W to the E direction compressing and potentially re-accelerating the radio plasma. The interaction between shocks and radio galaxies is very complicated and leads both to the compression of the plasma and the modification of the source morphology (e.g. Enßlin & Brüggen, 2002; Pfrommer & Jones, 2011; Jones et al., 2017). In this scenario, the presence of a clear spectral gradient would suggest that the shock has gone through the tail. An external shock can only propagate as a shock inside the tail if the sound speed inside the relativistic plasma is lower than the shock speed in the external medium. This could be explained by entrainment of thermal plasma in the non-thermal plasma and a small volume filling fraction of the non-thermal plasma. Tailored numerical simulations on the source in A781 will test this scenario.
| RF method | KD-tree method | |
|---|---|---|
| DR10 | ||
| DR14 |
Both interpretations described above assume that a shock is involved in the formation of the peripheral source. Nonetheless, the present XMM-Newton observations allowed us to determine only an upper limit on the density jump across the E region of the source, which would imply a low Mach number shock. We currently prefer the second scenario as it can be more easily reconciled with the source morphology and spectral index properties. Furthermore, two possible optical counterparts are visible in the SDSS image within the radio knot. Both the sources are detected by the Spitzer satellite, possibly indicating infrared emission from AGNs. However, only the galaxy indicated with the red arrow666SDSS J092031.54+302733.1 in the inset panel in Fig. 6 is in the SDSS catalogue. Various estimates777See Csabai et al. (2007) and Carliles et al. (2010) for details on the photometric redshift estimation methods. of the photometric redshift for this object are reported in Tab. 5. The galaxy is consistent with being a cluster member within for Ahn et al. (2014) and within for Abolfathi et al. (2018). We mention that the apparent discrepancy between the redshifts reported in the two SDSS Data Releases might be due to changes in the machine learning technique (e.g. in the training sample) between the two releases. Spectroscopic follow-up observations are required to precisely determine the galaxy redshift and nuclear activity.
In conclusion, we point out that the radio relic and radio galaxy–shock interaction scenarios do not necessarily exclude each other. The shock with inferred from the X-ray analysis, if present, would challenge DSA owing to inefficient particle acceleration at weak cluster shocks (e.g. Kang et al., 2012; Pinzke et al., 2013). The re-acceleration of a pre-existing population of relativistic electrons injected by nearby radio galaxies is usually invoked to alleviate the high acceleration efficiency required for many relics (e.g. Botteon et al., 2016a; Eckert et al., 2016b; van Weeren et al., 2016a; Hoang et al., 2018). To date, the clearest example of an AGN–relic connection is provided by Abell 3411-3412 (van Weeren et al., 2017), in which a shock was suggested to be responsible for the AGN distorted radio tail and spectral index flattening at the edge of the relic. The peripheral emission in A781 could resemble this case, provided that future observations will confirm the optical counterpart and shock front.
4.2 Triple merger in A781
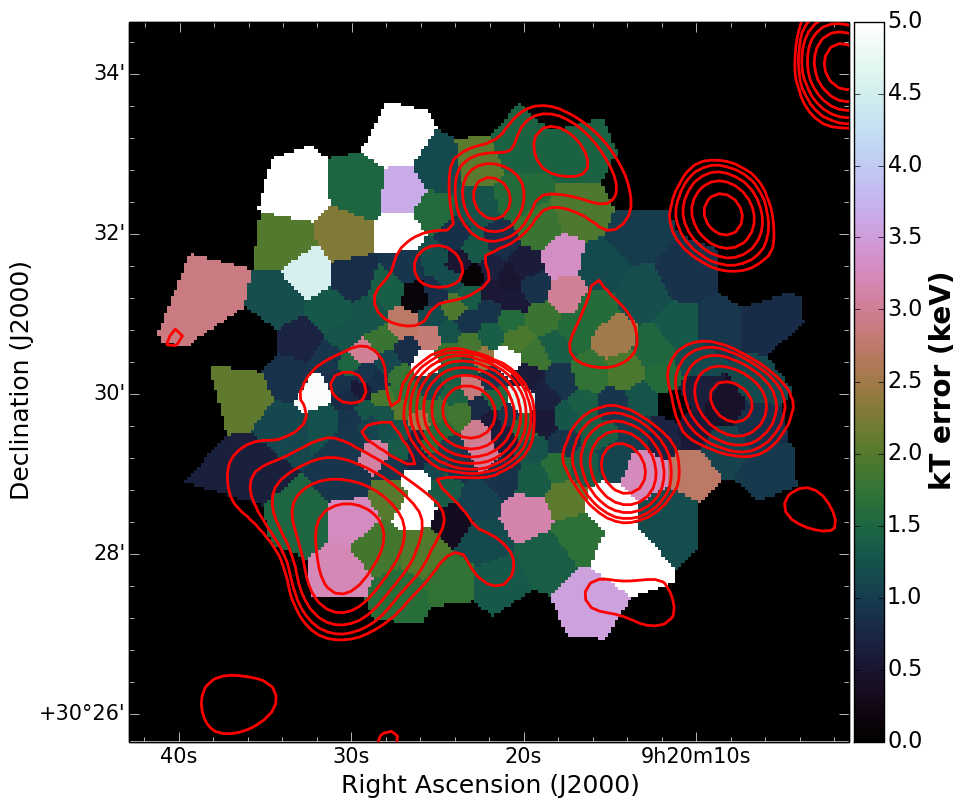
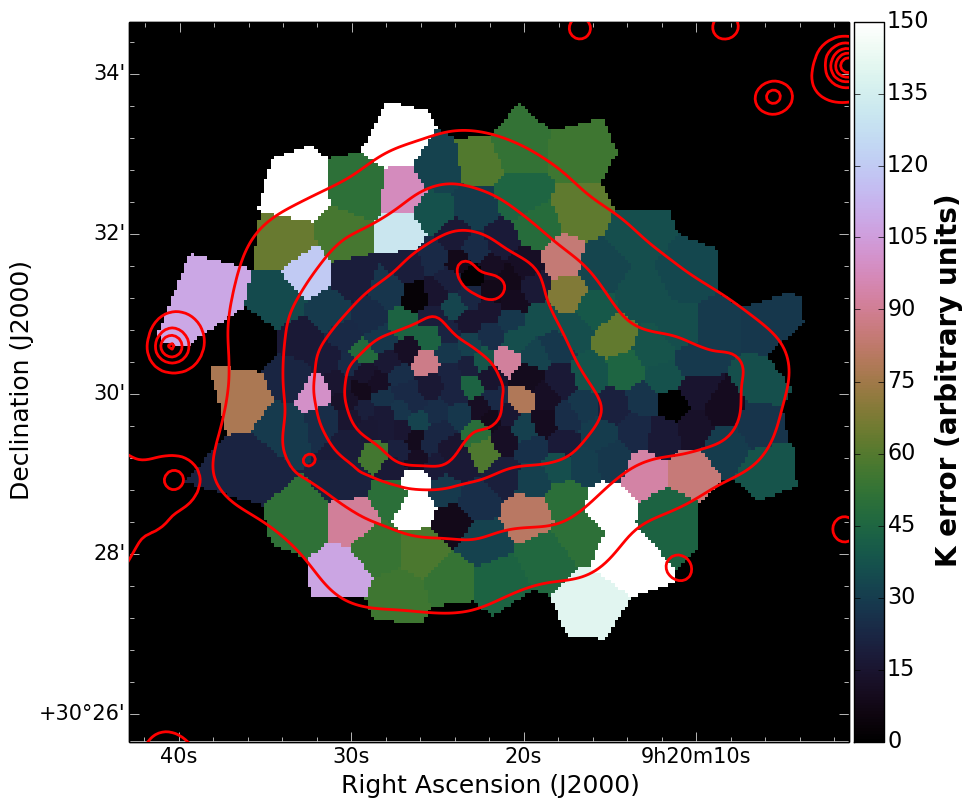
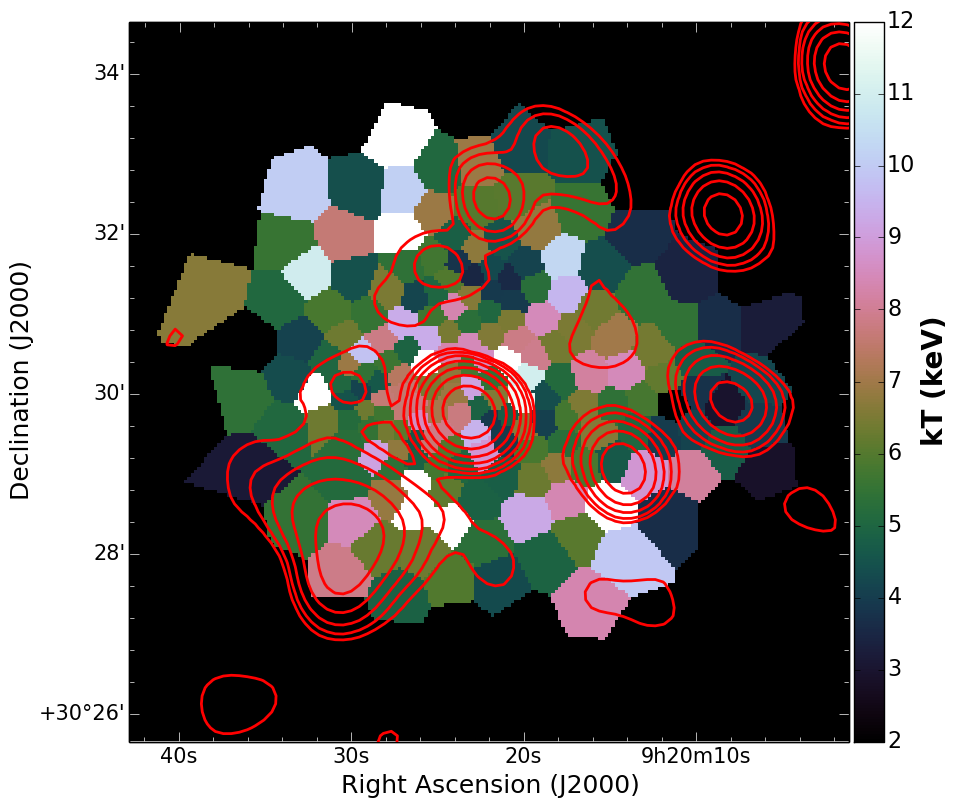
The detection of discontinuities in the thermal ICM requires that the collision is occurring almost exactly in the plane of the sky, as projection effects could hide the sharp surface brightness and temperature jumps. Therefore, the shock and cold fronts observed in A781 can be used to outline the approximate geometry of the merger. We complemented this information with the temperature and entropy maps shown in Fig. 11 (the error maps are reported in Appendix A), which are useful diagnostic tools to search for substructures in the ICM. Maps were produced by fitting a thermal model to the count rates measured in five energy bands from XMM-Newton EPIC Voronoi tessellated images (Cappellari & Copin, 2003) and requiring a threshold of 400 counts per bin in the keV band (for more details, see Jauzac et al., 2016). Reported quantities are projected along the line of sight.

From the analysis of the XMM-Newton observations, we suggest that A781 is undergoing a triple merger, as sketched in Fig. 12. Merger cold fronts usually trace the direction of motion of a cluster core (e.g. Markevitch et al., 2002); hence, the two diametrically opposite cold fronts detected in A781 suggest a collision axis along the NW-SE direction. The presence of two substructures (clump A and clump B) is supported by the low values of entropy and the X-ray contours in Fig. 11 (right panel). The two X-ray clumps seem detached (e.g. Fig. 3); clump B likely traces a smaller substructure moving apart from the dominant clump A. The spatial coincidence between the peripheral radio emission high surface brightness spine and bins with keV in Fig. 11 (left panel) could indicate a region heated by the passage of the shock invoked in the previous section to explain the properties of the source observed in the radio band. In addition, the presence of a third sub-cluster (clump C) is highlighted by the X-ray clump of emission to the W and, again, by the low entropy gas in this region (Fig. 11, right panel). This sub-cluster is clearly disturbed as it does not show evidence of an X-ray peak (Fig. 8). In this respect, we suggest that it is moving towards the W direction and it has already crossed the ICM of clump A+B, rather than infalling into the system. The detection of the shock in the W supports this scenario. This provides an additional merger axis in the E-W direction. Overall, the irregular distribution of temperature with the existence of blobs of hot gas (Fig. 11, left panel) is in agreement with a complex merger dynamics as that described above.
The tentative dynamics of the merger outlined above is based on the features observed in X-ray wavelengths. Recently, Golovich et al. (2018) have presented an optical analysis of A781 that supports the triple merger scenario. As pointed out by these authors, it is worth noting that on larger scales the merger could be even more complex because of the existence of the “Middle” cluster, located at a similar redshift of A781 (Fig. 1).
5 Conclusions
We presented a joint radio/X-ray analysis of the cluster chain Abell 781 using new LOFAR data and reanalysing archival GMRT and XMM-Newton observations. We focussed on the main merging component of the complex, for which the presence of non-thermal emission in the ICM was already investigated in the literature. Our results can be summarised as follows.
Firstly, the nature of the peripheral radio emission in the SE of A781 remains uncertain. We suggested that this source results from the interaction between a weak shock and a radio galaxy. This scenario could explain its unusual morphology and spectral index steepening towards the cluster centre. Future optical follow-up and numerical simulations are required to clarify the origin of the source.
Secondly, we proposed a tentative interpretation of the dynamics of the merger occurring in A781 where three substructures are involved. We detected two cold fronts and a shock front; these were used to delineate the motion of the three mass clumps. The two diametrically opposite cold fronts indicate a merger axis in the SE-NW direction, while the presence of a third substructure moving towards the W and preceding a shock suggests another merger axis in the E-W direction. Three entropy clumps are also observed in the entropy map of A781.
Lastly, our results from the new LOFAR data and the reanalysis of the archival GMRT observations do not indicate evidence of the radio halo in A781 (in agreement with Venturi et al., 2008, 2011) and in the other clusters of the chain. We placed an upper limit on the diffuse radio emission a factor of 2 below the relation of Cassano et al. (2013). This limit is not extremely deep due to the presence of artefacts around the bright radio galaxy at the centre of A781.
Acknowledgements.
We thank G. Bernardi, V. Cuciti, and K. Duncan for useful discussions. ABon acknowledges support from the ERC-Stg 714245 DRANOEL. RJvW acknowledges support from the VIDI research programme with project number 639.042.729, which is financed by the Netherlands Organisation for Scientific Research (NWO). FdG is supported by the VENI research programme with project number 639.041.542, which is financed by the Netherlands Organisation for Scientific Research (NWO). The LOFAR group in Leiden is supported by the ERC Advanced Investigator programme New-Clusters 321271. AD and CD acknowledge support by the BMBF Verbundforschung under the grant 05A17STA. This paper is based (in part) on data obtained with the International LOFAR Telescope (ILT) under project code LC6_015. LOFAR (van Haarlem et al., 2013) is the LOw Frequency ARray designed and constructed by ASTRON. It has observing, data processing, and data storage facilities in several countries, which are owned by various parties (each with their own funding sources), and are collectively operated by the ILT foundation under a joint scientific policy. The ILT resources have benefitted from the following recent major funding sources: CNRS-INSU, Observatoire de Paris and Université d’Orléans, France; BMBF, MIWF-NRW, MPG, Germany; Science Foundation Ireland (SFI), Department of Business, Enterprise and Innovation (DBEI), Ireland; NWO, The Netherlands; The Science and Technology Facilities Council, UK; Ministry of Science and Higher Education, Poland. Part of this work was carried out on the Dutch national e-infrastructure with the support of the SURF Cooperative through grant e-infra 160022 & 160152. The LOFAR software and dedicated reduction packages on https://github.com/apmechev/GRID\_LRT were deployed on the e-infrastructure by the LOFAR e-infragroup, consisting of J. B. R. Oonk (ASTRON & Leiden Observatory), A. P. Mechev (Leiden Observatory), and T. Shimwell (ASTRON) with support from N. Danezi (SURFsara) and C. Schrijvers (SURFsara). We thank the staff of the GMRT who made these observations possible. The GMRT is run by the National Centre for Radio Astrophysics of the Tata Institute of Fundamental Research. This work is also based on observations obtained with XMM-Newton, an ESA science mission with instruments and contributions directly funded by ESA Member States and NASA. This research made use of APLpy, an open-source plotting package for Python hosted at http://aplpy.github.com.References
- Abate et al. (2009) Abate, A., Wittman, D., Margoniner, V., et al. 2009, ApJ, 702, 603
- Abolfathi et al. (2018) Abolfathi, B., Aguado, D., Aguilar, G., et al. 2018, ApJS, 235, 42
- Ahn et al. (2014) Ahn, C., Alexandroff, R., Allende Prieto, C., et al. 2014, ApJS, 211, 17
- Akamatsu et al. (2017) Akamatsu, H., Mizuno, M., Ota, N., et al. 2017, A&A, 600, A100
- Arnaud (1996) Arnaud, K. 1996, in Astronomical Society of the Pacific Conference Series, Vol. 101, Astronomical Data Analysis Software and Systems V, ed. G. Jacoby & J. Barnes, 17
- Becker et al. (1995) Becker, R., White, R., & Helfand, D. 1995, ApJ, 450, 559
- Bonafede et al. (2017) Bonafede, A., Cassano, R., Brüggen, M., et al. 2017, MNRAS, 470, 3465
- Bonafede et al. (2014) Bonafede, A., Intema, H., Brüggen, M., et al. 2014, ApJ, 785, 1
- Botteon et al. (2018a) Botteon, A., Gastaldello, F., & Brunetti, G. 2018a, MNRAS, 476, 5591
- Botteon et al. (2016a) Botteon, A., Gastaldello, F., Brunetti, G., & Dallacasa, D. 2016a, MNRAS, 460, L84
- Botteon et al. (2016b) Botteon, A., Gastaldello, F., Brunetti, G., & Kale, R. 2016b, MNRAS, 463, 1534
- Botteon et al. (2018b) Botteon, A., Shimwell, T., Bonafede, A., et al. 2018b, MNRAS, 478, 885
- Briggs (1995) Briggs, D. 1995, in Bulletin of the American Astronomical Society, Vol. 27, American Astronomical Society Meeting Abstracts, 1444
- Brunetti (2016) Brunetti, G. 2016, Plasma Phys. Control. Fusion, 58, 14011
- Brunetti et al. (2008) Brunetti, G., Giacintucci, S., Cassano, R., et al. 2008, Nature, 455, 944
- Brunetti & Jones (2014) Brunetti, G. & Jones, T. 2014, IJMPD, 23, 30007
- Brunetti & Lazarian (2011) Brunetti, G. & Lazarian, A. 2011, MNRAS, 412, 817
- Brunetti et al. (2001) Brunetti, G., Setti, G., Feretti, L., & Giovannini, G. 2001, MNRAS, 320, 365
- Brunetti et al. (2007) Brunetti, G., Venturi, T., Dallacasa, D., et al. 2007, ApJ, 670, L5
- Buote (2001) Buote, D. 2001, ApJ, 553, L15
- Cappellari & Copin (2003) Cappellari, M. & Copin, Y. 2003, MNRAS, 342, 345
- Caprioli & Zhang (2018) Caprioli, D. & Zhang, H. 2018, J. Plasma Phys., 84, 715840301
- Carliles et al. (2010) Carliles, S., Budavári, T., Heinis, S., Priebe, C., & Szalay, A. 2010, ApJ, 712, 511
- Cash (1979) Cash, W. 1979, ApJ, 228, 939
- Cassano (2010) Cassano, R. 2010, A&A, 517, A10
- Cassano et al. (2010a) Cassano, R., Brunetti, G., Röttgering, H., & Brüggen, M. 2010a, A&A, 509, A68
- Cassano et al. (2006) Cassano, R., Brunetti, G., & Setti, G. 2006, MNRAS, 369, 1577
- Cassano et al. (2013) Cassano, R., Ettori, S., Brunetti, G., et al. 2013, ApJ, 777, 141
- Cassano et al. (2010b) Cassano, R., Ettori, S., Giacintucci, S., et al. 2010b, ApJ, 721, L82
- Chandra et al. (2004) Chandra, P., Ray, A., & Bhatnagar, S. 2004, ApJ, 612, 974
- Condon et al. (1998) Condon, J., Cotton, W., Greisen, E., et al. 1998, AJ, 115, 1693
- Cook & Dell’Antonio (2012) Cook, R. & Dell’Antonio, I. 2012, ApJ, 750, 153
- Csabai et al. (2007) Csabai, I., Dobos, L., Trencséni, M., et al. 2007, Astron. Nachrichten, 328, 852
- Cuciti et al. (2018) Cuciti, V., Brunetti, G., van Weeren, R., et al. 2018, A&A, 609, A61
- Cuciti et al. (2015) Cuciti, V., Cassano, R., Brunetti, G., et al. 2015, A&A, 580, A97
- de Gasperin et al. (2018) de Gasperin, F., Dijkema, T., Drabent, A., et al. 2018, A&A, this issue
- de Gasperin et al. (2015) de Gasperin, F., Intema, H., van Weeren, R., et al. 2015, MNRAS, 453, 3483
- De Luca & Molendi (2004) De Luca, A. & Molendi, S. 2004, A&A, 419, 837
- Dewdney et al. (2009) Dewdney, P., Hall, P., Schilizzi, R., & Lazio, T. 2009, IEEE Proceedings, 97, 1482
- Dolag et al. (2008) Dolag, K., Bykov, A., & Diaferio, A. 2008, Space Sci. Rev., 134, 311
- Eckert et al. (2016a) Eckert, D., Ettori, S., Coupon, J., et al. 2016a, A&A, 592, A12
- Eckert et al. (2017) Eckert, D., Ettori, S., Pointecouteau, E., et al. 2017, Astron. Nachrichten, 338, 293
- Eckert et al. (2016b) Eckert, D., Jauzac, M., Vazza, F., et al. 2016b, MNRAS, 461, 1302
- Eckert et al. (2011) Eckert, D., Molendi, S., & Paltani, S. 2011, A&A, 526, A79
- Emery et al. (2017) Emery, D., Bogdán, Á., Kraft, R., et al. 2017, ApJ, 834, 159
- Enßlin et al. (1998) Enßlin, T., Biermann, P., Klein, U., et al. 1998, A&A, 332, 395
- Enßlin & Brüggen (2002) Enßlin, T. & Brüggen, M. 2002, MNRAS, 331, 1011
- Feretti et al. (2012) Feretti, L., Giovannini, G., Govoni, F., & Murgia, M. 2012, A&A Rev., 20, 54
- Feroz et al. (2009) Feroz, F., Hobson, M., & Bridges, M. 2009, MNRAS, 398, 1601
- Geller et al. (2010) Geller, M., Kurtz, M., Dell’Antonio, I., Ramella, M., & Fabricant, D. 2010, ApJ, 709, 832
- Ghirardini et al. (2018) Ghirardini, V., Eckert, D., Ettori, S., et al. 2018, ArXiv e-prints [arXiv:1805.00042]
- Giacintucci et al. (2008) Giacintucci, S., Venturi, T., Macario, G., et al. 2008, A&A, 486, 347
- Golovich et al. (2018) Golovich, N., Dawson, W., Wittman, D., et al. 2018, ArXiv e-prints [arXiv:1806.10619]
- Govoni et al. (2011) Govoni, F., Murgia, M., Giovannini, G., Vacca, V., & Bonafede, A. 2011, A&A, 529, A69
- Hardcastle et al. (2016) Hardcastle, M., Gürkan, G., van Weeren, R., et al. 2016, MNRAS, 462, 1910
- Hoang et al. (2018) Hoang, D., Shimwell, T., van Weeren, R., et al. 2018, MNRAS, 478, 2218
- Hoeft et al. (2008) Hoeft, M., Brüggen, M., Yepes, G., Gottlöber, S., & Schwope, A. 2008, MNRAS, 391, 1511
- Intema et al. (2017) Intema, H., Jagannathan, P., Mooley, K., & Frail, D. 2017, A&A, 598, A78
- Intema et al. (2009) Intema, H., van der Tol, S., Cotton, W., et al. 2009, A&A, 501, 1185
- Jauzac et al. (2016) Jauzac, M., Eckert, D., Schwinn, J., et al. 2016, MNRAS, 463, 3876
- Jones et al. (2017) Jones, T., Nolting, C., O’Neill, B., & Mendygral, P. 2017, Phys. Plasmas, 24, 41402
- Kalberla et al. (2005) Kalberla, P., Burton, W., Hartmann, D., et al. 2005, A&A, 440, 775
- Kale et al. (2015) Kale, R., Venturi, T., Giacintucci, S., et al. 2015, A&A, 579, A92
- Kale et al. (2013) Kale, R., Venturi, T., Giacintucci, S., et al. 2013, A&A, 557, A99
- Kang & Ryu (2011) Kang, H. & Ryu, D. 2011, ApJ, 734, 18
- Kang & Ryu (2016) Kang, H. & Ryu, D. 2016, ApJ, 823, 13
- Kang et al. (2012) Kang, H., Ryu, D., & Jones, T. 2012, ApJ, 756, 97
- Landau & Lifshitz (1959) Landau, L. & Lifshitz, E. 1959, Fluid mechanics
- Leccardi & Molendi (2008) Leccardi, A. & Molendi, S. 2008, A&A, 486, 359
- Markevitch et al. (2002) Markevitch, M., Gonzalez, A., David, L., et al. 2002, ApJ, 567, L27
- Markevitch & Vikhlinin (2007) Markevitch, M. & Vikhlinin, A. 2007, Phys. Rep., 443, 1
- McCammon et al. (2002) McCammon, D., Almy, R., Apodaca, E., et al. 2002, ApJ, 576, 188
- Miley (1980) Miley, G. 1980, ARA&A, 18, 165
- Miniati (2015) Miniati, F. 2015, ApJ, 800, 60
- Mohan & Rafferty (2015) Mohan, N. & Rafferty, D. 2015, PyBDSF: Python Blob Detection and Source Finder, Astrophysics Source Code Library
- Murgia et al. (2009) Murgia, M., Govoni, F., Markevitch, M., et al. 2009, A&A, 499, 679
- Nuza et al. (2012) Nuza, S., Hoeft, M., van Weeren, R., Gottlöber, S., & Yepes, G. 2012, MNRAS, 420, 2006
- Offringa et al. (2014) Offringa, A., McKinley, B., Hurley-Walker, N., et al. 2014, MNRAS, 444, 606
- Offringa & Smirnov (2017) Offringa, A. & Smirnov, O. 2017, MNRAS, 471, 301
- Orrù et al. (2007) Orrù, E., Murgia, M., Feretti, L., et al. 2007, A&A, 467, 943
- Owers et al. (2009) Owers, M., Nulsen, P., Couch, W., & Markevitch, M. 2009, ApJ, 704, 1349
- Petrosian (2001) Petrosian, V. 2001, ApJ, 557, 560
- Pfrommer & Jones (2011) Pfrommer, C. & Jones, T. 2011, ApJ, 730, 22
- Pinzke et al. (2013) Pinzke, A., Oh, S., & Pfrommer, C. 2013, MNRAS, 435, 1061
- Planck Collaboration XXVII (2016) Planck Collaboration XXVII. 2016, A&A, 594, A27
- Rengelink et al. (1997) Rengelink, R., Tang, Y., de Bruyn, A., et al. 1997, A&AS, 124
- Roettiger et al. (1999) Roettiger, K., Burns, J., & Stone, J. 1999, ApJ, 518, 603
- Röttgering et al. (2011) Röttgering, H., Afonso, J., Barthel, P., et al. 2011, J. Astrophys. Astron., 32, 557
- Röttgering et al. (2006) Röttgering, H., Braun, R., Barthel, P., et al. 2006, ArXiv e-prints [arXiv:astro-ph/0610596]
- Russell et al. (2012) Russell, H., McNamara, B., Sanders, J., et al. 2012, MNRAS, 423, 236
- Russell et al. (2010) Russell, H., Sanders, J., Fabian, A., et al. 2010, MNRAS, 406, 1721
- Scaife & Heald (2012) Scaife, A. & Heald, G. 2012, MNRAS, 423, L30
- Sehgal et al. (2008) Sehgal, N., Hughes, J., Wittman, D., et al. 2008, ApJ, 673, 163
- Shimwell et al. (2015) Shimwell, T., Markevitch, M., Brown, S., et al. 2015, MNRAS, 449, 1486
- Shimwell et al. (2017) Shimwell, T., Röttgering, H., Best, P., et al. 2017, A&A, 598, A104
- Shimwell et al. (2018) Shimwell, T., Tasse, C., Hardcastle, M., et al. 2018, A&A, this issue
- Sirothia (2009) Sirothia, S. 2009, MNRAS, 398, 853
- Slee et al. (2001) Slee, O., Roy, A., Murgia, M., Andernach, H., & Ehle, M. 2001, AJ, 122, 1172
- Tingay et al. (2013) Tingay, S., Goeke, R., Bowman, J., et al. 2013, PASA, 30, e007
- van Haarlem et al. (2013) van Haarlem, M., Wise, M., Gunst, A., et al. 2013, A&A, 556, A2
- van Weeren et al. (2017) van Weeren, R., Andrade-Santos, F., Dawson, W., et al. 2017, Nature Astron., 1, 5
- van Weeren et al. (2016a) van Weeren, R., Brunetti, G., Brüggen, M., et al. 2016a, ApJ, 818, 204
- van Weeren et al. (2010) van Weeren, R., Röttgering, H., Brüggen, M., & Hoeft, M. 2010, Science, 330, 347
- van Weeren et al. (2016b) van Weeren, R., Williams, W., Hardcastle, M., et al. 2016b, ApJS, 223, 2
- Venturi et al. (2011) Venturi, T., Giacintucci, S., Dallacasa, D., et al. 2011, MNRAS, 414, L65
- Venturi et al. (2008) Venturi, T., Giacintucci, S., Dallacasa, D., et al. 2008, A&A, 484, 327
- Venturi et al. (2013) Venturi, T., Giacintucci, S., Dallacasa, D., et al. 2013, A&A, 551, A24
- Vikhlinin et al. (2001) Vikhlinin, A., Markevitch, M., & Murray, S. 2001, ApJ, 551, 160
- Wilber et al. (2018) Wilber, A., Brüggen, M., Bonafede, A., et al. 2018, MNRAS, 473, 3536
- Williams et al. (2016) Williams, W., van Weeren, R., Röttgering, H., et al. 2016, MNRAS, 460, 2385
- Wittman et al. (2014) Wittman, D., Dawson, W., & Benson, B. 2014, MNRAS, 437, 3578
- Wittman et al. (2006) Wittman, D., Dell’Antonio, I., Hughes, J., et al. 2006, ApJ, 643, 128
- York et al. (2000) York, D., Adelman, J., Anderson Jr., J., et al. 2000, AJ, 120, 1579
Appendix A Error maps
