1D Kinematics from stars and ionized gas at from the LEGA-C spectroscopic survey of massive galaxies
Abstract
We present a comparison of the observed, spatially integrated stellar and ionized gas velocity dispersions of massive () galaxies in the Large Early Galaxy Astrophysics Census (LEGA-C) survey at . The high afforded by 20 hour VLT/VIMOS spectra allows for joint modeling of the stellar continuum and emission lines in all galaxies, spanning the full range of galaxy colors and morphologies. These observed integrated velocity dispersions (denoted as and ) are related to the intrinsic velocity dispersions of ionized gas or stars, but also include rotational motions through beam smearing and spectral extraction. We find good average agreement between observed velocity dispersions, with . This result does not depend strongly on stellar population, structural properties, or alignment with respect to the slit. However, in all regimes we find significant scatter between and , with an overall scatter of 0.13 dex of which 0.05 dex is due to observational uncertainties. For an individual galaxy, the scatter between and translates to an additional uncertainty of on dynamical mass derived from , on top of measurement errors and uncertainties from Virial constant or size estimates. We measure the stellar mass Faber-Jackson relation and demonstrate that emission line widths can be used to measure scaling relations. However, these relations will exhibit increased scatter and slopes that are artificially steepened by selecting on subsets of galaxies with progressively brighter emission lines.
1 Introduction
One of the most fundamental properties of a galaxy is the depth of its gravitational well, which can be measured from integrated or spatially-resolved data based on the kinematics derived from either gas or stars. The line-of-sight “velocity dispersion,” or the second moment of the velocity distribution function, is the simplest measure of a galaxy’s potential well that can be measured from a 1D spectrum. Observationally, one measures an intrinsic velocity dispersion () that is convolved with rotational motions by the point spread function and 1D spectral extraction in addition to projection effects along the line-of-sight. Therefore throughout this paper we refer to this measured velocity width as or observed integrated velocity dispersion to distinguish from the intrinsic velocity dispersion ().
For massive galaxies, the central potential well is dominated by stars, therefore the intrinsic stellar velocity dispersion () - either with or without projection effects - will be more representative than the ionized gas velocity dispersion (), which does not trace collisionless orbits and is unlikely to trace the same structures as the stellar component. The stellar velocity dispersions of galaxies, especially for the early-type subset, have been demonstrated to be tightly connected to their luminosities, stellar masses, and sizes (e.g. Faber & Jackson, 1976; Djorgovski & Davis, 1987; Dressler et al., 1987) as well as the supermassive black holes at their centers (e.g. Magorrian et al., 1998). The number of galaxies as sorted by – the velocity dispersion function – and its evolution have been studied from a galaxy evolution perspective (e.g. Sheth et al., 2003; Bezanson et al., 2011, 2012), but is also important for understanding weak and strong lensing studies (e.g. Chae, 2010; Mason et al., 2015).
Measuring requires high S/N in the continuum, in contrast with measuring from brighter emission lines. This renders measurements of this key parameter increasingly difficult as spectroscopic studies of galaxies push into the high redshift Universe. It would be beneficial to use the less expensive as a proxy for - and ultimately - when emission lines are detected. Ho (2009) found that in the centers of local galaxies, the gas and stellar velocity dispersions were strongly correlated, but found trends with other galaxy properties in addition to a net offset . Conversely Chen et al. (2008) found very good average agreement between and as measured from the spatially-integrated spectra of emission line galaxies in the Sloan Digital Sky Survey (SDSS).
Of additional concern is the fact that at low redshift, ionized gas emission is not ubiquitous and is uncommon in the most massive galaxies (e.g., Pandya et al., 2017). However, at higher redshifts the population of massive galaxies includes a higher fraction of star-forming galaxies (e.g. Muzzin et al., 2013b; Tomczak et al., 2014) and a greater diversity of spectroscopic properties (e.g. van Dokkum et al., 2011). It follows that could be measured for an increasingly representative sample of galaxies at high-redshift, precisely where is the most valuable proxy.
In this Letter we test the relationship between stellar and gas 1D kinematics for the first statistical and representative sample of galaxies at significant lookback time. The sample of galaxies selected from the Large Early Galaxy Astrophysics Census (LEGA-C) provide the necessary deep continuum spectroscopy to measure and sufficient demographic range to probe trends between ionized gas and stellar kinematics at . We describe the dataset in §2, explore the relationship between and in §3, and discuss the implications of our findings in §4. Throughout we assume concordance cosmology , and .
2 Data
2.1 The Large Early Galaxy Astrophysics Census
This paper is primarily based on data release 2 (DR2) of the LEGA-C survey, an ESO Large Spectroscopic Program including ultradeep spectroscopy of massive galaxies in the COSMOS field using VIMOS on the VLT. For a more detailed description of the survey, data reduction, and quality we refer to van der Wel et al. (2016); Straatman et al. (2018); we briefly summarize here. This paper is based on primary targets selected using a redshift-dependent magnitude limit, , which yields a mass-complete sample above . Observations were taken using the HRred grating, which produces spectra over , with a dispersion of . The 1D spectra are extracted from the 2D spectra with a Moffat kernel in the spatial direction that varies from galaxy to galaxy but typically has a FWHM of 1” (see Straatman et al. 2018 for details). We do not expect this to significantly impact the measured velocity dispersions as observed velocity dispersion profiles are very flat within this window, largely due to beam smearing (Bezanson et al., 2018). We note that this aperture is comparable to the galaxy sizes, unlike similar measurements for local galaxies. Each mask includes roughly 100 primary targets and is observed for 20 hours, reaching a typical continuum in the observed frame 1D extracted spectra.
2.2 Ancillary Data
The LEGA-C sample is selected from the v4.1 Muzzin et al. (2013a) Ks-selected catalogs in the UltraVista/COSMOS field, which provides a wealth of ancillary data, including PSF-matched photometry in 30 bands from 0.15-24 from a number of facilities including GALEX (Martin et al., 2005), CFHT/Subaru (Capak et al., 2007), UltraVISTA (McCracken et al., 2012), and S-COSMOS (Sanders et al., 2007). Stellar masses are measured as in the Muzzin et al. (2013a) data release, but with fixed spectroscopic redshift, using the Fitting and Assessment of Synthetic Templates (FAST) code (Kriek et al., 2009), assuming Bruzual & Charlot (2003) templates, a Chabrier (2003) initial mass function, exponentially declining star formation histories, and a Calzetti et al. (2000) dust law. “UV+IR” Star formation rates (SFR) are measured from the UV fluxes plus reradiated dust emission measured from the MIPS 24 flux following Whitaker et al. (2012).
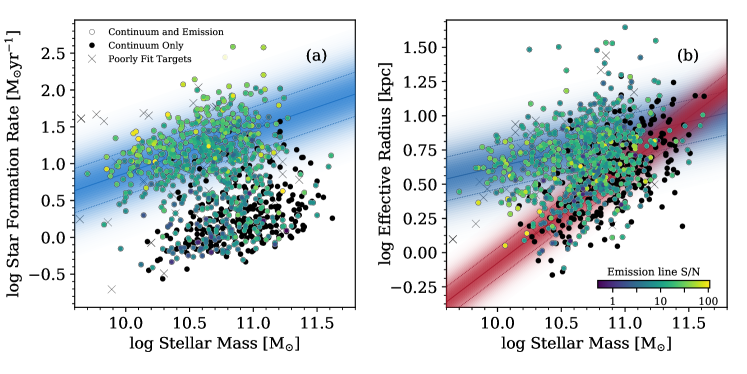
Fig. 1a shows the SFR versus stellar mass for galaxies in the primary LEGA-C DR2 sample (, see Straatman et al. (2018) for details) with the Whitaker et al. (2012) relation (blue line and band). Colored and black symbols indicate galaxies with and without emission lines in their LEGA-C spectra, with color corresponding to the S/N of the brightest observed emission line. Black crosses identify 176 galaxies for which spectral modeling failed (either flagged visually, for example in the case of obvious broad line AGN, or with uncertainties in ). We note that galaxies with emission lines are not confined to the locus of star-forming galaxies (e.g., as identified photometrically); the LEGA-C spectra uncover a significant population of quiescent galaxies with emission lines (see also Straatman et al., 2018).
Morphologies are measured from the COSMOS HST/ACS F814W v.2.0 mosaic (Koekemoer et al., 2007; Massey et al., 2010). Each galaxy is modeled by a single Sérsic profile following van der Wel et al. (2012), which produces best-fit effective radii, Sérsic indices, axis ratios, and position angles. Fig. 1b shows effective radius (semi-major, rest-frame 5000Å) versus stellar mass for the sample. van der Wel et al. (2014) relations and scatter for star-forming and quiescent galaxies at are indicated by blue and red bands.
Catalogs of X-ray detections in the COSMOS field exist based on data collected by the XMM and Chandra telescopes. The XMM-COSMOS survey provides the XMM Point-like Source Catalog (Cappelluti et al., 2009) in three bands (0.5-2.0 keV, 2.0-4.5 keV, and 4.5-10.0 keV to , , and depths) and the Chandra COSMOS Legacy 4.6 Ms survey also includes three bands of X-ray fluxes (0.5-2.0 keV, 2.0-5.0 keV, and 5.0-10.0 keV to , , and depths) (Civano et al., 2016; Marchesi et al., 2016). We match the LEGA-C catalog to 96 XMM-COSMOS and C-COSMOS sources within a 1” radius.
2.3 Stellar and Ionized Gas 1D Kinematics
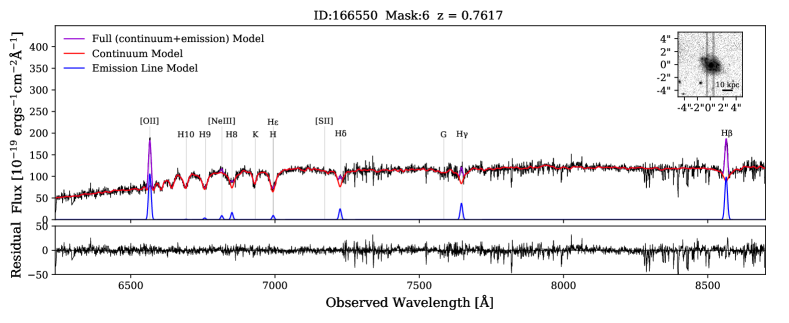
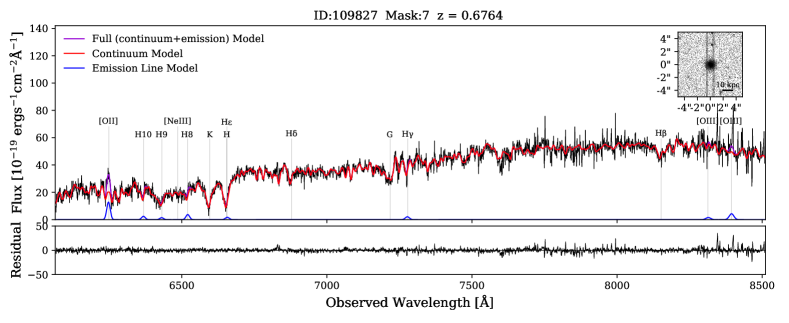
The observed gas and stellar velocity dispersions ( and ) are measured for every galaxy as the gaussian line width (for emission lines) and broadening (for the stellar continuum) in the optimally extracted 1D spectra using Penalized Pixel-Fitting (pPXF) (Cappellari & Emsellem, 2004; Cappellari, 2017). The software models each galaxy spectrum as a combination of one or more stellar population templates and emission lines (at instrumental resolution) convolved with a single gaussian broadening as well as multiplicative and additive polynomials to account for uncertainties in the overall spectral shape. We adopt a third order multiplicative polynomial and an additive polynomial with one degree of freedom per 100 , however we verify that due to the extremely high S/N nature of these spectra the fits are largely insensitive to polynomial choice with nd order multiplicative polynomial. The continuum is modeled with high resolution (R=10,000) theoretical single stellar population templates. These templates were produced with the FSPS package (Conroy et al., 2009), using an unpublished grid of theoretical spectra computing using the ATLAS12/SYNTHE routines (Kurucz, 2011); see Conroy & van Dokkum (2012) for details. We verify that these agree with fits using Vazdekis (1999) lower-resolution empirical templates for 100 with a scatter of 7%. The observed stellar velocity dispersions are fixed to the same value for all stellar templates and the fit is luminosity-weighted. Although some of the stronger features (Balmer lines) will be dominated by younger stars, this wavelength range also contains a wealth of weaker metal lines (see Figure 2) that are sensitive to older stellar populations.
Examples of LEGA-C spectra with best-fitting models are shown in Fig. 2. Gas velocity dispersions are measured from a combination of emission lines ([NeV], [NeVI], H10, H9, H8, H, H, H, H, [OII] doublet, [NeIII], and [OIII], depending on the wavelength coverage). The individual line normalization is free, but the is the same for all lines. Emission and absorption templates are fit simultaneously, starting at the instrumental resolution and broadening and normalizing to fit the spectra. A fit is accepted if the emission lines contribute at least 25% of the flux in one part of the spectrum. If this is not the case, or if the redshifts of the stellar and gas templates differ by too much () we refit with stellar templates alone. We visually inspect all fits to verify that this process correctly identifies emission lines. Almost all galaxies have integrated velocity dispersions that far exceed the instrumental resolution. Uncertainties in are based on formal uncertainties and are rescaled based on duplicate observations of individual targets (see Straatman et al., 2018).
3 Comparison between Integrated Stellar and Ionized Gas Kinematics
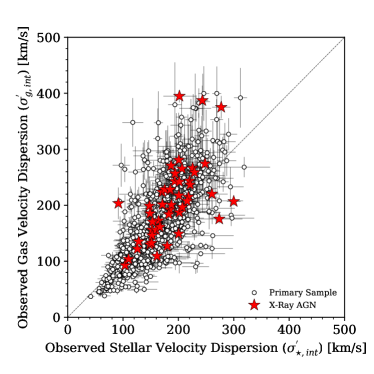
In this section we compare observed velocity dispersions from stars and ionized gas in 813 galaxies with detected emission lines and reliable spectral fits (with errors on and ). Fig. 3 shows the versus . Overall the two measures of the galaxy kinematics agree (= dex), but with significant scatter (0.13 dex, with 0.05 dex due to observational errors).
There are many reasons to expect differences between gas and stellar kinematics. Stellar kinematics are most sensitive to the distribution of mass in the inner parts of galaxies where stars dominate, whereas the ionized gas can have a range of spatial distributions. Furthermore, emission line kinematics are influenced by gas inflows and outflows and central AGN activity. Galaxies with X-ray detections, likely AGN hosts, are indicated by red stars and generally lie at elevated . However, these galaxies by no means account for all elevated measurements and there may be weaker AGN that are not detected in X-ray. Furthermore, there is a significant subset of galaxies with broader stellar than gas kinematics (25 with ). For these galaxies the ionized gas is not probing the full galaxy potential well and would significantly underestimate dynamical masses, however we note that the uncertainties on these low- measurements are often large.
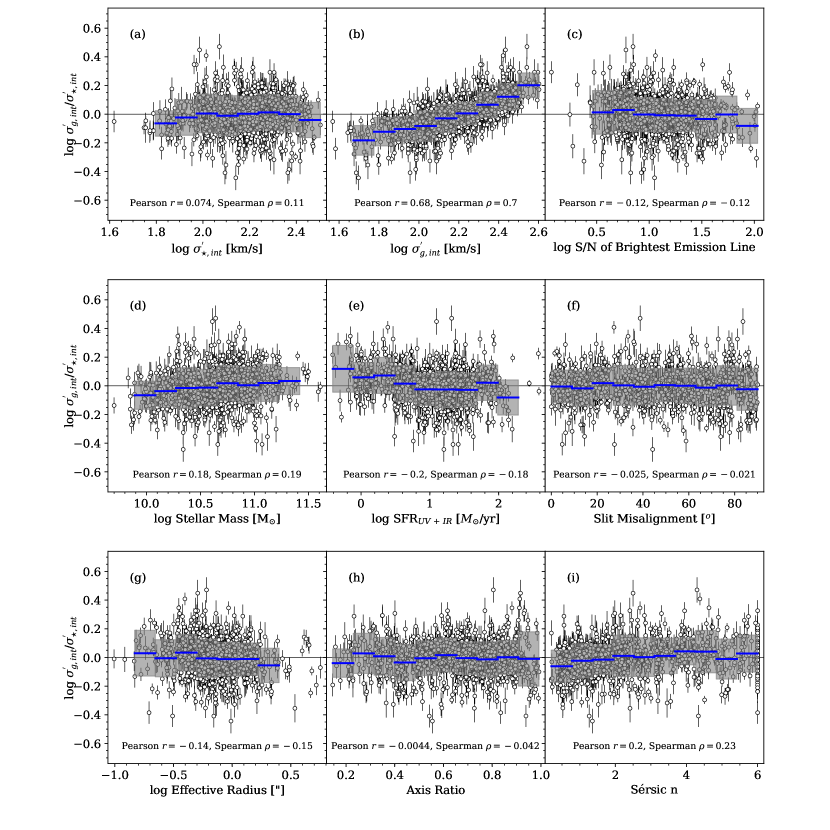
We find that the scatter between and persists for all subsets of galaxies. In Fig. 4 we explore residuals between gas and stellar ’s with either observed velocity dispersion and S/N (top row), stellar populations and slit alignment (middle row), and galaxy structures (bottom row). Fig. 4a indicates that the ratio of is roughly independent of . However, there is a strong trend (Fig. 4b) with such that low values () will underestimate , and the opposite for high observed gas velocity dispersion (). At low , this trend is likely imposed by the K-band selection of the LEGA-C survey, which preferentially excludes galaxies with low . This is the only strong trend (see correlation coefficients) in scatter or residuals between and . Fig. 4c, shows the residuals versus stellar mass and indicates that scatter decreases slightly at the lowest and highest stellar masses. However, emission line occurrence rate also decreases at the highest masses. The scatter between s is roughly constant with UV+IR SFR (Fig. 4d) and we find no trends with slit misalignment with respect to photometric semi-major axis (Fig. 4e). One might expect that the correspondence between gas and stellar kinematics would correlate more strongly with stellar structures, however we do not find evidence for this in the bottom row of Fig. 4 (size, axis ratio, and Sérsic index). In Fig. 4h the scatter between s increases somewhat for the roundest () galaxies. The roundest galaxies may exhibit scatter between s because they probe different disk versus bulge morphologies. Fig. 4i shows the scatter between and is similar for galaxies of all profile shapes. In all bins of galaxy structural and stellar populations, except at the lowest masses () and very large sizes (kpc), the average is less than 0.1 dex.
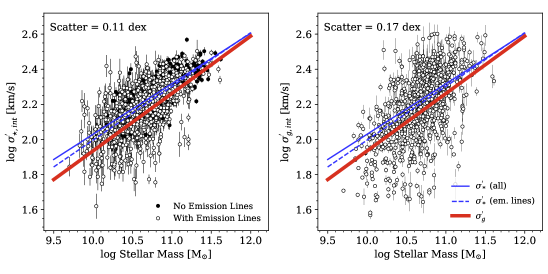
Ultimately one would like to use velocity dispersions, measured from either or , to probe scaling relations and estimate dynamical masses. In Fig. 5 we show (left) and (center and right) versus stellar masses or the “stellar mass” Faber-Jackson (mass FJ) relation (Faber & Jackson, 1976). We note that for , which is related to the circular velocity of a disk modulo beam-smearing and projection effects, this is related to the modified Tully & Fisher (1977) relation (e.g., - relation, Kassin et al., 2007; Straatman et al., 2017). We refer the reader to Straatman et al. in prep, for further 2D analysis of these observational effects. We expect both of these relations to have some intrinsic scatter, which for the FJ relation correlates with galaxy size - corresponding to the Fundamental Plane (Djorgovski & Davis, 1987; Dressler et al., 1987). We fit linear relations using a least-squares fitting algorithm and estimate the uncertainty with a 1000-realization bootstrap analysis. Using for the full sample (solid blue lines in Fig. 5) we find:
| (1) |
which is consistent within with results from a smaller sample at (Bezanson et al., 2015). We also fit the subsample of galaxies with emission lines and find:
| (2) |
(dashed blue lines).These relations are consistent at the 95% confidence level, however the slight tension between the fits emphasizes that selecting galaxies with emission lines biases the sample and impacts the measured scaling relations. Finally, we fit the mass FJ relation using (thick red line) and find:
| (3) |
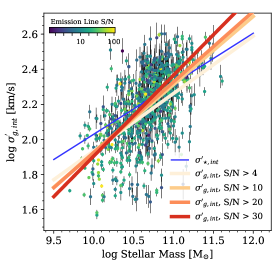
which is consistent within with other fits, with higher uncertainties. We note that this relation is steeper than for the full sample or from , a bias which increases when only galaxies with the strongest emission lines are used (red and orange lines in right panel). Neither is strongly correlated with either S/N of the strongest emission line or in the continuum (e.g. measured at rest-frame 4000 Å). However, note that below below , values are likely biased high, therefore we exclude galaxies with the lowest S/N emission lines The measured relation becomes progressively steeper with stronger emission lines.
Although there is general agreement amongst these relations, the observed scatter is significantly higher when is used (0.17 dex with 0.06 dex due to observational errors in ) than for stellar (0.11 dex with 0.04 dex due to errors). This difference in quadrature between the scatter in the two relations (dex) is equal to the scatter between and . Although population-averaged scaling relations can be approximated from emission line kinematics, the slopes may be biased and the scatter about those relations will be significantly overestimated. Since typical spectroscopic surveys are shallower than LEGA-C, this suggests that previously published scalings between mass and 1D emission line width (e.g. Mocz et al., 2012) may have biased slopes.
We emphasize that this analysis is solely based on 1D kinematics, which could easily be significantly sensitive to inclination effects. This is particularly true for star forming galaxies, which are largely rotationally supported at these redshifts (e.g., Kassin et al., 2007). We test this by comparing the comparing and with their averages evaluated in different mass bins for star forming and quiescent galaxies as a function of axis ratio. We find that at fixed stellar mass both and can be up to 0.1-0.3 dex below the average for the roundest () star-forming galaxies, whereas for all other axis ratios and all quiescent galaxies, the agreement is very good on average. This effect generally impacts both gas and stellar observed velocity dispersion similarly; both and are offset from their average values coherently. This may explain the lack of residuals in Figure 4h; both gas and stellar dynamics are similarly poor tracers of the dynamical mass for round star-forming galaxies. We verify that excluding round galaxies from the fits presented in Figure 5 yields relations that are consistent with Equations 1-3. The scatter is only 0.095dex about the mass Faber-Jackson relation and 0.15dex about the relation derived using , implying that inclination effects likely contributes 0.06dex and 0.08dex respectively.
4 Discussion and Conclusions
The extraordinary high S/N spectroscopy from the LEGA-C survey opens up a new window into the stellar continuum of massive galaxies at cosmological distances, while the magnitude-limited survey design facilitates an investigation of trends within the galaxy population. In contrast, most spectroscopic surveys of high-z galaxy kinematics are limited by depth and/or resolution to emission line studies. This combination has facilitated the comparison between stellar and ionized gas 1D kinematics in 813 massive galaxies at .
We emphasize that there is significant scatter between and for galaxies of all structures and stellar populations. Overall the dex scatter is slightly lower for galaxies with intermediate axis ratios, Sérsic indices, and the highest masses, but in all cases is dex. Although this may seem like a small price to pay to rely on emission line spectroscopy, we caution that for any individual galaxy this translates to an intrinsic uncertainty of dex on when observed velocity dispersion is measured from emission lines. This uncertainty propagates to an uncertainty of 0.24 dex on dynamical mass, on top of the other measurement errors and systematic uncertainties such as conversion between and intrinsic or the Virial constants. This uncertainty is comparable to systematic uncertainties in the stellar masses of high redshift galaxies (e.g. Muzzin et al., 2009).
We are unable to identify a specific population of galaxies for which scatter between s varies dramatically or the two measures are systematically offset, although we find a bias at fixed . It is easy to imagine selecting a galaxy population, particularly at high redshift, that also happens to have significantly discrepant stellar and ionized gas distributions, which leads to differences between and the intrinsic or stellar for the full population. This could be at play, for example, in the compact star-forming galaxies observed at to have systematically lower than expected from their high stellar masses and small effective radii (e.g. Barro et al., 2014; van Dokkum et al., 2015; Barro et al., 2016). Given the 0.13 dex scatter, it would be easy to account for a factor of 1.5-2 in converting to , which is sufficient e.g., to measure dynamical masses for all but the most extreme few galaxies. The good agreement between stellar and gas observed velocity dispersions implies that the less observationally expensive quantity, , can be used to measure overall scaling relations for emission line galaxies. Interestingly, we find that the stellar mass Faber-Jackson relation is similar for the full population of massive galaxies, measured from , and for galaxies with emission lines from , with a slight bias towards a steeper slope that increases as samples are limited to more prominent emission lines. Furthermore the uncertainty in the relation measured with and the observed scatter is significantly increased. Although it would be tempting, for example, to measuring the velocity dispersion function using , one must be extremely careful in accounting for the observed bias in emission line selections.
References
- Astropy Collaboration et al. (2013) Astropy Collaboration, Robitaille, T. P., Tollerud, E. J., et al. 2013, A&A, 558, A33
- Barro et al. (2014) Barro, G., Trump, J. R., Koo, D. C., et al. 2014, ApJ, 795, 145
- Barro et al. (2016) Barro, G., Faber, S. M., Dekel, A., et al. 2016, ApJ, 820, 120
- Bezanson et al. (2015) Bezanson, R., Franx, M., & van Dokkum, P. G. 2015, ApJ, 799, 148
- Bezanson et al. (2012) Bezanson, R., van Dokkum, P., & Franx, M. 2012, ApJ, 760, 62
- Bezanson et al. (2011) Bezanson, R., van Dokkum, P. G., Franx, M., et al. 2011, ApJ, 737, L31+
- Bezanson et al. (2018) Bezanson, R., van der Wel, A., Pacifici, C., et al. 2018, ApJ, 858, 60
- Bruzual & Charlot (2003) Bruzual, G., & Charlot, S. 2003, MNRAS, 344, 1000
- Calzetti et al. (2000) Calzetti, D., Armus, L., Bohlin, R. C., et al. 2000, ApJ, 533, 682
- Capak et al. (2007) Capak, P., Aussel, H., Ajiki, M., et al. 2007, ApJS, 172, 99
- Cappellari (2017) Cappellari, M. 2017, MNRAS, 466, 798
- Cappellari & Emsellem (2004) Cappellari, M., & Emsellem, E. 2004, PASP, 116, 138
- Cappelluti et al. (2009) Cappelluti, N., Brusa, M., Hasinger, G., et al. 2009, A&A, 497, 635
- Chabrier (2003) Chabrier, G. 2003, PASP, 115, 763
- Chae (2010) Chae, K. 2010, MNRAS, 402, 2031
- Chen et al. (2008) Chen, X.-Y., Hao, C.-N., & Wang, J. 2008, Chinese J. Astron. Astrophys., 8, 25
- Civano et al. (2016) Civano, F., Marchesi, S., Comastri, A., et al. 2016, ApJ, 819, 62
- Conroy et al. (2009) Conroy, C., Gunn, J. E., & White, M. 2009, ApJ, 699, 486
- Conroy & van Dokkum (2012) Conroy, C., & van Dokkum, P. 2012, ApJ, 747, 69
- Djorgovski & Davis (1987) Djorgovski, S., & Davis, M. 1987, ApJ, 313, 59
- Dressler et al. (1987) Dressler, A., Lynden-Bell, D., Burstein, D., et al. 1987, ApJ, 313, 42
- Faber & Jackson (1976) Faber, S. M., & Jackson, R. E. 1976, ApJ, 204, 668
- Ho (2009) Ho, L. C. 2009, ApJ, 699, 638
- Kassin et al. (2007) Kassin, S. A., Weiner, B. J., Faber, S. M., et al. 2007, ApJ, 660, L35
- Koekemoer et al. (2007) Koekemoer, A. M., Aussel, H., Calzetti, D., et al. 2007, ApJS, 172, 196
- Kriek et al. (2009) Kriek, M., van Dokkum, P. G., Labbé, I., et al. 2009, ApJ, 700, 221
- Kurucz (2011) Kurucz, R. L. 2011, Canadian Journal of Physics, 89, 417
- Magorrian et al. (1998) Magorrian, J., Tremaine, S., Richstone, D., et al. 1998, AJ, 115, 2285
- Marchesi et al. (2016) Marchesi, S., Civano, F., Elvis, M., et al. 2016, ApJ, 817, 34
- Martin et al. (2005) Martin, D. C., Fanson, J., Schiminovich, D., et al. 2005, ApJ, 619, L1
- Mason et al. (2015) Mason, C. A., Treu, T., Schmidt, K. B., et al. 2015, ApJ, 805, 79
- Massey et al. (2010) Massey, R., Stoughton, C., Leauthaud, A., et al. 2010, MNRAS, 401, 371
- McCracken et al. (2012) McCracken, H. J., Milvang-Jensen, B., Dunlop, J., et al. 2012, A&A, 544, A156
- Mocz et al. (2012) Mocz, P., Green, A., Malacari, M., & Glazebrook, K. 2012, MNRAS, 425, 296
- Muzzin et al. (2009) Muzzin, A., Marchesini, D., van Dokkum, P. G., et al. 2009, ApJ, 701, 1839
- Muzzin et al. (2013a) Muzzin, A., Marchesini, D., Stefanon, M., et al. 2013a, ApJS, 206, 8
- Muzzin et al. (2013b) —. 2013b, ApJ, 777, 18
- Pandya et al. (2017) Pandya, V., Greene, J. E., Ma, C.-P., et al. 2017, ApJ, 837, 40
- Sanders et al. (2007) Sanders, D. B., Salvato, M., Aussel, H., et al. 2007, ApJS, 172, 86
- Sheth et al. (2003) Sheth, R. K., Bernardi, M., Schechter, P. L., et al. 2003, ApJ, 594, 225
- Straatman et al. (2017) Straatman, C. M. S., Glazebrook, K., Kacprzak, G. G., et al. 2017, ApJ, 839, 57
- Straatman et al. (2018) Straatman et al., C. M. S. e. a. 2018, ApJ, in press, arXiv:1809.08236
- Tomczak et al. (2014) Tomczak, A. R., Quadri, R. F., Tran, K.-V. H., et al. 2014, ApJ, 783, 85
- Tully & Fisher (1977) Tully, R. B., & Fisher, J. R. 1977, A&A, 54, 661
- van der Wel et al. (2012) van der Wel, A., Bell, E. F., Häussler, B., et al. 2012, ApJS, 203, 24
- van der Wel et al. (2014) van der Wel, A., Franx, M., van Dokkum, P. G., et al. 2014, ApJ, 788, 28
- van der Wel et al. (2016) van der Wel, A., Noeske, K., Bezanson, R., et al. 2016, ApJS, 223, 29
- van Dokkum et al. (2011) van Dokkum, P. G., Brammer, G., Fumagalli, M., et al. 2011, ApJ, 743, L15
- van Dokkum et al. (2015) van Dokkum, P. G., Nelson, E. J., Franx, M., et al. 2015, ApJ, 813, 23
- Vazdekis (1999) Vazdekis, A. 1999, ApJ, 513, 224
- Whitaker et al. (2012) Whitaker, K. E., van Dokkum, P. G., Brammer, G., & Franx, M. 2012, ApJ, 754, L29