Ehsanfar and Mansouri
An Influence-based Clustering Model on Twitter
An Influence-based Clustering Model on Twitter
Abbas Ehsanfar \AFF\EMAILaehsanfa@stevens.edu \AUTHORMo Mansouri \AFF\EMAILmmansour@stevens.edu
School of Systems and Enterprises, Stevens Institute of Technology, Hoboken, NJ 07030
This paper introduces a temporal framework for detecting and clustering emergent and viral topics on social networks. Endogenous and exogenous influence on developing viral content is explored using a clustering method based on the a user’s behavior on social network and a dataset from Twitter API. Results are discussed by introducing metrics such as popularity, burstiness, and relevance score. The results show clear distinction in characteristics of developed content by the two classes of users.
clustering topics, temporal model, \HISTORY
1 Introduction
The complexity of using language on social networks in addition to active involvement of malevolent agents and bots, seizing on spreading certain topics and agenda, calls for novel explanatory approaches for detection and analysis of viral topics on social networks. In addition, the idea of formation of echo chambers among users (i.e. retweeting) suggests that tweeters would act partially based on the sources of information Allcott and Gentzkow (2017), i.e. usual users act according to perceived behavior from influential users. Recent discoveries on the mechanisms of spreading fake news through influential accounts such as foreign agents and bots calls for more inclusive methods in the analysis of viral topics on a social network Ferrara et al. (2016), Lazer et al. (2018), Vosoughi et al. (2018).
More than a decade after invention of world wide web, we started communicating through many-to-many and interactive online social platforms. Multiple studies have developed models to understand the networked relationship among social actors and communities during this era Wang et al. (2014), Murase et al. (2014), Sun et al. (2015). The networks of interactions among those are used to discover attitude, emotions, perception and sentiment associated with a content Wu et al. (2013), West et al. (2014). In addition, temporal interactions could reveal and predict community structure and membership behavior of users Yang et al. (2009) and to profile a user by its behavior including that of bots on social networks or agents in spreading fake news Agreste et al. (2015), Dickerson et al. (2014), Gilani et al. (2017). In developing commercial applications, online interactions among users and analysis of topics have given insight into discovering brand reputation and political orientation Ceron et al. (2015).
For analysis of topic and discourse on social networks, Davis et al. developed a ranking model for finding prevalent topics on Twitter Davis et al. (2017). Cigarr et al. presented an approach using Formal Concept Analysis (FCA) to distinguish interest groups regarding products and brands on social networks Cigarrán et al. (2016). Lipizzi et. al. used a graph-based approach using adjacency matrix of concatenation among keywords to identify real-world discourses expressed through back-channeling on social networks Lipizzi et al. (2016) where a similar approach can cluster users based on trending topics Hachaj and Ogiela (2017). Xie and Mathioudakis employ the concepts of popular and bursty keywords to detect topics in real-time Xie et al. (2016), Mathioudakis and Koudas (2010). Crane et al. differentiate between exogenous and endogenous topics Crane and Sornette (2008) and other studies compare topics developed on Twitter to conventional online media such as New York Times, Google trends, and CNN base on endogenous and exogenous influence on users Zhao et al. (2011), Kwak et al. (2010). Network models of users, concepts and documents have been employed to understand dynamics of community and content development on social network Gao and Liu (2017). Network models of influential users and concepts are used to calculate the effectiveness of WikiProjects in online content development Qin et al. (2015) and the structure of knowledge among computer science venues Pham and Klamma (2010). In addition, network statistics, such as centrality, closeness, betweenness, and entropy are employed to explain the interconnectedness of communities and concepts in social networks Nikolaev et al. (2015), Kandhway and Kuri (2017).
This paper explores the connection among behavioral metrics of influential users and evolution of content and discourse on a social network. The scope of this paper is limited to analyze and compare two distinguished types of influential behavior in terms of their perceived contents in a network. An exogenous influence appears when information is shared by an non-native and external source such as a news media outlet or, to some extent, a journalist. In contrary, endogenous influence is exercised through interaction and discussion on the platform through influential users, i.e. hobs, lead users Kratzer et al. (2016). These observed types of behavioral influence among users are: 1) Media-driven influence (MDI) that is associated with exogenous influence through introduction, sharing links, and summarization of topics that are originally external to a platform and 2) Interaction-driven Influence (IDI) that is associated with interactive behaviors such as retweeting, replying, and discussing topics on the platform among others versus distributing external news and content.
In this paper, a networked model of terms, keywords and hashtags in combination with the classified sources provide behavioral insights to temporal aspects of developing content on Twitter. This proposes a method to classify user accounts based on their online activities and distinguish two types of exogenous (MDI) and endogenous (IDI) influence which better explain the mechanism behind spreading viral topics on social networks. To visualize results, multiple intuitive parameters for clustering topics enhances the explanatory value of this method for our discussion regarding the nature of influence in social content. This work focuses on connecting the evolution of content on networks to behavioral characteristics of influential sources.
2 User Classification
In this section, we distinguish two classes of behavior by users in terms of their interaction level and type of contribution on Twitter. First, online activities of a user can be captured by her tweets, e.g. length and links, retweets, and replies. For simplicity of our behavioral model, we limit the activity model to these input metrics. This introduce a model to classify users to two classes (MDI and IDI) and extract new accounts on twitter associated with each class.
The introduced logistic regression model uses these features: number of retweets, number of replies, number of shared links, and median text-length:
| (1) |
In the first phase, we select 170 accounts with MDI and IDI characteristics noticing that these accounts can be recognized by monitoring online activities of accounts in terms of sharing personal stories, direct communication with others, i.e. their organic interaction on social media. For instance, New York Times labeled as (MDI) and interactive users such as Bill Gates labeled as (IDI).We train the logistic regression (LR) model in Eq. 1 using the selected accounts (training set). In second phase, we extract accounts that have been most influential on those selected accounts (e.g. being retweeted by them the most) and select second batch of data set consisting of 170 new accounts. We label the latter data set, update the logistic model and repeat the same processes of extracting, model updating and labeling the most influential accounts until more than 1750 accounts are collected. In sum, of accounts were labeled manually and the other were collected and labeled iteratively (in mini-batches) using above LR model.
| Variable: | Interception | Retweets | Replies | Links | Length |
|---|---|---|---|---|---|
| Coefficient: | -0.96 | 0.35 | -1.76 | 2.82 | 0.61 |
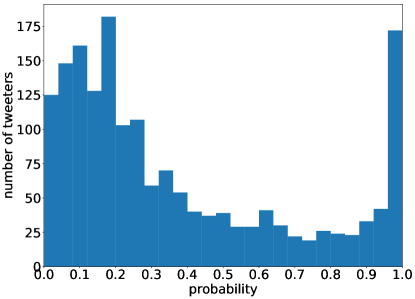
Table 1 shows the selected variables and their calculated coefficients. The positive values for retweets, shared links and median length of tweets imply that these variables are more associated with MIDI while number of replies is more associated with IDI. Fig. 1 shows the probability distribution of accounts using the LR model. The minimum point of is used to assign labels to accounts which results in labeling of users as MDI and the rest as IDI. In sum, user accounts are labeled into 352 and 1398 sources with exogenous and endogenous labels. Although the number of former accounts are significantly lower than the latter accounts, the activity level of two groups are equivalent and very close since MDI users publish and distribute more content.
3 Clustering Model
A frequentist models of words are vastly used to cluster emergence topics in social networks. In this respect, topics are both popular and scarce: first, a new topic is relatively viral and under discussion across a network, second, it may not has been as much discussed in the past or under regular circumstances. In tf-idf, a widely used method for extracting new topics, the usage-frequency of a word in combination with the inverse-frequency of documents including the word define the relevance between the topic and a document. In social networks, a user may apply unconventional wordings, phrases, hashtags and abbreviations to efficiently communicate her message, thereby, a networked model of terms and words are applied to reconstruct grammar in analysis of discourse Himelboim et al. (2017), Lipizzi et al. (2016). In this chapter, I also opt to employ the networked structure of language for clustering viral topics. According to a graph-based model of terms, a term (e.g. word, hashtag, abbreviation, keyword or compound word) is represented as a node when the frequency of its usage in combination with the second term in shared occasions implies the strength of connection between these terms in developing new topics across a network.
The method introduced in this work is aimed at being efficient in detecting new topics and explanative in analysis of those topics. To discover the strength of a link between terms using term-pairs, similar to the frequency case in tf-idf, we devise two metrics: frequency of a pair and inverse frequency of a pair in a time frame, i. e. lower value for a higher expected frequency. Feng et al. (see Feng et al. (2015)) defined the popularity of an event as the normalized frequency of that event by number of tweets and burstiness of an event as the standardized popularity by the popularity of the same event achieved during other temporal time frames.
Assume that are the number of all words (i.e. words, hashtags, concepts, and compound words) during a time frame , are the documents (e.g. tweets, post updates) published during the same frame, and:
consists of frequencies of all defined connections among those words where the cardinality of is the number of possible connections among words: . The popularity of link normalizes its usage by the number of tweets during each time frame:
| (2) |
where and are averaged and standard deviation of frequencies in at time frame . The latter equation which leads to an array of normalized popularity for existing links. The burstiness standardizes popularity by the average values and standard deviation for the same connection among all temporal frames:
| (3) |
where is the averaged value of popularity of link between and across time frames and is the standard deviation of those frequencies.
While popularity (Eq. 2) uses the direct columns of frequency matrix in time (each column represents frequencies for all connections at one time step), burstiness formula (Eq. 3) uses popularity matrix. A weighted average of popularity and burstiness for inter-word links gives the relevance score for every connection:
| (4) |
A similar linear combination of above metrics in addition to localness was called ranking score by Feng et al. (2015). In this work, the matrix of connection scores among terms is called as relevance matrix which is close to definition of similarity matrix in literature. We use a thresholds (e.g. percentile) to convert the relevance matrix to a sparse adjacency matrix.
4 Empirical Results and Discussion
We collect and process more than 6,250,000 tweets published or retweeted by 1742 influential accounts on Twitter from August 2017 to March 2018. We select 355 accounts belonging to journalists, economists, scientist, news organizations, activists, etc. as initial seed of influential users1. 1. endnote: 1. using websites such as time, politico, sciencemag, etc.. Then we retrieve another 1395 accounts from the most retweeted accounts by the initial seed during 210 days of the time period. Extracting data from Twitter API was almost sequential (10-user batch at step) to gradually update the list of most influential accounts the cumulative set of accounts determined the next batch.
For each tweet, we stripped text from frequent words and punctuations using stopwords repository and retrieved stemmed words using nltk toolkit2. 2. endnote: 2. http://www.nltk.org/howto/stem.html. These processes significantly reduced the number of effective terms and computational complexity of graph-based model of terms in memory and time. For instance, each stem word aggregates 4.79 different words and 5000 stemmed terms are equivalent to 23950 terms. In sum, these processes reduced the number of effective statuses (by ) as it eliminated those without linguistic content e.g. photos, videos and links. For the graph-based model, we select 5000 as the maximum dimension associated with tokenizing the documents. The selected words are the words with highest frequencies across all documents. Using scipy library on Python 3.6, we create sparse matrix of link-frequency when each link between terms and is defined as the number of tweets that include both and .
4.1 Popularity vs Burstiness
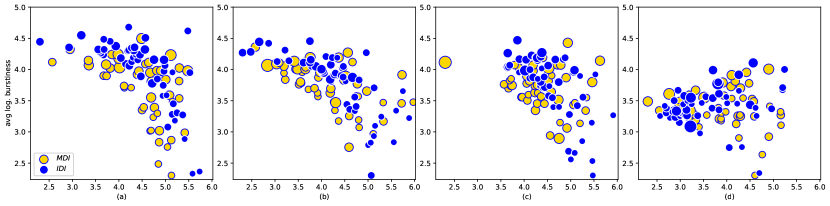
In Fig. 2, the relative popularity, burstiness for top 50 clusters in terms of their relative score for each user-class of MDI or IDI are shown. In each figure, x-axis represents popularity and y-axis represents burstiness where both are relative to cluster size and logarithmic and a circle radius represents its cluster size. The temporal granularity includes 1, 3, 7 and 21 days, from left figure to right figure. The y-axis has equal range across all temporal frames for better comparison ( to ). Although these figures show the logarithmic and relative values, we use relative and non-logarithmic values of popularity, burstiness and scores for discussion.
4.2 Viral Topics
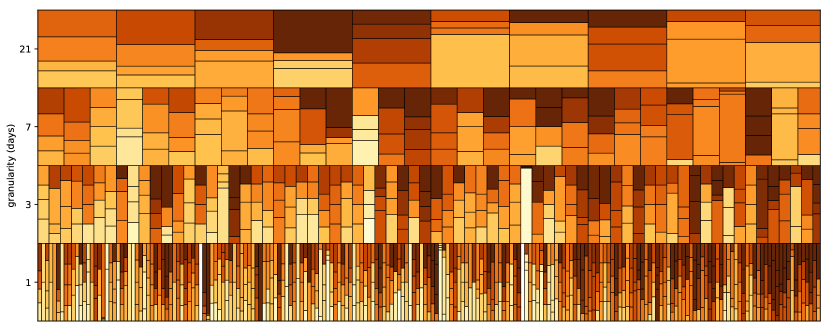
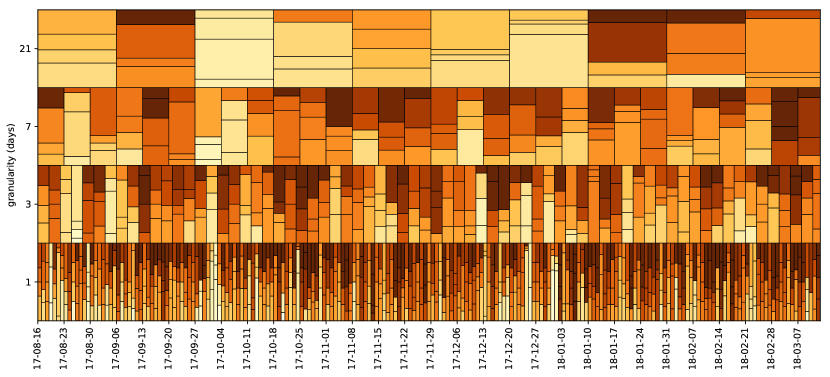
Figure 3 visualizes significant clusters in terms of relative score (i.e. viralness) across time frames. We can already notice the concentration of topics for IDI and MDI among middle (3 and 7-day) and longer (21-day) time frames in order. In those figures, each rectangle shows a topic, darker color represents higher score and rectangle height represents cluster size.
5 Conclusion
In this paper, we classified two sets of influential accounts based on their aggregated activity, interpreted as their endogenous and exogenous influence on the circulation of linguistic content on Twitter. This paper contributes: 1) a model of classifying accounts based on their activity on Twitter, 2) a clustering method for analyzing topics based on popularity and burstiness of connections among terms (term-pairs).
The results show that the exogenous behavior of users is more limited in terms of developing diverse topics while the endogenous behavior creates greater potential to develop new topics and diversify content. After matching viral topics to actual news, the interactive behavior among users (IDI) is more focused on social, lifestyle and technology with more consistency among topics in terms of their temporal consecutiveness. On the other hand, MDI are more focused on abstract, news-based and political topics on the lowest granularity in time steps.
Future research may develop simulation models such as Agent-based Social Systems (ABSS) based on the observations in this research to understand suspicious and adversarial behavior of influential accounts. The results from this research can be applied to design effective learning and broadcasting systems that combine diffusion of messages in social networks and interactive behavior of users.
The authors gratefully acknowledge the preparation of Twitter data by Mr. Arash E. Vesaghi.
References
- Agreste et al. (2015) Agreste, Santa, Pasquale De Meo, Emilio Ferrara, Sebastiano Piccolo, Alessandro Provetti. 2015. Analysis of a heterogeneous social network of humans and cultural objects. IEEE Transactions on Systems, Man, and Cybernetics: Systems 45(4) 559–570.
- Allcott and Gentzkow (2017) Allcott, Hunt, Matthew Gentzkow. 2017. Social media and fake news in the 2016 election. Journal of Economic Perspectives 31(2) 211–36.
- Ceron et al. (2015) Ceron, Andrea, Luigi Curini, Stefano M Iacus. 2015. Using sentiment analysis to monitor electoral campaigns: Method matters—evidence from the united states and italy. Social Science Computer Review 33(1) 3–20.
- Cigarrán et al. (2016) Cigarrán, Juan, Ángel Castellanos, Ana García-Serrano. 2016. A step forward for topic detection in twitter: An fca-based approach. Expert Systems with Applications 57 21–36.
- Crane and Sornette (2008) Crane, Riley, Didier Sornette. 2008. Robust dynamic classes revealed by measuring the response function of a social system. Proceedings of the National Academy of Sciences 105(41) 15649–15653.
- Davis et al. (2017) Davis, Derek, Gerardo Figueroa, Yi-Shin Chen. 2017. Socirank: identifying and ranking prevalent news topics using social media factors. IEEE transactions on systems, man, and cybernetics: systems 47(6) 979–994.
- Dickerson et al. (2014) Dickerson, John P, Vadim Kagan, VS Subrahmanian. 2014. Using sentiment to detect bots on twitter: Are humans more opinionated than bots? Advances in Social Networks Analysis and Mining (ASONAM), 2014 IEEE/ACM International Conference on. IEEE, 620–627.
- Feng et al. (2015) Feng, Wei, Chao Zhang, Wei Zhang, Jiawei Han, Jianyong Wang, Charu Aggarwal, Jianbin Huang. 2015. Streamcube: hierarchical spatio-temporal hashtag clustering for event exploration over the twitter stream. Data Engineering (ICDE), 2015 IEEE 31st International Conference on. IEEE, 1561–1572.
- Ferrara et al. (2016) Ferrara, Emilio, Onur Varol, Clayton Davis, Filippo Menczer, Alessandro Flammini. 2016. The rise of social bots. Communications of the ACM 59(7) 96–104.
- Gao and Liu (2017) Gao, Chao, Jiming Liu. 2017. Network-based modeling for characterizing human collective behaviors during extreme events. IEEE Transactions on Systems, Man, and Cybernetics: Systems 47(1) 171–183.
- Gilani et al. (2017) Gilani, Zafar, Reza Farahbakhsh, Gareth Tyson, Liang Wang, Jon Crowcroft. 2017. Of bots and humans (on twitter). Proceedings of the 2017 IEEE/ACM International Conference on Advances in Social Networks Analysis and Mining 2017. ACM, 349–354.
- Hachaj and Ogiela (2017) Hachaj, Tomasz, Marek R Ogiela. 2017. Clustering of trending topics in microblogging posts: A graph-based approach. Future Generation Computer Systems 67 297–304.
- Himelboim et al. (2017) Himelboim, Itai, Marc A Smith, Lee Rainie, Ben Shneiderman, Camila Espina. 2017. Classifying twitter topic-networks using social network analysis. Social Media+ Society 3(1) 2056305117691545.
- Kandhway and Kuri (2017) Kandhway, Kundan, Joy Kuri. 2017. Using node centrality and optimal control to maximize information diffusion in social networks. IEEE Transactions on Systems, Man, and Cybernetics: Systems 47(7) 1099–1110.
- Kratzer et al. (2016) Kratzer, Jan, Christopher Lettl, Nikolaus Franke, Peter A Gloor. 2016. The social network position of lead users. Journal of Product Innovation Management 33(2) 201–216.
- Kwak et al. (2010) Kwak, Haewoon, Changhyun Lee, Hosung Park, Sue Moon. 2010. What is twitter, a social network or a news media? Proceedings of the 19th international conference on World wide web. AcM, 591–600.
- Lazer et al. (2018) Lazer, David MJ, Matthew A Baum, Yochai Benkler, Adam J Berinsky, Kelly M Greenhill, Filippo Menczer, Miriam J Metzger, Brendan Nyhan, Gordon Pennycook, David Rothschild, et al. 2018. The science of fake news. Science 359(6380) 1094–1096.
- Lipizzi et al. (2016) Lipizzi, Carlo, Dante Gama Dessavre, Luca Iandoli, Jose Emmanuel Ramirez Marquez. 2016. Towards computational discourse analysis: A methodology for mining twitter backchanneling conversations. Computers in Human Behavior 64 782–792.
- Mathioudakis and Koudas (2010) Mathioudakis, Michael, Nick Koudas. 2010. Twittermonitor: trend detection over the twitter stream. Proceedings of the 2010 ACM SIGMOD International Conference on Management of data. ACM, 1155–1158.
- Murase et al. (2014) Murase, Yohsuke, János Török, Hang-Hyun Jo, Kimmo Kaski, János Kertész. 2014. Multilayer weighted social network model. Physical Review E 90(5) 052810.
- Nikolaev et al. (2015) Nikolaev, Alexander G, Raihan Razib, Ashwin Kucheriya. 2015. On efficient use of entropy centrality for social network analysis and community detection. Social Networks 40 154–162.
- Pham and Klamma (2010) Pham, Manh Cuong, Ralf Klamma. 2010. The structure of the computer science knowledge network. Advances in Social Networks Analysis and Mining (ASONAM), 2010 International Conference on. IEEE, 17–24.
- Qin et al. (2015) Qin, Xiangju, Pádraig Cunningham, Michael Salter-Townshend. 2015. The influence of network structures of wikipedia discussion pages on the efficiency of wikiprojects. Social Networks 43 1–15.
- Sun et al. (2015) Sun, Xiaoling, Hongfei Lin, Kan Xu. 2015. A social network model driven by events and interests. Expert Systems With Applications 42(9) 4229–4238.
- Vosoughi et al. (2018) Vosoughi, Soroush, Deb Roy, Sinan Aral. 2018. The spread of true and false news online. Science 359(6380) 1146–1151.
- Wang et al. (2014) Wang, Zhu, Daqing Zhang, Xingshe Zhou, Dingqi Yang, Zhiyong Yu, Zhiwen Yu. 2014. Discovering and profiling overlapping communities in location-based social networks. IEEE Transactions on Systems, Man, and Cybernetics: Systems 44(4) 499–509.
- West et al. (2014) West, Robert, Hristo S Paskov, Jure Leskovec, Christopher Potts. 2014. Exploiting social network structure for person-to-person sentiment analysis. arXiv preprint arXiv:1409.2450 .
- Wu et al. (2013) Wu, Junjie, Haoyan Sun, Yong Tan. 2013. Social media research: A review. Journal of Systems Science and Systems Engineering 22(3) 257–282.
- Xie et al. (2016) Xie, Wei, Feida Zhu, Jing Jiang, Ee-Peng Lim, Ke Wang. 2016. Topicsketch: Real-time bursty topic detection from twitter. IEEE Transactions on Knowledge and Data Engineering 28(8) 2216–2229.
- Yang et al. (2009) Yang, Tianbao, Yun Chi, Shenghuo Zhu, Yihong Gong, Rong Jin. 2009. A bayesian approach toward finding communities and their evolutions in dynamic social networks. Proceedings of the 2009 SIAM International Conference on Data Mining. SIAM, 990–1001.
- Zhao et al. (2011) Zhao, Wayne Xin, Jing Jiang, Jianshu Weng, Jing He, Ee-Peng Lim, Hongfei Yan, Xiaoming Li. 2011. Comparing twitter and traditional media using topic models.