DeepSeeNet: A Deep Learning Model for Automated Classification of Patient-based Age-related Macular Degeneration Severity from Color Fundus Photographs
Taxonomy topics (2-6)
deep learning; age-related macular degeneration (AMD); Age-Related Eye Disease Study (AREDS); convolutional neural network (CNN); artificial intelligence (AI)
Corresponding Author(s)
Zhiyong Lu, PhD, National Center for Biotechnology Information (NCBI), National Library of Medicine (NLM), National Institutes of Health (NIH), 8600 Rockville Pike, Bethesda, MD 20894, zhiyong.lu@nih.gov
Emily Y. Chew, MD, National Eye Institute (NEI), National Institutes of Health (NIH), 9000 Rockville Pike, Bethesda, MD 20894, echew@nei.nih.gov
Financial Support: Supported by the intramural program funds and contracts from the National Center for Biotechnology Information/National Library of Medicine/National Institutes of Health, the National Eye Institute/National Institutes of Health, Department of Health and Human Services, Bethesda Maryland (Contract HHS-N-260-2005-00007-C; ADB contract NO1-EY-5-0007). Funds were generously contributed to these contracts by the following National Institutes of Health: Office of Dietary Supplements, National Center for Complementary and Alternative Medicine; National Institute on Aging; National Heart, Lung, and Blood Institute; and National Institute of Neurological Disorders and Stroke. The sponsor and funding organization participated in the design and conduct of the study; data collection, management, analysis and interpretation; and the preparation, review and approval of the manuscript.
Abstract
Purpose: In assessing the severity of age-related macular degeneration (AMD), the Age-Related Eye Disease Study (AREDS) Simplified Severity Scale predicts the risk of progression to late AMD. However, its manual use requires the time-consuming participation of expert practitioners. Although several automated deep learning systems have been developed for classifying color fundus photographs (CFP) of individual eyes by AREDS severity score, none to date has used a patient-based scoring system that uses images from both eyes to assign a severity score.
Design: DeepSeeNet, a deep learning model, was developed to classify patients automatically by the AREDS Simplified Severity Scale (score 0-5) using bilateral CFP.
Participants: DeepSeeNet was trained on 58,402 and tested on 900 images from the longitudinal follow-up of 4,549 participants from AREDS. Gold standard labels were obtained using reading center grades.
Methods: DeepSeeNet simulates the human grading process by first detecting individual AMD risk factors (drusen size, pigmentary abnormalities) for each eye and then calculating a patient-based AMD severity score using the AREDS Simplified Severity Scale.
Main Outcome Measures: Overall accuracy, specificity, sensitivity, Cohen’s kappa, and area under the curve (AUC). The performance of DeepSeeNet was compared with that of retinal specialists.
Results: DeepSeeNet performed better on patient-based classification (accuracy = 0.671; kappa = 0.558) than retinal specialists (accuracy = 0.599; kappa = 0.467) with high AUC in the detection of large drusen (0.94), pigmentary abnormalities (0.93), and late AMD (0.97). DeepSeeNet also outperformed retinal specialists in the detection of large drusen (accuracy 0.742 vs. 0.696; kappa 0.601 vs. 0.517) and pigmentary abnormalities (accuracy 0.890 vs. 0.813; kappa 0.723 vs. 0.535) but showed lower performance in the detection of late AMD (accuracy 0.967 vs. 0.973; kappa 0.663 vs. 0.754).
Conclusions: By simulating the human grading process, DeepSeeNet demonstrated high accuracy with increased transparency in the automated assignment of individual patients to AMD risk categories based on the AREDS Simplified Severity Scale. These results highlight the potential of deep learning to assist and enhance clinical decision-making in patients with AMD, such as early AMD detection and risk prediction for developing late AMD. DeepSeeNet is publicly available on https://github.com/ncbi-nlp/DeepSeeNet.
Age-related macular degeneration (AMD) is responsible for approximately 9% of global blindness and is the leading cause of visual loss in developed countries.[1, 2] The number of people with AMD worldwide is projected to be 196 million in 2020, increasing substantially to 288 million in 2040.[3] The prevalence of AMD increases exponentially with age: late AMD in white populations has been estimated by meta-analysis at 6% at 80 years and 20% at 90 years.[4] Over time, increased disease prevalence through changing population demographics may place great burdens on eye services, especially where retinal specialists are not available in sufficient numbers to perform individual examinations on all patients. It is conceivable that deep learning or telemedicine approaches might support future eye services; however, this might only apply when evidence-based systems have undergone extensive validation and demonstrated performance metrics that are at least noninferior to those of clinical ophthalmologists in routine practice.
Age-related macular degeneration arises from a complex interplay among aging, genetics, and environmental risk factors.[5, 6] It is regarded as a progressive, stepwise disease and is classified by clinical features (based on clinical examination or color fundus photography) into early, intermediate, and late stages.[7] The hallmarks of intermediate disease are the presence of large drusen or pigmentary abnormalities at the macula. There are 2 forms of late AMD: (1) neovascular AMD and (2) atrophic AMD, with geographic atrophy (GA).
The Age-Related Eye Disease Study (AREDS), sponsored by the National Eye Institute (National Institutes of Health), was a randomized clinical trial to assess the effects of oral supplementation with antioxidant vitamins and minerals on the clinical course of AMD and age-related cataract. Longitudinal analysis of this study cohort led to the development of the patient-based AREDS Simplified Severity Scale for AMD, based on color fundus photographs.[8] This simplified scale provides convenient risk factors for the development of advanced AMD that can be determined by clinical examination or by less demanding photographic procedures than used in the AREDS. The scale combines risk factors from both eyes to generate an overall score for the individual, based on the presence of 1 or more large drusen (diameter ) or AMD pigmentary abnormalities at the macula of each eye.[8] The Simplified Severity Scale is also clinically useful in that it allows ophthalmologists to predict an individual’s 5-year risk of developing late AMD. This 5-step scale (from score 0 to 4) estimates the 5-year risk of the development of late AMD in at least 1 eye as 0.4%, 3.1%, 11.8%, 25.9%, and 47.3%, respectively.[8]
Automated image analysis tools have demonstrated promising results in biology and medicine.[9, 10, 11, 12, 13, 14, 15] In particular, deep learning, a subfield of machine learning, has recently generated substantial interest in the field of ophthalmology.[9, 16, 17, 18, 19, 20, 21] Past studies have used deep learning systems for the identification of various retinal diseases, including diabetic retinopathy, [22, 23, 24, 25, 26, 27] glaucoma,[27, 28, 29, 30] retinopathy of prematurity,[31] and AMD.[19, 21, 27, 32, 33] In general, deep learning is the process of training algorithmic models with labeled data (e.g., color fundus photographs categorized manually as containing pigmentary abnormalities or not), where these models can then be used to assign labels automatically to new data. Deep learning differs from traditional machine learning methods in that specific image features do not need to be prespecified by experts in that field. Instead, the image features are learned directly from the images themselves.
Recently, several deep learning systems have been developed for the classification of color fundus photographs into AMD severity scales, at the level of the individual eye. These severity scales have included both binary (e.g., referable vs. nonreferable AMD[17, 19, 21, 27, 32]) and multi-class (e.g., the 9-step AREDS Severity Scale[16, 34] and a 4-class AMD classification[35]) systems. However, to the best of our knowledge, none to date has developed a patientbased system that, similar to the AREDS Simplified Severity Scale score, uses images from both eyes to obtain one overall score for the individual. This is particularly relevant because estimates of rates of progression to late AMD are highly influenced by the status of fellow eyes, because the behavior of the 2 eyes is highly correlated.[8] Additionally, several recent studies have reported robust performance in the automated classification of AMD from OCT scans.[21, 36, 37, 38, 39] Unlike these studies, DeepSeeNet is based on data from color fundus photography, which remains an important imaging modality for assessing the ophthalmic disease and is essential in grading eyes using the AREDS Simplified Severity Score.[40] Similar to the study by De Fauw et al,[37] DeepSeeNet contains 2 stages by design for improved performance and increased transparency. However, their 2-stage approach is different from ours with respect to the actual approach details as well as issues in data variability.
The primary aim of our study was to train and test a deep learning model to identify patient-level AMD severity using the AREDS Simplified Severity Scale from color fundus images of both eyes. Images were obtained from the AREDS dataset, one of the largest available datasets containing approximately 60,000 retinal images. Different from previous methods, our model mimics the human grading process by first detecting individual risk factors (drusen and pigmentary abnormalities) in each eye and then combining values from both eyes to assign an AMD score for the patient. Thus, our model closely matches the clinical decision-making process, which allows an ophthalmologist to inspect and visualize an interpretable result, rather than being presented with an AMD score by a “black-box” approach. This approach offers potential insights into the decision-making process, in a fashion more typical of clinical practice, and has the advantages of transparency and explainability.
Methods and Materials
The specific aims of the study were (1) to compare the performance of 3 deep learning models generated by 3 different training strategies; and (2) for the most accurate of these 3 models, to compare its performance with that of retinal specialists (AREDS investigators whose assessments had previously been recorded during the AREDS).
The reference measure used as the “gold standard” for both training purposes and the measurement of performance was the grading previously assigned to each color fundus photograph by human graders at the Reading Center for the AREDS, as described next.
Assignment of the AREDS Simplified Severity Scale by Reading Center grading
This study used the AREDS dataset.[8] Briefly, the AREDS was a 12-year multi-center, prospective cohort study of the clinical course, prognosis, and risk factors of AMD and age-related cataract. Institutional review board approvals were obtained from all 11 clinical sites, and written informed consents were obtained from all AREDS participants. Stereoscopic color fundus photographs from both eyes (field 2, 30° imaging field centered at the fovea) were obtained at the study baseline, the 2-year followup visit, and annually thereafter. Because of the inherent redundancy in a pair of stereoscopic photographs, for each eye, only 1 of the pair of photographs was used in the current study. In general, the left image of the pair was used unless missing from the database, in which case the right image was used instead ().
The gold standard annotation (image labeling) was performed by expert human graders at the Reading Center (University of Wisconsin). The workflow is described in detail in AREDS Report number 6.[41] In brief, a senior grader (grader 1) performed preliminary grading of the photograph for AMD severity using a standardized protocol for a 4-category scale, and a junior grader (grader 2) performed detailed grading of the photograph for multiple specific AMD features. A computerized algorithm then extracted the AMD severity levels from the detailed gradings (by grader 2). In the case of any discrepancy regarding the AMD severity level between the graders, a senior investigator would adjudicate the final severity level. All photographs were graded independently, that is, graders were masked to the photographs and grades from previous visits. Senior graders had approximately 10 to 15 years of experience, and junior graders had up to 5 years of experience.
In addition, a rigorous process of grading quality control was performed at the Reading Center including the assessment for the inter-grader and intra-grader agreement overall and according to specific AMD features.[41] Analyses for potential “temporal drift” were conducted by having all graders re-grade in a masked fashion the same group of images annually for the duration of the study.
For each participant, at each time point, grades for both eyes were used to calculate the AREDS Simplified Severity Scale score. This scale ranges from 0 to 5, with a score of 0 to 4 assigned to participants based on the drusen/pigment status in each eye, and a score of 5 assigned to participants with late AMD (defined as neovascular AMD or central GA) in either eye (Fig. 1). This is a modification of the original scoring method described by Ferris et al. [8] As described previously, these scores were used as gold standard labels (i.e., reference), both for training purposes and to assess the performance of the different models developed in this study.
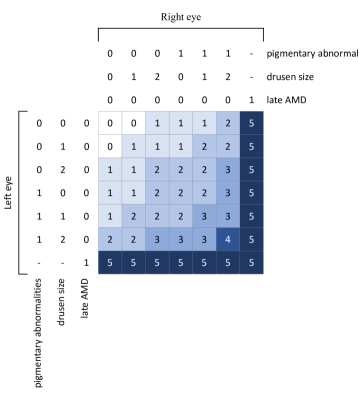
Image datasets used in the training and testing of the deep learning model
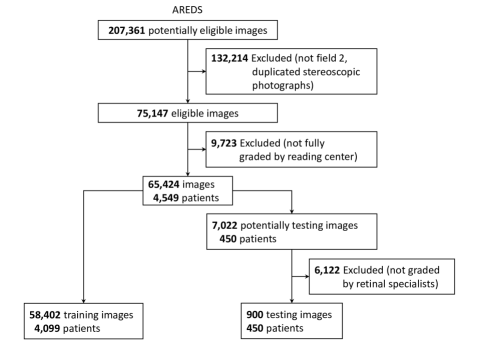
The AREDS dataset is publicly accessible to researchers by request at dbGAP (https://www.ncbi.nlm.nih.gov/projects/gap/cgi-bin/study.cgi?study_id=phs000001.v3.p1).[8] A total of 59,302 color fundus images from 4,549 participants were extracted from the AREDS dataset. This dataset was divided into 2 subsets: (1) a testing dataset, which consisted of bilateral images captured at the study baseline from 450 participants (i.e., 1 image from each eye); at the time of the study, in addition to undergoing normal Reading Center grading, these images were also assessed (separately and independently) by the retinal specialists, whose responses were recorded; and (2) a training dataset, which consisted of 58,402 images from the remaining 4,099 participants, captured at multiple study visits (although not all participants had follow-up visits through to 12 years). The images taken from the group of 450 participants at visits other than the baseline visit were not used in either dataset (Fig. S1). Table 1 summarizes the distribution of participants by the AREDS Simplified Severity Scale at baseline. Table 2 summarizes the distributions of scored AMD features among the training and testing datasets.
| AREDS Simplified | No. of Participants (% Total) | ||||
| Severity Scale Score | Training | Testing | |||
| 0 | 1,258 | (30.7) | 185 | (41.1) | |
| 1 | 653 | (15.9) | 79 | (17.6) | |
| 2 | 461 | (11.3) | 56 | (12.4) | |
| 3 | 303 | (7.4) | 46 | (10.2) | |
| 4 | 279 | (6.8) | 33 | (7.3) | |
| 5 | 537 | (13.1) | 51 | (11.3) | |
| Total participants | 4,099 | (100.0) | 450 | (100.0) | |
-
•
AREDS = Age-Related Eye Disease Study.
| Risk factors | Number of Fundus Images (% Total) | ||||
| Training (all visits) | Testing (baseline) | ||||
| Drusen | |||||
| Small/none | 23,625 | (40.5) | 395 | (43.9) | |
| Medium | 16,020 | (27.4) | 206 | (22.9) | |
| Large | 18,757 | (32.1) | 299 | (33.2) | |
| Pigmentary abnormalities | |||||
| No | 36,712 | (62.9) | 631 | (70.1) | |
| Yes | 21,690 | (37.1) | 269 | (29.9) | |
| Late AMD | |||||
| No | 50,800 | (87.0) | 849 | (94.3) | |
| Yes | 7,602 | (13.0) | 51 | (5.7) | |
| Total images | 58,402 | (100.0) | 900 | (100.0) | |
-
•
AMD = age-related macular degeneration.
Composition of the DeepSeeNet deep learning model
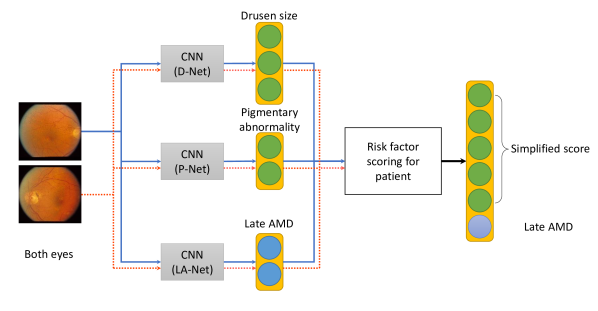
DeepSeeNet was designed as a deep learning model that could be used to assign patient-based AREDS Simplified Severity Scale scores in an automated manner using bilateral color fundus photographs (Fig. S2). DeepSeeNet simulates the grading process of ophthalmologists by first detecting the presence or absence of AMD risk-associated features for each eye (large drusen and AMD pigmentary abnormalities) and then using these bilateral data to compute a patient-based score (0-5) using the algorithm described earlier.
DeepSeeNet consists of 3 constituent parts that contribute to its output: (a) a sub-network, Drusen-Net (D-Net), which detects drusen in 3 size categories (small/none, medium, and large); (b) a sub-network, Pigment-Net (P-Net), which detects the presence or absence of pigmentary abnormalities (hypopigmentation or hyperpigmentation); and (c) a sub-network, Late AMD-Net (LA-Net), which detects the presence or absence of late AMD (neovascular AMD or central GA).
D-Net, P-Net, and LA-Net were designed as deep convolutional neural networks (CNNs),[42] each with an Inception-v3 architecture, [43] which is a state-of-the-art CNN model for image classification. In total, there are 317 layers in the Inception-v3 model, comprising a total of million weights (learnable parameters) that were subject to training.
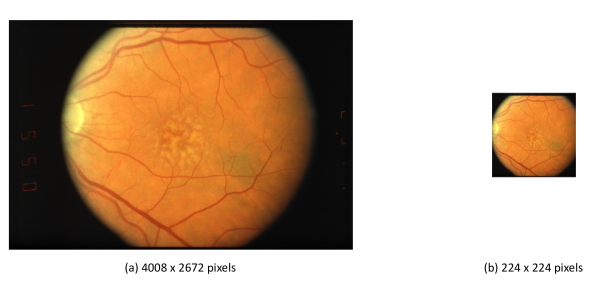
Before training, we followed the lead of Burlina et al[18, 35] to preprocess our image data as follows: the AREDS fundus photographs were cropped to generate a square image field encompassing the macula, followed by scaling the image to a resolution of pixels (Fig. S3). We trained our model in Keras with TensorFlow as the backend.[44, 45] During the training process, we updated the model parameters using the Adam optimizer (learning rate of 0.0001) for every minibatch of 32 images.[46] This reduces the variance of the parameter update, which leads to a more stable convergence. The training was stopped after 5 epochs (passes of the entire training set) once the accuracy values no longer increased or started to decrease. All experiments were conducted on a server with 32 Intel Xeon CPUs, using a NVIDIA GeForce GTX 1080 Ti 11Gb GPU for training and testing, with 512 Gb available in RAM memory.
Performance comparison between DeepSeeNet and retinal specialists
We compared the performance of the deep learning model with that of retinal specialists, using the Reading Center grades as the gold standard, in both cases. For the performance of the retinal specialists, we used the AREDS Simplified Severity Scale scores that had previously been recorded from the retinal specialists who originally served as the AREDS investigators. These scores were recorded at the AREDS baseline study visits, when the retinal specialists (n = 88) had independently assessed 450 AREDS participants as part of a qualification survey used to determine initial AMD severity for each eye. The clinical assessment involved the determination of the following features: drusen size (within 2 disc diameter of the macula center), presence of pigmentary abnormalities consistent with AMD (within 1 disc diameter), AMD subretinal neovascularization, previous laser photocoagulation for AMD subretinal neovascularization, central GA, retinal pigment epithelial detachment, and disciform scar. These clinical assessments were used to derive the same patient-based Simplified Severity Scale as defined in Fig. 1.
Overall accuracy, specificity, sensitivity, Cohen’s kappa,[47, 48] and receiver operating characteristic curve analysis were used to evaluate the performance of DeepSeeNet and retinal specialists (with reference to the Reading Center grades as the gold standard). Kappa values indicate no agreement, 0 to 0.20 indicate slight agreement, 0.21 to 0.40 indicate fair agreement, 0.41 to 0.60 indicate moderate agreement, 0.61 to 0.80 indicate substantial agreement, and 0.81 to 1 indicate almost perfect agreement.[49] We also followed the work of Poplin et al[50] to assess the statistical significance of the results. For the test dataset, we sampled 450 patients with replacement and evaluated the model on this sample. By repeating this sampling and evaluation 2,000 times, we obtained a distribution of the performance metric (e.g., kappa) and reported 95% confidence intervals.
Results
Predicting AREDS simplified severity scale
DeepSeeNet predicted AREDS Simplified Severity Scale scores for each participant in the testing dataset (n = 450). The performance of the deep learning models was measured against the Reading Center grades previously assigned to these 450 participants (as the reference or gold standard).
We investigated 3 strategies for training and optimizing DeepSeeNet (details located under “Training Strategies” in the in Appendix 1, Fig. S4, and Table S3) and found the fine-tuning strategy (all layers in a pretrained Inception-v3 model were fine-tuned using the AREDS dataset) achieved the best results, with accuracy = 0.671 and kappa = 0.558. As a result, we will discuss only Fine-tuned DeepSeeNet hereafter.
The performance of Fine-tuned DeepSeeNet was then compared with that of the retinal specialists (Table 3). The performance of DeepSeeNet (accuracy = 0.671; kappa = 0.558) was superior to that of the retinal specialists (accuracy = 0.599; kappa = 0.467).
| Fine-tuned DeepSeeNet | Retinal specialist | |
|---|---|---|
| (95% CI) | (95% CI) | |
| Overall accuracy | 0.671 (0.670-0.672) | 0.599 (0.598-0.600) |
| Sensitivity | 0.590 (0.589-0.591) | 0.512 (0.511-0.513) |
| Specificity | 0.930 (0.930-0.930) | 0.916 (0.916-0.916) |
| Kappa | 0.558 (0.557-0.560) | 0.467 (0.466-0.468) |
-
•
CI = confidence interval.
In addition, the performance of the individual sub-networks used in Fine-tuned DeepSeeNet (D-Net, P-Net, and LA-Net) was compared with that of retinal specialists (Table 4). Fig. 2 displays receiver operator characteristic curves for the individual sub-networks, with the average performance of the retinal specialists shown as single red points. The performance of D-Net and P-net was superior to the performance of the retinal specialists in assessing large drusen and pigmentary abnormalities, respectively. The accuracy of LA-Net was similar to that of the retinal specialists in assessing the presence of late AMD, but its kappa was lower.
| Drusen | Pigmentary Changes | Late AMD | ||||
|---|---|---|---|---|---|---|
| Retinal specialist | D-Net | Retinal specialist | P-Net | Retinal specialist | LA-Net | |
| Overall accuracy (95% CI) | 0.696 (0.695-0.697) | 0.742 (0.741-0.742) | 0.813 (0.813-0.814) | 0.890 (0.889-0.890) | 0.973 (0.973-0.973) | 0.967 (0.967-0.967) |
| Sensitivity (95% CI) | 0.635 (0.634-0.636) | 0.718 (0.717-0.719) | 0.615 (0.613-0.616) | 0.732 (0.731-0.733) | 0.801 (0.798-0.805) | 0.627 (0.626-0.632) |
| Specificity (95% CI) | 0.842 (0.842-0.843) | 0.871 (0.871-0.872) | 0.898 (0.898-0.899) | 0.957 (0.957-0.957) | 0.983 (0.983-0.984) | 0.987 (0.987-0.987) |
| Kappa (95% CI) | 0.517 (0.516-0.518) | 0.601 (0.600-0.602) | 0.535 (0.533-0.536) | 0.723 (0.722-0.724) | 0.754 (0.751-0.757) | 0.663 (0.660-0.665) |
-
•
AMD = age-related macular degeneration; CI = confidence interval; D-Net = Drusen-Net, which classifies drusen into 3 size categories (small/none, medium, and large); LA-Net = Late AMD-Net, which detects the presence or absence of late AMD (neovascular AMD or central geographic atrophy [GA]); P-Net = Pigment-Net, which detects the presence or absence of any pigmentary abnormality consistent with AMD (hypopigmentation or hyperpigmentation).
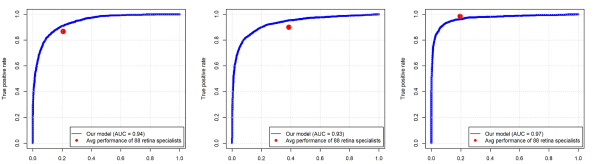
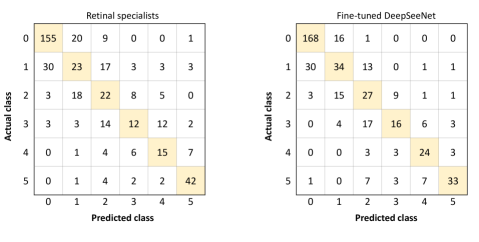
Fig. 3 shows confusion matrices comparing the performance of Fine-tuned DeepSeeNet and the retinal specialists in grading AMD severity (with accuracy comparisons detailed in Table S1). These matrices depict the true versus the predicted AREDS Simplified Severity Scale scores of the 450 participants at baseline. The numbers of predictions are summarized with count values broken down by each class, indicating the accuracy and errors made by DeepSeeNet or the retinal specialists. Fig. 3 shows that DeepSeeNet correctly classified scores 0 to 4 more often than the retinal specialists, whereas the retinal specialists correctly classified late AMD more often than DeepSeeNet.
Last, the performance of Fine-tuned DeepSeeNet on all images in the test set (accuracy = 0.662; kappa = 0.555) was compared with that on the images at study baseline only (Table S2 and Table S3). We observed that the accuracy on the study baseline was slightly better, though the kappas values were similar. Although the distribution of AMD severity (for the testing cases) was slightly less severe for the study baseline images, we do not consider this to have introduced bias because the test cases were the same for the model as for the retinal specialists.
Interpretation
Although Fine-tuned DeepSeeNet demonstrated relatively robust performance on classifying color fundus photographs according to AMD severity, the mechanics of this and other deep learning models are sometimes considered cryptic or lacking in transparency. Indeed, for this reason, deep learning models are often referred to as “black-box” entities. To improve transparency, in addition to creating models composed of sub-networks with overt purposes, we applied 2 additional techniques to aid interpretation of the results.
T-Distributed Stochastic Neighbor Embedding (t-SNE) Method
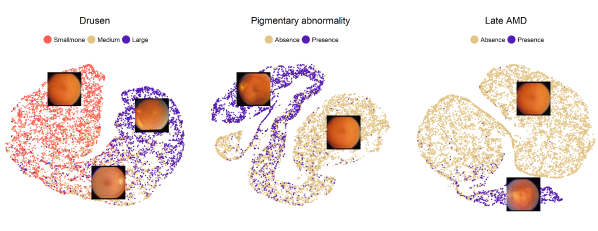
In this study, the internal features learned by Fine-tuned DeepSeeNet were studied using t-distributed Stochastic Neighbor Embedding (see Glossary in Table 5), which is well suited for the visualization of high-dimensional datasets.[51] We first obtained the 128-dimensional vector of DeepSeeNet’s last dense layer and applied the t-distributed Stochastic Neighbor Embedding technique to reduce the vector into 2 dimensions for visualization (Fig. 4). Fig. 4 demonstrates that, for drusen, small/none drusen and large drusen were split across the medium drusen point cloud. The figure contains some points that are clustered with the wrong class, many of which are medium drusen and difficult to identify. For pigmentary abnormality and late AMD, presence and absence classes were separated clearly.
Saliency Method
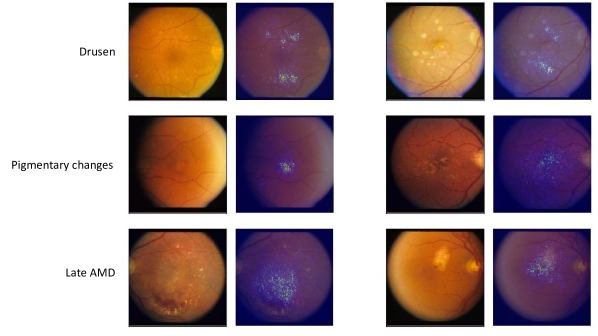
The second method used to aid interpretation of the results toward model transparency was the saliency method. To visualize important areas in the color fundus images (i.e., those areas that contributed most toward classification), we applied image-specific class saliency maps to assess manually whether DeepSeeNet was concentrating on image areas that human experts would consider the most appropriate to predict AMD severity.[51] The saliency map is widely used to represent the visually dominant location in a given image, corresponding to the category of interest, by back-projecting the relevant features through the CNN. It helps highlight areas used by the deep learning algorithm for prediction and can provide insight into misclassified images. For example, as seen in the “drusen” category of Fig. 5, the areas highlighted in the saliency maps are indeed areas with drusen that are visually apparent in the color fundus images. Likewise, in the “pigmentary changes” and “late AMD” categories in Fig. 5, the areas highlighted in the saliency maps are visually confirmed to correspond with the relevant features in the corresponding color fundus images. However, although saliency maps aid interpretation by highlighting the dominant areas, they are limited in that they do not completely explain how the algorithm came to its final decision.
Discussion
The accuracy of Fine-Tuned DeepSeeNet was superior to that of human retinal specialists (accuracy 67% vs. 60%), together with moderate agreement with the ground truth as indicated by the kappa score. If deep learning approaches were to support eye services in the future, comparisons of this kind (with demonstration of noninferiority to human clinicians) would be very important, together with extensive validation across multiple and diverse image datasets. Of note, although the overall accuracy of Fine-tuned DeepSeeNet was superior, subgroup analysis showed that Fine-tuned DeepSeeNet classified participants with Severity Scale scores 0 to 4 correctly more often than the retinal specialists, whereas the retinal specialists classified late AMD correctly more often than Fine-Tuned DeepSeeNet (Fig. 3). However, one important potential reason for the latter difference is that the number of images of late AMD that were available for model training was relatively low at 13.0% of the total training set (537 participants). We postulate that further training of Fine-tuned DeepSeeNet with larger numbers of late AMD images may improve its performance in this area.
Error analysis on misclassified images in the AREDS testing dataset
We considered that useful lessons might be learned by careful examination of those instances where Fine-tuned DeepSeeNet made errors in the Severity Scale classification, particularly (as described earlier) in the case of late AMD (where its accuracy was lower than that of the retinal specialists). The matrices shown in Fig. 3 demonstrate that, for actual Severity Scale scores of 0 to 4, in the large majority of cases, the score predicted by Fine-tuned DeepSeeNet was incorrect by 1 scale step only. We also examined those cases in which Fine-tuned DeepSeeNet incorrectly classified a participant as having late AMD (score 5) and found that, in 50% of these cases, noncentral GA was present in at least 1 eye. For the purposes of this study, noncentral GA was not defined as late AMD, although recent studies have expanded the definition of late AMD to include noncentral GA.[7] The misclassification of these images by our deep learning model suggests an inherent similarity between these groups of images.
Image quality also affected the accuracy of the deep learning model. Of the participants classified incorrectly by Fine-tuned DeepSeeNet as having late AMD, 25.0% had digital artifacts obscuring the fovea. In addition, image brightness affected the model accuracy. Participants with a pale retina or digital artifacts were more likely to be misclassified as having GA. In the future, we aim to address these problems by identifying color fundus photographs with inferior quality, either for exclusion or for additional processing.
Strengths, limitations, and future work
One current limitation of DeepSeeNet (at least in its present iteration) arises from the imbalance of cases that were available in the AREDS dataset used for its training, particularly the relatively low proportion of participants with late AMD. As described previously, this is likely to have contributed to the relatively lower accuracy of DeepSeeNet in the classification of late AMD, that is, through the performance of LA-Net in the overall model. However, this limitation may potentially be addressed by further training using image datasets with a higher proportion of late AMD cases.
A limitation of this dataset includes the sole use of color fundus photographs because these were the only images obtained in a study that began in 1992. Other imaging techniques such as OCT and fundus autofluorescence images were not yet feasible or universally available. Future studies would benefit from inclusion of additional methods of imaging. Multimodal imaging would be desirable.
Another potential limitation lies in the reliance of DeepSeeNet on higher levels of image quality for accurate classification. Unlike in other studies,[16, 19] we did not perform extensive preprocessing of images, such as the detection of the outer boundaries of the retina or normalization of the color balance and local illumination. It is possible that the use of these techniques might have improved the accuracy of the model. However, we deliberately avoided extensive preprocessing to make our model as generalizable as possible.
We recommend further testing of our deep learning model using other datasets of color fundus images. In addition, it would be interesting for future studies to compare the accuracy of the model with that of different groups of ophthalmologists (e.g., retinal specialists, general ophthalmologists, and trainee ophthalmologists). Indeed, a recent study on grader variability for diabetic retinopathy severity using color fundus photographs suggested that retinal specialists have a higher accuracy than that of general ophthalmologists.[52] In this study, we set the bar as high as possible for the deep learning model, because we considered that the retinal specialists might have accuracy as close as possible to that of the Reading Center gradings.
In conclusion, this study shows that DeepSeeNet performed patient-based AMD severity classification with a level of accuracy higher than a group of human retinal specialists. If these results are tested and validated by further reports of superiority across multiple datasets (ideally from different countries), it is possible that the integration of deep learning models into clinical practice might become increasingly acceptable to patients and ophthalmologists. In the future, deep learning models might support eye services by reducing the time and human expertise needed to classify retinal images and might lend themselves well (through telemedicine approaches) to improving care in geographical areas where current services are absent or limited. Although deep learning models are often considered “black-box” entities (because of difficulties in understanding how algorithms make their predictions), we aimed to improve the transparency of DeepSeeNet by constructing it from sub-networks with clear purposes (e.g., drusen detection) and analyzing its outputs with saliency maps. These efforts to demystify deep learning models may help improve levels of acceptability to patients and adoption by ophthalmologists. We have also analyzed the performance of several distinct training strategies; lessons from these approaches may have applicability to the development of deep learning models for other retinal diseases, such as diabetic retinopathy, and even for image-based deep learning systems outside of ophthalmology.
Our new model uses deep learning in combination with a clinically useful, patient-based, AMD classification system that combines risk factors from both eyes to obtain a score for the patient. The deep learning model and data partition are publicly available (https://github.com/ncbi-nlp/DeepSeeNet). By making these available, we aim to maximize the transparency and reproducibility of this study, and to provide a benchmark method for the further refinement and development of methodologies. In addition, this deep learning model, trained on one of the largest publicly available color fundus photograph repositories, may allow for future deep learning studies of other retinal diseases in which only smaller datasets are currently available.
In the future, we aim to improve the model by incorporating other information such as demographic, medical, and genetic data, potentially together with imaging data from other modalities. We also plan to evaluate our model on a new dataset from the second AREDS (AREDS2) sponsored by the National Eye Institute. In addition, we hope to investigate the combination of OCT-based and color fundus photographs-based deep learning models once each has been more highly validated individually. Taken together, we expect this study will contribute to the advancement and understanding of retinal disease and may ultimately enhance clinical decision-making.
Glossary
| Term | Description |
| Adam optimizer | Adam is an optimization algorithm to update network weights. Different from classic optimization that maintains a single learning rate for all weight updates, with the learning rate not changing during training, it computes adaptive learning rates for different parameters during the training.[46]. |
| Back-propagation | A method used in artificial neural networks to calculate a gradient that is needed in the calculation of the weights to be used in the network [53]. |
| Convolutional neural network | A class of artificial neural network algorithms utilized in deep learning largely for image classification. |
| Deep learning | A subfield of machine learning in which explicit features are determined from the training data and do not require pre-specification by human domain experts. |
| Epoch | A single pass through the entire training set. |
| Fine-tune | A process to take a neural network model that has already been trained for a given task, and make it perform a second task. |
| Fully-connected layer | A linear operation in which every output neuron has connections to all activations in the previous layer. |
| Hidden layer | The middle layer of a neural network. |
| ImageNet | An image database comprised of million natural images and their corresponding labels. Due to the large number of labeled images, this dataset is often employed in deep learning techniques to pre-train models. In a process known as “transfer learning”, the first layers are trained with ImageNet to extract more primitive features from the images (e.g., edge detection). |
| Inception-v3 | A convolutional neural network with the inception architecture for computer vision [43]. |
| Layer | A container that usually receives weighted input, transforms it with a set of mostly non-linear functions, and then passes these values as output to the next layer. |
| Leaning rate | A hyper-parameter that controls how much the weights of deep neural network are adjusted with respect the loss gradient. |
| Multiclass classification | A classification task with more than two classes. |
| Multilayer perceptron | A class of feedforward artificial neural network that consists of at least one hidden layer. |
| Over-fitting | The production of an analysis that corresponds too closely or exactly to a particular set of data and may therefore fail to fit additional data or predict future observations reliably. |
| Saliency map | The saliency map is computed for an input image and a given output class. It tells us which pixels in the image contribute most to the model’s classification of that class. Specifically, we first computed the gradient of a given label with respect to the input image. The gradient, by definition, points in the direction of the greatest rate of class changes with respect to a small change in the input images. That small region of changes in the input image, thereby, contributes most and is highlighted in the saliency map. |
| Stochastic gradient descent | An iterative method for optimizing the objective function in machine learning. |
| Test set | A mutually exclusive set of images not utilized in the training set. These images are used for testing deep learning models to evaluate their performance levels. |
| Training | A data-driven approach requiring tens of thousands of labeled images in the training set. |
| Training set | The set of images used for training a deep learning model. The network then predicts the category of each image and compares it with known “ground truth” labels. The parameters in the network are then optimized to improve the model’s predictive ability, in a process known as “back-propagation”. |
| Transfer learning | The process of training a deep learning model on a large set of data, such that the model’s weights are optimized as learned features. These weights are then “transferred” to a new neural network to allow for more efficient training of the model on a new training set (often smaller in size). |
| t-distributed Stochastic Neighbor Embedding | A technique used to visualize and explore complex datasets (particularly those with high-dimensional features) in a low-dimensional space. In our case, we used it to create a 2-dimensional map by assigning a location to each datapoint (each retinal image). The locations are decided by probability distributions, such that datapoints that are similar across high-dimensional features end up close to each other, and datapoints that are dissimilar end up far apart. As a result, t-SNE plots often seem to display clusters (e.g., the cluster for large drusen, in this case), where the datapoints in the cluster all have relatively similar features. Therefore, it can be used to help the classification process and in the visual inspection and exploration of results from deep learning experiments.[54]. |
| Weights | Learnable parameters of the deep learning model. |
References
- [1] Quartilho A, Simkiss P, Zekite A, Xing W, Wormald R, Bunce C. Leading causes of certifiable visual loss in England and Wales during the year ending 31 March 2013. Eye (Lond). 2016;30(4):602–7.
- [2] Congdon N, O’Colmain B, Klaver CC, Klein R, Munoz B, Friedman DS, et al. Causes and prevalence of visual impairment among adults in the United States. Arch Ophthalmol. 2004;122(4):477–85.
- [3] Wong WL, Su X, Li X, Cheung CM, Klein R, Cheng CY, et al. Global prevalence of age-related macular degeneration and disease burden projection for 2020 and 2040: a systematic review and meta-analysis. Lancet Glob Health. 2014;2(2):e106–16.
- [4] Rudnicka AR, Jarrar Z, Wormald R, Cook DG, Fletcher A, Owen CG. Age and gender variations in age-related macular degeneration prevalence in populations of European ancestry: a meta-analysis. Ophthalmology. 2012;119(3):571–80.
- [5] Fritsche LG, Fariss RN, Stambolian D, Abecasis GR, Curcio CA, Swaroop A. Age-related macular degeneration: genetics and biology coming together. Annu Rev Genomics Hum Genet. 2014;15:151–71.
- [6] Ratnapriya R, Chew EY. Age-related macular degeneration-clinical review and genetics update. Clin Genet. 2013;84(2):160–6.
- [7] Ferris FL, Wilkinson CP, Bird A, Chakravarthy U, Chew E, Csaky K, et al. Clinical classification of age-related macular degeneration. Ophthalmology. 2013;120(4):844–51.
- [8] Group AREDSR. A simplified severity scale for age-related macular degeneration: AREDS Report No. 18. Arch Ophthalmol. 2005;123(11):1570–4.
- [9] Ching T, Himmelstein DS, Beaulieu-Jones BK, Kalinin AA, Do BT, Way GP, et al. Opportunities and obstacles for deep learning in biology and medicine. Journal of The Royal Society Interface. 2018;15(141).
- [10] Wang X, Peng Y, Lu L, Lu Z, Bagheri M, Summers RM. Chestx-ray8: Hospital-scale chest x-ray database and benchmarks on weakly-supervised classification and localization of common thorax diseases. In: 2017 IEEE Conference on Computer Vision and Pattern Recognition (CVPR). IEEE; 2017. p. 3462–3471.
- [11] Wang X, Peng Y, Lu L, Lu Z, Summers RM. TieNet: Text-Image Embedding Network for Common Thorax Disease Classification and Reporting in Chest X-rays. In: IEEE Conference on Computer Vision and Pattern Recognition (CVPR); 2018. p. 9049–9058.
- [12] Banerjee I, Madhavan S, Goldman RE, Rubin DL. Intelligent Word Embeddings of Free-Text Radiology Reports. AMIA Annual Symposium proceedings AMIA Symposium. 2017;2017:411–420.
- [13] Esteva A, Kuprel B, Novoa RA, Ko J, Swetter SM, Blau HM, et al. Dermatologist-level classification of skin cancer with deep neural networks. Nature. 2017;542(7639):115–118.
- [14] Ehteshami Bejnordi B, Veta M, Johannes van Diest P, van Ginneken B, Karssemeijer N, Litjens G, et al. Diagnostic Assessment of Deep Learning Algorithms for Detection of Lymph Node Metastases in Women With Breast Cancer. JAMA. 2017;318(22):2199–2210.
- [15] Lehman CD, Wellman RD, Buist DS, Kerlikowske K, Tosteson AN, Miglioretti DL, et al. Diagnostic Accuracy of Digital Screening Mammography With and Without Computer-Aided Detection. JAMA Intern Med. 2015;175(11):1828–37.
- [16] Grassmann F, Mengelkamp J, Brandl C, Harsch S, Zimmermann ME, Linkohr B, et al. A Deep Learning Algorithm for Prediction of Age-Related Eye Disease Study Severity Scale for Age-Related Macular Degeneration from Color Fundus Photography. Ophthalmology. 2018;125(9):1410–1420.
- [17] Kermany DS, Goldbaum M, Cai W, Valentim CCS, Liang H, Baxter SL, et al. Identifying Medical Diagnoses and Treatable Diseases by Image-Based Deep Learning. Cell. 2018;172(5):1122–1131 e9.
- [18] Burlina P, Freund DE, Joshi N, Wolfson Y, Bressler NM. Detection of age-related macular degeneration via deep learning. In: Biomedical Imaging (ISBI), 2016 IEEE 13th International Symposium on. IEEE; 2016. p. 184–188.
- [19] Burlina PM, Joshi N, Pekala M, Pacheco KD, Freund DE, Bressler NM. Automated Grading of Age-Related Macular Degeneration From Color Fundus Images Using Deep Convolutional Neural Networks. JAMA Ophthalmol. 2017;135(11):1170–1176.
- [20] Lam C, Yu C, Huang L, Rubin D. Retinal Lesion Detection With Deep Learning Using Image Patches. Invest Ophthalmol Vis Sci. 2018;59(1):590–596.
- [21] Lee CS, Baughman DM, Lee AY. Deep Learning Is Effective for Classifying Normal versus Age-Related Macular Degeneration OCT Images. Ophthalmology Retina. 2017;1(4):322–327.
- [22] Choi JY, Yoo TK, Seo JG, Kwak J, Um TT, Rim TH. Multi-categorical deep learning neural network to classify retinal images: A pilot study employing small database. PLoS One. 2017;12(11):e0187336.
- [23] Gargeya R, Leng T. Automated Identification of Diabetic Retinopathy Using Deep Learning. Ophthalmology. 2017;124(7):962–969.
- [24] Gulshan V, Peng L, Coram M, Stumpe MC, Wu D, Narayanaswamy A, et al. Development and Validation of a Deep Learning Algorithm for Detection of Diabetic Retinopathy in Retinal Fundus Photographs. JAMA. 2016;316(22):2402–2410.
- [25] Raju M, Pagidimarri V, Barreto R, Kadam A, Kasivajjala V, Aswath A. Development of a Deep Learning Algorithm for Automatic Diagnosis of Diabetic Retinopathy. Stud Health Technol Inform. 2017;245:559–563.
- [26] Takahashi H, Tampo H, Arai Y, Inoue Y, Kawashima H. Applying artificial intelligence to disease staging: Deep learning for improved staging of diabetic retinopathy. PLoS One. 2017;12(6):e0179790.
- [27] Ting DSW, Cheung CY, Lim G, Tan GSW, Quang ND, Gan A, et al. Development and Validation of a Deep Learning System for Diabetic Retinopathy and Related Eye Diseases Using Retinal Images From Multiethnic Populations With Diabetes. JAMA. 2017;318(22):2211–2223.
- [28] Asaoka R, Murata H, Iwase A, Araie M. Detecting Preperimetric Glaucoma with Standard Automated Perimetry Using a Deep Learning Classifier. Ophthalmology. 2016;123(9):1974–80.
- [29] Cerentini A, Welfer D, Cordeiro d’Ornellas M, Pereira Haygert CJ, Dotto GN. Automatic Identification of Glaucoma Using Deep Learning Methods. Stud Health Technol Inform. 2017;245:318–321.
- [30] Muhammad H, Fuchs TJ, De Cuir N, De Moraes CG, Blumberg DM, Liebmann JM, et al. Hybrid Deep Learning on Single Wide-field Optical Coherence tomography Scans Accurately Classifies Glaucoma Suspects. J Glaucoma. 2017;26(12):1086–1094.
- [31] Brown JM, Campbell JP, Beers A, Chang K, Ostmo S, Chan RVP, et al. Automated Diagnosis of Plus Disease in Retinopathy of Prematurity Using Deep Convolutional Neural Networks. JAMA ophthalmology. 2018 Jul;136:803–810.
- [32] Matsuba S, Tabuchi H, Ohsugi H, Enno H, Ishitobi N, Masumoto H, et al. Accuracy of ultra-wide-field fundus ophthalmoscopy-assisted deep learning, a machine-learning technology, for detecting age-related macular degeneration. International ophthalmology. 2018 May;p. 1–7.
- [33] Treder M, Lauermann JL, Eter N. Automated detection of exudative age-related macular degeneration in spectral domain optical coherence tomography using deep learning. Graefe’s archive for clinical and experimental ophthalmology = Albrecht von Graefes Archiv fur klinische und experimentelle Ophthalmologie. 2018 Feb;256:259–265.
- [34] Burlina PM, Joshi N, Pacheco KD, Freund DE, Kong J, Bressler NM. Use of Deep Learning for Detailed Severity Characterization and Estimation of 5-Year Risk Among Patients With Age-Related Macular Degeneration. JAMA Ophthalmology. 2018;p. 1–8.
- [35] Burlina P, Pacheco KD, Joshi N, Freund DE, Bressler NM. Comparing humans and deep learning performance for grading AMD: A study in using universal deep features and transfer learning for automated AMD analysis. Comput Biol Med. 2017;82:80–86.
- [36] Karri SP, Chakraborty D, Chatterjee J. Transfer learning based classification of optical coherence tomography images with diabetic macular edema and dry age-related macular degeneration. Biomed Opt Express. 2017;8(2):579–592.
- [37] De Fauw J, Ledsam JR, Romera-Paredes B, Nikolov S, Tomasev N, Blackwell S, et al. Clinically applicable deep learning for diagnosis and referral in retinal disease. Nat Med. 2018;24(9):1342–1350.
- [38] Srinivasan PP, Kim LA, Mettu PS, Cousins SW, Comer GM, Izatt JA, et al. Fully automated detection of diabetic macular edema and dry age-related macular degeneration from optical coherence tomography images. Biomed Opt Express. 2014;5(10):3568–77.
- [39] Farsiu S, Chiu SJ, O’Connell RV, Folgar FA, Yuan E, Izatt JA, et al. Quantitative classification of eyes with and without intermediate age-related macular degeneration using optical coherence tomography. Ophthalmology. 2014;121(1):162–172.
- [40] Marmor MF, Ravin JG. Fluorescein angiography: insight and serendipity a half century ago. Arch Ophthalmol. 2011;129(7):943–8.
- [41] Group AREDSR. The Age-Related Eye Disease Study system for classifying age-related macular degeneration from stereoscopic color fundus photographs: the Age-Related Eye Disease Study Report Number 6. Am J Ophthalmol. 2001;132(5):668–81.
- [42] LeCun Y. Generalization and network design strategies. Connectionism in perspective. 1989;p. 143–155.
- [43] Szegedy C, Vanhoucke V, Ioffe S, Shlens J, Wojna Z. Rethinking the inception architecture for computer vision. In: Proceedings of the IEEE Conference on Computer Vision and Pattern Recognition; 2016. p. 2818–2826.
- [44] Abadi M, Agarwal A, Barham P, Brevdo E, Chen Z, Citro C, et al.. TensorFlow: Large-Scale Machine Learning on Heterogeneous Systems; 2015. Available from: https://www.tensorflow.org/.
- [45] Chollet F, et al.. Keras; 2015. Available from: https://keras.io.
- [46] Kingma DP, Ba J. Adam: A method for stochastic optimization. In: International Conference on Learning Representations (ICLR); 2015. p. 1–15.
- [47] Cohen J. Multiple regression as a general data-analytic system. Psychological Bulletin. 1968;70(6, Pt.1):426–443.
- [48] Cohen J. A Coefficient of Agreement for Nominal Scales. Educational and Psychological Measurement. 2016;20(1):37–46.
- [49] Landis JR, Koch GG. The measurement of observer agreement for categorical data. Biometrics. 1977;33(1):159–74.
- [50] Poplin R, Varadarajan AV, Blumer K, Liu Y, McConnell MV, Corrado GS, et al. Prediction of cardiovascular risk factors from retinal fundus photographs via deep learning. Nature Biomedical Engineering. 2018;2(3):158–164.
- [51] Simonyan K, Vedaldi A, Zisserman A. Deep inside convolutional networks: Visualising image classification models and saliency maps; 2013. ArXiv preprint arXiv:1312.6034.
- [52] Krause J, Gulshan V, Rahimy E, Karth P, Widner K, Corrado GS, et al. Grader variability and the importance of reference standards for evaluating machine learning models for diabetic retinopathy. Ophthalmology. 2018;125(8):1264–1272.
- [53] Goodfellow I, Bengio Y, Courville A. Deep Learning. MIT Press; 2016.
- [54] Maaten L, Hinton G. Visualizing data using t-SNE. Journal of machine learning research. 2008;9(Nov):2579–2605.
- [55] Deng J, Dong W, Socher R, Li LJ, Li K, Fei-Fei L. ImageNet: a large-scale hierarchical image database. In: IEEE Conference on Computer Vision and Pattern Recognition (CVPR). IEEE; 2009. p. 248–255.
- [56] Yosinski J, Clune J, Nguyen A, Fuchs T, Lipson H. Understanding Neural Networks Through Deep Visualization; 2015. ArXiv preprint arXiv:1506.06579.
- [57] Yosinski J, Clune J, Bengio Y, Lipson H. How transferable are features in deep neural networks? In: NIPS’14 Proceedings of the 27th International Conference on Neural Information Processing Systems; 2014. p. 3320–3328.
Appendix 1
Training strategies
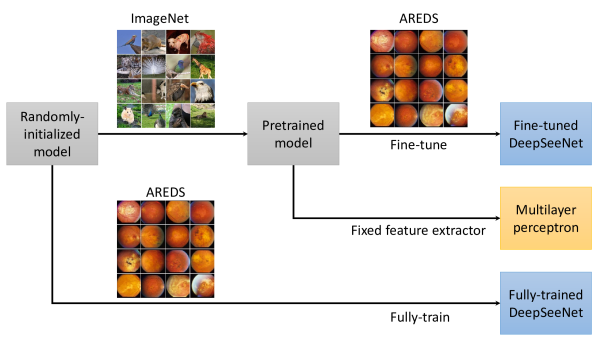
Three training strategies were investigated for model training (Figure S4). (1) We created a ‘Multi-layer perceptron’ (‘MLP’) model by taking an pre-trained Inception-v3 model on ImageNet [55] (an image database of million natural images with corresponding labels; see Glossary), then training it on the AREDS dataset as a multi-layer perceptron model (with two densely-connected layers of 256 and 128 units, respectively). In this model, the AREDS images were used to train only the last two layers of the entire model. (2) We created the ‘Fine-tuned DeepSeeNet’ model by taking an pre-trained Inception-v3 model on ImageNet (i.e., same process and same weights as for the MLP model), then training it on the AREDS images. However, for this model, the training process on the AREDS images was used to fine-tune all layers (not just the last two layers). Hence, ultimately, the entire model is trained using the AREDS dataset. (3) Lastly, we created the ‘Fully-trained DeepSeeNet’ model. In this case, we proceeded directly from an Inception-v3 model (with randomly-initialized weights) to training (all layers) using the AREDS images. Hence, in this model, the ImageNet dataset was not utilized for pre-training. More information on the training methodologies can be found in the Supplementary material. The three training strategies were assessed in turn on the testing dataset: Fine-tuned DeepSeeNet, Fully-trained DeepSeeNet, and MLP. The performance of the three training models is shown in Table S3. Of the three, the model with the best performance was Fine-tuned DeepSeeNet (i.e., where the model was pre-trained using ImageNet, and all layers were fine-tuned using the AREDS training dataset), with accuracy=0.671 and kappa=0.558.
First, Fine-tuned DeepSeeNet performed more accurately than Fully-trained DeepSeeNet. Fully-trained DeepSeeNet was trained using the same AREDS images, but (unlike Fine-tuned DeepSeeNet) was not pre-trained using the ImageNet images. Hence, Fine-Tuned DeepSeeNet had the advantage of pre-initialized weights. The superior accuracy of this training approach suggests that, although it is possible to train a deep learning model from scratch by using a large new dataset, it is still beneficial in practice to initialize with weights from a pre-trained model (particularly when we consider that there are over 14 million images in ImageNet, compared to 60,000 in the AREDS training set). One possible reason for the inferior accuracy of the model fully trained using the AREDS images is over-fitting, i.e., the model starts to memorize rather than learn to generalize from the training data. A negative consequence is, therefore, that the model has poor performance on the validation dataset [56, 57].
Fine-tuned DeepSeeNet also performed more accurately than the MLP deep learning model. Both deep learning models were pre-trained using the ImageNet images and then trained using the AREDS fundus images. However, the training of Fine-tuned DeepSeeNet was designed specifically to tackle AMD classification: during training using the AREDS images, the weights of all its layers were permitted to change. By contrast, the MLP model underwent training using the same AREDS images, but only as a fixed feature extractor, i.e., the weights of all but two of its layers were not permitted to change. For Fine-tuned DeepSeeNet, we permitted all layers to be retrained using the AREDS dataset, as we considered that the AREDS dataset of images was sufficiently large, with features different from the ImageNet images, to justify optimization of all layers.
| Class | Instance | Retinal specialist | Fine-tuned DeepSeeNet | |
| 0 | 185 | 83.8% | 90.8% | 7.0 |
| 1 | 79 | 29.1% | 43.0% | 13.9 |
| 2 | 56 | 39.3% | 48.2% | 8.9 |
| 3 | 46 | 26.1% | 34.8% | 8.7 |
| 4 | 33 | 45.5% | 72.7% | 27.2 |
| 5 | 51 | 82.4% | 64.7% | -17.7 |
| Study baseline | Overall | ||
|---|---|---|---|
| (95% CI) | (95% CI) | ||
| Overall accuracy | 0.671 (0.670-0.672) | 0.662 (0.662-0.623) | |
| Sensitivity | 0.590 (0.589-0.591) | 0.592 (0.591-0.593) | |
| Specificity | 0.930 (0.930-0.930) | 0.928 (0.928-0.928) | |
| Kappa | 0.558 (0.557-0.560) | 0.555 (0.554-0.557) |
-
•
CI = confidence interval.
| MLP | Fine-tuned DeepSeeNet | Fully-trained DeepSeeNet | |||
|---|---|---|---|---|---|
| (95% CI) | (95% CI) | (95% CI) | |||
| Overall accuracy | 0.436 (0.435-0.437) | 0.671 (0.670-0.672) | 0.624 (0.623-0.625) | ||
| Sensitivity | 0.236 (0.235-0.236) | 0.590 (0.589-0.591) | 0.494 (0.493-0.495) | ||
| Specificity | 0.862 (0.862-0.862) | 0.930 (0.930-0.930) | 0.919 (0.918-0.919) | ||
| Kappa | 0.163 (0.162-0.164) | 0.558 (0.557-0.560) | 0.487 (0.486-0.488) |
MLP = multilayer perceptron; CI = confidence interval.