Discovery of Dying Active Galactic Nucleus in Arp 187: Experience of Drastic Luminosity Decline within years
Abstract
Arp 187 is one of the fading active galactic nuclei (AGN), whose AGN activity is currently decreasing in luminosity. We investigate the observational signatures of AGN in Arp 187, which trace various physical scales from less than 0.1 pc to the nearly 10 kpc, to estimate the longterm luminosity change over years. The VLA 5 GHz, 8 GHz, and the ALMA 133 GHz images reveal bimodal jet lobes with 5 kpc size and the absence of the central radio-core. The 6dF optical spectrum shows that Arp 187 hosts narrow line region with the estimated size of 1 kpc, and the line strengths give the AGN luminosity of erg s-1. On the other hand, the current AGN activity estimated from the AGN torus emission gives the upper bound of erg s-1. The absence of the radio-core gives the more strict upper bound of the current AGN luminosity of erg s-1, suggesting that the central engine is already quenched. These multi-wavelength signatures indicate that Arp 187 hosts a “dying” AGN: the central engine is already dead, but the large scale AGN indicators are still observable as the remnant of the past AGN activity. The central engine has experienced the drastic luminosity decline by a factor of fainter within years, which is roughly consistent with the viscous timescale of the inner part of the accretion disk within 500 years.
1 Introduction
One of the key questions in modern Astronomy is how supermassive black holes (SMBHs) and their host galaxies co-evolve, leading to the tight correlation between the masses of SMBHs and their bulges in the present universe (e.g., Kormendy & Ho, 2013). Active galactic nuclei (AGN) are the best laboratories to understand this co-evolution process, since they are in the stage of the mass accretion onto SMBHs until the SMBHs reach their achievable maximum mass limit of (Netzer, 2003; McLure & Dunlop, 2004; McConnell et al., 2011; Kormendy & Ho, 2013; Trakhtenbrot, 2014; Jun et al., 2015; Wu et al., 2015; Inayoshi & Haiman, 2016; Ichikawa & Inayoshi, 2017).
One of the biggest unknown for this accretion process is how long such AGN phase can last. Several authors indicate that the total AGN phase has a duration of years (Marconi et al., 2004), and that one cycle of AGN should be at least over years suggested from the observations (Schawinski et al., 2015) and simulations (e.g., Novak et al., 2011). This is also consistent with the results that there are various AGN indicators with different physical scales, and each AGN indicator has a tight luminosity correlations each other: AGN nucleus (X-ray) and the 10 pc scale AGN dusty torus (mid-infrared, hereafter MIR; Gandhi et al., 2009; Ichikawa et al., 2012; Asmus et al., 2015; Mateos et al., 2015; Ichikawa et al., 2017) and 1 kpc scale ionized gas region (so-called narrow line region or NLR; e.g., Netzer et al., 2006; Panessa et al., 2006; Ueda et al., 2015; Berney et al., 2015). This long lifetime of AGN, however, implies a difficulty for us to observe the scene where AGN is now being quenched, or “dying”, which gives us the information how rapid the physics of accretion disk in AGN is changing within the certain amount of time.
Recent observations, however, have discovered a key population of AGN to resolve the issue above. While they show the AGN signatures at large physical scale with kpc (e.g., NLR and/or radio jets), they lack the signatures at small physical scale with pc (e.g., X-ray emission, the dust torus emission, and/or the radio core emission) or their luminosities are very faint even if they exist. They are thought to be in the transient stage where their central engine has been already fading, but the large scale AGN indicators are still active because of the long light crossing time (e.g., years). They are called fading AGN and such sources have been reported (Schawinski et al., 2010; Schirmer et al., 2013, 2016; Schweizer et al., 2013; Ichikawa et al., 2016; Keel et al., 2017; Kawamuro et al., 2017; Villar-Martín et al., 2018; Wylezalek et al., 2018; Sartori et al., 2018b).
Among them, Arp 187 located at ( = 178 Mpc, 1″= 798 pc) is one of the most promising “dying” AGN candidate, which is the final phase of fading AGN whose current central engine is already quenched, but the large scale AGN indicators are still alive because of the photon time delay. Ichikawa et al. (2016) used a jet lobe size discovered by the Atacama Large Millimeter/submillimeter Array (ALMA) cycle-0 observation (Ueda et al., 2014) for estimating the upper limit of the quenching time of the fading AGN. Assuming a jet angle to the line of sight of 90∘ and a typical expansion, the kinematic age of the radio jets is estimated to be year. Ichikawa et al. (2016) also revealed that AGN nucleus activity is already quenched with the bolometric luminosity of erg s-1. However, Ichikawa et al. (2016) could not estimate the past AGN luminosity, therefore we could not evaluate how rapid this AGN has experienced the luminosity decline.
In this paper, we report the more multi-wavelength support that Arp 187 hosts a bona fide dying AGN, and the central engine has experienced drastic luminosity decline over times within years, using the multiple-wavelength data including the newly obtained radio data with ALMA, the Karl G. Jansky Very Large Array (VLA), Spitzer, and Neowise as well as the updated analysis method to the archival 6dF optical spectrum which has not been explored in our previous paper of Ichikawa et al. (2016). Throughout the paper, we adopt km s-1 Mpc-1, , and .
2 Analysis and Results
2.1 Radio Continuum Emission: Existence of Radio Jet-Lobe
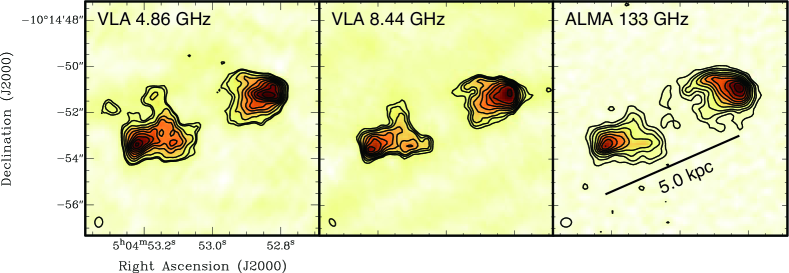
The Band 4 continuum observation of Arp 187 was carried out using the ALMA 12-m array on 2016 July 25 (Cycle 3; ID = 2015.1.01005.S). We used four SPectral Windows (SPWs) with Time Domain Mode. The center frequency of the four SPWs is 133 GHz, and the total bandwidth is 8 GHz. The number of 12-m antennas was 36. The baseline lengths range from 15 m to 1124 m. Data calibration and imaging were carried out using the Common Astronomy Software Applications package (CASA, ver. 4.5.3). We used the delivered calibrated data and made the continuum map by clipping the visibility ( distance k). The synthesized beam size is (position angle ) by adopting Briggs weighting of the visibility , and the rms noise level is 0.013 mJy beam-1. We regard the accuracy of the absolute flux calibration as 5% throughout this paper according to the ALMA Cycle 3 Technical Handbook111A. Remijan et al., 2015, ALMA Cycle 3 Technical Handbook Version 1.0, ALMA.
In addition, we used archival calibrated data obtained with VLA C- and X-bands, and made the continuum maps using CASA. We clipped the visibilities before imaging so that all the VLA and ALMA data have the same shortest UV range. The synthesized beam size of the 4.86 GHz map is by adopting uniform weighting of the visibility, and the rms noise level is 0.28 mJy beam-1. The synthesized beam size of the 8.44 GHz map is by adopting Briggs weighting of the visibility and the rms noise level is 0.20 mJy beam-1.
The radio continuum maps are shown in Figure 1. They clearly show the structure of the jet lobes, which are located at both sides of the nucleus. The projected distance between the lobe cores is kpc. We estimate the kinematic age of the lobes, assuming the jet angle to the line of sight of and a typical expansion speed of radio lobes (; e.g., Murgia et al., 1999; Nagai et al., 2006). This gives the kinematic age of years.
We also confirm no additional radio lobes in the field of view (FoV) of the VLA and ALMA observations. The FoV of the VLA observation at 4.86 GHz is 9.3 arcmin, which is the largest among the three observations. This corresponds to the physical size of 221 kpc in radius. If there are radio lobes outside of the FoV, the lower limit of their kinematic age is years. Thus Arp 187 has not launched the jet over years before the current 5 kpc size one, or the larger radio lobes, if any, already become undetectable due to rapid energy loss (e.g., Godfrey et al., 2017).
| Eastern lobe | Western lobe | |||
|---|---|---|---|---|
| Frequency | Peak | Total | Peak | Total |
| 4.86 GHz | 12.0 | 190 | 13.2 | 160 |
| 8.44 GHz | 7.53 | 92 | 9.54 | 100 |
| 133 GHz | 0.662 | 5.3 | 0.704 | 7.2 |
Note. — The unit of the flux density is mJy. These values are measured in the beam-matched images ( = 047).
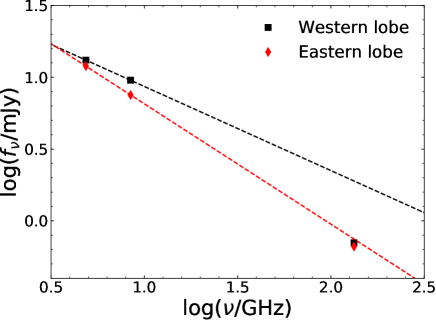
We also convolved these maps to angular resolution to make Spectral Energy Distributions (SEDs) of the jet lobes. The peak and total flux densities of the eastern and western robes are summarized in Table 1. Each peak flux density is measured at the emission peak at 4.86 GHz, using the beam-matched maps. The radio SEDs of the lobes are shown in Figure 2. The spectral index was estimated from two points at 4.86 GHz and 8.44 GHz by using a fitting function of . The SED shows a steep spectral index of for the eastern lobe (the red dashed line), and the flux point at 133 GHz is nearly on the extrapolated line from the VLA bands. This is consistent with optically thin synchrotron radiation that is expected for the jet emission. On the other hand, the flux density of the western lobes at 113 GHz is smaller than what is expected from the flux densities at 4.86 GHz and 8.44 GHz, assuming that the SED can be fitted by (the black dashed line). This suggests the spectral aging for the western jet (e.g., Jamrozy et al., 2008; Saikia & Jamrozy, 2009), while the exact age cannot be determined based on the current SED sampling.
There is no clear emission in the nucleus (jet core) at 4.86 GHz and 8.44 GHz, although the faint emission is seen at 133 GHz. This is not due to the dynamical range limit of VLA. The 3 upper limits of the flux densities measured in the non beam-matched images are 0.84 mJy at 4.86 GHz and 0.60 mJy at 8.44 GHz. Assuming the spectral index of the jet core of , the 133 GHz flux density is expected to be 0.16 mJy based on the upper limit of the 8.44 GHz flux density. However, the observed 133 GHz flux density is mJy, which is three times lower than that extrapolated from the 8.44 GHz flux density. The non-detection of the continuum emission at 4.86 GHz and 8.44 GHz cannot be explained by free-free absorption which causes the flux excess at high-frequency. Thus, the non-detection at several GHz and strong constraint on the 133 GHz flux density lead to the conclusion of the presence of a significantly faint core in Arp 187.
2.2 6dF Optical Spectra
We perform the spectral measurements to investigate the properties of the NLR. We first obtained the archival optical spectrum of Arp 187 from the 6dF galaxy survey (Jones et al., 2009). The spectrum covers a range from 3900Å to 7500Å with a fiber aperture of 6.7 arcsec (equivalent to kpc). Since the 6dF spectra are not flux calibrated on a nightly basis, we have normalized the spectrum based on the 6dF optical photometry at the band of mag.
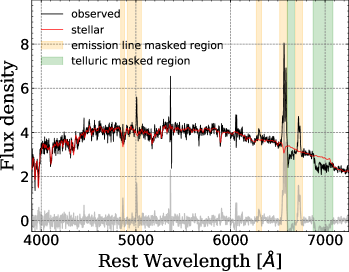
Figure 3 shows the optical spectrum of Arp 187 in the left panel (solid black line). The observed spectrum does not show any features of the big blue bump originating from the AGN accretion disk, nor the broad emission lines (e.g., Malkan & Sargent, 1982; Vanden Berk et al., 2001). Thus, we conclude that Arp 187 is at least not a type-1 AGN.
We then perform the spectral fitting to obtain the properties of the NLR. For the spectral fitting, we follow the routine in Bae et al. (2017) and later Toba et al. (2017), where they have performed the spectral fitting to the SDSS spectra. We first subtract the stellar continuum from the spectrum using a best-fit stellar template based on the wide range of the stellar population models (MILES; Sánchez-Blázquez et al., 2006) with solar metallicity and the age spanning from 60 Mys to 12.6 Gyr. In order to obtain the qualified stellar continuum, we mask the strong emission lines of H, [O I], [N II], H, and [S II] with the masking width of 1300 km s-1, which is corresponding to km s-1. We also mask the [O III] doublet with the masking width of 3000 km s-1 in order to avoid the possible contamination from the strong outflow originated from the [O III] emission lines. In addition, since some of the telluric absorptions are not well removed, we also masked those wavelength bands from the stellar spectral fitting.
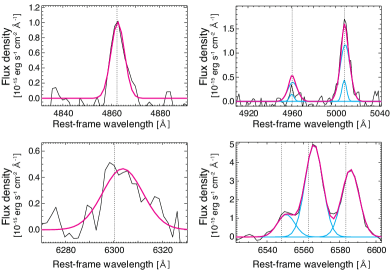
From the starlight-subtracted spectrum as shown in gray line at the zero flux level in Figure 3, we then fit the H, H, [N II]-doublet, [O I] using a single Gaussian function and [O III] doublet ([O III]) with double-Gaussian function using the IDL/MPFIT code, which is a -minimization routine (Markwardt, 2009). We assume that the [O III] doublet and the other narrow-lines have independent kinematics, while the [O III] doublet has the same velocity and velocity dispersion as each other. The observed spectrum (black line) as well as the fitting results is compiled for the entire spectral range (Figure 3, left panel) and for each lines (Figure 3, right panel).
2.2.1 Existence of NLR
We first apply the emission-line diagnostics, which give a separation between the NLR ionized by AGN and the H II region in the starburst galaxies (Veilleux & Osterbrock, 1987; Kewley et al., 2006). Figure 4 shows that Arp 187 is classified as AGN. Thus, it shows that Arp 187 hosts the NLR, one of the large scale AGN indicators.
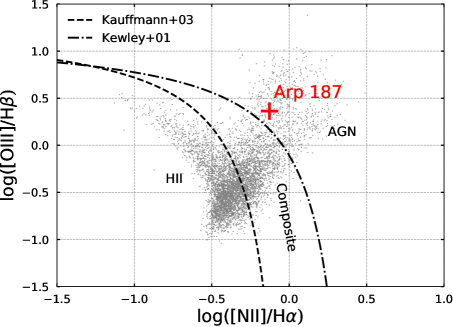
Since the diagnostic shows that [O III] (hereafter, [O III]) emission is dominated from the NLR, we then measure the [O III] luminosity (), and [O I] (here after, [O I]) luminosity () to estimate the AGN bolometric luminosity because alone (e.g., Heckman et al., 2004, 2005; LaMassa et al., 2013; Ueda et al., 2015) or the combination of and (e.g., Netzer, 2009) is often used as a proxy for AGN power. The observed [O III] and [O I] luminosities are erg s-1 and erg s-1. We also calculate an extinction-corrected, intrinsic luminosity of [O III] () and [O I] () luminosities from the Balmer decrement of H/H (e.g,. Calzetti et al., 1994; Domínguez et al., 2013). The values are erg s-1 and erg s-1. We calculate the AGN bolometric luminosity using the both lines (Netzer, 2009; Matsuoka & Woo, 2015) by
| (1) |
The estimated value is , which reaches to the typical luminosity of the SDSS quasars at –2 (e.g., Shen et al., 2011).
2.2.2 NLR Size
The size of the NLR is also an important indicator to estimate the fading timescale of AGN for Arp 187. Since the integral field unit (IFU) observations are still not available, we estimate the NLR size from the empirical relationship between the [O III] emission size and the [O III] luminosity.
The [O III] emission sizes have been measured from either narrowband imaging (Bennert et al., 2002; Schmitt et al., 2003), long-slit spectroscopy (Fraquelli et al., 2003; Bennert et al., 2006; Greene et al., 2011; Hainline et al., 2013), or the IFU observations (Humphrey et al., 2010; Husemann et al., 2013; Liu et al., 2013; Karouzos et al., 2016; Bae et al., 2017). The narrowband imaging is more often used for studying the NLR morphology, while the long-slit spectroscopy and IFU has an advantage to reach shallower sensitivity limits.
We first estimate the NLR sizes () using the size-luminosity relations of Bae et al. (2017) obtained from the IFU observations of nearby type-2 Seyferts and quasars. This relation has two advantages; 1) their study uses the extinction-uncorrected [O III] luminosity for the size-luminosity relation to reduce the uncertainty of the extinction correction to estimate the intrinsic [O III] luminosity, and 2) they estimate the NLR size based on the line diagnostic diagrams discussed in Section 2.2, which pick up the region where the [O III] emission is dominated from AGN. The size-luminosity relation of Bae et al. (2017) is given by
| (2) |
The estimated NLR size is pc.
We also estimate the [O III] emitting sizes () using the size-luminosity relations from the literature. Note that the relation is based on the [O III] emission size, therefore the estimated size should be the upper bound of the NLR size since the NLR should fulfill the certain emission line ratios as shown in Figure 3. We apply the relation based on the narrow-band imaging observations of quasar population (Schmitt et al., 2003) by
| (3) |
This gives kpc, which is times larger than obtained above. This result is in good agreement with the previous IFU studies (Karouzos et al., 2016; Bae et al., 2017), who reported that is on average a few times larger than . In this study, we assume – pc as the possible NLR size range.
2.3 Spitzer/IRS Spectra
Since the detailed spectral analysis of Arp 187 obtained from the Spitzer/InfraRed Spectrograph (IRS) is compiled in Ichikawa et al. (2016), here we provide a brief summary of the findings. We have found that the thermal emission from the AGN is already weak in Arp 187, with an upper bound of the 12 m luminosity of erg s-1. This is equivalent to erg s-1 using the relation of and 14–195 keV luminosities (Ichikawa et al., 2017) and the bolometric correction of (Ricci et al., 2017a). The spectrum of Arp 187 shows a marginal detection of the [O IV] 25.89 m line at S/N, which is also widely used AGN indicator. The [O IV] luminosity is obtained with erg s-1, which is equivalent to erg s-1 based on the luminosity relations obtained by LaMassa et al. (2010). Since the ionization potential of [O IV] is higher ( eV) than other typical NLR indicators including [O III] line (e.g., Rigby et al., 2009), the emission size is expected to be smaller than that of [O III] (Komossa et al., 2008; Toba et al., 2017), which is 0.5–1.4 kpc in this study. Thus, we take the emission size of kpc as a fiducial value.
2.4 WISE Colors
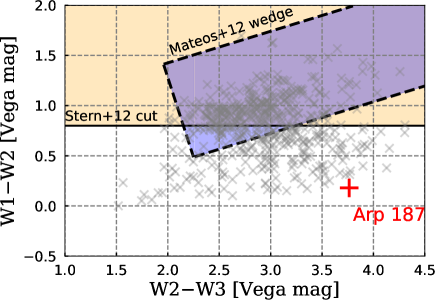
IR color-color selection is useful to identify AGN candidates using the feature of the MIR bump originated from the AGN torus. Figure 5 shows the location of Arp 187 on the WISE color-color plane. It is known that increasing levels of AGN contribution to the MIR emission moves sources upwards in the color-color plane with the color cut of (orange area; Stern et al., 2012) and also within the AGN wedge (blue area; Mateos et al., 2012). The figure clearly shows that Arp 187 does not fulfill either of the criteria above, indicating either 1) Arp 187 does not host AGN or 2) the AGN activity is quite weak even if it exists (on average erg s-1, as suggested by Ichikawa et al., 2017).
2.5 WISE IR Time Variability
It is worth to trace the IR luminosity drop from the AGN torus after the AGN quenching. Since Arp 187 is bright enough to be detected in the single exposure with the WISE mission, we have collected both cryogenic (WISE All-sky database) and post-cryogenic multi-epoch photometry (WISE 3 band and Post-Cryo database) from the Allwise (Wright et al., 2010; Mainzer et al., 2011) covering the observation between 2010 January and 2011 February (–), and the most recent Neowise (Mainzer et al., 2014) data release 2018 covering the observation between 2013 December 13 and 2017 December 13, UTC (–). WISE has 90-min orbit and conducts observations of a source over a day period, and a given location is observed every six months.
In this study we used standard aperture magnitude (w1/2mag). We applied a cross-matching radius of 2 arcsec, based on the positional accuracy with the 2MASS catalog (see also Ichikawa et al., 2012, 2017). After this matching, 26 and 122 data-points were obtained from the Allwise and Neowise epoch, respectively. Then we select good quality single-epoch data points based on the good quality frame score (qual_frame>0 and qi_fact>0), locating the enough distance from the South Atlantic Anomalies (saa_sep>0), and avoiding the possible contamination from the moon (moon_masked=0). This reduces the sample into 24 (Allwise) and 109 (Neowise), respectively. Finally, we applied the aperture measurement quality flag (w1/2flg=0) in order to avoid the contamination in the aperture. The final data points are 10 (W1) and 8 (W2) for Allwise 43 (W1) and 21 (W2) for Neowise. All the data points fulfill the flux quality ph_qual=A, with a signal-to-noise ratio larger than 10.0. We also checked sources of contamination and/or biased flux, due to proximity to an image artifact (e.g., diffraction spikes, scattered-light halos, and/or optical ghosts), using the contamination flag cc_flags. All the data points are cc_flags=0, that are unaffected by known artifacts.
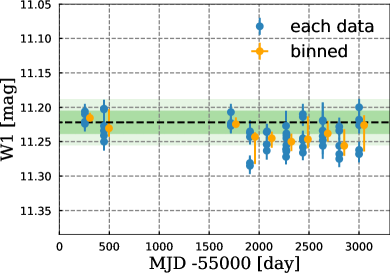
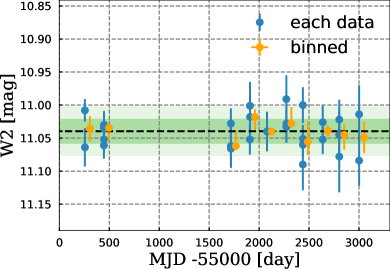
Figure 6 shows the light curve of W1 (3.4 m) and W2 (4.6 m).
The light curves in the W1 and W2 span a baseline of roughly 2800 days years. Each observation is shown in blue and a binned observations
within one-day is also shown in orange.
As shown in Figure 6,
no clear variability is detected in the Allwise and Neowise epoch,
and also between the two epochs.
Actually, the Allwise catalog provides a variability flag (var_flag) and
its value is , suggesting that the significant variability between different
exposures are not detected during the Allwise survey, which shows the consistent result.
2.6 Relationship between 12 m and [O III] Luminosities
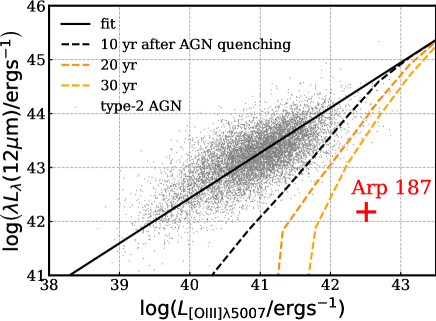
It is widely known that both 12 m and the [O III] luminosities are good proxies for AGN power, and it is a natural consequence that there is a luminosity correlations between 12 m and the [O III] luminosities (e.g., Toba et al., 2014).
Figure 7 shows the relationship between 12 m and [O III] luminosities using the SDSS DR12 type-2 AGN sample with the cross-matching by the WISE W3 (12 m) band. As expected, two AGN indicators have a nice luminosity correlation. However, Arp 187 does not follow the luminosity relation and is located at the right bottom in the plane, suggesting that Arp 187 is in the locus of dying AGN. Ichikawa & Tazaki (2017) estimated the typical cooling timescale of the dusty torus once the AGN is suddenly quenched. The thermal MIR dust emission from AGN should decay times of 10–100 years, mainly depending on the time-lag caused by the light travel time from the nucleus to the dust sublimation radius, while the remains the same luminosity for over years because of its larger physical size. Ichikawa & Tazaki (2017) also calculated how those dying AGN move in the luminosity–luminosity plane of the two AGN indicators, and showed that those dying AGN should locate at the bottom right of the luminosity relation. The location of Arp 187 in Figure 7 is consistent with the idea, and below the relationship of the line after 30 years of AGN quenching (the orange dashed line).
| Large scale AGN indicators ( pc) | |||||||
|---|---|---|---|---|---|---|---|
| Type of AGN indicators | AGN sign | Size (radius) | Reference | ||||
| jet lobe | kpc | yr | Section 2.1 | ||||
| NLR ([OIII]) | – kpc | – yr | Section 2.2 | ||||
| NLR ([OIV]25.89 m) | kpc | yr | Section 2.3 | ||||
| Small scale AGN indicators ( pc) | |||||||
| Dust torus (Spitzer/IRS Spec) | X | pc | – yr | Section 2.3 | |||
| Dust torus (WISE IR colors) | X | – yr | Section 2.4 | ||||
| Dust torus (WISE IR light curve) | X | – yr | Section 2.5 | ||||
| Dust torus ( vs. ) | X | pc | yr | Section 2.6 | |||
| jet core | X | pc | Current | Section 2.1 | |||
| BLR (optical Spec) | X | pc | Current (1–10 yr) | Section 2.2 | |||
| Electron corona (X-ray) | X | pc | Current | Section 2.7 | |||
| Other Relations | |||||||
| BH fundamental plane (FP) | Current | Section 2.8 | |||||
Note. — The list of AGN indicators and the retrospective time () of the AGN indicator. Except the jet lobe, the all time is the light crossing time with the definition of .
2.7 X-ray Observations
Although the X-ray observations give us the current AGN activity without the concern of the obscuration up to (e.g., Ricci et al., 2015, 2017b), we have not found any previous X-ray observations for Arp 187, and therefore only the upper bounds obtained from the available all-sky X-ray surveys.
Arp 187 is not in the catalog of Swift/BAT 105 month all-sky survey with the limiting flux at the 14–195 keV band of erg s-1 cm-2 (Oh et al., 2018). This gives a very shallow upper bound of erg s-1, which is equivalent to erg s-1 under the assumption of (Ricci et al., 2017a).
2.8 Black Hole Fundamental Plane
The fundamental plane of the black hole gives a relationship among three physical quantities of , core , and the black hole mass (e.g., Merloni et al., 2003; Falcke et al., 2004; Yuan & Narayan, 2014). Ichikawa et al. (2016) discussed that once the upper-bound of is given, we can estimate the upper-bound of since the black hole mass in Arp 187 is estimated to be . The upper bound of erg s-1 obtained by the VLA observation gives erg s-1 using the relation of Yuan & Cui (2005). This is equivalent to erg s-1, indicating that the central engine is already quenched.
3 Discussion
3.1 AGN Indicators and Scenarios of Current AGN Activity
Our multi-wavelength measurements of the AGN indicators show that we have successfully found the large scale ( pc) AGN indicators while not for the small scale ones with pc. Table 2 summarizes the AGN indicators for Arp 187.
There are two possible scenarios that can account for these seemingly contradictory results between the larger ( pc) and smaller ( pc) scales. One is that the AGN activity still exists but the emission is highly obscured along the line of sight, while being unobscured towards the jet and/or the NLR direction (e.g., Sartori et al., 2018b). The other is that the AGN activity in Arp 187 has already been quenched, while the narrow line regions still remain bright due to the light-travel time from the central engine. The first scenario is unlikely for Arp 187 because of the two reasons. One is the absence of the AGN torus emission in the Spitzer/IRS spectra as well as the other torus indicators obtained from WISE. If the central engine is highly obscured, then the most of the emission is absorbed by the dust, and then it re-emits and produces the bump in the mid-IR (e.g., Ichikawa et al., 2014), which we could not find. Another point is the absence of the jet core, which is irrelevant to the concern of absorption and its existence is the ubiquitous trend for AGN (Blandford & Königl, 1979; Hada et al., 2011) while there are some rare exceptions (Cordey, 1987; Dwarakanath & Kale, 2009). Thus, our results prefer the scenario of dying AGN.
One might argue that the absence of the big blue bump and the broad emission line region (BLR) is due to the absorption by the dusty torus (e.g., Antonucci, 1993; Nagar et al., 2002). It is true in general argument, but since the torus emission is already weak for Arp 187 as discussed in Section 2.3, the most plausible explanation is that the central engine including the accretion disk and the BLR becomes already very faint or might be diminished.
The disappearing timescale of the BLR is poorly known at current stage. One possible implication of this comes from the observations of changing-look AGN, which show the AGN type change in human timescale (e.g., Tohline & Osterbrock, 1976; Antonucci & Cohen, 1983; Alloin et al., 1985; LaMassa et al., 2015; Ruan et al., 2016; MacLeod et al., 2016; Yang et al., 2017). One of the findings of the years long monitoring of changing-look AGN is that the BLR can disappear within a few years, while the physical mechanism of the disappearance is still under debate (Lawrence, 2018). Thus, in this paper we compile the timescale of BLR as 1–10 years in Table 2.
| dying AGN (Arp 187) | fading AGN | changing-look quasar | |||||||
|---|---|---|---|---|---|---|---|---|---|
| AGN whose current (small scale) | AGN with weaker current | quasars with broad Balmer line Definition | AGN signature is dead, but | compared to that of | (dis)appearance associated with | past AGN signature is still alive. | past AGN signatures. | continuum change by a factor of . | |
| Small scale ( pc) AGN signs | dead | alive (but weak) | alive | ||||||
| Large scale ( pc) AGN signs | alive | alive | alive | ||||||
| Jet core features | no | yes (?)(B1) | |||||||
| Jet lobe features | yes | ||||||||
| yr | yr (using EELR(1)) | – yr(C1,C3,C4,C6) | |||||||
| (current) | erg s-1 | erg s-1 | erg s-1 | ||||||
| (before fading) | erg s-1 | erg s-1 | erg s-1 | ||||||
| Redshift () | 0.04 | – | – | ||||||
| Origin of variability | viscous | viscous | unknown (thermal?(C8-C10) or | magnetically elevated disk?(C7)) | |||||
| Host galaxies | merger remnant | merger system/remnants (?)(B5) | |||||||
| Number of sources found | sources(B1-B13) | sources(C1-C6) | |||||||
| Most known object names | Arp 187(A1) | IC 2497 (Hanny’s Voorwep)(B1-B8) | SDSS J0159+0033(C1) | (NGC 7252?(A2)) | Teacup galaxy(B5,B6,B12), etc. | SDSS J1011+5442(C2), etc. |
Note. — (1) EELR stands for extended AGN photo-ionized emission line region with the physical scale of kpc. (a) observed or inferred AGN luminosity decline (b) the timescale of the AGN luminosity decline of . “” in the column represents that there are no clear observations or consensus from the literature.
References. — dying AGN: (A1) Ichikawa et al. (2016), (A2) Schweizer et al. (2013); fading AGN: (B1) Józsa et al. (2009), (B2) Lintott et al. (2009), (B3) Schawinski et al. (2010), (B4–B6) Keel et al. (2012, 2015, 2017), (B7,B8) Sartori et al. (2018b, a), (B9,B10) Schirmer et al. (2013, 2016), (B11) Kawamuro et al. (2017), (B12) Villar-Martín et al. (2018), (B13) Wylezalek et al. (2018); changing-look quasar: (C1) LaMassa et al. (2015), (C2) Runnoe et al. (2016), (C3) Ruan et al. (2016), (C4) MacLeod et al. (2016), (C5) Gezari et al. (2017), (C6) Yang et al. (2017), (C7) Dexter & Begelman (2018), (C8) Noda & Done (2018), (C9) Ross et al. (2018), (C10) Stern et al. (2018)
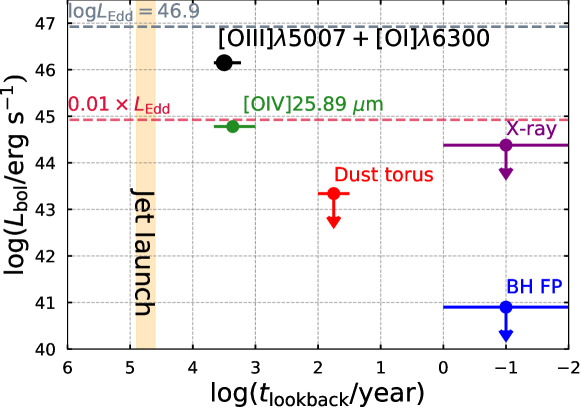
3.2 Luminosity Decline and Corresponding Timescales
One of our goal is to constrain how rapidly the AGN has faded in Arp 187. We summarize the long-term luminosity decline of Arp 187 in Figure 8. This figure shows that the AGN has experienced the drastic luminosity decline by the factor of times within years.
One question arises as to how to describe the sudden quenching of AGN within years and how this timescale is connected to the physical properties of the accretion disk of AGN. We here consider three possible timescales: the orbital, thermal, and the viscous (inflow) timescales, by following the discussions of Czerny (2006) and Stern et al. (2018). If the accretion flow is roughly Keplerian, the dynamical timescale of the accretion disk is given by , where is the Keplerian orbital angular frequency. The thermal time scale, which is corresponding of the disk cooling, is given by , where is the viscosity parameter (Shakura & Sunyaev, 1973; Kato et al., 2008). The viscous timescale is also given by , where is the disk aspect ratio. The numerical simulations derive the estimation of (Hirose et al., 2009; Davis et al., 2010), therefore we use as the fiducial value. The disk aspect ratio is typically very small and we assume by following Stern et al. (2018).
We first determine the boundary accretion disk radius , within which it emits the UV radiation, where UV represents the wavelength of Å, and the typical wavelength range of the big blue bump (e.g., Malkan & Sargent, 1982; Vanden Berk et al., 2001). Using the obtained parameter for Arp 187, the BH is estimated to be and the maximum Eddington ratio in this study is obtained from the NLR. The gravitational radius is given by AU. the AGN bolometric luminosity is governed by , where is the radiation efficiency. The typical value is estimated as (Soltan, 1982). The mass accretion rate is therefore given by
| (4) |
here , , and .
Assuming a standard thin-disk AGN model, the disk radius is linked to the disk temperature in Equation of (3.57) of Kato et al. (2008) written by
| (5) |
where is a is a Stefan–Boltzmann constant. Combining Equation (5) and (4) with Wien’s law (), the typical radius can be given by
| (6) |
where . Thus we apply as a fiducial value for the UV emitting disk size.
We can then parametrize the disk timescales as
| (7) | ||||
| (8) | ||||
| (9) |
Since Arp 187 does not show the big blue bump and the torus emission (whose source of nutrition is the UV photons) anymore at least the last a few 10 years (see also Figure 8), the dynamical and the thermal time scale are unlikely and too short to be happening. On the other hand, the viscous timescale seems to be a little longer compared to the quenching timescale of years. However, since the NLR traces higher energy UV photons with eV, the corresponding disk region becomes more inner with , whose viscous timescale is yrs. This is consistent with our strongest upper-bound of yrs (see Table 2). Thus, our rough estimation suggests that the viscous timescale most closely matches the observed quenching timescale.
3.3 Comparison between Dying AGN and Fading AGN
The absence of small scale AGN signatures and the timescale discussed in Section 3.2 support that Arp 187 has been in a later fading phase, or “dying” phase compared to other fading AGN since the UV emitting region in Arp 187 likely disappeared, and the large scale AGN indicators are observable as remnant signs of AGN. On the other hand, the previously reported fading AGN are considered to be earlier fading stage since they still host either of clear UV, MIR, or X-ray emission in the core, suggesting that the UV emitting region is still alive (e.g., Keel et al., 2015, 2017; Sartori et al., 2018b). We have summarized the comparison of properties of our dying AGN and fading AGN in Table 3.1.
One important question is how many such “dying” AGN have been already reported in the population of fading AGN from the literature. While most of fading AGN still show MIR or X-ray emission in the core, one fading AGN in NGC 7252 might fulfill “dying” AGN criterion. Schweizer et al. (2013) showed that NGC 7252 hosts large [OIII] bright nebulae which belong to a stream of tidal-tail gas falling back to the host galaxy. The bright [OIII] nebulae require the AGN luminosity larger than erg s-1 while the current X-ray upper-bound gives erg s-1. Considering the nebulae distance, NGC 7252 might have experienced a luminosity decline by two orders of magnitude over the past years, and the current AGN activity is well below erg s-1, suggesting that the central engine is already dead.
Note that the past inferred AGN luminosity is completely different between Arp 187 and NGC 7252. Arp 187 reached a quasar-like luminosity with erg s-1, whereas that of NGC 7252 is well below the quasar level or more likely Seyfert level luminosity with erg s-1. Schweizer et al. (2013) also reported that the central gas disk of NGC 7252 contains the large amount of molecular gas with , suggesting that the AGN feedback activity have failed to remove the gas in the host galaxy. Therefore the gas content difference between NGC 7252 and Arp 187 would be a good testbed to investigate the effect of AGN feedback since these two galaxies have already experienced the one-cycle of AGN activity for at least years (Schawinski et al., 2015) but with different AGN luminosity.
3.4 Comparison of the Causes of Luminosity Changes between Dying AGN and Changing-Look Quasars
It is worthwhile to note the difference of the accretion mechanism between our dying AGN in Arp 187 and a recently discovered class of “changing-look quasars” in which the strong UV bump and broad emission lines associated with optically bright quasars either appear or disappear on timescales of years (e.g., LaMassa et al., 2015; MacLeod et al., 2016; Gezari et al., 2017; Yang et al., 2017). The physical processes causing these changing-look phenomena are hotly debated, but the physical changes in the accretion disk is the likely cause rather than changes in obscuration (e.g., Dexter & Begelman, 2018; Lawrence, 2018).
Stern et al. (2018) recently discovered one changing-look quasar WISE J1052+1519, and carefully discussed the possible disk timescales matching the year-timescale. They found that the dynamical timescale is several weeks, which is therefore too shorter, while the viscous timescale, which would be responsible for the luminosity change of dying AGN, is far too long. Instead, a few year long thermal timescale would be a plausible one matching the observed year scale variability. The similar origin is also proposed for a different changing-look AGN Mrk 1018 (Noda & Done, 2018). Therefore, both dying and changing-look AGN show the luminosity change, but their luminosity changes are likely based on the different physical mechanisms of the accretion disk. Those property differences between dying AGN and changing-look quasars are also summarized in Table 3.1.
3.5 Comparison between Dying AGN and Remnant Radio Sources
Our study suggests that the absence of radio core at the center of galaxies would be a good indicator for searching for a dying AGN. While they are very rare, some authors have already found candidates of radio galaxies without clear radio core signs, or so called remnant radio sources. Cordey (1987) showed that IC 2476 has double radio lobes with a separation of 560 kpc, but without a clear radio core at the location of the host galaxy. In addition, Dwarakanath & Kale (2009) have conducted a search for remnant radio sources using VLA 74 MHz survey (VLSS; 80 arcsec spatial resolution) and NRAO VLA Sky Survey (NVSS; 45 arcsec spatial resolution) through the search of very steep radio sources whose spectral index is (where ) between 74 MHz and 1.4 GHz. Out of the parent sample, they found 10 such candidates and the spectral age estimation of jet lobes gives the fading age of Myr.
The timescale found in remnant radio sources is at least two orders of magnitude longer than the fading phase traced for Arp 187. This discrepancy is natural because their steep spectral selection method is sensitive to longer jet age with years at the frequency of MHz (e.g., Jamrozy et al., 2008) and their moderate spectral resolution of 80 arcsec is equivalent to the physical angular size of kpc, or the corresponding kinematic age of years at , where most of the sample are found. Thus, previous radio studies are sensitive to trace much longer AGN activities with Myr. Considering the typical quasar lifetime of Myr (e.g., Hopkins et al., 2006; Inayoshi et al., 2018), remnant radio sources are more suitable to trace a comparable timescale of the AGN lifetime rather than the AGN fading timescale traced in this study.
Recently, higher spatial resolution surveys are ongoing using Low-Frequency Array (LOFAR; van Haarlem et al., 2013). LOFAR covers the largely unexplored low-frequency range between 10–240 MHz, and has the resolution of arcsec at 150 MHz. This would give an opportunity to search for smaller sized, which is equivalent to younger, dying radio sources at the age of Myr, and the initial-stage surveys have already found new remnant radio source candidates (e.g., Mahatma et al., 2018) and future LOFAR surveys would give us a more statistically significant number of such younger remnant radio sources and they would help to create a more complete picture of both of AGN lifetime and dying phase (also see a recent review by Morganti, 2017).
3.6 Future observations
There is some room for the further constraints of the AGN activities of Arp 187. JWST/MIRI will give us the nuclear MIR spectra with the least host galaxy contamination with the great sensitivity. The X-ray satellite NuSTAR is going to constrain the current AGN activity. Recently, thanks to the great sensitivity at keV, NuSTAR revealed that a fading AGN candidate in IC 2497 is actually a Compton-thick AGN (Sartori et al., 2018c), whose nuclear X-ray emission could not be discovered in the previous X-ray satellites such as Chandra, XMM/Newton, and even with Suzaku (Schawinski et al., 2010). Although the same discovery is unlikely for Arp 187 since the MIR emission is known to be considerably weak, NuSTAR will constrain the nuclear activity down to even with the Compton-thick absorption of . Finally, the optical or near-IR IFU will also give us the detailed NLR size which is poorly constrained with the current study.
4 Conclusion
We have compiled the multi-wavelength AGN signatures of dying AGN candidate Arp 187, based on the combinations of the newly conducted ALMA observations as well as the archival VLA 5–10 GHz data, 6dF optical spectrum, Neowise and Allwise IR data. Our results show that the AGN in Arp 187 is a bona fide dying AGN, whose central engine is already dead, but the large scale AGN indicators are still observable as the remnant of the past AGN activity. The central engine of Arp 187 has experienced the drastic luminosity decline by a factor of within the last years. Our rough estimation suggests that the viscous timescale most closely matches the obtained timescale in this study. This supports that Arp 187 has been in more later fading phase whose UV emitting region in the accretion disk is likely to be almost disappeared, while other fading AGN show clear signs that UV emitting region is still alive.
References
- Abazajian et al. (2009) Abazajian, K. N., Adelman-McCarthy, J. K., Agüeros, M. A., et al. 2009, ApJS, 182, 543
- Alexander & Hickox (2012) Alexander, D. M., & Hickox, R. C. 2012, New A Rev., 56, 93
- Alloin et al. (1985) Alloin, D., Pelat, D., Phillips, M., & Whittle, M. 1985, ApJ, 288, 205
- Antonucci (1993) Antonucci, R. 1993, ARA&A, 31, 473
- Antonucci & Cohen (1983) Antonucci, R. R. J., & Cohen, R. D. 1983, ApJ, 271, 564
- Asmus et al. (2015) Asmus, D., Gandhi, P., Hönig, S. F., Smette, A., & Duschl, W. J. 2015, MNRAS, 454, 766
- Astropy Collaboration et al. (2013) Astropy Collaboration, Robitaille, T. P., Tollerud, E. J., et al. 2013, A&A, 558, A33
- Bae et al. (2017) Bae, H.-J., Woo, J.-H., Karouzos, M., et al. 2017, ApJ, 837, 91
- Bennert et al. (2002) Bennert, N., Falcke, H., Schulz, H., Wilson, A. S., & Wills, B. J. 2002, ApJ, 574, L105
- Bennert et al. (2006) Bennert, N., Jungwiert, B., Komossa, S., Haas, M., & Chini, R. 2006, A&A, 456, 953
- Berney et al. (2015) Berney, S., Koss, M., Trakhtenbrot, B., et al. 2015, MNRAS, 454, 3622
- Blandford & Königl (1979) Blandford, R. D., & Königl, A. 1979, ApJ, 232, 34
- Calzetti et al. (1994) Calzetti, D., Kinney, A. L., & Storchi-Bergmann, T. 1994, ApJ, 429, 582
- Cordey (1987) Cordey, R. A. 1987, MNRAS, 227, 695
- Czerny (2006) Czerny, B. 2006, in Astronomical Society of the Pacific Conference Series, Vol. 360, Astronomical Society of the Pacific Conference Series, ed. C. M. Gaskell, I. M. McHardy, B. M. Peterson, & S. G. Sergeev, 265
- Davis et al. (2010) Davis, S. W., Stone, J. M., & Pessah, M. E. 2010, ApJ, 713, 52
- Dexter & Begelman (2018) Dexter, J., & Begelman, M. C. 2018, ArXiv e-prints, arXiv:1807.03314
- Domínguez et al. (2013) Domínguez, A., Siana, B., Henry, A. L., et al. 2013, ApJ, 763, 145
- Dwarakanath & Kale (2009) Dwarakanath, K. S., & Kale, R. 2009, ApJ, 698, L163
- Evans et al. (2010) Evans, I. N., Primini, F. A., Glotfelty, K. J., et al. 2010, ApJS, 189, 37
- Falcke et al. (2004) Falcke, H., Körding, E., & Markoff, S. 2004, A&A, 414, 895
- Fraquelli et al. (2003) Fraquelli, H. A., Storchi-Bergmann, T., & Levenson, N. A. 2003, MNRAS, 341, 449
- Gandhi et al. (2009) Gandhi, P., Horst, H., Smette, A., et al. 2009, A&A, 502, 457
- Gezari et al. (2017) Gezari, S., Hung, T., Cenko, S. B., et al. 2017, ApJ, 835, 144
- Godfrey et al. (2017) Godfrey, L. E. H., Morganti, R., & Brienza, M. 2017, MNRAS, 471, 891
- Greene et al. (2011) Greene, J. E., Zakamska, N. L., Ho, L. C., & Barth, A. J. 2011, ApJ, 732, 9
- Hada et al. (2011) Hada, K., Doi, A., Kino, M., et al. 2011, Nature, 477, 185
- Hainline et al. (2013) Hainline, K. N., Hickox, R., Greene, J. E., Myers, A. D., & Zakamska, N. L. 2013, ApJ, 774, 145
- Heckman et al. (2004) Heckman, T. M., Kauffmann, G., Brinchmann, J., et al. 2004, ApJ, 613, 109
- Heckman et al. (2005) Heckman, T. M., Ptak, A., Hornschemeier, A., & Kauffmann, G. 2005, ApJ, 634, 161
- Hirose et al. (2009) Hirose, S., Blaes, O., & Krolik, J. H. 2009, ApJ, 704, 781
- Hopkins et al. (2006) Hopkins, P. F., Hernquist, L., Cox, T. J., et al. 2006, ApJS, 163, 1
- Humphrey et al. (2010) Humphrey, A., Villar-Martín, M., Sánchez, S. F., et al. 2010, MNRAS, 408, L1
- Hunter (2007) Hunter, J. D. 2007, Computing In Science & Engineering, 9, 90
- Husemann et al. (2013) Husemann, B., Wisotzki, L., Sánchez, S. F., & Jahnke, K. 2013, A&A, 549, A43
- Ichikawa et al. (2014) Ichikawa, K., Imanishi, M., Ueda, Y., et al. 2014, ApJ, 794, 139
- Ichikawa & Inayoshi (2017) Ichikawa, K., & Inayoshi, K. 2017, ApJ, 840, L9
- Ichikawa et al. (2017) Ichikawa, K., Ricci, C., Ueda, Y., et al. 2017, ApJ, 835, 74
- Ichikawa & Tazaki (2017) Ichikawa, K., & Tazaki, R. 2017, ApJ, 844, 21
- Ichikawa et al. (2016) Ichikawa, K., Ueda, J., Shidatsu, M., Kawamuro, T., & Matsuoka, K. 2016, PASJ, 68, 9
- Ichikawa et al. (2012) Ichikawa, K., Ueda, Y., Terashima, Y., et al. 2012, ApJ, 754, 45
- Inayoshi & Haiman (2016) Inayoshi, K., & Haiman, Z. 2016, ApJ, 828, 110
- Inayoshi et al. (2018) Inayoshi, K., Ichikawa, K., & Haiman, Z. 2018, ApJ, 863, L36
- Jamrozy et al. (2008) Jamrozy, M., Konar, C., Machalski, J., & Saikia, D. J. 2008, MNRAS, 385, 1286
- Jones et al. (2009) Jones, D. H., Read, M. A., Saunders, W., et al. 2009, MNRAS, 399, 683
- Józsa et al. (2009) Józsa, G. I. G., Garrett, M. A., Oosterloo, T. A., et al. 2009, A&A, 500, L33
- Jun et al. (2015) Jun, H. D., Im, M., Lee, H. M., et al. 2015, ApJ, 806, 109
- Karouzos et al. (2016) Karouzos, M., Woo, J.-H., & Bae, H.-J. 2016, ApJ, 819, 148
- Kato et al. (2008) Kato, S., Fukue, J., & Mineshige, S. 2008, Black-Hole Accretion Disks — Towards a New Paradigm —
- Kauffmann et al. (2003) Kauffmann, G., Heckman, T. M., Tremonti, C., et al. 2003, MNRAS, 346, 1055
- Kawamuro et al. (2017) Kawamuro, T., Schirmer, M., Turner, J. E. H., Davies, R. L., & Ichikawa, K. 2017, ApJ, 848, 42
- Keel et al. (2012) Keel, W. C., Lintott, C. J., Schawinski, K., et al. 2012, AJ, 144, 66
- Keel et al. (2015) Keel, W. C., Maksym, W. P., Bennert, V. N., et al. 2015, AJ, 149, 155
- Keel et al. (2017) Keel, W. C., Lintott, C. J., Maksym, W. P., et al. 2017, ApJ, 835, 256
- Kewley et al. (2001) Kewley, L. J., Dopita, M. A., Sutherland, R. S., Heisler, C. A., & Trevena, J. 2001, ApJ, 556, 121
- Kewley et al. (2006) Kewley, L. J., Groves, B., Kauffmann, G., & Heckman, T. 2006, MNRAS, 372, 961
- Komossa et al. (2008) Komossa, S., Xu, D., Zhou, H., Storchi-Bergmann, T., & Binette, L. 2008, ApJ, 680, 926
- Kormendy & Ho (2013) Kormendy, J., & Ho, L. C. 2013, ARA&A, 51, 511
- LaMassa et al. (2010) LaMassa, S. M., Heckman, T. M., Ptak, A., et al. 2010, ApJ, 720, 786
- LaMassa et al. (2013) LaMassa, S. M., Heckman, T. M., Ptak, A., & Urry, C. M. 2013, ApJ, 765, L33
- LaMassa et al. (2015) LaMassa, S. M., Cales, S., Moran, E. C., et al. 2015, ApJ, 800, 144
- Lawrence (2018) Lawrence, A. 2018, Nature Astronomy, 2, 102. https://doi.org/10.1038/s41550-017-0372-1
- Lintott et al. (2009) Lintott, C. J., Schawinski, K., Keel, W., et al. 2009, MNRAS, 399, 129
- Liu et al. (2013) Liu, G., Zakamska, N. L., Greene, J. E., Nesvadba, N. P. H., & Liu, X. 2013, MNRAS, 436, 2576
- MacLeod et al. (2016) MacLeod, C. L., Ross, N. P., Lawrence, A., et al. 2016, MNRAS, 457, 389
- Mahatma et al. (2018) Mahatma, V. H., Hardcastle, M. J., Williams, W. L., et al. 2018, MNRAS, 475, 4557
- Mainzer et al. (2011) Mainzer, A., Bauer, J., Grav, T., et al. 2011, ApJ, 731, 53
- Mainzer et al. (2014) Mainzer, A., Bauer, J., Cutri, R. M., et al. 2014, ApJ, 792, 30
- Malkan & Sargent (1982) Malkan, M. A., & Sargent, W. L. W. 1982, ApJ, 254, 22
- Marconi et al. (2004) Marconi, A., Risaliti, G., Gilli, R., et al. 2004, MNRAS, 351, 169
- Markwardt (2009) Markwardt, C. B. 2009, in Astronomical Society of the Pacific Conference Series, Vol. 411, Astronomical Data Analysis Software and Systems XVIII, ed. D. A. Bohlender, D. Durand, & P. Dowler, 251
- Mateos et al. (2012) Mateos, S., Alonso-Herrero, A., Carrera, F. J., et al. 2012, MNRAS, 426, 3271
- Mateos et al. (2015) Mateos, S., Carrera, F. J., Alonso-Herrero, A., et al. 2015, MNRAS, 449, 1422
- Matsuoka & Woo (2015) Matsuoka, K., & Woo, J.-H. 2015, ApJ, 807, 28
- McConnell et al. (2011) McConnell, N. J., Ma, C.-P., Gebhardt, K., et al. 2011, Nature, 480, 215
- McKinney (2010) McKinney, W. 2010, in Proceedings of the 9th Python in Science Conference, ed. S. van der Walt & J. Millman, 51 – 56
- McLure & Dunlop (2004) McLure, R. J., & Dunlop, J. S. 2004, MNRAS, 352, 1390
- Merloni et al. (2003) Merloni, A., Heinz, S., & di Matteo, T. 2003, MNRAS, 345, 1057
- Morganti (2017) Morganti, R. 2017, Nature Astronomy, 1, 596
- Murgia et al. (1999) Murgia, M., Fanti, C., Fanti, R., et al. 1999, A&A, 345, 769
- Nagai et al. (2006) Nagai, H., Inoue, M., Asada, K., Kameno, S., & Doi, A. 2006, ApJ, 648, 148
- Nagar et al. (2002) Nagar, N. M., Oliva, E., Marconi, A., & Maiolino, R. 2002, A&A, 391, L21
- Netzer (2003) Netzer, H. 2003, ApJ, 583, L5
- Netzer (2009) —. 2009, MNRAS, 399, 1907
- Netzer et al. (2006) Netzer, H., Mainieri, V., Rosati, P., & Trakhtenbrot, B. 2006, A&A, 453, 525
- Noda & Done (2018) Noda, H., & Done, C. 2018, ArXiv e-prints, arXiv:1805.07873
- Novak et al. (2011) Novak, G. S., Ostriker, J. P., & Ciotti, L. 2011, ApJ, 737, 26
- Oh et al. (2018) Oh, K., Koss, M., Markwardt, C. B., et al. 2018, ArXiv e-prints, arXiv:1801.01882
- Panessa et al. (2006) Panessa, F., Bassani, L., Cappi, M., et al. 2006, A&A, 455, 173
- Ricci et al. (2015) Ricci, C., Ueda, Y., Koss, M. J., et al. 2015, ApJ, 815, L13
- Ricci et al. (2017a) Ricci, C., Trakhtenbrot, B., Koss, M. J., et al. 2017a, Nature, 549, 488
- Ricci et al. (2017b) —. 2017b, ApJS, 233, 17
- Rigby et al. (2009) Rigby, J. R., Diamond-Stanic, A. M., & Aniano, G. 2009, ApJ, 700, 1878
- Rosen et al. (2016) Rosen, S. R., Webb, N. A., Watson, M. G., et al. 2016, A&A, 590, A1
- Ross et al. (2018) Ross, N. P., Ford, K. E. S., Graham, M., et al. 2018, MNRAS, 480, 4468
- Rothberg & Joseph (2004) Rothberg, B., & Joseph, R. D. 2004, AJ, 128, 2098
- Ruan et al. (2016) Ruan, J. J., Anderson, S. F., Cales, S. L., et al. 2016, ApJ, 826, 188
- Runnoe et al. (2016) Runnoe, J. C., Cales, S., Ruan, J. J., et al. 2016, MNRAS, 455, 1691
- Saikia & Jamrozy (2009) Saikia, D. J., & Jamrozy, M. 2009, Bulletin of the Astronomical Society of India, 37, arXiv:1002.1841
- Sánchez-Blázquez et al. (2006) Sánchez-Blázquez, P., Peletier, R. F., Jiménez-Vicente, J., et al. 2006, MNRAS, 371, 703
- Sartori et al. (2018a) Sartori, L. F., Schawinski, K., Trakhtenbrot, B., et al. 2018a, MNRAS, 476, L34
- Sartori et al. (2018b) Sartori, L. F., Schawinski, K., Koss, M. J., et al. 2018b, MNRAS, 474, 2444
- Sartori et al. (2018c) —. 2018c, MNRAS, 474, 2444
- Schawinski et al. (2015) Schawinski, K., Koss, M., Berney, S., & Sartori, L. F. 2015, MNRAS, 451, 2517
- Schawinski et al. (2010) Schawinski, K., Evans, D. A., Virani, S., et al. 2010, ApJ, 724, L30
- Schirmer et al. (2013) Schirmer, M., Diaz, R., Holhjem, K., Levenson, N. A., & Winge, C. 2013, ApJ, 763, 60
- Schirmer et al. (2016) Schirmer, M., Malhotra, S., Levenson, N. A., et al. 2016, MNRAS, 463, 1554
- Schmitt et al. (2003) Schmitt, H. R., Donley, J. L., Antonucci, R. R. J., et al. 2003, ApJ, 597, 768
- Schweizer et al. (2013) Schweizer, F., Seitzer, P., Kelson, D. D., Villanueva, E. V., & Walth, G. L. 2013, ApJ, 773, 148
- Shakura & Sunyaev (1973) Shakura, N. I., & Sunyaev, R. A. 1973, A&A, 24, 337
- Shen et al. (2011) Shen, Y., Richards, G. T., Strauss, M. A., et al. 2011, ApJS, 194, 45
- Soltan (1982) Soltan, A. 1982, MNRAS, 200, 115
- Stern et al. (2012) Stern, D., Assef, R. J., Benford, D. J., et al. 2012, ApJ, 753, 30
- Stern et al. (2018) Stern, D., McKernan, B., Graham, M. J., et al. 2018, ArXiv e-prints, arXiv:1805.06920
- Toba et al. (2017) Toba, Y., Bae, H.-J., Nagao, T., et al. 2017, ApJ, 850, 140
- Toba et al. (2014) Toba, Y., Oyabu, S., Matsuhara, H., et al. 2014, ApJ, 788, 45
- Tohline & Osterbrock (1976) Tohline, J. E., & Osterbrock, D. E. 1976, ApJ, 210, L117
- Trakhtenbrot (2014) Trakhtenbrot, B. 2014, ApJ, 789, L9
- Ueda et al. (2014) Ueda, J., Iono, D., Yun, M. S., et al. 2014, ApJS, 214, 1
- Ueda et al. (2015) Ueda, Y., Hashimoto, Y., Ichikawa, K., et al. 2015, ApJ, 815, 1
- van Haarlem et al. (2013) van Haarlem, M. P., Wise, M. W., Gunst, A. W., et al. 2013, A&A, 556, A2
- Vanden Berk et al. (2001) Vanden Berk, D. E., Richards, G. T., Bauer, A., et al. 2001, AJ, 122, 549
- Veilleux & Osterbrock (1987) Veilleux, S., & Osterbrock, D. E. 1987, ApJS, 63, 295
- Villar-Martín et al. (2018) Villar-Martín, M., Cabrera-Lavers, A., Humphrey, A., et al. 2018, MNRAS, 474, 2302
- Voges et al. (1999) Voges, W., Aschenbach, B., Boller, T., et al. 1999, A&A, 349, 389
- Wright et al. (2010) Wright, E. L., Eisenhardt, P. R. M., Mainzer, A. K., et al. 2010, AJ, 140, 1868
- Wu et al. (2015) Wu, X.-B., Wang, F., Fan, X., et al. 2015, Nature, 518, 512
- Wylezalek et al. (2018) Wylezalek, D., Zakamska, N. L., Greene, J. E., et al. 2018, MNRAS, 474, 1499
- Yang et al. (2017) Yang, Q., Wu, X.-B., Fan, X., et al. 2017, ArXiv e-prints, arXiv:1711.08122
- Yu & Tremaine (2002) Yu, Q., & Tremaine, S. 2002, MNRAS, 335, 965
- Yuan & Cui (2005) Yuan, F., & Cui, W. 2005, ApJ, 629, 408
- Yuan & Narayan (2014) Yuan, F., & Narayan, R. 2014, ARA&A, 52, 529