Environmental conditions shaping star formation: The Carina Nebula
Abstract
Using the Mopra telescope, we have targeted 61 regions in the Carina Nebula, covering an area of 1.5 square degrees, of bright and compact 870 m dust continuum emission for molecular line emission from a host of 16 spectral lines at 3mm, including several dense gas tracers. We found that the clumps detected in Carina in general have in average higher temperatures (27 K compared to 21 K), and lower masses (214 M⊙ compared to 508 M⊙) than clumps located at a similar distance to us in the Galactic Plane. We compare the properties of the molecular line emission of these clumps with the MALT90 survey, finding that the detection rates of the molecular lines are similar to MALT90 clumps that are classified as PDRs. However, most of the clumps located within 10 of Carina have little molecular line emission detected in our observations. Given the lack of maser detection in the Carina region, we also compared the properties the clumps in Carina to those of Galactic clumps associated with 6.7-GHz methanol masers. We found that the clumps in Carina are warmer, less massive, and show less emission from the four most commonly detected molecules, HCO+, N2H+, HCN, and HNC, compared to clumps associated with masers in the Galactic Plane. Overall our results are consistent with the scenario in which the high radiation field of Carina is dramatically affecting its local environment, and therefore the chemical composition of the dense clumps.
keywords:
masers – stars: formation – ISM: molecules – radio lines: ISM1 Introduction
The Carina Nebula (NGC 3372) is a giant and rich star-forming region located in the southern Galactic plane (see Smith & Brooks 2007). It hosts more than 60 massive O and B stars including Carina and several hundred protostars (Smith et al. 2010b) making it one of the most spectacular regions of high-mass star formation in the Galaxy. The Carina Nebula (hereafter Carina) is located relatively nearby (distance 2.30.1 kpc, Smith 2002) and our line of sight toward Carina is not obscured by intervening Galactic extinction, making it an excellent region to study star formation, feedback processes and triggered star formation. Moreover, since Carina has an unusually high concentration of high-mass stars its provides an unique laboratory to study the effects that these high-mass stars have on their surrounding interstellar medium (ISM).
Observations with the Hubble (Smith et al. 2010a) and Spitzer (Smith et al. 2010b) telescopes, have shown the presence of dust pillars in Carina. These dust pillars correspond to the regions where star formation is currently ongoing, containing several hundreds of young proto-stellar objects (ages 105 years). In total, Carina contains more than 60000 young stars (Preibisch et al. 2011), and the star formation rate of this region of 0.017 M⊙ yr-1, which contributes to 1% of the star formation rate of the Galaxy, making it one of the most important star forming regions in our Galaxy (Povich et al. 2011; Preibisch et al. 2011).
Despite having a high-concentration of high-mass stars, no high-mass young-stellar objects (YSOs, M⊙) have been found in Carina, but rather a population of low to intermediate mass YSOs ( M M⊙), with low luminosities ( L⊙) located at the edges of the Nebula (Gaczkowski et al. 2013).
Sub-millimeter observations with the Large APEX Bolometer Camera (LABOCA) from the Atacama Pathfinder EXperiment (APEX) telescope of the dense ( cm-2), cold ( K) gas have shown that dense molecular clouds still exist close to the OB stars in this region. However the total dust mass in dense clouds only account for 10% of the total mass budget of Carina (Preibisch et al. 2011).
Recently, Carina has become the target of a number of observations at radio wavelengths, revealing the large-scale view of the molecular complex through comprehensive observations of 12CO and 13CO (Rebolledo et al. 2016), as well as Hi (Rebolledo et al. 2017). These observations have shown that the fraction of the molecular gas changes across the complex, but it can achieve values 80% of the total mass in some regions(Rebolledo et al. 2016).
Here we present Mopra observations of the 61 densest clumps within Carina, which have been revealed by LABOCA 870 m dust continuum observations of the ATLASGAL survey (APEX Telescope Large Area Survey of the Galaxy; Schuller et al. 2009). In order to determine the physical and chemical evolutionary stages of the 61 densest clumps, we have performed observations of the dense molecular gas with the Mopra telescope. To compare the chemical and physical properties of these clumps to other star forming regions in the Galaxy, we used in our observations the same frequency setup as the MALT90 survey (Millimetre Astronomy Legacy Team 90 GHz; Foster et al. 2013; Jackson et al. 2013; Rathborne et al. 2016). The MALT90 survey characterized the physical and chemical evolution of 3246 high-mass star-forming clumps in the inner Galaxy, by observing their molecular line emission in 16 spectral lines. This survey also observed clumps in a range of evolutionary stages, from quiescent pre-stellar clump where star formation has not begun yet, to proto-stellar clumps, having embedded proto-stars, to more evolved HII Regions and clumps associated with Photodisociation Regions (PDRs) (see Jackson et al. 2013, for a detailed description of the clump classification).
2 Observations and data reduction
2.1 The targets
We targeted 61 dense clumps that were selected based on their dust continuum emission at 870 m from the ATLASGAL survey (Schuller et al. 2009; Contreras et al. 2013; Urquhart et al. 2014). The ATLASGAL survey has produced a complete census of dense high-mass clumps over a range of evolutionary stages, ranging from quiescent pre-stellar clumps, showing no emission at infrared wavelengths to those that contain proto-stars and more evolved clumps associated with Hii regions and PDRs. In Carina, ATLASGAL detected 91 870 m compact clumps, of which we targeted the brightest 61 with Mopra, in order to analyse the properties of the accompanying molecular line emission.
The 870 m flux of of the 61 target clumps range from 0.47 to 4.53 Jy Beam-1. Their angular sizes range from 9 to 166″, which at the distance of the Carina Nebula (2.3 kpc; Smith et al. 2010a) corresponds to physical sizes of 0.1 to 1.9 pc, with a mean value of 0.6 pc.
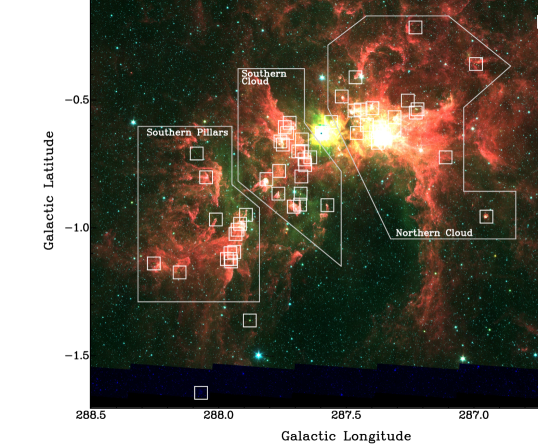
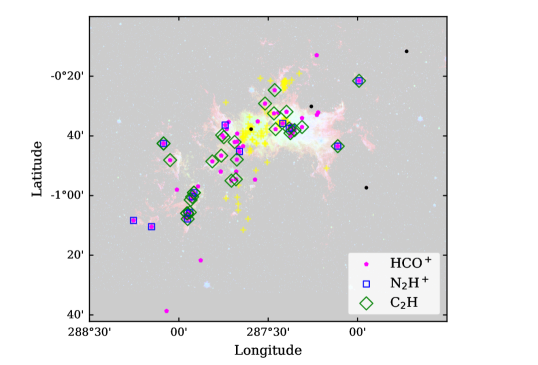
As can be seen in Fig. 1, the clumps are distributed over both the Southern and Northern Clouds as well as the Southern Pillars within the Nebula. The targets also exhibit a range of infrared properties, detected in the Spitzer GLIMPSE bands (Benjamin et al. 2003), which suggests they span a range of evolutionary stages. However, most of the clumps are associated with bright regions of infrared emission, often showing an 8 m excess in the Spitzer GLIMPSE images, which is typically associated with PDRs.
2.2 Observing parameters
Each of the target 61 ATLASGAL clumps was observed using the Mopra telescope and the wide-band Mopra Spectrometer (MOPS) during 17 separate observing days between 2014 Oct 16 and 2015 July 20, and between 2018 April 30 and May 2. We used the same frequency configuration as that used by the MALT90 survey (Jackson et al. 2013), allowing 16 spectral lines near 90 GHz (see Table 1) to be observed simultaneously. The combination of these molecular transitions span a large range of excitation energies (from 5 to 200 K) and critical densities (from 105 to 106 cm-3), tracing distinct physical conditions within the clumps such as high-density gas, hot core chemistry, PDRs, shocks, outflows and ionised gas.
For each of the clumps, we obtained 3′ 3′ maps using on-the-fly mapping (as in the MALT90 survey Jackson et al. 2013). In order to obtain adequate sensitivity, and to minimise striping artefacts, we mapped each source twice, scanning once in Galactic longitude and once in latitude. The telescope scanning rate was 329 s-1 and data was written every two seconds (or every 658). Adjacent scanning rows were spaced by 12″ making these observations oversampled at every frequency (the HPBW at 92 GHz is 37″). A reference observation was made at the end of each scanning row, and was offset by 1 degree in Galactic latitude from the target position. The system temperature was measured twice during each 30 minute map using a paddle scan, which consisted of a room-temperature paddle, that is inserted into the optical path of the telescope. The MOPS spectrometer was configured in its zoom mode which provided 16 137.5 MHz observing bands, each with 4096 spectral channels, corresponding to velocity channels of 0.11 and a velocity coverage of 450 .
At the start of each observing session, and between every 2 maps (once an hour), the pointing of the telescope was corrected by observing a nearby SiO maser, RW Vel, which has a precisely known position. To ensure that the system was working and that the data were consistently calibrated from day to day, a source showing strong emission in a number of the target lines, G 300.968+01.145, was observed each day. This test source was also observed during the MALT90 observations, ensuring that the calibration is also consistent between the two data sets.
| Transition | Rest freq | Eu | ncrit | Type of tracer |
|---|---|---|---|---|
| (MHz) | (K) | (cm-3) | ||
| HCO+ (10) | 89188.526 | 4.28 | Density, kinematics | |
| HCN (10) | 88631.847 | 4.25 | Density | |
| HNC (10) | 90663.572 | 4.35 | Density, cold chemistry | |
| H13CO+ (1-0) | 86754.330 | 4.16 | Optical depth, column density | |
| HN13C (10) | 87090.859 | 4.18 | Optical depth, column density | |
| N2H+ (10) | 93173.772 | 4.47 | Density, chemically robust | |
| C2H (10) 3/21/2 | 87316.925 | 4.19 | Cold gas, Photo dissociation region | |
| SiO (21) | 86847.010 | 6.25 | Shocks, outflows | |
| 13CS (21) | 92494.303 | 6.66 | Optical depth, column density | |
| 13C34S (21) | 90926.036 | 7.05 | Optical depth, column density | |
| CH3CN 5(0)4(0) | 91987.086 | 20.35 | Hot core | |
| HC3N (109) | 90978.989 | 24.01 | Hot core | |
| HC13CCN (109) | 90593.059 | 24.37 | Hot core | |
| HNCO 4(0,4)3(0,3) | 87925.238 | 10.55 | Hot core | |
| HNCO 4(1,3)3(1,2) | 88239.027 | 53.86 | Hot core | |
| H41 | 92034.475 | Ionised gas |
2.3 Data reduction
The data were reduced using a modified version of the same automatic Python script used by MALT90, utilising the ATNF packages asap, livedata, and gridzilla to perform the data reduction (Jackson et al. 2013). In order to minimise artefacts due to noise spikes and ripples, the reference spectrum was smoothed with an 11-channel Hanning smooth before subtraction. For consistency with the MALT90 observations, each spectrum was gridded to a velocity resolution of 0.11 km s-1 during the processing.
The spectra were then co-added and gridded into a uniform 9″ grid. Then, a 12″ Gaussian spatial smooth was applied, resulting in an angular resolution of 38″ for each orthogonal map. Finally, each orthogonal map was combined using the system temperature as a weight to produce a single map for each of the 16 target spectral lines.
The resultant 3′ 3′ maps had a typical rms noise of 0.06 to 0.1 K (1.1 to 1.9 Jy/beam at 90 GHz).
3 Results
3.1 Properties of the molecular line emission
Of the 16 spectral lines observed toward the 61 clumps in Carina, we only detected (above the 3 rms noise limit) molecular line emission from the HCO+, N2H+, HCN, HNC and C2H molecules. These lines have been typically the most frequently detected in other similar line surveys with the Mopra telescope (e.g. Sanhueza et al. 2012). Tentative (at the 2 rms noise level) detections were made of the H13CO+ molecule toward some of the clumps, but we did not detect any emission from any of the other 10 spectral lines observed with Mopra.
For each molecular line detected (above the 3 rms noise limit) we determined the line properties using the pyspeckit package (Ginsburg & Mirocha 2011). For molecules without hyperfine components we fitted Gaussian profiles, determining the peak antenna temperature (T), the velocity () and line velocity dispersion () (see Tables 2 and 3). The full width at half maximum of the line (FWHM) is related to via FWHM. For sources where more than one cloud was observed along the same line of sight, we fitted one Gaussian to each line component. In these cases we have reported the Gaussian fitted line parameters for each of the velocity components.
For the HCN and N2H+ molecular emission that showed hyperfine structure, we simultaneously fitted each hyperfine component. For the HCN molecule we report the antenna temperature (T), the velocity () and line velocity dispersion () of the main central line. For the N2H+ molecule we determined the opacity, the excitation temperature, the velocity () and line velocity dispersion () from the fit.
The line velocity dispersions have values ranging from 0.2 to 6 km -1. These values are larger than the thermal velocity dispersion of the HCO+, N2H+, HCN, HNC and C2H molecules ( km s-1, assuming 30 K). This suggests that the line velocity dispersion values are dominated by non thermal motions, such as turbulence within the clumps.
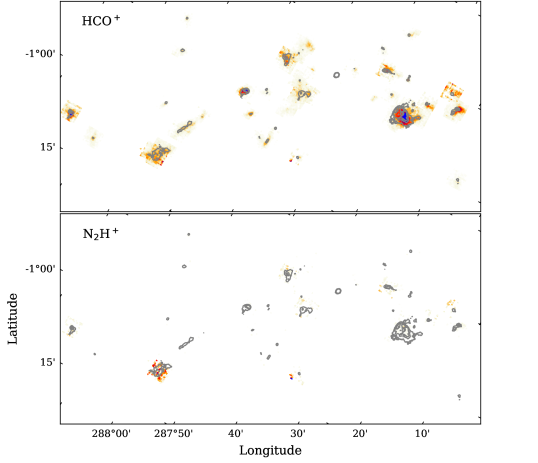
Using a 6 velocity range centered on the fitted molecular line vLSR, integrated intensity maps (moment 0) of the molecular line emission defined as were created. This velocity range was selected as it covers the whole line emission. To create the integrated intensity maps we excluded emission below 1 rms. Figure 2 shows the combined integrated intensity maps for the HCO+ and N2H+ emission for all the target regions. Appendix A shows the remaining integrated intensity maps for the detected molecules, as well as the spectra and fitted lines.
3.2 Physical properties of the clumps
Following the same approach used in the MALT90 survey (Contreras et al. 2017), we used masks generated by the ATLASGAL compact source catalogues (Contreras et al. 2013; Urquhart et al. 2014) to determine the physical extent of each clump. We then used the column density and temperature maps computed by (Rebolledo et al. 2017) across Carina from a SED fitting of the dust continuum emission observed by Herschel, to determine the mass and average temperature of each clump.
The uncertainties in the column density and temperature for each clump are derived as a composite between the accumulated error for each pixel and the standard deviation estimated from all the pixels associated with the clump. To have a more reliable estimation of the average dust temperature in the clumps, and considering that the dust temperature does not change significantly across the clumps, in the dust temperature determination we only included the pixels where the SED fitting algorithm yields values below 20, thus removing regions where our SED model is not a good description of the infrared flux spectral distribution. For more detail about the SED fitting procedure and error estimation, please refer to Rebolledo et al. (2016).
Table 4 shows the physical properties for each clump. The mass of the clumps range from 142 to 3080270 M⊙ with a mean value of 2145 M⊙ (only one source has a a mass 1000 M⊙). Using these masses, and the sizes from the ATLASGAL compact source catalogue, we derived the volume density of each clump, assuming a spherical shape. Their number densities range between (80.7)103 and cm-3, with a mean value of (1.60.5) cm-3.
Assuming the clumps have a star formation efficiency of 30% and following the empirical relationships from (Larson 2003) we can estimate the mass of the most massive star that can be formed in the clump. According to this estimation, only 10 of the 61 clumps ( 16%) will eventually host a high-mass star (star with more than 8 M⊙). This percentage is small considering that in the rest of the Galaxy, following the same assumptions, 82% of the clumps observed by ATLASGAL will potentially form high-mass stars (Contreras et al. 2013). Thus, although most of the clumps are dense enough to form stars, not many have the conditions to form high-mass star in the future.
The temperatures of the clumps are given in Table 4, and range from 20.30.4 to 42.31.8 K with a mean temperature of 26.60.1 K. The hottest clump corresponds to the position of Carina, thus, without considering this region, the rest of the clumps have temperatures up to 34.5 K. In general, for a given clump its temperature ranges within one degree from its reported mean temperature. Comparing these temperatures with the typical temperatures observed for the total MALT90 sample, we find that in general these clumps are relatively warm and they have similar temperatures to those found for HII (mean value of 23.7 K, standard deviation of 5.2 K) and PDRs (mean value of 28.1 K, standard deviation of 5.9 K) regions in the rest of the Galaxy (Guzmán et al. 2015).
3.3 The dense gas in Carina
We compared the distribution of the dense gas, traced by the molecular line emission integrated intensity, to the dust column density and the temperature of the dust computed by (Rebolledo et al. 2017). The integrated intensity maps of the HCO+ emission shows that the dense gas is correlated with dust continuum emission from ATLASGAL (as shown in Fig. 2). We do not detect much N2H+ emission, suggesting that there is no much cold dense gas in this region, or the regions containing N2H+ are very compact, thus we are not able to detect them with Mopra due to beam dilution effects.
Rebolledo et al. (2016) determined the column density toward Carina using three different methods: 1). From the 12CO molecular line emission assuming a constant factor across Carina. 2). From 13CO emission using an LTE approximation and assuming an abundance ratio, and 3) from a SED fitting of the dust continuum emission observed by Herschel, assuming a constant Gas-to-Dust ratio of 100. Rebolledo et al. (2016) found that by comparing the material traced by the CO emission to the total mass reservoir of Carina, the fraction of the molecular gas changes across the Carina complex. In the case of the Northern Cloud, the molecular gas corresponds to (80)% of the total mass in the region. On the other hand, the Southern Cloud whose projected distance to the massive star clusters is similar to the Northern Cloud only has a molecular gas fraction of (50) %. Finally, the gas located in the Southern Pillars is (7035)% molecular, which is expected considering that the Southern Pillars are located farther away from the massive stars.
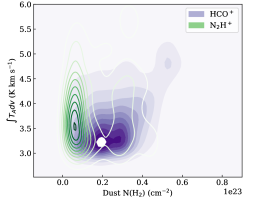
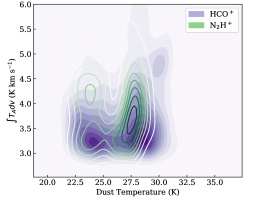
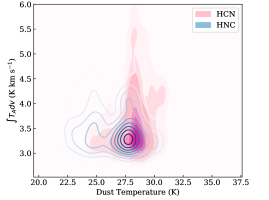
In the regions observed with Mopra, 90% of the gas has column densities cm-2. The most commonly detected molecular emission, HCO+ (1-0), seems to trace slightly denser and hotter material than the other molecules (see Fig. 3). HCO+ trace 85% of the gas with more than cm-2, and all the gas with column densities cm-2. HCN, HNC and N2H+ typically trace the regions where the column density is cm-2, and temperatures of K. In general, we found that the molecular line emission traces well the higher column density gas in Carina.

3.4 Molecular emission of the Carina clumps in the Galactic context
We compared the detection rates of the clumps in Carina to detection rates of the 3246 clumps observed in the Galactic plane as part of the MALT90 survey (Rathborne et al. 2016; Jackson et al. 2013; Foster et al. 2011).
We detect HCO+ emission toward 93% of the Carina clumps, which is comparable to the HCO+ detection rate in MALT90 of 88.5%. The 32% detection rate of the C2H molecule in Carina is also similar to the MALT90 detection rate of 37%. The detection rates of the three other lines that we detected in Carina, HNC, HCN and N2H+, showed much lower detection rates at 52%, 54%, and 23.0%, compared to the detection rates in the MALT90 sample of 87.%, 77.6% and 76.5%.
These detection rates are very different to the detection rates of the total MALT90 sample, which contains clumps that are in a range of evolutionary stages from pre-stellar, protostellar and more evolved clumps located in HII Regions and PDRs. This is surprising, considering that Carina is closer than most of the MALT90 clumps (75% of the MALT90 clumps have kinematic distances kpc, Whitaker et al. 2017)
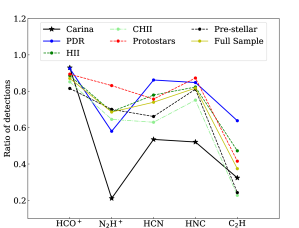
To determine if the detection rates are correlated with the stage of evolution of the clumps, we compared the detection rates found for the clumps in Carina, to the MALT90 detection rates for clumps classified in the different evolutionary stages. Figure 4 shows the MALT90 detection rates as function of evolutionary stage, the detection rate for the full sample and the detection rate in Carina. While the detection rates in Carina are very different in general, having a low detection rate of N2H+, HNC and HCN compared to the rest of the MALT90 clumps, the overall trend of the detection rates is similar to that found for the MALT90 clumps associated with PDR regions.
This suggests that the Carina clumps follow a chemical evolution similar to the MALT90 PDR regions across the Galaxy. This is consistent with previous works that has associated the 8m emission excess, H2 and polycyclic aromatic hydrocarbon (PAH) emission observed in Carina to be consistent with PDRs (Rathborne et al. 2004, 2002; Brooks et al. 2000).
3.5 Kinematics of the clumps
The line profiles can be used to study the kinematics within the clumps. Self-absorption in line profiles of high critical densities of molecular tracers, such as HCO+, can be explained by a warmer excitation temperature in the inner region of clumps. At the centre, the density can be higher and the HCO+ emission can be thermalised; while in the outer envelope the gas density is lower, and the emission can be sub-thermal. Asymmetric self-absorbed profiles are typically associated with radial movement of the gas. In particular, blue-red asymmetries with the blue-shifted peak brighter than the red-shifted peak, are typically explained as a sign of infall, assuming the inner gas in the core has a warmer excitation temperature than the outer envelope.
Thus, to determine whether we detect any signatures of infall toward the clumps we analysed the HCO+ (1-0) line profile. We found that two thirds of the the HCO+ line profiles are Gaussian, suggesting that there are no radial motions within them. For 20 of the 61 clumps we detect asymmetries in their HCO+ profiles (see Figure A2 in Appendix A of the online material). Of these 20 clumps, four of them only have emission detected in HCO+, thus, we cannot confirm whether the asymmetry seen is due to radial motions in the clump, or due to two clumps along the same line of sight with slightly different . In seven clumps, other detected molecules, such as HNC, do not show any self-absorbed profiles, which may be due the higher critical densities of these molecules that prevent the appearance of such profiles. For the remaining nine clumps, self-absorption is also seen in other tracers.
These results suggest that there might be some infall in the clumps, which could be due to current star formation activity, causing the clumps to collapse gravitationally. However, since we do not detect any optically thin tracers toward these clumps we cannot confirm whether the profiles are truly due to infall or are the superposition of different clouds along the line of sight.
4 Discussion
4.1 Are the ATLASGAL clumps in Carina Nebula typical?
We compare the dust temperature, mass, size and volume density of the clumps in Carina with the clumps observed in the Galactic Plane by MALT90. In the following analysis, we have selected the MALT90 clumps that have a kinematic distances between 1 and 3 kpc, to ensure that the physical resolution is similar. In this manner the physical scales of the clumps, and the regions traced by the molecular line emission is similar to what is observed towards Carina. Thus, the total number of clumps used for the following analysis is 204, and they are located at an average distance of 2.48 kpc from us.
Since the detection rate of the molecular lines for the clumps in Carina follows the pattern exhibited by the clumps associated with PDR regions, we also compare the clumps in Carina with the PDRs regions located between 1 and 3 kpc of distance. This corresponds to a sample of 34 MALT90 clumps.
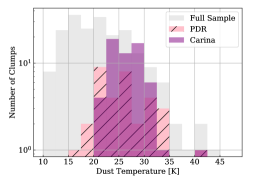
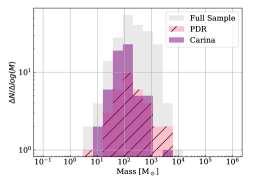
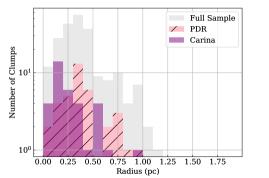
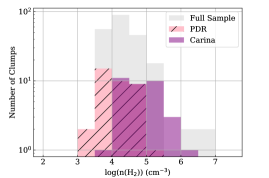
Figure 5 shows an histogram of the physical properties found for the nearby MALT90 clumps, the subsample of nearby clumps classified as PDRs, as well as the clumps in Carina. In general, the clumps in Carina have higher temperatures than the rest of the clumps in the Galactic plane, with a mean temperature of 26.60.1 K, compared to the mean value of 21.20.4 K of the MALT90 clumps. However, they span a similar range in temperatures compared to the clumps associated with PDRs, which are the clumps with the higher mean temperature (25.7 K) in the MALT90 sample (Guzmán et al. 2015).
Also, the clumps in Carina have lower masses (mean mass 2145 M⊙) than both the full sample of nearby MALT90 clumps (mean 508 mass M⊙) and those nearby MALT90 sources associated with PDR regions (mean mass 554 M⊙). However, since the clumps are also on average smaller, with a mean radius of 0.27 pc, compared to the mean of 0.4 pc found for the MALT90 clumps, the clumps in Carina tend to have higher volume densities than the nearby MALT90 PDR regions, having a mean density of 1.6 cm-3 compared to the mean density of 2.4 cm-3.
4.2 Chemistry anomalies in the Carina Nebula
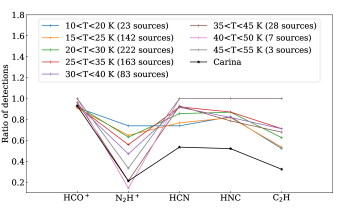
The clumps in Carina shows low detection rates for most of the molecules observed compared to the Galactic clumps observed by MALT90. Since Carina already has high-mass stars that have increased the temperature of their environment, it is possible that this has affected the detection rates observed. Since only 34 clumps are associated with PDRs between 1 and 3 kpc, to analyze the effect of the temperature we analysed the total MALT90 sample of clumps associated with PDRs. In Figure 6 we compare the detection rates of Carina with those of the total MALT90 sample of PDR sources as function of temperature. The detection rate of N2H+ (1-0) does decrease with increasing the temperature of the PDRs, however the detection rates for HCN, HNC and C2H are still lower in Carina.
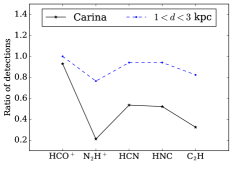
We also compared the detection rates towards PDRs that are located within 1 and 3 kpc (Fig. 6) from us, to determine if by resolving some of the clumps emission we alter the detection rates of the molecular line emission. We found that the detection rates are not affected by the distance of the clumps. In fact, since Carina is closer, we would expect to detect more easily the molecular line emission. These results suggests that there might be differences in the chemistry of the clumps due to the extreme radiation observed in this region.
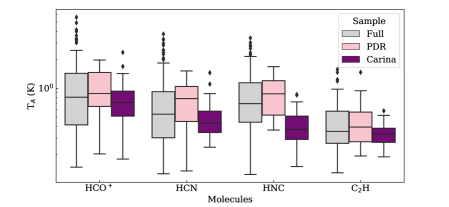
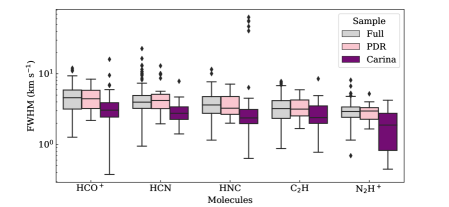
Fig. 7 presents a comparison of the peak antenna temperature and the line-widths of the molecules detected in Carina to both the nearby MALT90 clumps and those in the PDR category, showing that in general the peak antenna temperatures of the Carina sources are within the range of the MALT90 clumps. However all molecules have lower mean values of peak antenna temperature than both the sample of nearby MALT90 clumps and those associated with MALT90 PDRs at similar distance to Carina.
The line-widths of Carina detections are narrower than those found for the nearby MALT90 clumps and the PDRs. Of these molecular lines HCN is expected to have narrower line-widths than the ones found by MALT90 because, unlike MALT90, we could fit well the hyperfine structure for most of the sources. For C2H and N2H+, although still narrower, the line-widths are more similar to that found for all the nearby MALT90 clumps and PDRs. Given that the typical line widths observed are dominated by non-thermal turbulence, for both the clumps in Carina and in the rest of the Galaxy, the narrower line-widths suggest that the clump gas is less turbulent, which might be due to their higher density compared to the MALT90 clumps.
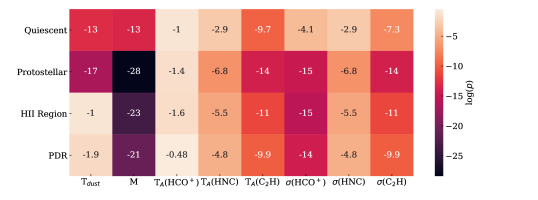
For completeness we also perform KS tests between the physical and chemical properties of the clumps in Carina with the nearby MALT90 clumps as function of evolutionary stage. The KS test indicates the probability of two datasets of being sampled from populations with the same distributions. A small value (e.g. ), indicates that we can reject the hypothesis that both samples are from the same population. Figure 8 show the results of the values of the KS tests. We find that the properties of the clumps in Carina are from a different distribution compared to each of the MALT90 evolutionary classifications.
In general, our observations suggest that the clumps in Carina are chemically and physically different to those found in much of the Galaxy.
4.3 Effect of high-mass stars on its environment
The differences in the physical and chemical properties observed in Carina may be due to the proximity of the clumps to the high-mass stars present in this region.
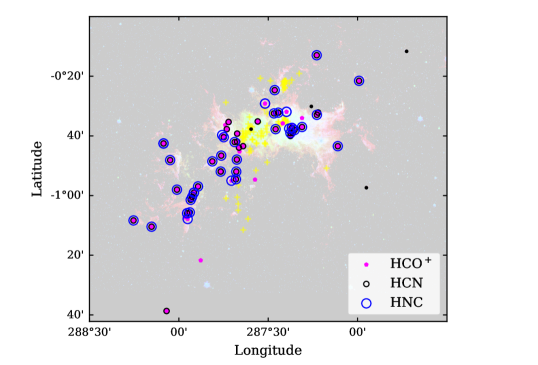
Figure 9 shows the five molecules detected toward Carina overlaid on a three colour image made from the Spitzer GLIMPSE maps, and the position of the high-mass stars in Carina. For C2H, commonly associated to PDRs (e.g. Fuente et al. 1993), but also to the earliest, cold pre-stellar stages (Sanhueza et al. 2013), there is no clear spatial trend. However, most of the detections are in regions that are infrared bright. The few clumps that show detections in N2H+ are mostly located far away from Trumpler 16 (Tr 16), the cluster that contains Carina. The low detection of N2H+ can be explained due to the higher temperature of the gas that surrounds the massive stars (evident in the temperatures we derived and also shown in Rebolledo et al. 2016). CO is the main destroyer of N2H+ in the gas phase (see Caselli et al. 1999). Thus, as the temperature increases, the CO depleted into the dust grain evaporates, thus lowering the amount of the N2H+ molecule present in this region.
For the HNC and HCN molecules, we found that most of the clumps that have no detection in either HNC or HCN are also located very close to Tr 16, with several clumps showing only HCN emission in the vicinities of Tr 16. A higher temperature of the gas in this region could explain the lack of HNC, since it can be destroyed by the reactions HNC + O CO + NH or HNC + H HCN +H, that can occur at the typical high densities observed in this region.
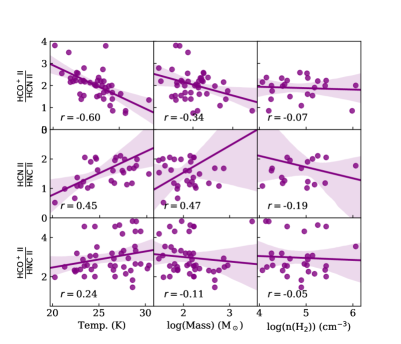
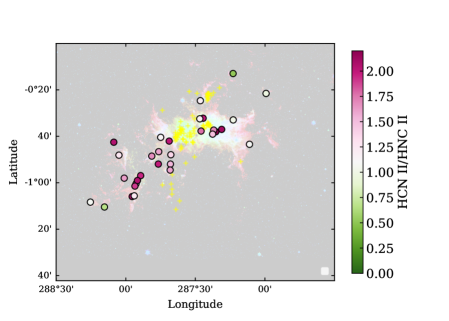
The relative abundance ratio of HCN to HNC [X(HCN)/X(HNC)] has been observed to increase as the temperature raises (Goldsmith et al. 1981; Churchwell et al. 1984; Hirota et al. 1998; Tennekes et al. 2006; Hoq et al. 2013; Rathborne et al. 2016). We assumed that the HNC and HCN emission is optically thin (we cannot verify this as no emission from isotopologues have been measured), and used the ratio of their integrated intensities (II) to determine if there is a trend between these molecules and the clump dust temperatures. To determine any trends, we computed the Pearson correlation coefficient (PCC) between the ratio of the HCN II to the HNC II and the temperature. The PCC is a measure of the linear correlation between two variables, where where 1 and -1 are total positive and negative linear correlation respectively and 0 is no linear correlation. For the clumps in Carina, we found a PCC of 0.45 between the ratio of the HCN II to the HNC II and the temperature, which suggest that there is slight correlation (see Fig. 10). The average HCN II to HNC II ratio is 1.63, and a few clumps have a ratio lower than 1. It is expected that the ratio of HCN II to HNC II be lower than that in PDR regions dominated by X-ray radiation. In Carina most of the X-ray radiation is concentrated near the regions surrounding Carina (Preibisch et al. 2017), however the clumps that show a low HCN II to HNC II ratio are located outside the region dominated by X-ray radiation, thus the X-ray radiation cannot explain these low ratios (see Fig. 11).
The low detection in N2H+ and HNC are therefore consistent with the high temperature of the gas around Tr 16, where the temperatures might be higher than the dust temperatures measured in this region.
4.4 Masers and the Carina Nebula
Masers are prevalent in regions of star formation, particularly from the most common transitions of water, methanol and OH (e.g. Breen et al. 2010; Green et al. 2017; Voronkov et al. 2014; Qiao et al. 2016). Some masers, like the 6.7-GHz methanol maser, are exclusively associated with high-mass star formation (e.g. Minier et al. 2003; Xu et al. 2008; Breen et al. 2013) and are therefore especially useful in the study of these sources. The Methanol Multibeam Survey (MMB; Green et al. 2009) searched the southern Galactic plane for 6.7-GHz methanol masers, detecting 972 sources to a 3- detection limit of 0.51 Jy within the survey bounds of 186∘60∘, 2∘. However, despite completely covering the Carina Nebula, the MMB survey failed to detect a single source within it (Green et al. 2012), which is surprising given the prominent, ongoing star formation (e.g. Smith et al. 2010b; Gaczkowski et al. 2013). In regions of prominent star formation the MMB survey detected as many 17 sources per degree of longitude (Breen et al. 2015) so naively it seems reasonable to expect there to be detectable 6.7-GHz methanol masers in Carina, especially given its close proximity.
The Carina Nebula has also been completely searched for excited-state OH masers at 6035-MHz as part of the MMB survey (Avison et al. 2016) but no detections were made. This search revealed 127 of these masers across the entire survey field and so their absence in Carina is somewhat less surprising than for the 6.7-GHz methanol masers. Other searches for ground-state OH masers have not covered the entirety of the Nebula, but have also failed to reveal any emission (e.g. Caswell & Haynes 1987).
Surveys for water masers have been somewhat more successful, with five sources currently known within the Nebula (Breen et al. 2018a; Scalise & Alcina Braz 1980; Caswell et al. 1989), even though sensitive searches for water masers have covered far less of Carina than the unsuccessful searches for 6.7-GHz methanol and 6035-MHz excited-state OH masers. (Breen et al. 2018a) suggested that this is consistent with there being few young high-mass stars present in Carina (since water masers are somewhat easier to produce and their presence is not as closely tied to the mass of the young stars), a finding also reflected in Povich et al. (2011) and Gaczkowski et al. (2013).
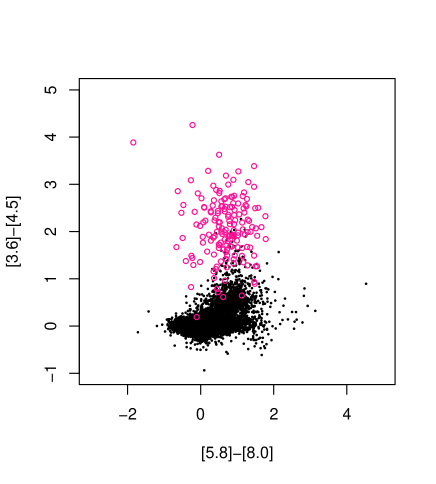
Similarly to Breen et al. (2018a) who compared the GLIMPSE point source colours of water maser associated sources across the Galaxy to the colours of the GLIMPSE point sources located in the Carina Nebula, Fig. 12 shows the colours of methanol maser associated GLIMPSE point sources in the Galaxy (from Breen et al. 2011) compared to those point sources in Carina. There are only 23 sources in Carina that have [3.6][4.5]1.5, a characteristic held by 81 per cent of the GLIMPSE associated methanol maser sources in Fig. 12. For comparison, in a portion of the Galactic plane covering one-quarter of the area and including no comparably prominent regions of star formation (within a 30 arcmin radius of G 326.5+0), there are 35 GLIMPSE point sources with [3.6][4.5]1.5 (i.e. over six times as many). This reflects what is shown in Fig. 12, while there is some overlap between the methanol maser associated sample and those in Carina, compared to other locations in the Galaxy, there are few sources with a significant 4.5-m excess.
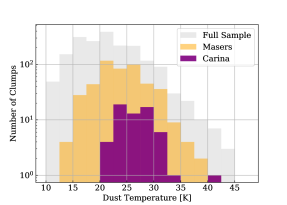
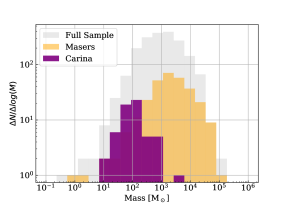
We have compared the locations of the 6.7-GHz methanol masers from the MMB survey (Green et al. 2012) to the clumps observed in MALT90, using the HPBW of the MALT90 observations as an association threshold. To within this threshold there are 474 of the 3246 MALT90 clumps coincident with one or more 6.7-GHz methanol masers. Fig. 13 shows the distributions of the calculated temperatures and masses of the sources in the total MALT90 sample, those MALT90 sources associated with sources from the MMB, and those sources located within the Carina Nebula. As can be seen, the maser-associated sources generally have lower temperatures (mean temperature 24.40.1) and higher masses (mean mass 6000 M⊙) than the majority of sources found in the Carina Nebula (mean temperature of 26.60.1 K, mean mass 2145 M⊙).
The temperatures and masses that we have derived for the maser associated sources are similar to those found in separate studies. Breen et al. (2018b) found that the far-infrared dust temperatures (calculated in work by Guzmán et al. (2015)) of sources associated with 6.7-GHz sources had mean and median temperatures lower than 25 K. Urquhart et al. (2013) investigated the mass distribution of ATLASGAL clumps associated with 6.7-GHz methanol masers, finding that the peak of the distribution fell in the 2000 - 3000 M⊙ range, which is greater than the mass range of ATLASGAL clumps in Carina, aside from the one clump that has a mass of 3080 M⊙ (see Fig. 13). While it is clear that there is overlap between the the temperature and mass distributions of the clumps exhibiting 6.7-GHz methanol masers in other parts of the Galaxy with those clumps located in the Carina Nebula, the properties of the majority of the clumps in Carina tend to be warmer and less massive than those commonly associated with 6.7-GHz methanol masers in other parts of the Galaxy.
We have also compared the molecular line properties of the MALT90 sources associated with 6.7-GHz methanol masers with those sources in Carina. The maser associated MALT90 clumps show slightly higher detection rates for all five lines shown in Figures 2 and A1 than the total MALT90 sample, meaning that there is an even larger detection rate discrepancy between the maser associated sources and those in Carina. Furthermore, we find that there is a tendency for the maser associated sources to account for relatively fewer of the weaker MALT90 detections. The line ratio of HCN to HNC has been previously shown to increase with evolution (e.g Hoq et al. 2013; Rathborne et al. 2016), likely because HNC is more abundant in less evolved clumps. We find that the sources in Carina have line ratios that fall within the range of HCN to HNC ratios of clumps with methanol masers, suggesting that the clumps are not at an evolutionary stage that would preclude associations with methanol maser emission.
5 Summary
We performed observations of 16 spectral lines toward 61 clumps in Carina with the Mopra telescope. Observations of the dust continuum emission toward these clumps suggest that their masses are consistent with low and intermediate star forming clumps. Following the empirical relationship of Larson (2003), we analyse whether these clumps have sufficient mass to form high-mass stars, finding that only 10% of them have enough mass to potentially evolve to host high-mass stars.
The molecular line emission shows very low detection rates compared to the total MALT90 sample of clumps observed in the Galactic Plane. Dividing the clumps into evolutionary stages, following the MALT90 classification, we found that the detection rates are more consistent with those associated with PDRs. However, the detection rates are still low for most of the molecules.
By subdividing the PDR clumps sample into temperature bins, we found that the N2H+ low detection rate is similar to PDR clumps with high dust temperature clumps (T K).
We also found that in general the peak antenna temperatures and line width of the molecular line emission are smaller in the Carina region compared to the rest of Galactic clumps.
Comparing the spatial distribution of the clumps within Carina, we found that the clumps that showed N2H+ emission, are usually far away (, 13 pc at a distance of 2.3 kpc) from Carina, and therefore, in regions where the radiation from the star is not enough to drastically increase the dust temperature of the clumps. A similar behavior is seen for HNC, which is not detected in the vicinity of Carina. These results suggest that the temperature of the gas might be higher than the dust temperature measured in this region.
To understand the lack of 6.7-GHz maser emission in Carina, we compared the properties of the clumps in Carina to MALT90 clumps associated 6.7-GHz methanol masers emission. We found that the clumps in Carina are warmer and less massive than those commonly associated with 6.7-GHz methanol masers in other parts of the Galaxy. Moreover, while most of the clumps associated to 6.7-GHz methanol masers in MALT90 have a higher detection rate in the four main molecules HCO+, N2H+, HNC and HCN, the detection rates of these molecules in Carina are very low for N2H+, HNC and HCN. Such discrepancy, can be due to the extreme radiation field produced by Carina on its environment.
Acknowledgements
We thank our referee Anita Richards for valuable comments that have improved considerably the quality of our paper. This research made use of Astropy,111http://www.astropy.org a community-developed core Python package for Astronomy (Astropy Collaboration et al. 2013; Price-Whelan et al. 2018).
| Name | 870 m | HCO+ | HCN | HNC | ||||||
|---|---|---|---|---|---|---|---|---|---|---|
| Peak Flux | T | T | T | |||||||
| kms-1 | kms-1 | kms-1 | kms-1 | kms-1 | kms-1 | |||||
| AGAL286.72600.194 | 1.25 | |||||||||
| AGAL286.95100.956 | 0.74 | |||||||||
| AGAL286.99200.359 | 0.80 | p m 0.03 | p m 0.03 | p m 0.03 | p m 0.02 | p m 0.02 | p m 0.02 | p m 0.04 | p m 0.04 | p m 0.04 |
| AGAL287.11100.724 | 1.00 | p m 0.03 | p m 0.05 | p m 0.05 | ||||||
| AGAL287.22100.536 | 2.10 | p m 0.04 | p m 0.04 | p m 0.04 | p m 0.02 | p m 0.04 | p m 0.04 | |||
| Name | N2H+ | C2H | |||||
|---|---|---|---|---|---|---|---|
| Tex | T | ||||||
| kms-1 | kms-1 | kms-1 | kms-1 | ||||
| AGAL286.72600.194 | |||||||
| AGAL286.95100.956 | |||||||
| AGAL286.99200.359 | p m 0.10 | p m 6.89 | p m 0.04 | p m 0.03 | p m 0.04 | p m 0.08 | p m 0.08 |
| AGAL287.11100.724 | |||||||
| AGAL287.22100.536 | |||||||
| Name | Mass | Dust Temperature | Radius | Density | Profile asymmetry |
|---|---|---|---|---|---|
| (M⊙) | (K) | (pc) | 104 (cm-3) | ||
| AGAL286.72600.194 | p m 6 | p m 0.5 | p m 0.01 | p m 6.3 | |
| AGAL286.95100.956 | p m 3 | p m 0.8 | p m 0.01 | p m 0.6 | |
| AGAL286.99200.359 | p m 7 | p m 0.5 | |||
| AGAL287.11100.724 | p m 7 | p m 0.5 | 1.0 | ||
| AGAL287.22100.536 | p m 20 | p m 0.7 | p m 0.01 | p m 0.7 |
References
- Astropy Collaboration et al. (2013) Astropy Collaboration et al., 2013, aap, 558, A33
- Avison et al. (2016) Avison A., et al., 2016, MNRAS, 461, 136
- Benjamin et al. (2003) Benjamin R. A., et al., 2003, PASP, 115, 953
- Breen et al. (2010) Breen S. L., Caswell J. L., Ellingsen S. P., Phillips C. J., 2010, MNRAS, 406, 1487
- Breen et al. (2011) Breen S. L., Ellingsen S. P., Caswell J. L., Green J. A., Fuller G. A., Voronkov M. A., Quinn L. J., Avison A., 2011, ApJ, 733, 80
- Breen et al. (2013) Breen S. L., Ellingsen S. P., Contreras Y., Green J. A., Caswell J. L., Stevens J. B., Dawson J. R., Voronkov M. A., 2013, MNRAS, 435, 524
- Breen et al. (2015) Breen S. L., et al., 2015, MNRAS, 450, 4109
- Breen et al. (2018a) Breen S. L., Green C.-E., Cunningham M. R., Voronkov M. A., Horiuchi S., Green J. A., 2018a, MNRAS, 473, 2
- Breen et al. (2018b) Breen S. L., et al., 2018b, MNRAS, 474, 3898
- Brooks et al. (2000) Brooks K. J., Burton M. G., Rathborne J. M., Ashley M. C. B., Storey J. W. V., 2000, MNRAS, 319, 95
- Caselli et al. (1999) Caselli P., Walmsley C. M., Tafalla M., Dore L., Myers P. C., 1999, ApJ, 523, L165
- Caswell & Haynes (1987) Caswell J. L., Haynes R. F., 1987, Australian Journal of Physics, 40, 215
- Caswell et al. (1989) Caswell J. L., Batchelor R. A., Forster J. R., Wellington K. J., 1989, Australian Journal of Physics, 42, 331
- Churchwell et al. (1984) Churchwell E., Nash A. G., Walmsley C. M., 1984, ApJ, 287, 681
- Contreras et al. (2013) Contreras Y., et al., 2013, A&A, 549, A45
- Contreras et al. (2017) Contreras Y., Rathborne J. M., Guzman A., Jackson J., Whitaker S., Sanhueza P., Foster J., 2017, MNRAS, 466, 340
- Foster et al. (2011) Foster J. B., et al., 2011, ApJS, 197, 25
- Foster et al. (2013) Foster J. B., et al., 2013, PASA, 30, e038
- Fuente et al. (1993) Fuente A., Martin-Pintado J., Cernicharo J., Bachiller R., 1993, A&A, 276, 473
- Gaczkowski et al. (2013) Gaczkowski B., Preibisch T., Ratzka T., Roccatagliata V., Ohlendorf H., Zinnecker H., 2013, A&A, 549, A67
- Ginsburg & Mirocha (2011) Ginsburg A., Mirocha J., 2011, PySpecKit: Python Spectroscopic Toolkit, Astrophysics Source Code Library (ascl:1109.001)
- Goldsmith et al. (1981) Goldsmith P. F., Langer W. D., Ellder J., Kollberg E., Irvine W., 1981, ApJ, 249, 524
- Green et al. (2009) Green J. A., et al., 2009, MNRAS, 392, 783
- Green et al. (2012) Green J. A., et al., 2012, MNRAS, 420, 3108
- Green et al. (2017) Green J. A., et al., 2017, MNRAS, 469, 1383
- Guzmán et al. (2015) Guzmán A. E., Sanhueza P., Contreras Y., Smith H. A., Jackson J. M., Hoq S., Rathborne J. M., 2015, ApJ, 815, 130
- Hirota et al. (1998) Hirota T., Yamamoto S., Mikami H., Ohishi M., 1998, ApJ, 503, 717
- Hoq et al. (2013) Hoq S., et al., 2013, ApJ, 777, 157
- Jackson et al. (2013) Jackson J. M., et al., 2013, PASA, 30, 57
- Larson (2003) Larson R. B., 2003, Reports on Progress in Physics, 66, 1651
- Minier et al. (2003) Minier V., Ellingsen S. P., Norris R. P., Booth R. S., 2003, A&A, 403, 1095
- Povich et al. (2011) Povich M. S., et al., 2011, ApJS, 194, 14
- Preibisch et al. (2011) Preibisch T., et al., 2011, A&A, 530, A34
- Preibisch et al. (2017) Preibisch T., Flaischlen S., Gaczkowski B., Townsley L., Broos P., 2017, A&A, 605, A85
- Price-Whelan et al. (2018) Price-Whelan A. M., et al., 2018, aj, 156, 123
- Qiao et al. (2016) Qiao H.-H., et al., 2016, ApJS, 227, 26
- Rathborne et al. (2002) Rathborne J. M., Burton M. G., Brooks K. J., Cohen M., Ashley M. C. B., Storey J. W. V., 2002, MNRAS, 331, 85
- Rathborne et al. (2004) Rathborne J. M., Brooks K. J., Burton M. G., Cohen M., Bontemps S., 2004, A&A, 418, 563
- Rathborne et al. (2016) Rathborne J. M., et al., 2016, PASA, 33, e030
- Rebolledo et al. (2016) Rebolledo D., et al., 2016, MNRAS, 456, 2406
- Rebolledo et al. (2017) Rebolledo D., et al., 2017, preprint, (arXiv:1708.02864)
- Sanhueza et al. (2012) Sanhueza P., Jackson J. M., Foster J. B., Garay G., Silva A., Finn S. C., 2012, ApJ, 756, 60
- Sanhueza et al. (2013) Sanhueza P., Jackson J. M., Foster J. B., Jimenez-Serra I., Dirienzo W. J., Pillai T., 2013, ApJ, 773, 123
- Scalise & Alcina Braz (1980) Scalise Jr. E., Alcina Braz M., 1980, A&A, 85, 149
- Schuller et al. (2009) Schuller F., et al., 2009, A&A, 504, 415
- Smith (2002) Smith N., 2002, MNRAS, 331, 7
- Smith & Brooks (2007) Smith N., Brooks K. J., 2007, MNRAS, 379, 1279
- Smith et al. (2010a) Smith N., Bally J., Walborn N. R., 2010a, MNRAS, 405, 1153
- Smith et al. (2010b) Smith N., et al., 2010b, MNRAS, 406, 952
- Tennekes et al. (2006) Tennekes P. P., Harju J., Juvela M., Tóth L. V., 2006, A&A, 456, 1037
- Urquhart et al. (2013) Urquhart J. S., et al., 2013, MNRAS, 431, 1752
- Urquhart et al. (2014) Urquhart J. S., et al., 2014, A&A, 568, A41
- Voronkov et al. (2014) Voronkov M. A., Caswell J. L., Ellingsen S. P., Green J. A., Breen S. L., 2014, MNRAS, 439, 2584
- Whitaker et al. (2017) Whitaker J. S., Jackson J. M., Rathborne J. M., Foster J. B., Contreras Y., Sanhueza P., Stephens I. W., Longmore S. N., 2017, AJ, 154, 140
- Xu et al. (2008) Xu Y., Li J. J., Hachisuka K., Pandian J. D., Menten K. M., Henkel C., 2008, A&A, 485, 729