Elastic modulus and yield strength of semicrystalline polymers with bond disorder are higher than in atomic crystals
Abstract
We perform thorough molecular-dynamics simulations to compare elasticity and yielding of atomic crystals and model semicrystalline polymers, the latter characterized by very similar positional ordering with respect to atomic crystals and considerable bond disorder. We find that the elastic modulus , the shear yield strength, , and the critical yield strain of semicrystalline polymers are higher than ( , ), or comparable to (), the corresponding ones of atomic crystals. The findings suggest that the bond disorder suppresses dislocation-mediated plasticity in polymeric solids with positional order.
keywords: Molecular-dynamics simulations, elasticity, plasticity, semicrystalline polymers
1 Introduction
Elasticity theories [1, 2, 3, 4] predict that solid materials respond linearly with elastic modulus to small shear deformations. Upon increasing strain, amorphous solids show complex and far from linear behavior [5, 6, 7]. When a critical yield strain is reached, corresponding to the shear yield strength , the transition from the (reversible) elastic state to the (irreversible) plastic state takes place [8, 9, 10]. In an ideal elasto-plastic body (Hooke-St.Venant) is the maximum stress [8].
It is well-known that plasticity in crystalline solids results from the structure and the mobility of defects (in particular dislocations) [11]. Dislocations do not exist in amorphous polymers, but, under an applied stress, elementary shear displacements can occur in a spatially correlated linear domain which can close on itself to form a loop to be interpreted in terms of classical dislocation mechanics and energetics [12, 13, 8, 14]. However, even if the model can be used to fit the experimental data, there are conceptual problems to extend dislocation based concepts to glassy polymers [15, 16]. That difficulty is part of the complexities involved in the phenomenon of plastic deformation in glassy polymers which is not yet fully understood, in spite of many accurate phenomenological models, see e.g. refs. [15, 8] for comprehensive reviews. In particular, Argon considered a scenario where individual chains are embedded in an elastic continuum [15]. He argued that plastic deformation is caused by the cooperative rearrangements of a cluster of segments with size . The latter region is thermally activated under the applied stress to overcome the resistance that is generated from elastic interaction of the polymer chain with its surroundings. is significantly smaller than the activation volume of dislocations [15, 8]. The concept of localized cooperative rearrangements was proven to be fruitful also to account for the plasticity of non-polymeric glasses [15]. It was found that is much smaller in amorphous metals with respect to glassy polymers. In comparison with the plasticity of crystalline solids, where the long-range positional order permits the translation of dislocations, the plasticity of disordered solids is mainly driven by the activation of cooperative rearrangements within the cluster of segments [15, 17].
The previous discussion highlights that there are strong differences in the microscopic mechanisms of plasticity of atomic crystals and polymeric glasses. These two classes of materials differ in two rather distinct aspects, namely the connectivity and the positional ordering. Since these two features cannot be thought of as mutually independent and may exhibit antagonism, singling out the role of each of them is of interest. As a first step along this direction, the present paper aims at elucidating the role of connectivity into the linear and non-linear deformation of solids with different connectivity and rather similar positional order. Influence of connectivity outside the elastic limit has been recently reviewed [18]. Our study considers atomic crystals and polymer semicrystals, the latter with very similar positional ordering and considerable bond disorder to average out the coupling between connectivity and positional order [19, 20]. We find that the elastic modulus , the shear yield strength, , and the critical yield strain of polymeric semicrystals are higher than ( , ), or comparable to (), the corresponding ones of atomic crystals. The results show that the introduction of disordered connectivity perturbs the long-range order, most presumably suppressing dislocation-mediated plasticity, and then increases the shear strength. In this sense, if positional order is present, atomic and polymeric plasticity appear to be not reconcilable. It is worth noting that that the previous conclusion does not hold for glassy systems where, e.g., the plasticity of polymeric and atomic glasses with different connectivity exhibits similarities [21].
2 Methods
Molecular-dynamics (MD) numerical simulations were carried out on two different systems, i.e. a melt of linear polymers and an atomic liquid.
As to the polymer systems, a coarse-grained polymer model of linear, fully-flexible, unentangled chains with monomers per chain is considered [19]. The total number of monomers is . Non-bonded monomers at distance belonging to the same or different chain interact via the truncated Lennard-Jones (LJ) potential:
| (1) |
is the position of the potential minimum with depth . The value of the constant is chosen to ensure at . The bonded monomers interaction is described by an harmonic potential :
| (2) |
The parameters and have been set to and respectively [22]. Full-flexibility of the chain is ensured by the missing bending stiffness between adjacent bonds [20]. It must be pointed out that the bond length prevents the significant heterogeneity of the monomer arrangements which is seen with longer bond length, see Fig.6a of ref. [20].
As to the atomic systems we consider systems of atoms interacting with the truncated Lennard-Jones potential as in Eq. 1.
From this point on, all quantities are expressed in term of reduced units: lengths in units of , temperatures in units of (with the Boltzmann constant) and time in units of where is the monomer mass. We set . Periodic boundary conditions are used. The study was performed in the ensemble (constant number of particles, pressure and temperature). The integration time step is set to time units [23, 24, 25, 26] The simulations were carried out using LAMMPS molecular dynamics software (http://lammps.sandia.gov) [27].
Fifty-six polymeric samples with initial different random monomer positions and velocities are equilibrated at temperature and pressure , corresponding to number density . That thermodynamic states allows the polymer melt to equilibrate in the liquid phase for at least three times the average reorientation time of the end-end vector of the chain. After the equilibration, production runs started and proceeded up to the spontaneous onset and the full development of the crystallization of the samples. Fourteen runs failed to crystallize in a reasonable amount of time, while forty-two of them underwent crystallization forming polymorph crystals with distorted body-centered cubic (Bcc) lattices. Additional details, in particular concerning the crystallization process, are given elsewhere [19]. Sixty-four atomic liquid runs were equilibrated with starting temperature and pressure . The temperature is higher in the atomic systems to avoid crystallization before the initial equilibration of the liquid phase, as the absence of polymer bonds facilitates the transition to the solid phase. The pressure ensures similar densities in the polymeric and atomic liquids. After equilibration for several relaxation times in the liquid phase, fifty-one runs spontaneously crystallized into two well defined classes. Seventeen runs formed solids quite close to face-centered cubic (Fcc) crystals and thirty-four runs formed Bcc-like atomic crystals. See sec. 3 for a detailed discussion. The remaining thirteen runs reached a variety of metastable solid-like conformations and were discarded.
After completion of the solidification, all the systems were quenched to temperature and pressure in a time and, in agreement with others [29], later allowed to relax with an NPT run to let the total energy stabilize. The latter run lasted for a total time . The final densities of the polymeric and atomic Bcc-like solids are and , respectively. The density offset is due to the different connectivity, having both solids the same pressure ( ) and temperature ( ).
Simple shear deformations of the resulting athermal solids were performed via the Athermal Quasi-Static (AQS) protocol outlined in ref. [29]. An infinitesimal strain increment is applied to a simulation box of side containing the sample, after which the system is allowed to relax in the nearest local energy minimum with a steepest descent minimization algorithm. The accurate localization of the state corresponding to a local energy minimum ensures force equilibration on each particle, i.e. mechanical equilibration. The procedure is repeated until a total strain of is reached. Simple shear is performed independently in the planes (, , ), and at each strain step in the plane the corresponding component of the macroscopic stress tensor is taken as the average value of the per-monomer stress :
| (3) |
In an athermal system the expression of the per-monomer stress in the atomic representation is [30]:
| (4) |
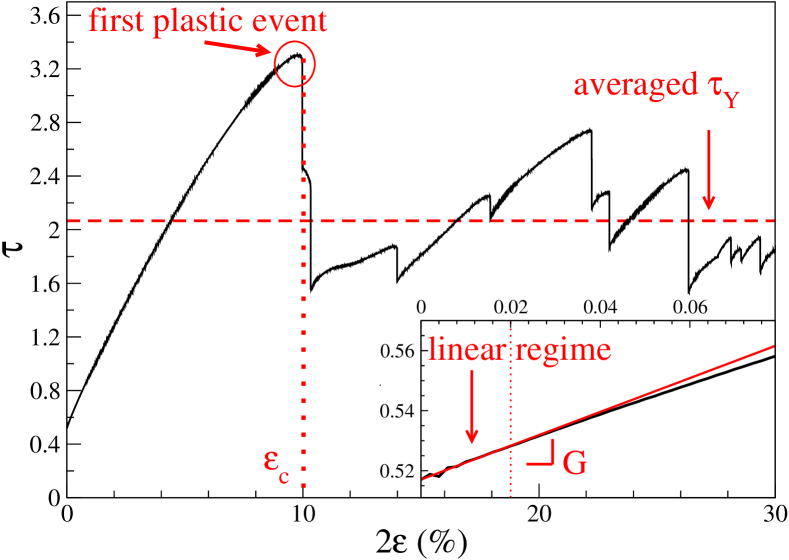
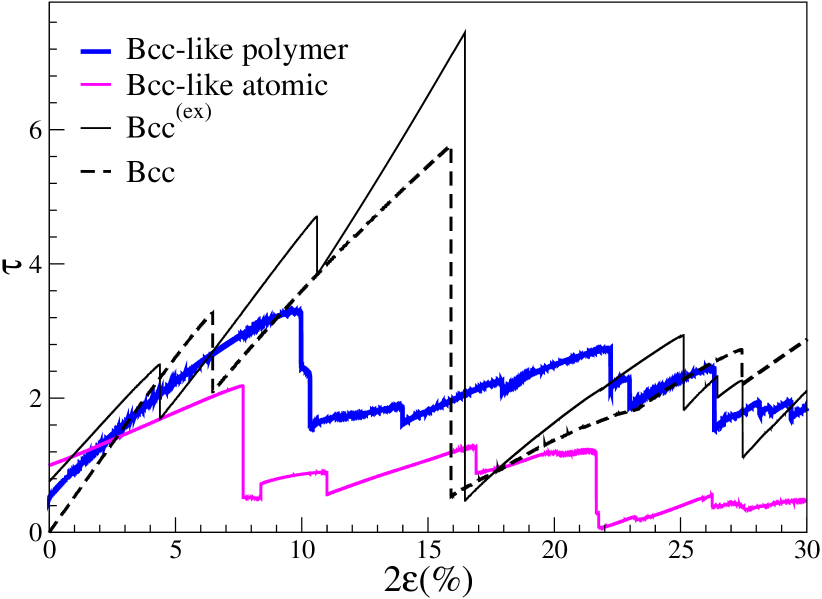
where and are the components of the force between the th and the th monomer and their separation, respectively, and is the average per-monomer volume, i.e. . For each plane a stress-strain curve is collected, an illustrative example of which is given in Fig.1.
Fig.1 is quite analogous to what reported for many other systems under athermal conditions [31, 32, 33, 34, 35, 36] with an initial linear increase followed by increasing bending and onset of the plastic regime. In particular, similarly to other MD studies of glassy polymers [37], one notices that, in the plastic regime, the stress levels off to a plateau with fluctuations caused by subsequent loading phases and sudden stress drops. We point out that the initial non-zero stress in the unstrained solid seen in Fig.1 is a well-known phenomenon usually ascribed to the limited size of the simulation cell [38].
We measured the shear elastic modulus as the slope of the stress-strain curve in the linear regime, within a strain threshold of , where the relation holds, see Fig.1 (inset). Following Ref. [28], the yield stress is taken as the average value of the stress after the first significant plastic event, defined as the first stress drop of at least occurring at the critical strain , see Fig.1. This choice is consistent with other definitions in the presence [10], or not [9], of strain softening, i.e. the reduction in stress following yield. The results are robust with respect to changes of .
3 Results and discussion
3.1 Solidification of the polymeric and the atomic liquids
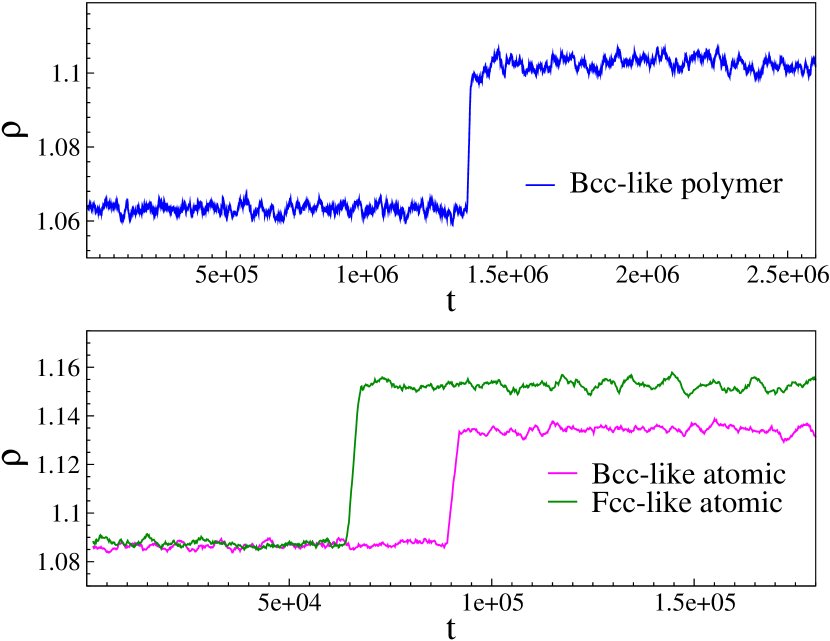
Fig.2 plots typical runs during which solidification of the polymeric (top) and atomic (bottom) systems takes place. A single run is reported for each system under consideration. The crystallization is evidenced by the sudden increase of the density. Note that in the atomic liquids the size of the jump depends on the final crystalline state, as expected owing to the better packing of the Fcc lattice with respect to the Bcc one. The detailed characterization of the polymorphic structure of the polymer solid is reported elsewhere [19]. Notice that the jump is smaller for polymers () than atomic liquids () even if the polymer melt has lower density. The finding agrees with the expectation that high packing density is incompatible with connected structures [39, 18].
3.2 Pre-shear structure of the athermal solids
We now characterize the structure of the athermal solids before the shear deformation takes place.
To this aim, we compute the order parameters defined by Steinhardt et al. [40]. One considers the polar and azimuthal angles and of the vector joining the -th central monomer with the -th one belonging to the neighbors within a preset cutoff distance [40]. is a convenient definition of the first coordination shell size [41]. To define a global measure of the order in the system, one then introduces the quantity:
| (5) |
where is the number of bonds of -th particle, is the total number of particles in the system, denotes a spherical harmonic and is the total number of bonds:
| (6) |
The global orientational order parameter is defined by:
| (7) |
The above quantity is invariant under rotations of the coordinate system and takes characteristic values which can be used to quantify the kind and the degree of rotational symmetry in the system [40]. In the absence of large-scale order, the bond orientation is uniformly distributed around the unit sphere and is rather small [42]. On the other hand, is very sensitive to any kind of crystallization and increases significantly when order appears [43]. A local orientational parameter can also be defined. We define the auxiliary quantity
| (8) |
The local order parameter is defined as [40]:
| (9) |
In general . In the presence of ideal order, all the particles have the same neighborhood configuration, and the equality follows.
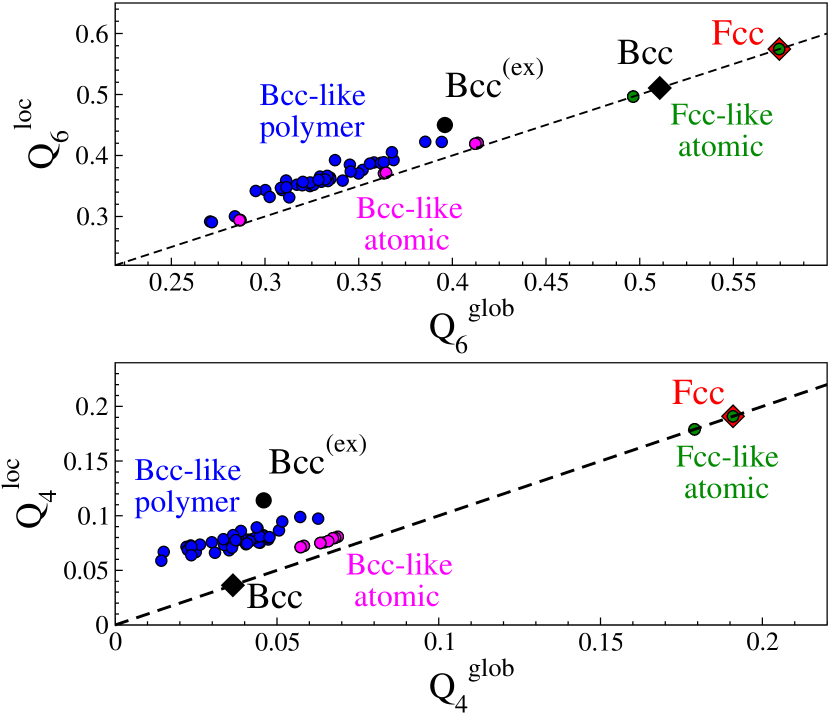
Cross correlations between and with proved to be rather useful to characterize the order of the solid phases [19]. Fig.3 plots the cross-correlations for (top) and (bottom) for all the solids under study. To increase the readability, the plots also present the pairs with corresponding to the ideal Bcc and Fcc atomic lattices. In addition, since the Bcc lattice is known to be less stable then the Fcc one [44, 45, 19], the pairs with of a Bcc excited crystal are also presented. The latter is obtained by heating the ideal Bcc crystal to temperature with and, after short equilibration, quenching it at , . The structure of the artificial excited atomic crystal, henceforth to be referred to as Bcc(ex), was found to be nearly the same between . The rationale behind the consideration of the Bcc(ex) crystal is that the lack of stability of the ideal Bcc structure leads to significant deformations of the ordered structure obtained after the spontaneous crystallization [19]. In this respect, it seems more proper to compare our athermal solids with the athermal Bcc(ex) solid rather than to the ideal Bcc one. The excitation of the Bcc lattice has been performed by using 8 different statistical configurations changing the velocities assigned to the particles to detect the possible presence of statistical differences between the runs. Such differences were not found in the structural analysis of the systems, but appear in elasticity and plasticity (see sec. 3.3). Excitation was also tested on the Fcc lattice at the same temperature , but no differences with the ideal structure were observed after the quench. The latter finding is consistent with the higher stability of the Fcc lattice with respect to the Bcc one [44, 45, 19].
Examination of Fig.3 leads to the following conclusions concerning the structure of the athermal solids before their deformation:
-
1.
solids are highly ordered since their characteristic points are close to the bisector;
-
2.
atomic solids are either Fcc-like crystals or Bcc-like crystals. The former are quite close to the ideal structure whereas the latter, due to the lower stability of the Bcc lattice, exhibit some distribution and deviation from the ideality. The lower stability of the Bcc lattice is apparent in the well-separated locations of the points corresponding to the Bcc excited crystal and the ideal Bcc crystal;
-
3.
polymeric solids are: i) polymorphic, i.e. the corresponding blue dots are distributed, and ii) exhibit Bcc-like structure, as evidenced by previous analysis [20], and signaled by the localization of the dots close to the one of the Bcc excited crystal and the magenta dots of the Bcc-like atomic crystals.
Fig.3 provides some insight into the influence of the limited size of our sample on the local and the global order of the Bcc-like polymeric polymorphs. To this aim, we compare the present MD results with previous ones [20] concerning the same polymer model of interest here, bond length and number of monomers eight times larger than the present one. In the study of ref.[20] crystallization occurs during quench-cooling since no nucleation was observed under isothermal condition, contrary to what reported in the present study. We found for the Bcc-like fraction and [20], to be compared to and , see Fig.3. This signals limited influence of the different bond length, sample size and thermodynamic path to crystallization on the local order of the first coordination shell. As to the global order, the present result is quite close to the ideal value , see Fig.3, and somewhat higher than of ref. [20]. Tentatively, we ascribe the difference to the fact that both the isothermal crystallization and periodic boundary conditions favour better Bcc-like ordering in the present small sample than in a larger, quench-cooled sample.
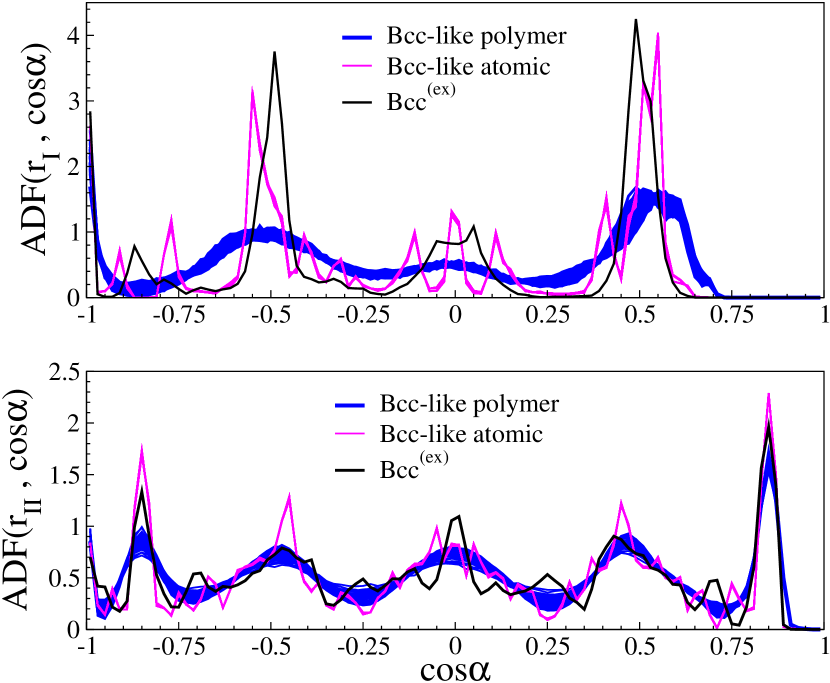
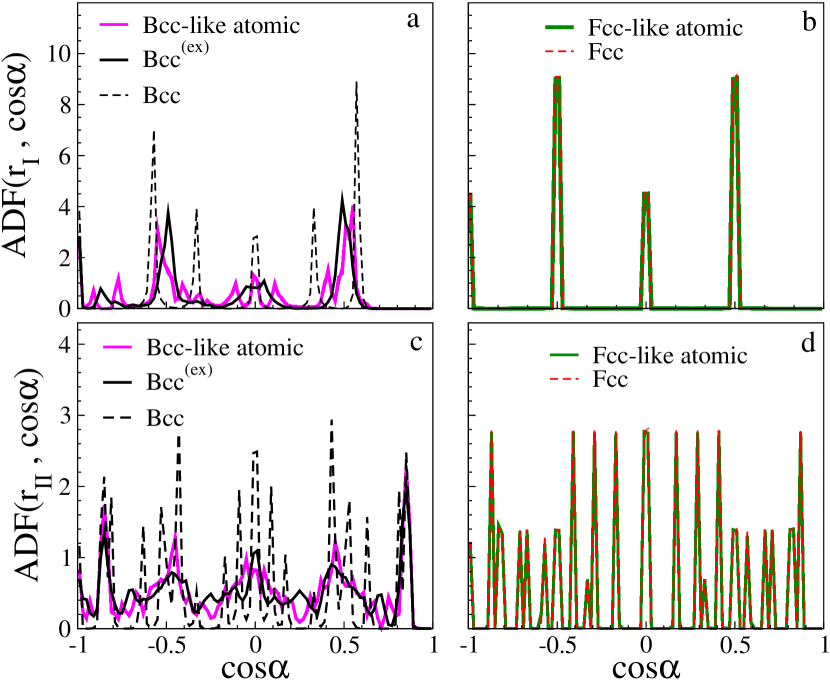
Further insight into the local structure around the i-th particle is offered by the angular distribution function where is the angle between and , and the vector joins the -th central particle with the -th one which is apart. The ADF analysis is carried out on the first and the second neighbor shells surrounding the i-th particle. They are singled out by the constraints with (first shell) and (second shell) [19]. Note that the ”first shell” considered by the ADF analysis is virtually the same region considered by the Steinhardt order parameters ( ) since the number of monomers spaced by less than is negligible.
Fig.4 shows the ADF of all the athermal polymeric solids under study. The differences between the polymeric ADF and the atomic (Bcc-like and Bcc(ex)) ADFs in the first shell are ascribed to the fact that the bond length of the polymeric chain is incommensurate with the atomic lattice [20]. The connectivity effect is negligible in the second shell and the deviations are quite smaller. For clarity reasons, the ADF of the ideal Bcc lattice is not shown due to the rather distinct pattern, see Fig.5. The ADF analysis in Fig.4 clarifies that the agreement between the particle arrangements of the polymeric and the atomic athermal solids is partial in the first shell (sensed by the Steinhardt parameters) but rather good in the second shell.
Fig.5 plots the ADF of all the athermal atomic solids under study. It is seen the ADF of the Bcc-like fraction is well accounted for by the ADF of the Bcc(ex) lattice both in the first and the second shell whereas the deviations of the ideal Bcc crystal are large. Instead, the ADF of the Fcc-like fraction is rather close to the ADF of the ideal Fcc lattice both in the first and the second shell.
3.3 Elastic and plastic response
The elastic and plastic response of the polymeric and the atomic solids are now examined. We focus on systems with similar, i.e. Bcc-like and and Bcc(ex), local environment. Related, illustrative Stress-Strain curves are given in Fig.6. The complete sets of curves for all the systems under study are used to draw the elastic modulus , the critical strain of the first plastic event and the average yield stress . Suitable averages over the three xy, xz, yz deformation planes are taken for each run.
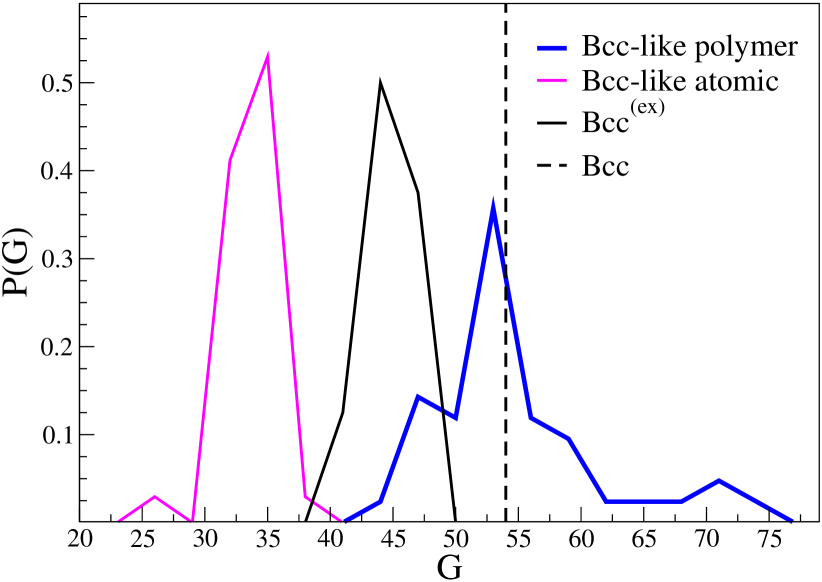
Fig.7 plots the distributions of the elastic modulus of the polymeric and the atomic systems with rather similar local structure. It is seen that the polymeric system has larger shear modulus. Notice that the comparison must be performed with the physical Bcc-like atomic solid and not the artificial Bcc(ex) one which is presented for reference only. The elastic modulus of the ideal Bcc crystal is indicated to show the softening effect of the preparation of the Bcc(ex) solid.
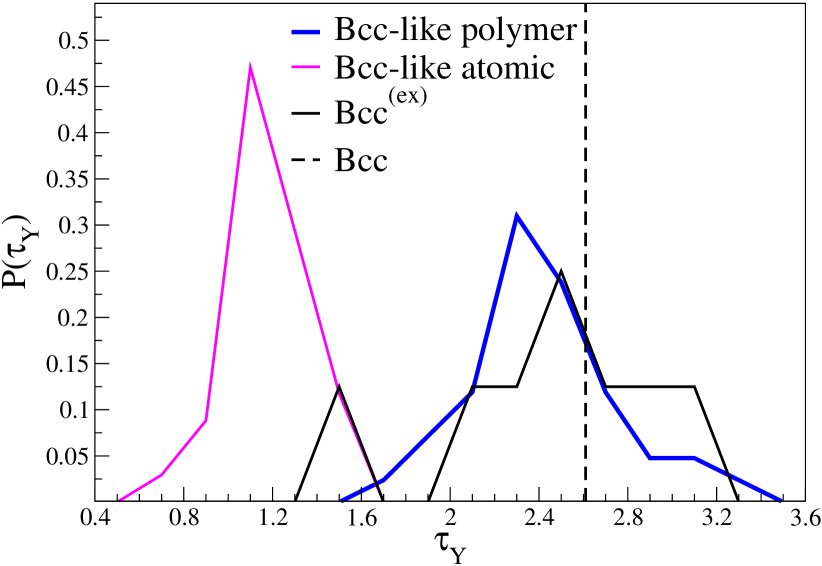
Fig.8 plots the distributions of the shear strength of the polymeric and the atomic systems with rather similar local structure. It is seen that the polymeric system has larger strength than the atomic Bcc-like solid. The strength is comparable to the one of the artificial Bcc(ex) atomic solid and the ideal Bcc crystal.
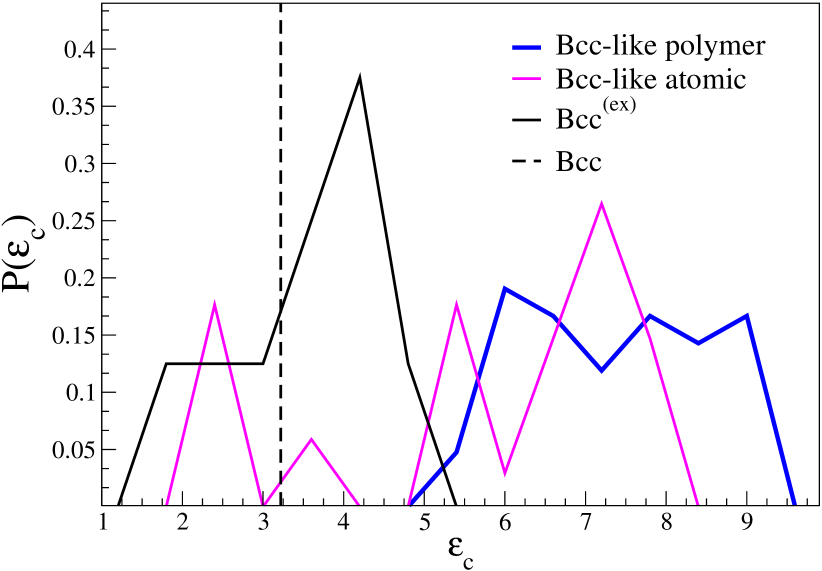
Finally, Fig.9 shows the critical strain at which the first plastic event is observed. It is seen that the strain of the polymer solid is comparable to the one of the atomic solid with similar local structure (Bcc-like) and distinctly higher than the one of the artificial atomic solid Bcc(ex) and the ideal Bcc crystal.
The above findings suggest that the disordered connectivity of the chains suppresses dislocation-mediated plasticity in polymeric solids with positional order.
As a final remark, we point out that the increases of the modulus ( ) and the strength ( ) of the Bcc-like polymeric athermal solid with respect to the corresponding atomic one cannot be ascribed to the slightly larger density of the former with respect to the latter ( ). In fact, a density increase from to ( ) caused by spanning different bond lengths from to has been proved to minimally rise the elastic modulus () and the yield stress () of polymeric solids at , [20].
4 Conclusions
We perform thorough MD simulations to compare elasticity and yielding of atomic crystals and model semicrystalline polymers with fully-flexible chains (no bending potential). Both the atomic and the polymeric solids have very similar, Bcc-like positional ordering of the particles. We find that the elastic modulus and the shear yield strength are higher in semicrystalline polymers with respect to atomic crystals, whereas the critical yield strain are comparable. The findings suggest that the disordered connectivity of the chains suppresses dislocation-mediated plasticity in polymeric solids with positional order.
Acknowledgements
We thank Francesco Puosi, Sebastiano Bernini and Nicola Calonaci for helpful discussions. A generous grant of computing time from IT Center, University of Pisa and Dell® Italia is gratefully acknowledged.
References
- Argon [1973] A. S. Argon, A theory for the low-temperature plastic deformation of glassy polymers, Phil. Mag. 28 (1973) 839–865.
- Eshelby [1957] J. D. Eshelby, The determination of the elastic field of an ellipsoidal inclusion and related problems, Proc. Roy. Soc. London A241 (1957) 376–396.
- Budiansky [1965] B. Budiansky, On the elastic moduli of some heterogeneous materials, Phys. Solids 13 (1965) 223–227.
- Ward [1975] I. M. Ward, Structure and Properties of Oriented Polymers, J. Wiley & Sons, New York, 1975.
- Tanguy et al. [2002] A. Tanguy, J. P. Wittmer, F. Leonforte, J.-L. Barrat, Continuum limit of amorphous elastic bodies: A finite-size study of low-frequency harmonic vibrations, Phys. Rev. B 66 (2002) 174205.
- Tsamados et al. [2004] M. Tsamados, A. Tanguy, C. Goldenberg, J.-L. Barrat, Continuum limit of amorphous elastic bodies ii: Linear response to a point source force, Phys. Rev. B 70 (2004) 014203.
- Tsamados et al. [2005] M. Tsamados, A. Tanguy, C. Goldenberg, J.-L. Barrat, Continuum limit of amorphous elastic bodies. iii. three-dimensional systems, Phys. Rev. B 72 (2005) 224206.
- Stachurski [1997] Z. H. Stachurski, Deformation mechanisms and yield strength in amorphous polymers, Progr. Polymer Sci. 22 (1997) 407–474.
- Hoy and Robbins [2006] R. S. Hoy, M. O. Robbins, Strain hardening of polymer glasses: Effect of entanglement density, temperature, and rate, J. Polym. Sci. Part B: Polym. Phys. 44 (2006) 3487–3500.
- Liu and Rottler [2010] A. Y.-H. Liu, J. Rottler, Aging under stress in polymer glasses, Soft Matter 6 (2010) 4858–4862.
- Hirth and Lothe [1982] J. P. Hirth, J. Lothe, Theory of Dislocations, Wiley, New York, 1982.
- Gilman [1968] J. J. Gilman, The plastic response of solids, in: A. R. Rosenfeld, G. Hahn, A. Bement, R. L. Jafee (Eds.), Dislocation Dynamics, McGraw-Hill, New York, 1968, p. 3.
- Li [1974] J. C. M. Li, Distinguished Lectures in Materials Science, Marcel Decker, New York, 1974.
- Bowden and Raha [1974] P. Bowden, S. Raha, A molecular model for yield and flow in amorphous glassy polymers making use of a dislocation analogue, Phil. Mag. 29 (1974) 149–166.
- Argon [2013] A. S. Argon, The Physics of Deformation and Fracture of Polymers, Cambridge University Press, 2013.
- Lam and Chong [1999] D. C. Lam, A. C. Chong, Indentation model and strain gradient plasticity law for glassy polymers, J. Mater. Res. 14 (1999) 3785–3788.
- Ho et al. [2003] J. Ho, L. Govaert, M. Utz, Plastic deformation of glassy polymers: correlation between shear activation volume and entanglement density, Macromolecules 36 (2003) 7398–7404.
- Greaves et al. [2011] G. N. Greaves, A. L. Greer, R. S. Lakes, T. Rouxel, Poisson’s ratio and modern materials, Nature Materials 10 (2011) 823–837.
- Giuntoli et al. [2016] A. Giuntoli, S. Bernini, D. Leporini, Bond disorder, frustration and polymorphism in the spontaneous crystallization of a polymer melt, J. Non-Cryst. Sol. 453 (2016) 88–93.
- Giuntoli et al. [2017] A. Giuntoli, N. Calonaci, S. Bernini, D. Leporini, Effect of nematic ordering on the elasticity and yielding in disordered polymeric solids, Journal of Polymer Science, Part B: Polymer Physics 55 (2017) 1760–1769.
- Argon and Demkowicz [2008] A. S. Argon, M. J. Demkowicz, What can plasticity of amorphous silicon tell us about plasticity of metallic glasses?, Metall. Mater. Trans. 39A (2008) 1762–1778.
- Grest and Kremer [1986] G. S. Grest, K. Kremer, Molecular dynamics simulation for polymers in the presence of a heat bath, Phys. Rev. A 33 (1986) 3628–3631.
- Puosi and Leporini [2011] F. Puosi, D. Leporini, Scaling between relaxation, transport, and caged dynamics in polymers: From cage restructuring to diffusion, J.Phys. Chem. B 115 (2011) 14046–14051.
- Ottochian and Leporini [2011] A. Ottochian, D. Leporini, Scaling between structural relaxation and caged dynamics in and glycerol: free volume, time scales and implications for the pressure-energy correlations, Philosophical Magazine 91 (2011) 1786–1795.
- Puosi and Leporini [2012] F. Puosi, D. Leporini, Spatial displacement correlations in polymeric systems, J. Chem. Phys. 136 (2012) 164901.
- De Michele et al. [2011] C. De Michele, E. Del Gado, D. Leporini, Scaling between structural relaxation and particle caging in a model colloidal gel, Soft Matter 7 (2011) 4025–4031.
- Plimpton [1995] S. Plimpton, Fast parallel algorithms for short-range molecular dynamics, J. Comput. Phys. 117 (1995) 1–19.
- Lerner et al. [2009] E. Lerner, I. Procaccia, E. S. C. Ching, H. G. E. Hentschel, Relations between material mechanical parameters and interparticle potential in amorphous solids, Phys. Rev. B 79 (2009) 180203.
- Barrat and Lemaitre [2011] J. L. Barrat, A. Lemaitre, Heterogeneities in amorphous systems under shear, in: L. Berthier, G. Biroli, J. Bouchaud, L. Cipelletti, W. van Saarloos (Eds.), Dynamical heterogeneities in glasses, colloids, and granular media, Oxford university press, 2011.
- Allen [1984] M. Allen, Atomic and molecular representations of molecular hydrodynamic variables, Mol. Phys. 52 (1984) 705–716.
- Mott et al. [1993] P. H. Mott, A. S. Argon, U. W. Suter, Atomistic modelling of plastic deformation of glassy polymers, Philos. Mag. A 67 (1993) 931–978.
- Falk and Langer [1998] M. L. Falk, J. S. Langer, Dynamics of viscoplastic deformation in amorphous solids, Phys. Rev. E 57 (1998) 7192.
- Maeda and Takeuchi [1978] K. Maeda, S. Takeuchi, Computer simulation of deformation in two-dimensional amorphous structures, Phys. Stat. Sol. 49 (1978) 685–696.
- Malandro and Lacks [1999] D. L. Malandro, D. J. Lacks, Relationships of shear-induced changes in the potential energy landscape to the mechanical properties of ductile glasses, J. Chem. Phys. 110 (1999) 4593–4600.
- Maloney and Lemaitre [2004] C. Maloney, A. Lemaitre, Sub-extensive scaling in the athermal, quasistatic limit of amorphous matter in plastic shear flow, Phys. Rev. Lett. 93 (2004) 0160001.
- Dubey et al. [2016] A. K. Dubey, I. Procaccia, C. A. B. Z. Shor, M. Singh, Elasticity in amorphous solids: Nonlinear or piecewise linear ?, Phys. Rev. Lett. 116 (2016) 085502.
- Vu-Bac et al. [2015] N. Vu-Bac, M. A. Bessa, T. Rabczuk, W. K. Liu, A multiscale model for the quasi-static thermo-plastic behavior of highly cross-linked glassy polymers, Macromolecules 48 (2015) 6713–6723.
- Crist [1997] B. Crist, The Physics of Glassy Polymers, II Ed., Springer Science+Business Media, Dordrecht, 1997, pp. 155–212.
- Parkhouse and Kelly [1995] J. G. Parkhouse, A. Kelly, The random packing of fibres in three dimensions, Proceedings of the Royal Society of London A: Mathematical, Physical and Engineering Sciences 451 (1995) 737–746.
- Steinhardt et al. [1983] P. J. Steinhardt, D. R. Nelson, M. Ronchetti, Bond-orientational order in liquids and glasses, Phys. Rev. B 28 (1983) 784–805.
- Baschnagel and Varnik [2005] J. Baschnagel, F. Varnik, Computer simulations of supercooled polymer melts in the bulk and in confined geometry, J. Phys.: Condens. Matter 17 (2005) R851–R953.
- Rintoul and Torquato [1996] M. D. Rintoul, S. Torquato, Computer simulations of dense hardsphere systems, J. Chem. Phys. 105 (1996) 9258–9265.
- Richard et al. [1999] P. Richard, L. Oger, J. Troadec, A. Gervois, Geometrical characterization of hard-sphere system, Phys. Rev. E 60 (1999) 4551.
- Misra [1940] R. D. Misra, On the stability of crystal lattices. ii, Mathematical Proceedings of the Cambridge Philosophical Society 36 (1940) 173–182.
- Milstein [1970] F. Milstein, Mechanical stability of crystal lattices with two-body interactions, Phys. Rev. B 2 (1970) 512–518.