A Two-Sided-Loop X-Ray Solar Coronal Jet Driven by a Minifilament Eruption
Abstract
Most of the commonly discussed solar coronal jets are of the type consisting of a single spire extending approximately vertically from near the solar surface into the corona. Recent research supports that eruption of a miniature filament (minifilament) drives many such single-spire jets, and concurrently generates a miniflare at the eruption site. A different type of coronal jet, identified in X-ray images during the Yohkoh era, are two-sided-loop jets, which extend from a central excitation location in opposite directions, along low-lying coronal loops more-or-less horizontal to the surface. We observe such a two-sided-loop jet from the edge of active region (AR) 12473, using data from Hinode XRT and EIS, and SDO AIA and HMI. Similar to single-spire jets, this two-sided-loop jet results from eruption of a minifilament, which accelerates to over 140 km s-1 before abruptly stopping after striking overlying nearly-horizontal loop field at 30,000 km altitude and producing the two-sided-loop jet. Analysis of EIS raster scans show that a hot brightening, consistent with a small flare, develops in the aftermath of the eruption, and that Doppler motions (40 km s-1) occur near the jet-formation region. As with many single-spire jets, the magnetic trigger here is apparently flux cancelation, which occurs at a rate of 4 Mx/hr, comparable to the rate observed in some single-spire AR jets. An apparent increase in the (line-of-sight) flux occurs within minutes of onset of the minifilament eruption, consistent with the apparent increase being due to a rapid reconfiguration of low-lying field during and soon after minifilament-eruption onset.
1 Introduction
Coronal jets are transient collimated ejections of solar material, typically of length 105 km and width 104 km. They were first observed in detail in X-rays with the Yohkoh Soft X-ray Telescope (SXT) (Shibata et al., 1992; Shimojo et al., 1996). Later they were studied with the X-Ray Telescope (XRT) on Hinode (Cirtain et al., 2007; Savcheva et al., 2007). More recently they have been studied in EUV with the STEREO spacecraft (e.g. Nisticò, 2009), and with the Atmospheric Imaging Assembly (AIA) on Solar Dynamics Observatory (SDO) (e.g. Moore et al., 2013; Sterling et al., 2015). There are many additional jet studies with a variety of instruments (Raouafi et al., 2016).
Typical jets consist of a bright base near the solar surface, with a single spire extending progressively outward from near the solar surface into the corona. (Shibata et al. 1994 called these “anemone jets”; here we will refer to them as “single-spire jets.”) It was first suggested that such jets result according to an “emerging-flux model,” whereby a magnetic bipole emerges from below the solar surface into the corona and undergoes magnetic reconnection with surrounding open (or far-reaching) nearly vertical field, with the jet spire forming along that open field (e.g., Shibata et al., 1992; Yokoyama & Shibata, 1995). Later however, improved resolution and wavelength coverage with AIA showed that many (if not most) jets instead result from eruption of a miniature filament, or “minifilament,” of size scale 10,000 km (Sterling et al. 2015; also see, e.g., Shen et al. 2012a, Adams et al. 2014, Panesar et al. 2016), accompanied by a “miniflare” brightening at the edge of the jet base (this brightening is sometimes called a jet(-base) bright point, or JBP; e.g. Sterling et al. 2015). Meanwhile, improved magnetic field coverage with SDO’s Helioseismic and Magnetic Imager (HMI) showed that often jets coincide with magnetic flux cancelation (e.g., Huang et al., 2012; Young & Muglach, 2014; Adams et al., 2014); in some cases where flux emergence coincides with the jets, the jets still originate from locations where one pole of the emerging bipole is canceling with surrounding field (e.g. Shen et al., 2012a; Li et al., 2015). From the “minifilament-eruption-model” standpoint, the flux cancelation builds the minifilament-holding magnetic field (Panesar et al., 2017), and triggers it to erupt (Panesar et al., 2016, 2018) to form the jet.
In addition to single-spire jets, there are also two-sided-loop coronal jets (Shibata et al., 1994), whereby two spires develop roughly symmetrically and horizontally to the surface from a central bright region. These two-sided-loop jets were first seen in coronal X-ray images, and are also seen in EUV images (e.g. Alexander & Fletcher, 1999; Jiang et al., 2013). The emerging-flux model was also invoked to explain these jets theoretically, with the emerging flux reconnecting with overlying horizontally directed field, and numerical simulations of this showed results similar to the Yohkoh/SXT X-ray observations (Yokoyama & Shibata, 1995, 1996). Published examples of SDO-era observations, with high-resolution and high-cadence multi-wavelength images and magnetograms, of these two-sided-loop jets are sparse (see however §4 for recent references). Here we present Hinode and SDO observations showing strong evidence that a two-sided-loop jet resulted from an erupting minifilament, similar to that in single-spire jets.
2 Instrumentation and Data
Our observed two-sided-loop jet occurred on 2015 December 30 near 22:41 UT, southeast of a set of sunspots in NOAA active region (AR) 12473 that was located at heliocentric latitude and longitude of about -20, +45, producing a C-level enhancement in the GOES X-ray flux.
We use imaging data from both XRT and AIA. We confirm that it is an “X-ray jet” with XRT, assuring that we are studying a two-sided-loop jet similar to those identified by Shibata et al. (1994) in X-rays with SXT. XRT has spatial pixel resolution of , with variable time cadence and field of view (FOV) (Golub et al., 2007). AIA produces full-Sun images in seven EUV bands at 12 s cadence with pixels (Lemen et al., 2012); for this study we examined all EUV channels, and the 1600 Å UV channel. For our purposes here, we find it adequate to present 304 Å, 193 Å, 211 Å, and 94 Å images (and their 12-s-cadence movies), which respectively have peak contributions at , , K, and K. We also use raster-image data from the Hinode/EUV Imaging Spectrometer (EIS, Culhane et al., 2007) in the He ii 304 Å, Fe xii 195 Å, and Fe xv 284 Å lines. Each scan required 3.5 min to cover an E-W extent of 50′′, with a N-S slit extent of 120′′. There was a fortuitous overlap with the jet event in the southwest quadrant of EIS’s limited FOV. We also use magnetograms from HMI (Scherrer et al., 2012), which has maximum cadence 45 s and pixels.
3 Observational Results
3.1 X-Ray and EUV Evolution
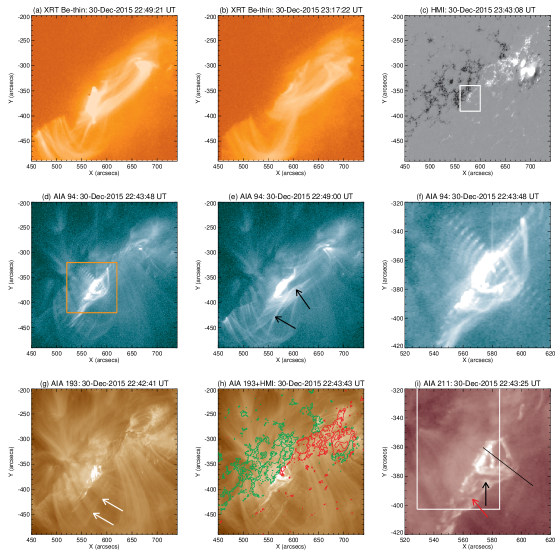
Figures 1(a—b) show the two-sided-loop jet in XRT images with classic morphology (Shibata et al., 1994; Yokoyama & Shibata, 1995, 1996) in X-rays, with a strong brightening in-between the two loop-confined arms (spires) of the jet; the accompanying video shows the jet’s evolution. These Hinode/XRT images are very close in appearance to the snapshot from Yohkoh/SXT in Yokoyama & Shibata (1995) (see Fig. 3(b) of that paper; the figure is also in Shibata et al. 1994). Both the Yokoyama & Shibata (1995) jet and our jet have one side that is smaller and brighter (to the south in the Yokoyama & Shibata 1995 jet, and to the northeast in ours), and one side that is larger and dimmer (north in Yokoyama & Shibata 1995, and southeast in ours). Viewing the movie accompanying our Figure 1(a—b), the frame at 22:46:10 UT comes closest in appearance to the snapshot in the Yokoyama & Shibata (1995) figure (we choose to show different frames in our Fig. 1(a,b) because of the strong saturation of the flaring location in that 22:46:10 UT frame). As with the original observations with Yohkoh however, the X-ray images alone yield little direct information on the cause of the jet. We look to additional data for more insight.
Figures 1(d—f) show the jet with AIA 94 Å images, with an initial brightening in Figure 1(d) (also visible in X-rays in Fig. 1(a)) the two-sided-loop jet structure in Figure 1(e), and a closeup in 1(f). Arrows in 1(e) point to oppositely directed flows along two strands of the two jet-guiding lobes. Figures 1(g—h) show the event in AIA 193 Å, with arrows in 1(g) showing the elevated field that later becomes one of the jet-guiding lobes. Figure 1(i) shows a closeup of the region that brightens at the earliest sign of jet activity, with a filament-like absorbing feature (arrows) that the accompanying video shows to be erupting. The erupting segment (black arrow) has length of 15′′ (11,000 km). This is similar to the size (8000 km) Sterling et al. (2015) found for erupting minifilaments when they were at about the same relative distance above the surface as the in Figure 1(i). This is smaller than the sizes of typical filaments (30,000—110,000 km; Parenti, 2014). Thus, just as with the more typical “single-spire” jets, this two-sided-loop jet apparently results from an erupting minifilament. From the accompanying videos, the jet forms when this erupting minifilament collides with pre-existing overlying field shown by arrows in Figure 1(g).
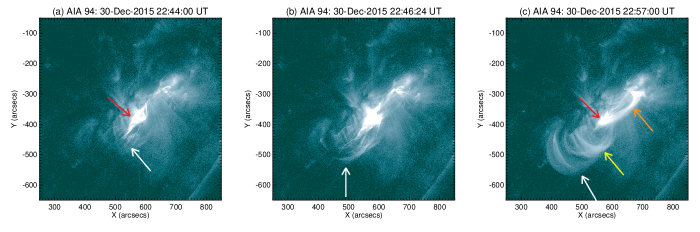
Figure 2 shows AIA 94 Å images with a larger FOV than Figure 1, thereby revealing more clearly the overall jet structure. After an initial brightening (red arrow in Figs. 2(a,c)), the jetting into the two lobes eventually extends out asymmetrically from that brightening, longer toward the southeast and shorter toward the northwest (Fig. 2(c)). We see the southeast lobe develop in time in a similar fashion in several AIA wavelengths; in these 94 Å images the jet-spire brightening in the lobe indicated by the white arrow in Figure 2(b) extends away from the initiation site at 550100 km s-1. In contrast, the northeast lobe appears to brighten mostly in place, and therefore seems to be mostly a result of material entering into the passband of sensitivity for the 94 Å wavelength channel as it heats or cools, rather than arising from a front propagating along the field to fill the loop. Because of the differences in temperature response in the 94 Å EUV of AIA (Lemen et al., 2012) and the broad-band X-rays of XRT (Golub et al., 2007), jets can appear differently in the different wavelength regimes (cf. Sterling et al., 2015). This is the case here, with for example the northwestern lobe of the jet clearly visible from the earliest XRT images (22:44:09 UT), while it does not appear until substantially later in 94 Å (orange arrow in Fig. 2(c)). Evolution of the southwest lobe is similar in X-rays to that in 94 Å, with flows along the lobe field from the central region visible over 22:44—22:48 UT, approximately coinciding with the flows visible in the 94 Å images.
Two-sided-loop jets (and single-spire jets too, for that matter) were originally defined from X-ray images, and thus the images expected to match most closely those in the sketches of Shibata et al. (1994) and Yokoyama & Shibata (1995, 1996) are those of Figure 1(a) and 1(b), although unfortunately this appearance is compromised somewhat by the limited FOV of our XRT images in Figure 1.
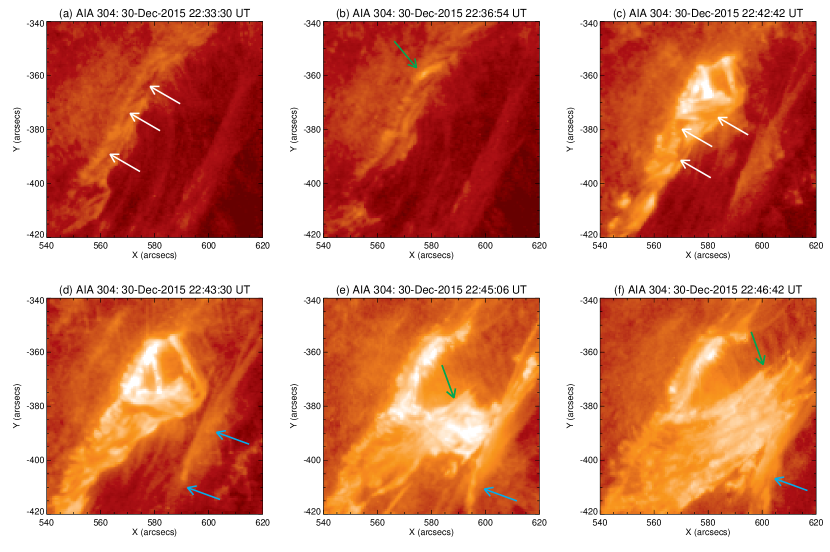
Figure 3 shows a zoomed-in view of the erupting minifilament, this time in AIA 304 Å images. Over some time the minifilament becomes visible near the surface (Fig. 3(a)). Figure 3(b) shows a brightening beneath the minifilament as it has just started to rise; this brightening is visible in all AIA channels, and so includes hot emissions. A short time later (Fig. 3(c)), the brightenings have become much more pronounced. Moreover, the minifilament itself now shows a contorted, serpentine-like shape – likely due to writhing – as it erupts away from the surface (Fig. 3(d)). At the time of Figure 3(e), the erupting and expanding minifilament reaches the pre-existing overlying field shown by the white arrows in Figure 1(g), and by light blue arrows here in Figures 3(d—f). From the corresponding movie, upon pushing into the overlying field, the minifilament appears to show untwisting motions over approximately 22:44—22:48 UT. Along with and continuing after this unwinding, flows toward the northwest occur from the erupting minifilament (green arrow in Figs. 3(e—f)). Also, the overlying feature (light-blue arrows) shows distinct flows southeastward from approximately the time it is impacted by the erupting minifilament field, at about 22:45 UT, and continuing until about 22:51 UT in the movie. These features are also visible in the other AIA EUV channels; see the videos accompanying Figure 1.
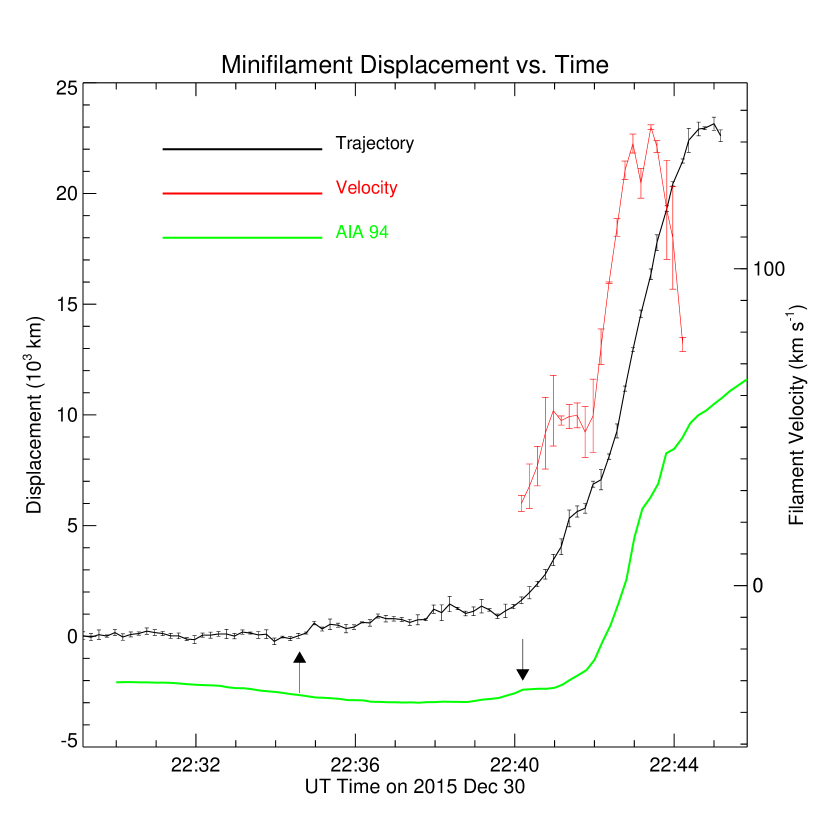
Figure 4 shows the trajectory of the erupting minifilament as a function of time, where we have visually estimated the top of the minifilament as it moves upward in 211 Å images (Fig. 1(i)). We perform each length measurement three independent times to estimate the random uncertainty in the measured value. Upward movement of the central part of the filament commences near 22:34 UT, indicated by the upward-pointing arrow. This is the time of the initial brightening at the base of the minifilament indicated by the green arrow in Figure 3(b); it is also visible in other AIA videos accompanying Figure 1, for example in 94 Å video of Figure 1(f) from 22:34:24, and especially at 22:35:24 UT. In Figure 4 the green curve represents the AIA 94 Å flux integrated over the region of the box in Figure 1(d), but the 22:34:24 UT flux increase visible in the video is too weak, relative to the background intensity, to stand out in the green light curve. (The enhanced background intensity in 94 Å images, visible as a hump in the green curve of Fig. 4 that peaks near 22:30 UT, is caused by other dynamical processes that we do not investigate here.) From about 22:40 UT there is a sharp increase in the rise trajectory of the minifilament, and this corresponds to an increase in the 94 Å integrated intensity (down-pointing arrow in Fig. 4, visible over 22:39—22:41 UT in the video accompanying Fig. 1(f)), and then a further acceleration of the minifilament near 22:42 UT, indicated by the velocity plot (orange) in Figure 4, which is also accompanied by a sharp increase in the integrated 94 Å intensity. This latter-most sharp increase in the 94 Å intensity can be considered to be the growth of a small flare arcade accompanying the accelerated rise of the minifilament.
This behavior of the minifilament’s rise, with slow-rise phases prior to the most-accelerated rise, EUV brightening enhancements accompanying accelerations in the rise trajectory, and onset of strongest flaring accompanying the strongest minifilament upward acceleration, all closely mimic behavior of larger-scale erupting filaments and their accompanying flares (e.g., Sterling & Moore, 2005; Sterling, Harra, & Moore, 2007; Sterling et al., 2014; Imada, Bamba, & Kusano, 2014; McCauley et al., 2015; Harra et al., 2017; Green et al., 2018).
From Figure 4, the minifilament erupts outward until it reaches a height (displacement) of about 23,000 km, when it abruptly stops, apparently arrested by overlying field that is visible even prior to the jet (arrows in Fig. 1(g)). Due to the projection angle, the true height might be 30% larger than these plane-of-sky-projected values, as the event occurred at an angle of 45∘ with the Earth-Sun line-of-sight; so the height is 30,000 km. Comparison with previous studies of ejective eruptions (e.g., Sterling et al., 2014) suggest that the minifilament’s rise is relatively unimpeded until the abrupt velocity decrease near 22:44 UT, when videos accompanying Figure 1 indicate that it pushes into overlying magnetic field.
3.2 EIS Rasters
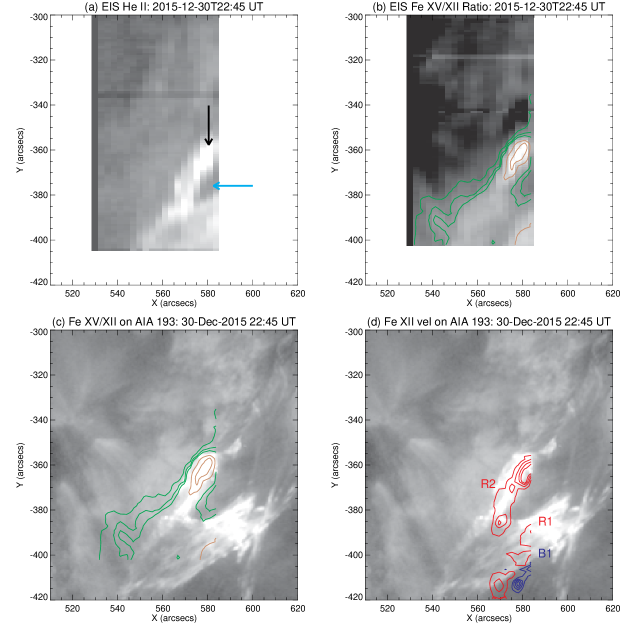
Figure 5 shows an EIS raster intensity image in He ii (Fig. 5(a)), and a ratio of Fe xv-to-Fe xii intensity images (Fig. 5(b)). These ratio images provide a qualitative measure of hotter (brighter) and cooler (darker) locations in the region (Doschek et al., 2007). Figure 5(c) shows contours from Figure 5(b) on an AIA 193 image. The rectangle in Figure 1(i) shows that the EIS FOV covers only a small portion of the jet’s base region.
Figure 5(a) shows a dark feature (light-blue arrow) and a bright feature (black arrow), which correspond to cooler and hotter locations in Figure 5(b). Comparing these features with the AIA features in the zoomed-in videos corresponding to Figures 1(f), 1(i), and 3 suggests that the dark feature could be a void; see for example the Figure 3 304 Å video between 22:42 and 22:45 UT, where there seems to be a region comparatively free of emitting material between the erupting minifilament and the photosphere at the location of the EIS dark feature. For the bright feature (black arrow in Fig. 5(a)), comparison with the same videos shows convincingly that this region corresponds to flare loops that develop below the erupting minifilament; see for example the 211 Å movie corresponding to Figure 1(f) from about 22:50 UT, when the features at this location take on the distinct appearance of post-flare loops. Unfortunately however, the EIS scans did not capture the erupting minifilament at a time when it was most clearly visible in the AIA images, such as in Figure 1(i). There is only one EIS scan coinciding with times where AIA shows the minifilament very clearly in the EIS FOV; that at 22:42:18 UT. But that scan has a data dropout near the jet region, and so we are not confident in that scan. At the time of the prior raster (22:38:44 UT), the minifilament has not yet started lifting off, and by the time of the next scan (22:45:52 UT), hotter material envelopes the minifilament, apparent in the AIA videos accompanying Figure 1. So what we can say with certainty from the EIS rasters is that they show: (a) brightening beneath the erupting minifilament, (b) temperature-ratio maps showing hotter plasma at the expected small-flare location, and (c) Doppler velocities from single-Gaussian fits in several rasters show redshifts, and one raster (beginning at 22:45:52) shows a strongly blueshifted feature too (both red- and blueshifts have maximums of 40 km s-1); we consider these line shifts further in §4.
3.3 Magnetic Evolution
Figure 1(c) shows an HMI magnetogram of the region, and Figure 1(h) shows it overlaid onto an AIA 193 Å image. From the latter panel and accompanying video, the minifilament eruption clearly occurs on a magnetic neutral line.
Figure 6 shows the positive-polarity flux summed over the box in Figure 1(c) for the 36 hrs beginning at 0 UT on December 30. There is a general flux decrease over that time period of 4 Mx/hr, in agreement for flux-cancelation rates found in (single-spire) AR jets (see Table 1 of Sterling et al., 2018). There is however a prominent jump of about Mx over 15 min, beginning nearly exactly with the onset of the minifilament’s eruption. This does not have the appearance of flux emergence; if it were emergence, the emergence rate during the jump would be at or above 1 Mx/hr, which is the approximate maximum rate of AR growth (Zwaan, 1987); the magnetograms show no indication of such large emergence. Instead we suspect that we are seeing an increase in the line-of-sight component of the field as the field vector at the surface changes its direction as the minifilament erupts; the positive-polarity roots of that field were oriented such that in response to the eruption, the direction of the field turned toward our observation direction, perhaps a natural consequence of the our perspective of viewing the region near the west limb (see discussion of Fig. 7 below). Similar magnetic rapid reconfigurations have been seen in flares (e.g., Moore et al., 1984; Wang et al., 1994). Also supportive of this hypothesis is the continuation of flux decrease with time for more than 12 hrs following the jet (Fig. 6). Hence, the evidence is that flux cancelation triggered the minifilament’s eruption that drove the two-sided-loop jet, consistent with flux cancelation triggering many or most single-sided jets (e.g., Panesar et al., 2016, 2017, 2018; Sterling et al., 2016, 2017).
4 Summary and Discussion
We find a two-sided-loop jet to result from eruption of a miniature filament. This is consistent with earlier observations that minifilament eruptions cause single-spire jets. In this case, the erupting minifilament reached a velocity of 140 km s-1 prior to impacting and reconnecting with an overlying, roughly horizontal portion of a sigmoid coronal-loop field at a height of 30,000 km. Reconnection between the erupting minifilament (more specifically: the erupting-minifilament flux-rope field that holds the cool minifilament material) and that horizontal-loop field resulted in heating at the reconnection location, and expulsion of X-ray/EUV jets in both directions along the loop, producing the two-sided-loop jet. EIS raster scans confirm accentuated heating at the suspected small-flare location, and line-of-sight magnetogram observations are consistent with flux cancelation being the trigger for onset of the minifilament’s eruption.
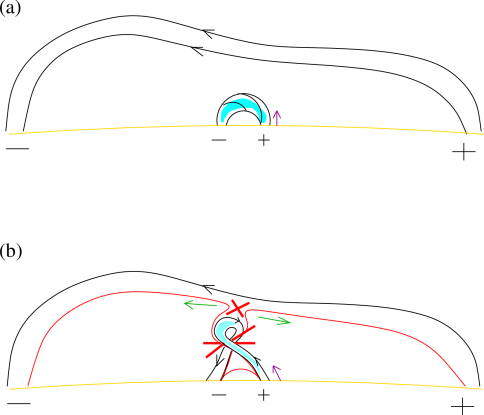
Figure 7 shows a schematic of our minifilament-eruption scenario for producing this two-sided-loop jet. The minifilament flux rope writhes as it erupts, allowing reconnection at the elevated location (Fig. 7(b)). This schematic is topologically the same as that drawn for single-spire jets in Sterling et al. (2015), but with the “open” field now the long horizontal loop, running from right-to-left in the figure (northwest-to-southeast in the observed jet in Fig. 1).
Figure 7 also illustrates, with the purple arrows, our idea for the positive-flux jump at and soon after the time of minifilament-eruption onset. These arrows represent the direction of the positive component of the photospheric field inside the footpoint of the minifilament loop (in the figures, for clarity we draw the arrows just outside of the minifilament loop). Prior to the eruption of the minifilament, the direction of the field vector in the minifilament’s positive-polarity flux patch is approximately vertical to the surface. Within a few minutes following the minifilament-eruption’s onset however, the foot of the positive-polarity field that undergoes the flare-arcade-building reconnection points more toward the upper left of the schematic: In other words, after the eruption’s onset, the purple arrow in Figure 7(b) is no longer vertical, as it was in Figure 7(a); rather, it is now leaning slightly couter-clockwise to the normal to the surface, pointing to the southeast (in the plane of the figure). This is a result of the reconnecting field beneath the erupting minifilament collapsing in upon itself. (We speculate that this photospheric-field-direction change could be a byproduct of the so-called “Hudson effect,” from the work of Hudson 2000; e.g. Janse & Low 2007, Shen et al. 2012b, Panesar et al. 2013, Wheatland et al. 2018.) To an observer viewing from the upper left of the schematic, the measured intensity of the line-of-sight component of the foot of that positive-polarity field would increase between the times of Figures 7(a) and 7(b). Because the left side of the schematic represents southeast in the solar images of this paper, and because the region appears near the solar west limb viewed from HMI, the purple arrow pointing more toward the upper left in figure 7(b) compared to 7(a) is qualitatively consistent with the observed positive-flux increase during the time of minifilament eruption. This same process would affect the negative-flux values also, but as mentioned earlier, we do not measure the negative flux here because it is difficult to isolate. While further investigation of this idea is beyond the scope of the current paper, this scenario plausibly explains how there could be the observed increase in the line-of-sight positive flux starting at the time of the jet onset shown in Figure 6.
Overall, we observe persistent flux cancelation over the time leading up to the jet. Thus our findings are fully consistent with other recent studies showing that minifilaments that erupt to form jets are frequently built by flux cancelation, and that continued cancelation triggers them to erupt; see Panesar et al. (2016, 2017, 2018) for schematic illustrations on how this build up and triggering might occur. And see e.g., Sterling et al. (2015, 2017) for schematic illustrations on how the erupting minifilament would form the jet.
EIS’s field-of-view (Fig. 5(d); also see the white box in Fig. 1(i)) covers the location just to the east of the interaction location of the erupting minifilament and overlying field. In Figure 5(d), the lineshifts labeled R2 are located near the AIA-flare-loop tops, so if they were due to downflows from the tops of those loops, we would expect a mixture of redshifts and blueshifts; but we see only redshifts here. Instead, the R2 redshifts are more consistent with material trapped in contracting reconnected closed field, producing “supra-arcade downflows,” (e.g., McKenzie, 2000; Savage & McKenzie, 2011; Warren et al., 2011; Savage et al., 2012), which have minimum velocities near flare loop tops close to those observed here (40 km s-1). Hence we expect the source of these redshifts to be different from those seen by EIS in AR loops (e.g., Del Zanna, 2008; Doschek, 2012).
For the R1/B1-labeled red/blue pair of Doppler shifts in Figure 5(d), which also reach 40 km s-1, Figure 3(e—f) and the accompanying video (and also other AIA videos from Fig. 1 showing the minifilament-eruption region close up) show that complex dynamics ensue when the minifilament pushes into the overlying horizontal field. As mentioned in the discussion of Figure 3 in §3.1 above, the erupting minifilament shows what appears to be untwisting motions (this would correspond to the minifilament flux rope with blue shading in Fig. 7(b)), along with northwestward-directed motions (green arrow in Figs. 3(e—f), and also southeastward-directed motions along the overlying horizontal field (light-blue arrows in Figs. 3(d—f). Of course “northwestward” and “southeastward” only describe plane-of-sky motions, but we could expect corresponding components either into or out of the plane of sky also. EIS is apparently observing Doppler shifts from these opposite-directed motions; thus the shifts could be from some combination between the possible untwisting motions (as reported in, e.g., Williams et al., 2009) and the observed counterstreaming. Due to the limited FOV coverage and the limited number of scans however, we are not able to specify more exactly what is the cause of the Doppler shifts (including for example, whether EIS is able to resolve the red and blueshifts due to the untwisting motion alone). Observations of similar events with improved spectral coverage should clarify what occurs in situations such as these.
Recent models of the minifilament jet-producing mechanism
(Wyper et al. 2017,
Wyper, DeVore, & Antiochos 2018) argue that “breakout
reconnection” at a coronal magnetic null point between the pre-eruption field enveloping the
minifilament and an ambient (nearly
vertical) coronal field is essential for initiating minifilament eruptions that produce single-spire jets. While this
may hold for the single-spire jets they modeled, initial breakout reconnection appears not to be
essential in the two-sided-loop jet presented here; the minifilament flux-rope eruption undergoes clear
acceleration before the overlying field (where “breakout” reconnection eventually occurred at the interface)
abruptly stops its
motion (Fig. 5). Thus the possibility remains that tether-cutting (e.g. Moore & LaBonte, 1980), or an
ideal MHD instability (e.g., Török & Kliem, 2005), prior to breakout might be the primary
initiation mechanism for this minifilament eruption.
In summary, our view for this two-sided-loop jet is that (a) magnetic flux cancelation built the minifilament field and triggered it to erupt, (b) the erupting minifilament field pushed up into largely horizontally oriented pre-existing magnetic field, (c) the two-sided-loop jet spires developed due to reconnection between the erupting minifilament field and the overlying field.
Additionally, the central brightening in our event corresponds to the JBP of single-spire jets, and is a miniature flare that accompanied the erupting minifilament; it is analogous to large-scale flares accompanying typical-sized filament eruptions according to the standard flare model (e.g., Hirayama, 1974; Shibata et al., 1995; Moore et al., 2001). Brightening of the horizontal jet loops would be due to a combination of heating of material at the reconnection location, density increase from evaporation from the near and far ends of the reconnected far-reaching loops, and density increase from leakage onto the horizontal segments of material in the erupting minifilament field (including minifilament material itself).
While there are now numerous examples of minifilament eruptions driving (single-spire) coronal jets (e.g., Shen et al., 2012a; Liu et al., 2015; Moore et al., 2013; Hong et al., 2016; Zhang et al., 2016; Sterling et al., 2015; Panesar et al., 2016), it is necessary to study more than this single example of a two-sided-loop jet before we might conclude that two-sided-loop jets in general are also driven by minifilament eruptions, as other recent observation do not discuss erupting minifilaments in two-sided-loop jet formation (Tian et al., 2017; Zheng et al., 2018). Therefore more studies are needed to determine the most common cause of two-sided-loop jets.
References
- Adams et al. (2014) Adams, M., Sterling, A. C., Moore, R. L., & Gary, G. A. 2014, ApJ, 783, 11
- Alexander & Fletcher (1999) Alexander, D., & Fletcher, L. 1999, Sol. Phys., 190, 167
- Culhane et al. (2007) Culhane, J. L., Harra, L. K., James, A. M., et al. 2007, Sol. Phys., 243, 19
- Cirtain et al. (2007) Cirtain, J. W., Golub, L., Winebarger, A. R., et al. 2007, Science, 318, 1580
- Del Zanna (2008) Del Zanna, G. 2008, A&A, 481, L49
- Doschek et al. (2007) Doschek, G. A., Mariska, J. T., Warren, H. P. et al. 2007, PASJ, 59, S707
- Doschek (2012) Doschek, G. A. 2012, ApJ, 754, 153
- Golub et al. (2007) Golub, L., Deluca, E., Austin, G., et al. 2007, Sol. Phys., 243, 63
- Green et al. (2018) Green, L. M., Török, T., Vrs̆nak, B., Manchester, W., & Veronig, A. 2016, SSRv, 214, 46
- Harra et al. (2017) Harra, L. K., Hara, H., Doschek, G. A., Matthews, S., Warren, H., Culhane, J. L., & Woods, M. M. 2017, ApJ, 842, 58
- Hirayama (1974) Hirayama, T. 1974, Sol. Phys., 34, 323 738L, 20
- Hong et al. (2016) Hong, J., Jiang, Y., Yang, J., Yang, B., Xu, Z., & Xiang, Y. 2016, ApJ, 830, 60
- Huang et al. (2012) Huang, Z., Madjarska, M. S., Doyle, J. G., & Lamb, D. A. 2012, A&A, 548, A62
- Hudson (2000) Hudson, H. S. 2000, ApJ, 531L, 75
- Imada, Bamba, & Kusano (2014) Imada, S., Bamba, Y., & Kusano, K. 2014, PASJ, 66, 17
- Janse & Low (2007) Janse, Å. M., & Low, B. C. 2007, A&A, 472, 957
- Jiang et al. (2013) Jiang, Y., Bi, Y., Yang, J., Li, H., Yang, B., & Zheng, R. 2013, ApJ, 775, 132
- Lemen et al. (2012) Lemen, J. R., Title, A. M., & Akin, D. J. et al.. 2012, Sol. Phys., 275, 17
- Li et al. (2015) Li, X., Yang, S., Chen, H., & Zhang, J. 2015 ApJ 814 13L
- Liu et al. (2015) Liu, J., Wang, Y., Shen, C., Liu, K., Pan, Z., & Wang, S. 2017, ApJ, 813, 115
- McCauley et al. (2015) McCauley, P. I., Su, Y. N., Schanche, N., Evans, K. E., Su, C., McKillop, S., & Reeves, K. K. 2015, Sol. Phys., 290, 1703
- McKenzie (2000) McKenzie, D. E. 2000, Sol. Phys., 195, 381
- Moore & LaBonte (1980) Moore, R. L., and LaBonte, B. 1980, in Proc. Symp. on Solar and Interplanetary Dynamics, Reidel, Boston, 207
- Moore et al. (1984) Moore, R. L., Hurford, G. J., Jones, H. P., & Kane, S. R. 1984, ApJ, 276, 379
- Moore et al. (2001) Moore, R. L., Sterling, A. C., Hudson, H. S., & Lemen, J. R. 2001, ApJ, 552, 833
- Moore et al. (2013) Moore R. L., Sterling A. C., Falconer D. A. & Robe D. 2013 ApJ, 769 134
- Nisticò (2009) Nisticò, G., Bothmer, V., Patsourakos, S., & Zimbardo, G. 2009, Sol. Phys., 259, 87
- Panesar et al. (2013) Panesar, N. K., Innes, D. E., Tiwari, S. K, & Low, B. C. 2013, A&A, 549, 105
- Panesar et al. (2016) Panesar, N. K., Sterling, A. C., Moore, R. L., & Chakrapani, P. 2016, ApJ, 832, L7
- Panesar et al. (2017) Panesar, N. K., Sterling, A. C., & Moore, & R. L. 2017, ApJ, 844, 131
- Panesar et al. (2018) Panesar, N. K., Sterling, A. C., & Moore, & R. L. 2018, ApJ, 853, 189
- Parenti (2014) Parenti, S. 2014, LRSP, 11, 1
- Raouafi et al. (2016) Raouafi, N. E., Patsourakos, S., Pariat, E., et al. 2016, SSRv, 201, 1
- Savage & McKenzie (2011) Savage, S. L., & McKenzie, D. E. 2011, ApJ, 730, 98
- Savage et al. (2012) Savage, S. L., McKenzie, D. E., & Reeves, K. K. 2012, ApJ, 747L, 40
- Savcheva et al. (2007) Savcheva, A., Cirtain, J. W., DeLuca, E. E., et al. 2007, PASJ, 59S, 771S
- Scherrer et al. (2012) Scherrer, P. H., et al. 2012, Sol. Phys., 275,207
- Shen et al. (2012a) Shen, Y., Liu, Y. E., Su, J., & Deng, Y. 2012a, ApJ, 745, 164
- Shen et al. (2012b) Shen, Y., Liu, Y. E., Su, J., & Deng, Y. 2012b, ApJ, 750, 12
- Shibata et al. (1992) Shibata, K., Ishido, Y., Acton, L. W., et al. 1992, PASJ, 44L, 173
- Shibata et al. (1994) Shibata, K., Nitta, N., Matsumoto, R., Tajima, T., Yokoyama, T., Hirayama, T., & Hudson, H. 1994, in Proc. of the International Symp. on the Yohkoh Scientific Results, X-Ray Solar Physics from Yohkoh, ed. Y. Uchida, T. Watanabe, K. Shibata, & H. S. Hudson (Tokyo: Univ. Academy Press), 29
- Shibata et al. (1995) Shibata, K., Masuda, S., Shimojo, M., et al. 1995, ApJ, 451L, 83
- Shimojo et al. (1996) Shimojo, M., Hashimoto, S., Shibata, K., Hirayama, T., Hudson, H. S., & Acton, L. W. 1996, PASJ, 48, 123
- Sterling & Moore (2005) Sterling, A. C. & Moore, R. L. 2005, ApJ, 630, 1148
- Sterling, Harra, & Moore (2007) Sterling, A. C., Harra, L. K., & Moore, R. L. 2007, ApJ, 669, 1359
- Sterling et al. (2014) Sterling, A. C., Moore, R. L., Falconer, D. A., & Knox, J. M. 2014, ApJ, 788L, 20
- Sterling et al. (2015) Sterling, A. C., Moore, R. L., Falconer, D. A., & Adams, M. 2015, Nature, 523, 437
- Sterling et al. (2016) Sterling, A. C., Moore, R. L., Falconer, D. A., et al. 2016, ApJ, 821, 100
- Sterling et al. (2017) Sterling, A. C., Moore, R. L., Falconer, D. A., Panesar, N. K., & Martinez, F. 2017, ApJ, 844, 28
- Sterling et al. (2018) Sterling, A. C., Moore, R. L., & Panesar, N. K. 2018, ApJ, in press
- Tian et al. (2017) Tian, Z., Liu, Y., Shen, Y., Elmhamdi, A., Su, J., Liu, Y. D., & Kordi, A. S. 2017, ApJ, 845, 94.
- Török & Kliem (2005) Török, T., & Kliem, B. 2005, ApJ, 630, L97
- Wang et al. (1994) Wang, H., Ewell, M. W., Jr., Zirin, H., & Ai, G. ApJ, 424, 436
- Warren et al. (2011) Warren, H. P., O’Brien, C. M., & Sheeley, N. R. Jr. 2011, ApJ, 742, 92
- Wheatland et al. (2018) Wheatland, M. S., Melrose, D. B., & Mastrano, A. 2018, ApJ, 864, 159
- Williams et al. (2009) Williams, D. R., Harra, L. K., Brooks, D. H., Imada, S., & Hansteen, V. H. 2011, PASJ, 61, 493
- Wyper et al. (2017) Wyper, P. F., Antiochos, S. K., & DeVore, C. R. 2017, Nature, 544, 452
- Wyper, DeVore, & Antiochos (2018) Wyper, P. F., DeVore, C. R., & Antiochos, S. K. 2018, ApJ, 852, 98
- Yokoyama & Shibata (1995) Yokoyama, T., & Shibata, K. 1995, Nature, 375, 42
- Yokoyama & Shibata (1996) Yokoyama, T., & Shibata, K. 1996, PASJ, 48, 353
- Young & Muglach (2014) Young, P. R., & Muglach, K. 2014, Sol. Phys., 289, 3313
- Zhang et al. (2016) Zhang, Q. M., Li, D., Ning, Z. J., Su, Y. N., Ji, H. S., & Guy, Y. 2016, ApJ, 827, 27
- Zheng et al. (2018) Zheng, R., Chen, Y., Huang, Z., Wang, B., Song, H., & Ning, H. 2018, ApJ, 861, 108 ApJ, 827, 27
- Zwaan (1987) Zwaan, C. 1987, ARA&A, 25, 83