Phase Diagram of Bi2Sr2CaCu2O8+δ Revisited
Abstract
In cuprate superconductors, the doping of carriers into the parent Mott insulator induces superconductivity and various other phases whose characteristic temperatures are typically plotted versus the doping level . In most materials, cannot be determined from the chemical composition, but it is derived from the superconducting transition temperature, , using the assumption that dependence on doping is universal. Here, we present angle-resolved photoemission studies of Bi2Sr2CaCu2O8+δ, cleaved and annealed in vacuum or in ozone to reduce or increase the doping from the initial value corresponding to K. We show that can be determined from the underlying Fermi surfaces and that in-situ annealing allows mapping of a wide doping regime, covering the superconducting dome and the non-superconducting phase on the overdoped side. Our results show a surprisingly smooth dependence of the inferred Fermi surface with doping. In the highly overdoped regime, the superconducting gap approaches the value of
introduction
Bi2Sr2CaCu2O8+δ (Bi2212) is a prototypical cuprate High-Tc Superconductor (HTSC) and one of the most studied materials in condensed matter physics. Its phase diagram has been heavily studied by many different techniques. In particular, Bi2212 has been the perfect subject for studies by Angle Resolved Photoemission Spectroscopy (ARPES) and Spectroscopic Imaging - Scanning Tunneling Microscopy (SI-STM) studies due to its ease of cleaving. These techniques have contributed significantly to our current understanding of the cuprates by providing invaluable information on different phenomena and their development with doping, mostly in Bi2212. The -wave symmetry of the superconducting (SC) gap Shen1993 ; Damascelli2003 , the normal state gap (pseudogap) Ding1996 ; Marshall1996 ; Renner1998 , the quasiparticle (QP) self-energy Valla1999 ; Johnson2001a ; Damascelli2003 and, more recently, the transition in topology of the Fermi surface (FS) from open to closed Yang2011 ; Fujita2014 are a few notable examples of such contributions. However, Bi2212 can only be doped within a relatively limited range, especially on the overdoped side, where the superconducting transition temperature () cannot be reduced beyond K, leaving a large and important region of the phase diagram out of reach. Even within the covered region, the actual doping level is not independently determined, but it is usually calculated from the measured by assuming the putative parabolic dependence that is considered universal for all the cuprates Obertelli1992 . Only in a very limited number of materials such as La2-xSrxCuO4 and La2-xBaxCuO4, can the doping be approximately determined from chemical composition as . These two materials however, have very different dependences, illustrating the invalidity of the universal parabolic dome Moodenbaugh1988 .
Here, we revisit the Bi2212 phase diagram by modifying the doping level of the as-grown crystal, by annealing in-situ cleaved samples either in vacuum, resulting in homogeneous underdoping, or in ozone, resulting in overdoping of the near-surface region. We were able to span a wide region of the phase diagram, ranging from strongly underdoped, with the reduced down to 30 K (UD30), to strongly overdoped, where the superconductivity was completely suppressed (OD0). In addition, we were able to infer the doping level directly from ARPES, by measuring the volume of the underlying Fermi surface. In that way, we follow the development of spectral features with doping with unprecedented clarity and detail and construct the phase diagram of Bi2Sr2CaCu2O8+δ.
Results
.1 Fermi Surface
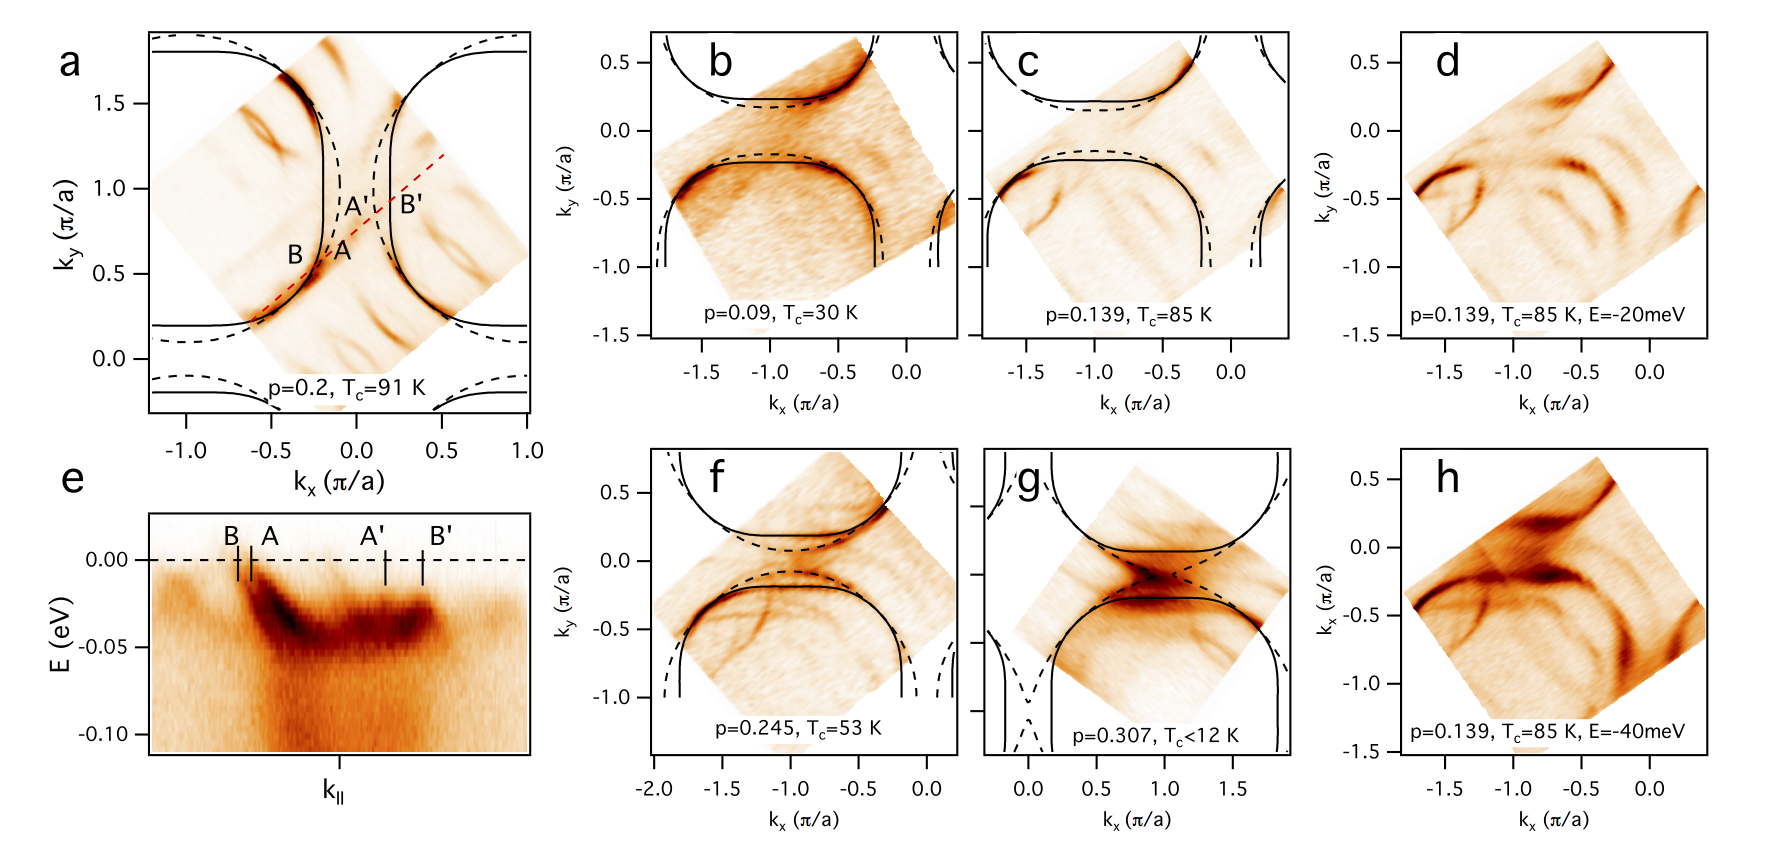
Figure 1 shows the photoemission intensity integrated within meV around the Fermi level for the as-grown sample and for several different doping levels, induced by annealing in vacuum, or ozone. Due to the presence of the spectral gap, only the near-nodal segments are visible, while the intensity is strongly reduced or absent in most of the Brillouin zone (BZ), except in the highly overdoped samples with reduced gaps. As we move down in energy, more and more of the missing intensity is recovered, and at the energy of the maximal spectral gap (), the full, closed contour of the underlying Fermi surface is recovered. Although the Luttinger theorem requires that, to determine the carrier density, one measures the closed contours only for quasiparticles at (Fermi level), this is rendered impossible by the existence of the spectral gap. Therefore, we hypothesize that the contour of minimum gap energy may be used for the same purpose. This hypothesis assumes particle-hole symmetry of the gapped state about the chemical potential. In that case, connecting the () points where the intensity first appears, yields the curves of minimal gap loci, which we refer to throughout as the underlying Fermi surfaces. Mapping at higher temperatures, above and above the pseudogap temperature, , that was performed at several doping levels (see Methods section), shows exactly the same Fermi contours, supporting our approach. We do not see any change in shape between the low- and high-temperature Fermi contours that were previously reported in ref. He2011 . Figure 1 also shows tight binding (TB) contours, with solid (dashed) lines representing the bonding (antibonding) states Norman1995 ; Ding1996a ; Markiewicz2005 . The TB parameters for several doping levels are given in the Methods section. The number of carriers forming the underlying Fermi surface is obtained from the Luttinger count of the area enclosed by the Fermi contour, . To express this in terms of doping that usually serves as the abscissa in phase diagrams of the cuprates, we calculate the number of additional holes doped into the parent Mott insulator as . Here, both the bonding and the antibonding states are counted, , originating from two Cu-O planes per unit cell, and the area of the BZ is set to one. We now have an independent doping parameter for Bi2Sr2CaCu2O8+δ and do not have to rely on the universal dome when plotting the phase diagram.
We note that differs from the concentration of mobile carriers contributing to transport, , a quantity that has been difficult to measure directly and accurately. However, recent models and high field studies have indicated that the mobile hole density switches from in the underdoped samples to near optimal doping Ando2004a ; Gorkov2006 ; Badoux2016 .
In this study, the underlying Fermi surface shows a smooth development with doping, with no evidence for the transition from a small Fermi pocket to big Fermi surface. Due to the structural supermodulation, multiple diffracted replicas of the intrinsic band structure are observed in addition to the “shadow” Fermi surface, shifted by () Norman1995 ; Ding1996a . The intrinsic underlying Fermi surface keeps the same topology across most of the doping regime: the two big Fermi surfaces, corresponding to the bonding and antibonding states, resolved in all but the least doped (UD30) sample, remain hole-like. Only at the highest doping levels, where the superconductivity gets suppressed beyond our limits of detection, the antibonding Fermi surface undergoes the Lifshitz transition and becomes an electron pocket centered at (). No conventional reconstruction of the underlying Fermi surface is visible in our data that we can assign to the charge or spin orders observed in some other cuprates Doiron-Leyraud2007 ; Ghiringhelli2012 ; Wu2011 ; Badoux2016 . On the contrary, the observed smooth development with doping would imply that the underlying electronic structure of Bi2212 could be approximated by the same TB bands filled to different levels (Table 1 in the Methods section), in line with the recent proposal by Pelc et al Pelc2017 . Also, the effects of charge ordering observed in the single-layer compound (Bi,Pb)2(Sr,La)2CuO6+δ by Comin et al Comin2014 , but not by Kondo et al Kondo2004 , do not show up in any of our samples. We also do not observe changes in -space coherence of the low-energy quasiparticle excitations when they cross the antiferromagnetic zone boundary Fujita2014 . In all samples studied here in the superconducting phase, quasiparticles retain coherence on both sides of this boundary.
Our study, however, does confirm that the actual Fermi surface of Bi2212 is strongly affected by the pseudogap, i.e. it is partially gapped in the normal state in the wide portion of the phase diagram Ding1996 ; Marshall1996 ; Damascelli2003 ; Yang2011 . Our findings are consistent with the general notion that the electronic states cross the Fermi level only in the nodal region, forming the so-called Fermi arcs that grow in length with increasing doping and eventually enclose the whole underlying FS. Whether these arcs arise due to the gap closing, or its filling is still debated Kanigel2006 ; Reber2012 ; Kondo2015 , but the general picture is in line with modern -resolved calculations based on Mott physics that reproduce the nodal-antinodal dichotomy observed in experiments Ferrero2009 . We note that the Fermi arcs cannot be distinguished from the small Fermi pockets in which only one side is observable, while the other is invisible due to the zero spectral weight Yang2006 ; Yang2011 ; Fujita2014 . For similar reasons, the observed maps cannot exclude the existence of a pair density wave state, as the relevant portions of reconstructed Fermi surface also carry a vanishing spectral weight in that scenario Norman2018 . To differentiate between these pictures, further theoretical and experimental studies will be required.
.2 Spectral Gap
In the following, we extract the spectral gap and of each modified sample in order to reconstruct the appropriate phase diagram for Bi2Sr2CaCu2O8+δ. Vacuum annealing results in a seemingly homogeneous doping profile with the surface measured by ARPES showing good agreement with the bulk susceptibility measurements. Thus, on the underdoped side, we usually have two independent measurements of . However, annealing in ozone results in increased doping only in the near-surface region. Therefore, the only measure of in the overdoped regime was spectroscopic: the temperature induced changes in the quasiparticle peak intensity, as well as the leading edge position clearly indicate Damascelli2003 ; Kondo2015 .
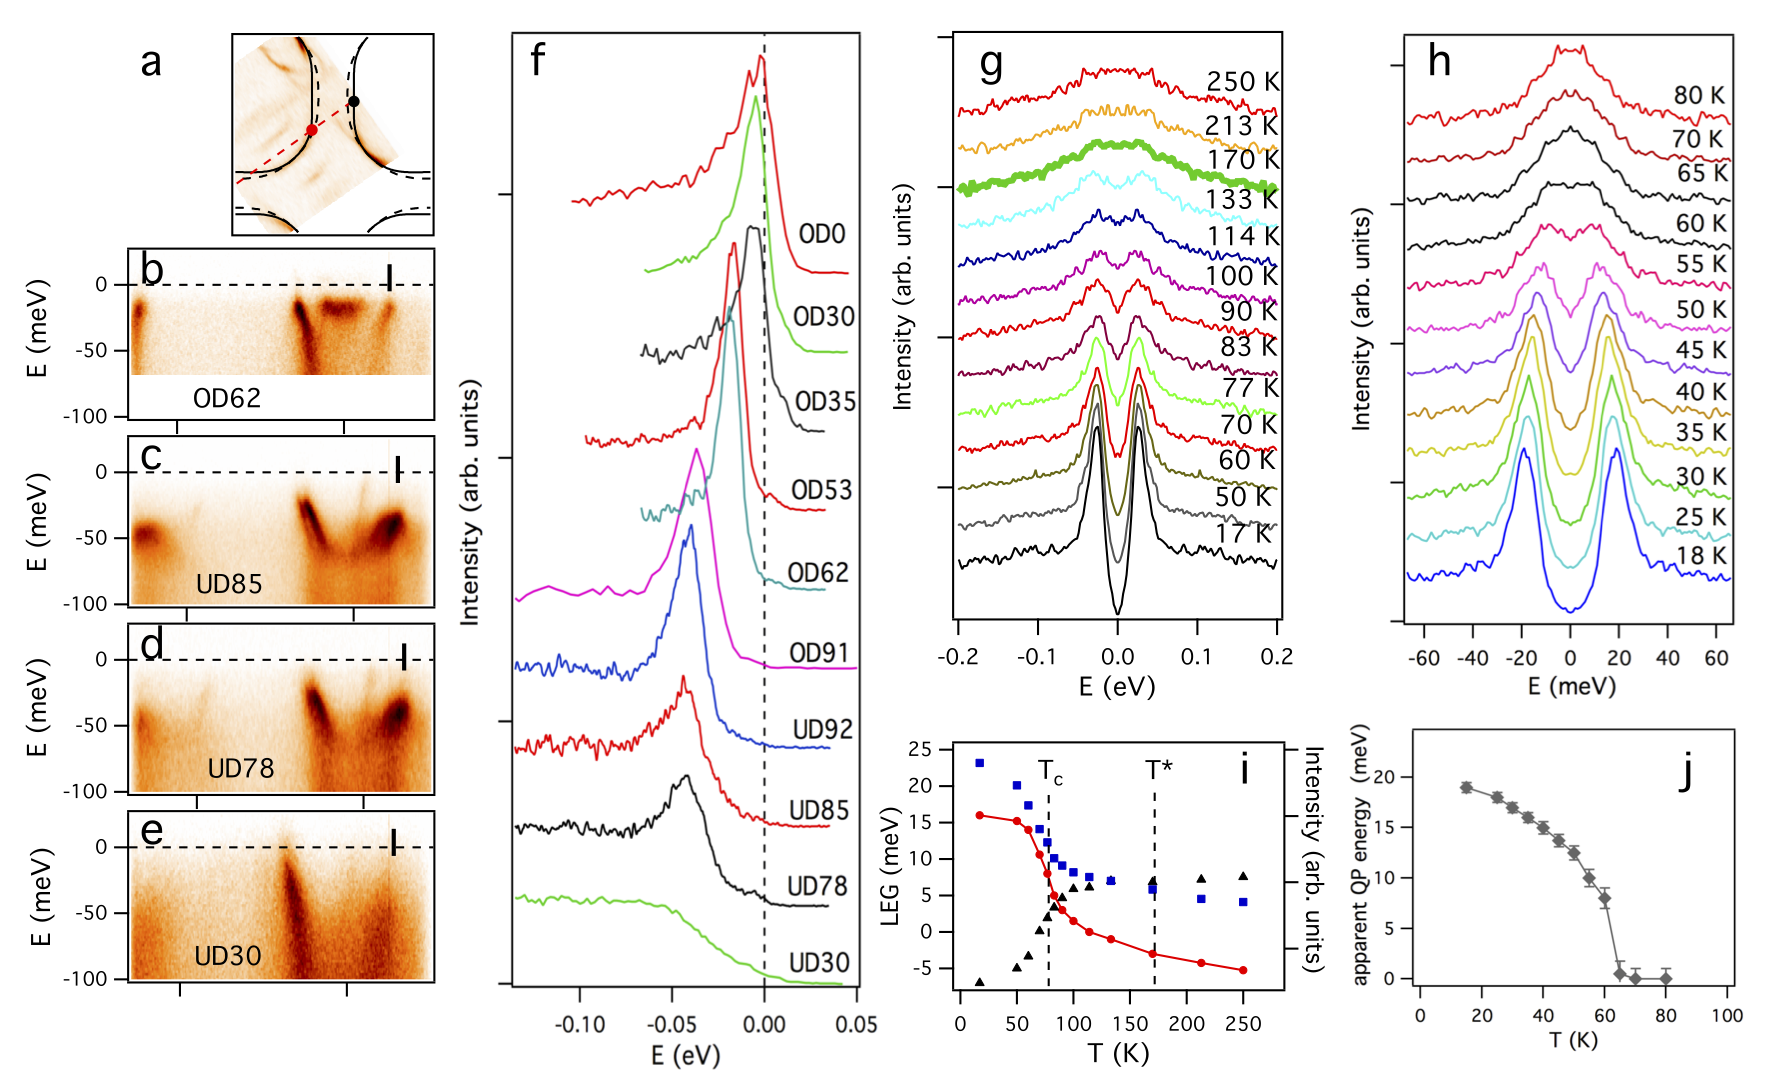
Figure 2 shows the total spectral gap from the antinodal region () and its temperature dependence for several selected samples with different doping levels. At the antinodal point the -wave superconducting gap has its maximal amplitude. The normal state gap (pseudogap) is also maximal there Ding1996 ; Marshall1996 ; Damascelli2003 ; Valla2006 ; Yang2011 . The energy distribution curves from that point, shown in Fig.2(f), clearly indicate that the quasiparticle peak is shifting closer to the Fermi level as the doping increases, reflecting the reduction of the spectral gap. Also shown is the typical temperature dependence of the spectra for an underdoped sample (UD78) and an overdoped sample (OD62). For the underdoped sample, the gap does not close at determined from susceptibility measurements, but at some higher temperature . However, the leading edge gap and intensity of the QP peak show a prominent change around and the later could be identified as being near the inflection point of these temperature dependencies (Fig. 2(i-j)) Kondo2015 .
.3 Phase Diagram
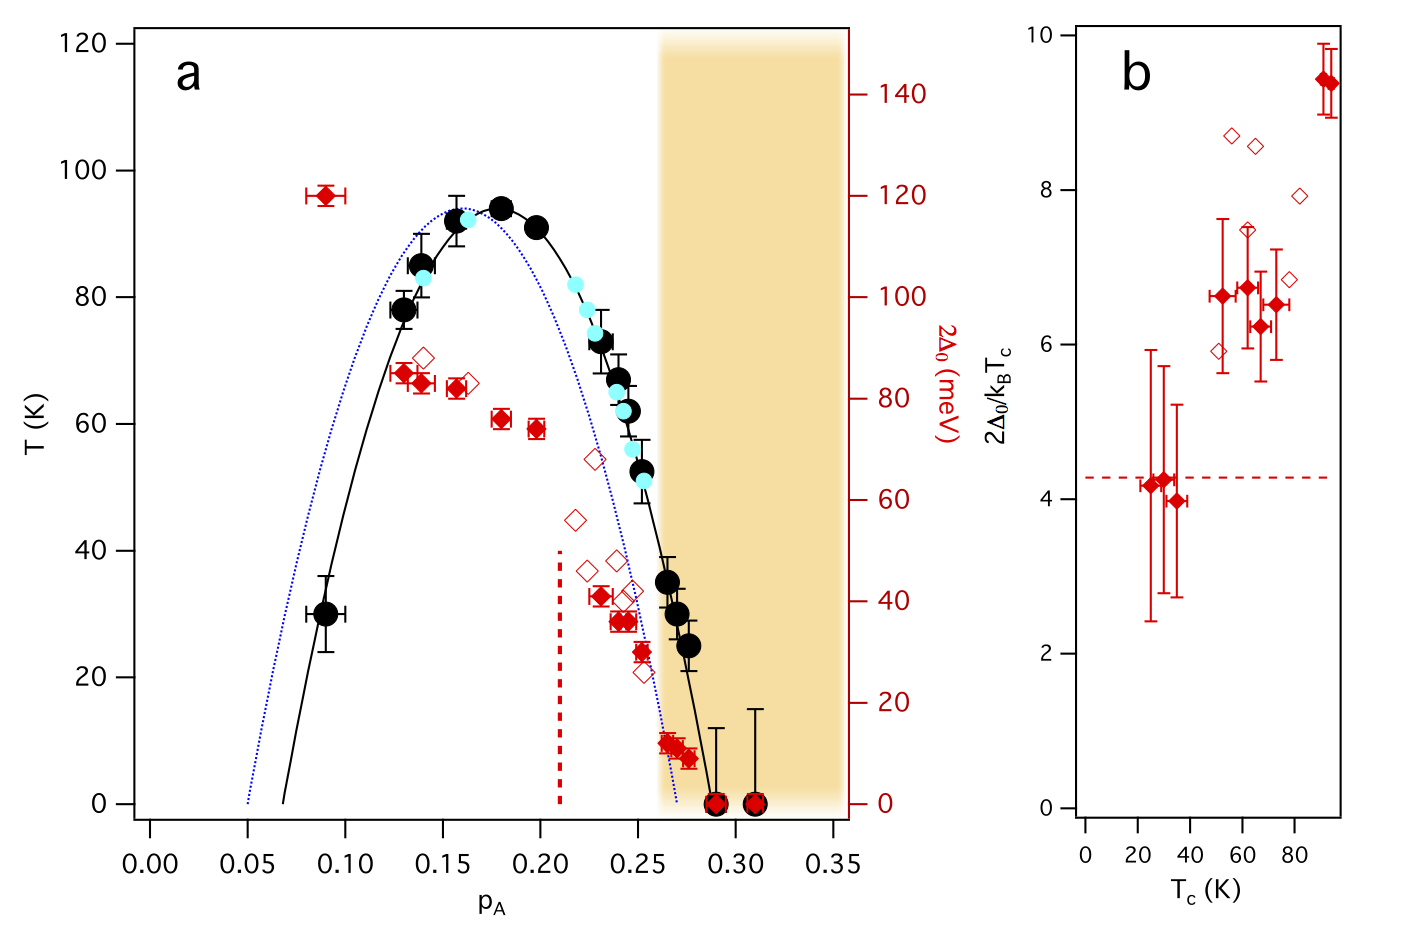
The antinodal gap magnitude, is determined from the symmetrized spectra as the position of the quasiparticle peak and plotted in Fig.3 for all the doping levels covered in this study. The superconducting transition temperature, , is also plotted. We first note that most of our data agree well with previous studies; gaps and transition temperatures from the present study follow the same trends with very little discrepancies Renner1998 ; Ozyuzer2000 ; Yusof2002 ; Damascelli2003 ; Hwang2004 ; Gomes2007 ; Keimer2015 ; Benhabib2015 . The only adjustment needed for the perfect overlap with the previous studies was the shift in the doping level . The superconducting dome for Bi2Sr2CaCu2O8+δ is now centered at . Its width remained approximately the same, in agreement with another study that reported the shift Zhang2016 . The data from the literature are placed in accordance to the new doping scale.
Discussion
The important new ingredient of the re-drawn phase diagram (Fig.3) is the completely new doping regime that is covered by this study (represented with the shaded area in Fig.3(a)): the highly overdoped regime, far beyond what was previously explored in Bi2212, has now been mapped, including the critical point at which superconductivity vanishes. As shown in Fig.3(b), it is only in this regime () that actually acquires low values consistent with those inferred by extrapolation from less overdoped regime in previous studies Ino2013 .
With further increase in doping, both the gap and vanish around and Bi2212 is no longer a superconductor. It is intriguing that this coincides with the change in Fermi surface topology: the antibonding Fermi surface undergoes a conventional Lifshitz transition, turning from a hole-like into an electron-like, as its saddle points at and move above the Fermi level. The coincidence of these two transitions hints at the importance of the Fermi surface topology for superconductivity in the cuprates, but its exact role remains unclear. In the single layer counterpart, (Bi,Pb)2(Sr,La)2CuO6+δ, the Lifshitz transition is also coincidental with vanishing superconductivity Kondo2004 . This material, moreover, shows much more drastic departure from the universal superconducting dome, with the maximal occurring near . In Bi2Sr2CaCu2O8+δ, the Lifshitz transition affects only one FS and not the other. This would suggest that the changes in the antibonding state are for some reason more important for superconductivity than those in the bonding state. At this moment, it is not clear why this should be the case. One suggestion could be that the straight segments of the bonding state’s Fermi surface are susceptible to nesting and are involved in charge, spin or pair density waves, instead of superconductivity. However, in this highly overdoped regime, the lack of a gap and other effects that these phenomena should induce into the spectral response certainly argues against this scenario. Still, it seems that the curvature (or a lack of it) of the Fermi surface in the antinodal region plays a significant role in cuprate superconductivity and that the straight antinodal segments of the FS might be ineffective in forming the efficient singlet pairs even when not contributing to density waves. This might be because the group velocity of these straight segments lacks the component that would connect them from to into singlet pairs. Further studies on other multi-layered cuprate superconductors will be necessary to resolve these questions.
Methods
.4 Sample Preparation
The experiments within this study were done in a new experimental facility that integrates oxide-MBE with ARPES and STM capabilities within the common vacuum system Kim2018a . The starting samples were slightly overdoped ( K) single-crystals of Bi2Sr2CaCu2O8+δ, synthesized by the traveling floating zone method. They were clamped to the sample holder and cleaved with Kapton tape in the ARPES preparation chamber (base pressure of Pa). Thus, the silver-epoxy glue, commonly used for mounting samples and associated processing at elevated temperatures, has been completely eliminated, resulting in perfectly flat cleaved surfaces and unaltered doping level.
The cleaved samples were then annealed in-situ in the ARPES preparation chamber to different temperatures ranging from 150 to 700∘C for several hours, resulting in the loss of oxygen and underdoping. For the overdoping, the cleaved as-grown samples were transfered to the MBE chamber (base pressure of Pa) where they were annealed in Pa of cryogenically distilled O3 at 350-480∘C for 1 hour. After the annealing, films were cooled to room temperature in the ozone atmosphere and transfered to the ARPES chamber (base pressure of Pa. Vacuum annealing results in generally homogeneous doping profile where the surface measured by ARPES shows no variation with repeated re-cleaving of the annealed crystals and is in a good agreement with the bulk susceptibility measurements. Annealing of as grown crystals in O3 results in increased doping in the near-surface region, as evidenced by the increased hole Fermi surface, reduced spectral gap and its closing temperature. The most of the crystal’s volume remained near the optimal doping upon ozone annealing. The thickness of the overdoped surface layer was in the sub-micron range, as only the thinnest, semi-transparent re-cleaved flakes showed the significant reduction in in susceptibility measurements.
.5 ARPES
The ARPES experiments were carried out on a Scienta SES-R4000 electron spectrometer with the monochromatized HeI (21.22 eV) radiation (VUV-5k). The total instrumental energy resolution was 5 meV. Angular resolution was better than and along and perpendicular to the slit of the analyzer, respectively.
The ARPES estimate of of the overdoped surfaces was within K, except for the two samples falling outside of the superconducting dome, for which the estimate was limited by the base temperature that could be reached with our cryostat (12 and 15 K, for these two cases).
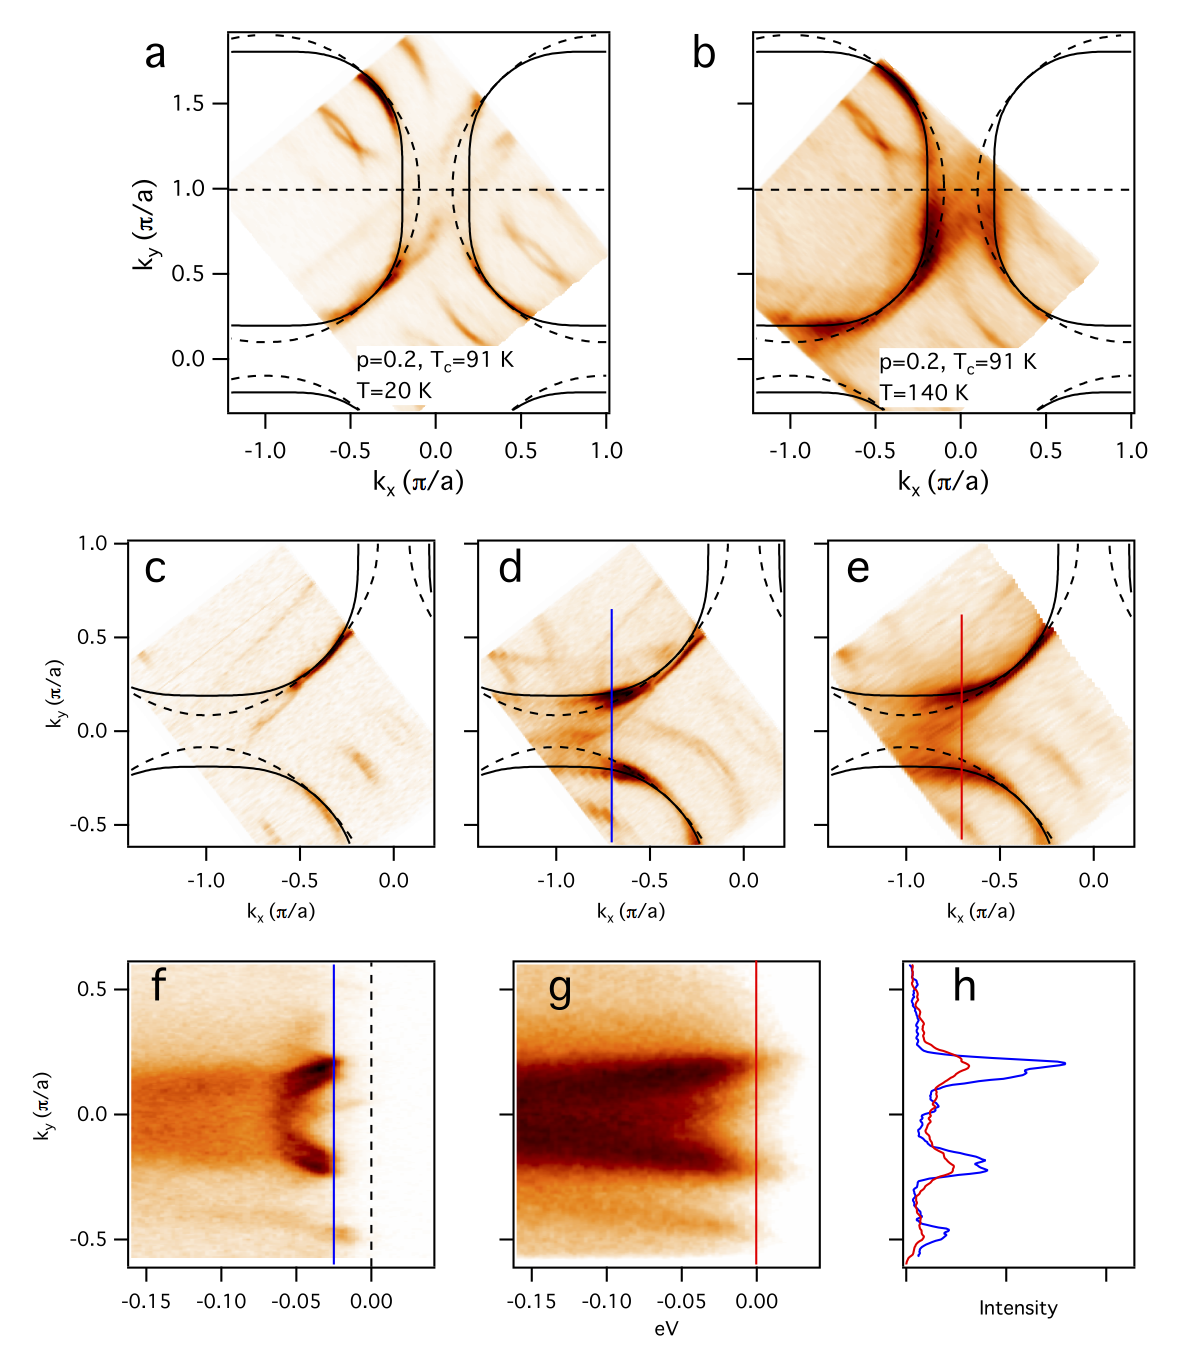
Maps of the underlying Fermi surfaces in the superconducting state (gapped state) agree perfectly well with fully enclosed Fermi surface contours obtained in the state without any spectral gaps at as was checked for several samples, including the OD91, UD87 (Fig.4) and several overdoped samples. Positions of minimal gap loci in the SC state overlap with the positions of Fermi momenta in the normal (gapless) state within the experimental resolution.
.6 Tight Binding Parameters
| Sample | (meV) | (meV) | (meV) | (meV) | (meV) |
|---|---|---|---|---|---|
| UD30 | 340 | 390 | 120 | 45 | 108 |
| UD78 | 330 | 350 | 100 | 45 | 95 |
| OD91 | 405 | 360 | 108 | 36 | 108 |
| OD67 | 430 | 360 | 108 | 36 | 108 |
| OD35 | 445 | 360 | 108 | 36 | 108 |
| OD0 | 467 | 360 | 108 | 36 | 108 |
The bare in-plane band structure of Bi2Sr2CaCu2O8+δ used to fit the experimental FS contours is approximated by the tight-binding formula:
| (1) |
where the index A (B) is for anti-bonding (bonding) state and is chemical potential. The hopping parameters that best describe the Fermi surfaces of selected measured samples are given in Table I.
The TB contours that agree with the experimental contours the best were chosen by eye. By changing them to the point where discrepancies would become clearly visible, we can estimate that the uncertainty in doping, , of this method is very close to that estimated from the experimental momentum width of the Fermi surface, .
The electronic structure of Bi2212 could be approximated by nearly the same TB parameters in the whole doping range covered in this study, indicating that our data show no evidence for dramatic transitions involving charge/spin ordered states with substantial spectral weight redistribution as doping is swept from strongly underdoped () to strongly overdoped, non-superconducting () regime. This observation suggests that in the studied doping range, the underlying electronic structure of Bi2212 can, in essence, be described as the progressive filling of the same bilayer split bands, with spectral gaps and pseudogaps as additional necessary ingredients in superconducting samples.
Data availability
The data that support the findings of this study are available from the corresponding author upon reasonable request. The source data underlying Figs 2j and 3a-b are provided as a Source Data file.
References
- (1) Z.-X. Shen, D. S. Dessau, B. O. Wells, D. M. King, W. E. Spicer, A. J. Arko, D. Marshall, L. W. Lombardo, A. Kapitulnik, P. Dickinson, S. Doniach, J. DiCarlo, T. Loeser, and C. H. Park. Anomalously large gap anisotropy in the a - b plane of Bi2Sr2CaCu2O8+δ. Physical Review Letters, 70, 1553–1556 (1993).
- (2) A. Damascelli, Z. Hussain, and Z.-X. Shen. Angle-resolved photoemission studies of the cuprate superconductors. Reviews of Modern Physics, 75, 473 (2003).
- (3) H. Ding, T. Yokoya, J. C. Campuzano, T. Takahashi, M. Randeria, M. R. Norman, T. Mochiku, K. Kadowaki, and J. Giapintzakis. Spectroscopic evidence for a pseudogap in the normal state of underdoped high-T c superconductors. Nature, 382, 51–54 (1996).
- (4) D. S. Marshall, D. S. Dessau, A. G. Loeser, C.-H. Park, A. Y. Matsuura, J. N. Eckstein, I. Bozovic, P. Fournier, A. Kapitulnik, W. E. Spicer, and Z.-X. Shen. Unconventional Electronic Structure Evolution with Hole Doping in Bi2Sr2CaCu2O8+δ : Angle-Resolved Photoemission Results. Physical Review Letters, 76, 4841–4844 (1996).
- (5) C. Renner, B. Revaz, J.-Y. Genoud, K. Kadowaki, and Ø. Fischer. Pseudogap Precursor of the Superconducting Gap in Under- and Overdoped Bi2Sr2CaCu2O8+δ. Physical Review Letters, 80, 149–152 (1998).
- (6) T. Valla, A. V. Fedorov, P. D. Johnson, B. O. Wells, S. L. Hulbert, Q. Li, G. D. Gu, and N. Koshizuka. Evidence for Quantum Critical Behavior in the Optimally Doped Cuprate Bi2Sr2CaCu2O8+δ. Science, 285, 2110–2113 (1999).
- (7) P. Johnson, T. Valla, A. Fedorov, Z. Yusof, B. Wells, Q. Li, A. Moodenbaugh, G. Gu, N. Koshizuka, C. Kendziora, S. Jian, and D. Hinks. Doping and Temperature Dependence of the Mass Enhancement Observed in the Cuprate Bi2Sr2CaCu2O8+δ. Physical Review Letters, 87, 177007 (2001).
- (8) H.-B. Yang, J. D. Rameau, Z.-H. Pan, G. D. Gu, P. D. Johnson, H. Claus, D. G. Hinks, and T. E. Kidd. Reconstructed Fermi Surface of Underdoped Bi2Sr2CaCu2O8+δ Cuprate Superconductors. Physical Review Letters, 107, 047003 (2011).
- (9) K. Fujita, C. K. Kim, I. Lee, J. Lee, M. H. Hamidian, I. A. Firmo, S. Mukhopadhyay, H. Eisaki, S. Uchida, M. J. Lawler, E.-A. Kim, J. C. Davis, H. Ikuta, P. Mistark, R. S. Markiewicz, A. Bansil, S. Sachdev, E. W. Hudson, and J. E. Hoffman. Simultaneous transitions in cuprate momentum-space topology and electronic symmetry breaking. Science (New York, N.Y.), 344, 612–6 (2014).
- (10) S. D. Obertelli, J. R. Cooper, and J. L. Tallon. Systematics in the thermoelectric power of high- Tc oxides. Physical Review B, 46, 14928–14931 (1992).
- (11) A. R. Moodenbaugh, Y. Xu, M. Suenaga, T. J. Folkerts, and R. N. Shelton. Superconducting properties of La2-xBaxCuO4. Physica C Superconductivity, 38, 4596 (1988).
- (12) R.-H. He, M. Hashimoto, H. Karapetyan, J. D. Koralek, J. P. Hinton, J. P. Testaud, V. Nathan, Y. Yoshida, H. Yao, K. Tanaka, W. Meevasana, R. G. Moore, D. H. Lu, S.-K. Mo, M. Ishikado, H. Eisaki, Z. Hussain, T. P. Devereaux, S. A. Kivelson, J. Orenstein, A. Kapitulnik, and Z.-X. Shen. From a Single-Band Metal to a High-Temperature Superconductor via Two Thermal Phase Transitions. Science, 331, 1579–1583 (2011).
- (13) M. R. Norman, M. Randeria, H. Ding, and J. C. Campuzano. Phenomenological models for the gap anisotropy of Bi2Sr2CaCu2O8+δ as measured by angle-resolved photoemission spectroscopy. Physical Review B, 52, 615–622 (1995).
- (14) H. Ding, A. F. Bellman, J. C. Campuzano, M. Randeria, M. R. Norman, T. Yokoya, T. Takahashi, H. Katayama-Yoshida, T. Mochiku, K. Kadowaki, G. Jennings, and G. P. Brivio. Electronic Excitations in Bi2Sr2CaCu2O8+δ : Fermi Surface, Dispersion, and Absence of Bilayer Splitting. Physical Review Letters, 76, 1533–1536 (1996).
- (15) R. S. Markiewicz, S. Sahrakorpi, M. Lindroos, H. Lin, and A. Bansil. One-band tight-binding model parametrization of the high- Tc cuprates including the effect of kz dispersion. Physical Review B, 72, 054519 (2005).
- (16) Y. Ando, Y. Kurita, S. Komiya, S. Ono, and K. Segawa. Evolution of the Hall Coefficient and the Peculiar Electronic Structure of the Cuprate Superconductors. Physical Review Letters, 92, 197001 (2004).
- (17) L. P. Gor’kov and G. B. Teitel’baum. Interplay of Externally Doped and Thermally Activated Holes in La2-xSrxCuO4 and Their Impact on the Pseudogap Crossover. Physical Review Letters, 97, 247003 (2006).
- (18) S. Badoux, W. Tabis, F. Laliberté, G. Grissonnanche, B. Vignolle, D. Vignolles, J. Béard, D. A. Bonn, W. N. Hardy, R. Liang, N. Doiron-Leyraud, L. Taillefer, and C. Proust. Change of carrier density at the pseudogap critical point of a cuprate superconductor. Nature, 531, 210–214 (2016).
- (19) N. Doiron-Leyraud, C. Proust, D. LeBoeuf, J. Levallois, J.-B. Bonnemaison, R. Liang, D. A. Bonn, W. N. Hardy, and L. Taillefer. Quantum oscillations and the Fermi surface in an underdoped high-Tc superconductor. Nature, 447, 565–568 (2007).
- (20) G. Ghiringhelli, M. Le Tacon, M. Minola, S. Blanco-Canosa, C. Mazzoli, N. B. Brookes, G. M. De Luca, A. Frano, D. G. Hawthorn, F. He, T. Loew, M. Moretti Sala, D. C. Peets, M. Salluzzo, E. Schierle, R. Sutarto, G. A. Sawatzky, E. Weschke, B. Keimer, and L. Braicovich. Long-range incommensurate charge fluctuations in (Y,Nd)Ba2Cu3O6+x. Science (New York, N.Y.), 337, 821–5 (2012).
- (21) T. Wu, H. Mayaffre, S. Krämer, M. Horvatić, C. Berthier, W. N. Hardy, R. Liang, D. A. Bonn, and M.-H. Julien. Magnetic-field-induced charge-stripe order in the high-temperature superconductor YBa2Cu3Oy. Nature, 477, 191–194 (2011).
- (22) D. Pelc, P. Popčević, G. Yu, M. Požek, M. Greven, and N. Barišić. Unusual behavior of cuprates explained by heterogeneous charge localization. https://arxiv.org/abs/1710.10221 (2017).
- (23) R. Comin, A. Frano, M. M. Yee, Y. Yoshida, H. Eisaki, E. Schierle, E. Weschke, R. Sutarto, F. He, A. Soumyanarayanan, Y. He, M. Le Tacon, I. S. Elfimov, J. E. Hoffman, G. A. Sawatzky, B. Keimer, and A. Damascelli. Charge order driven by Fermi-arc instability in Bi2Sr2-xLaxCuO6+δ. Science (New York, N.Y.), 343, 390–2 (2014).
- (24) T. Kondo, T. Takeuchi, T. Yokoya, S. Tsuda, S. Shin, and U. Mizutani. Hole-concentration dependence of band structure in (Bi,Pb)2(Sr,La)2CuO6+δ determined by the angle-resolved photoemission spectroscopy. Journal of Electron Spectroscopy and Related Phenomena, 137-140, 663–668 (2004).
- (25) A. Kanigel, M. R. Norman, M. Randeria, U. Chatterjee, S. Souma, A. Kaminski, H. M. Fretwell, S. Rosenkranz, M. Shi, T. Sato, T. Takahashi, Z. Z. Li, H. Raffy, K. Kadowaki, D. Hinks, L. Ozyuzer, and J. C. Campuzano. Evolution of the pseudogap from Fermi arcs to the nodal liquid. Nature Physics, 2, 447–451 (2006).
- (26) T. J. Reber, N. C. Plumb, Z. Sun, Y. Cao, Q. Wang, K. McElroy, H. Iwasawa, M. Arita, J. S. Wen, Z. J. Xu, G. Gu, Y. Yoshida, H. Eisaki, Y. Aiura, and D. S. Dessau. The origin and non-quasiparticle nature of Fermi arcs in Bi2Sr2CaCu2O8+δ. Nature Physics, 8, 606–610 (2012).
- (27) T. Kondo, W. Malaeb, Y. Ishida, T. Sasagawa, H. Sakamoto, T. Takeuchi, T. Tohyama, and S. Shin. Point nodes persisting far beyond Tc in Bi2212. Nature Communications, 6, 7699 (2015).
- (28) M. Ferrero, P. S. Cornaglia, L. De Leo, O. Parcollet, G. Kotliar, and A. Georges. Pseudogap opening and formation of Fermi arcs as an orbital-selective Mott transition in momentum space. Physical Review B, 80, 064501 (2009).
- (29) K.-Y. Yang, T. M. Rice, and F.-C. Zhang. Phenomenological theory of the pseudogap state. Physical Review B, 73, 174501 (2006).
- (30) M. R. Norman and J. C. S. Davis. Quantum oscillations in a biaxial pair density wave state. Proceedings of the National Academy of Sciences of the United States of America, 115, 5389–5391 (2018).
- (31) T. Valla, A. V. Fedorov, J. Lee, J. C. Davis, and G. D. Gu. The ground state of the pseudogap in cuprate superconductors. Science (New York, N.Y.), 314, 1914–6 (2006).
- (32) L. Ozyuzer, J. F. Zasadzinski, C. Kendziora, and K. E. Gray. Quasiparticle and Josephson tunneling of overdoped Bi2Sr2CaCu2O8+δ single crystals. Physical Review B, 61, 3629–3640 (2000).
- (33) Z. Yusof, B. Wells, T. Valla, A. Fedorov, P. Johnson, Q. Li, C. Kendziora, S. Jian, and D. Hinks. Quasiparticle Liquid in the Highly Overdoped Bi2Sr2CaCu2O8+δ. Physical Review Letters, 88, 167006 (2002).
- (34) K. K. Gomes, A. N. Pasupathy, A. Pushp, S. Ono, Y. Ando, and A. Yazdani. Visualizing pair formation on the atomic scale in the high-Tc superconductor Bi2Sr2CaCu2O8+δ. Nature, 447, 569–572 (2007).
- (35) J. Hwang, T. Timusk, and G. D. Gu. High-transition-temperature superconductivity in the absence of the magnetic-resonance mode. Nature, 427, 714–717 (2004).
- (36) B. Keimer, S. A. Kivelson, M. R. Norman, S. Uchida, and J. Zaanen. From quantum matter to high-temperature superconductivity in copper oxides. Nature, 518, 179–186 (2015).
- (37) S. Benhabib, A. Sacuto, M. Civelli, I. Paul, M. Cazayous, Y. Gallais, M.-A. Méasson, R. D. Zhong, J. Schneeloch, G. D. Gu, D. Colson, and A. Forget. Collapse of the Normal-State Pseudogap at a Lifshitz Transition in the Bi2Sr2CaCu2O8+δ Cuprate Superconductor. Physical Review Letters, 114, 147001 (2015).
- (38) Y. Zhang, C. Hu, Y. Hu, L. Zhao, Y. Ding, X. Sun, A. Liang, Y. Zhang, S. He, D. Liu, L. Yu, G. Liu, X. Dong, G. Gu, C. Chen, Z. Xu, and X. Zhou. In situ carrier tuning in high temperature superconductor Bi2Sr2CaCu2O8+δ by potassium deposition. Science Bulletin, 61, 1037–1043 (2016).
- (39) A. Ino, H. Anzai, M. Arita, H. Namatame, M. Taniguchi, M. Ishikado, K. Fujita, S. Ishida, and S. Uchida. Doping dependence of low-energy quasiparticle excitations in superconducting Bi2212. Nanoscale Research Letters, 8, 515 (2013).
- (40) C. K. Kim, I. K. Drozdov, K. Fujita, J. C. S. Davis, I. Božović, and T. Valla. In-situ angle-resolved photoemission spectroscopy of copper-oxide thin films synthesized by molecular beam epitaxy. in press, https://doi.org/10.1016/j.elspec.2018.07.003 (2018).
Acknowledgements
We thank J. Tranquada, R. Konik and J. Misewich for discussions. This work was supported by the US Department of Energy, Office of Basic Energy Sciences, contract no. DE-AC02-98CH10886. I.P. is supported by ARO MURI program, grant W911NF-12-1-0461. I.K.D. acknowledges the generous financial support of the BNL Gertrude and Maurice Goldhaber Distinguished Fellowship.
Author information
.7 Affiliations
Condensed Matter Physics and Materials Science Department, Brookhaven National Lab, Upton, New York 11973, USA
I. K. Drozdov, I. Pletikosić, C.-K. Kim, K. Fujita, G. D. Gu, J. C. Séamus Davis, P. D. Johnson, I. Božović and T. Valla
Department of Physics, Princeton University, Princeton, NJ 08544, USA
I. Pletikosić
Laboratory of Atomic and Solid State Physics, Department of Physics, Cornell University, Ithaca, NY 14853, USA
J. C. Séamus Davis
.8 Contributions
I.K.D. and T.V. designed and directed the study. G.D.G. grew the bulk crystals and performed magnetization measurements. I.K.D. performed the sample preparation in ozone. I.P. and T.V. performed the ARPES experiments. T.V. analyzed and interpreted data and wrote the manuscript. I.K.D., I.P., C.K.K., K.F., J.C.S.D., P.D.J., I.B and T.V. made contributions to development of the OASIS facility used herein and commented on the manuscript.
.9 Competing interests
The authors declare no competing interests.
.10 Corresponding author
Correspondence should be addressed to T.V. (valla@bnl.gov).