Computationally-driven, high throughput identification of CaTe and \ceLi3Sb as promising candidates for high mobility p-type transparent conducting materials
Abstract
High-performance p-type transparent conducting materials (TCMs) must exhibit a rare combination of properties including high mobility, transparency and p-type dopability. The development of high-mobility/conductivity p-type TCMs is necessary for many applications such as solar cells, or transparent electronic devices. Oxides have been traditionally considered as the most promising chemical space to dig out novel p-type TCMs. However, non-oxides might perform better than traditional p-type TCMs (oxides) in terms of mobility. We report on a high-throughput (HT) computational search for non-oxide p-type TCMs from a large dataset of more than 30,000 compounds which identified CaTe and \ceLi3Sb as very good candidates for high-mobility p-type TCMs. From our calculations, both compounds are expected to be p-type dopable: intrinsically for \ceLi3Sb while CaTe would require extrinsic doping. Using electron-phonon computations, we estimate hole mobilities at room-temperature to be about 20 and 70 cm2/Vs for CaTe and \ceLi3Sb, respectively. The computed hole mobility for \ceLi3Sb is quite exceptional and comparable with the electron mobility in the best n-type TCMs.
I Introduction
Transparent conducting materials (TCMs) are necessary in many applications ranging from solar cells to transparent electronics. So far, n-type oxides (e.g., \ceIn2O3, \ceSnO2 and \ceZnO) are the highest performing TCMs, allowing them to be used in commercial devices Ohta and Hosono (2004); Facchetti and Marks (2010); Ellmer (2012); Barquinha et al. (2012); Fortunato et al. (2012). On the other hand, p-type TCMs show poorer performances, especially in terms of carrier mobility. This hinders the development of new technologies such as transparent solar cells or transistors Ellmer (2012); Dixon et al. (2016). Taking advantage of the predictive power of density functional theory (DFT) calculations, we have set up a high-throughput (HT) computational framework to identify novel p-type TCMs focusing first on oxide compounds Hautier et al. (2013); Varley et al. (2014); Bhatia et al. (2016).
The analysis of the calculated HT data confirmed that on average p-type oxides have inherently higher effective masses than n-type oxides Hautier et al. (2013). This could be traced back to the strong oxygen p-orbital character in the valence band of most oxides and has rationalized the current gap in mobility between the best p-type and n-type oxides. This inherent difficulty in developing high-hole-mobility oxides justifies moving towards non-oxide TCM chemistries including fluorides Yanagi et al. (2003), sulfides Park et al. (2002); Woods-Robinson et al. (2016), oxianions Ueda et al. (2000), or germanides Yan et al. (2015). Recently, we started extending our HT computing approach to search for non-oxide TCMs. Phosphides were identified to be among the lowest hole effective mass materials and more specifically boron phosphide (BP) was detected as a very promising p-type TCM candidate Varley et al. (2017). We note that subsequent computational studies focusing on selected binaries and ternaries reported also on the computational screening of non-oxide TCMs Raghupathy et al. (2018a, b). In the present work, we extend our HT computing approach to a larger space of chemistries and investigate some selected candidates. We screen all non-oxide compounds in a large computational data set (34,000 semiconductors) Ricci et al. (2017). Combining DFT-based HT computations with higher accuracy methods such as , hybrid functionals and electron-phonon coupling computations (to assess the relaxation time and thus the mobility), we identify that CaTe and \ceLi3Sb would be of great interest as high mobility p-type TCMs.
II Methods
All the considered materials originate from the Inorganic Crystal Structure Database (ICSD) ICS (2013). Their relaxed crystal structures and electronic band structures were obtained from the Materials Project database Jain et al. (2013); Mat (2013). These rely on DFT high-throughput computations which were performed with VASP Kresse and Furthmüller (1996a, b) using the Perdew-Burke-Ernzerhof (PBE) exchange-correlation (XC) functional Perdew et al. (1996) within the projector augmented wave (PAW) framework Blöchl (1994).
One of the first selection criteria for TCMs is their stability. Here, it is assessed by the energy above hull in the Materials Project database Jain et al. (2013). For a compound stable at 0K, meV/atom, and the stability decreases as increases.
In the beginning of the screening procedure, the PBE band gap can be used as a filter. However, since PBE is known to systematically underestimate the band gap compared to experiments, more accurate calculations are needed in the subsequent steps (though with a limited number of materials). So, the fundamental and direct band gaps were also calculated with VASP for about a hundred materials using the Heyd-Scuseria-Ernzerhof (HSE) hybrid XC functional Heyd et al. (2003); Brothers et al. (2008) and adopting the same computational parameters as for the PBE calculations. For the final candidates (\ceCaTe and \ceLi3Sb), calculations were performed with ABINIT Gonze et al. (2002); Gonze (2005); Gonze et al. (2009, 2016). In these calculations, optimized norm-conserving (NC) pseudopotentials including semi-core electrons were used which were generated with ONCVPSP Hamann (2013); van Setten et al. (2018). The kinetic cut-off energy for the wavefunctions were set to 51 and 52 Ha for \ceCaTe and \ceLi3Sb respectively, as recommended in the PseudoDojo table van Setten et al. (2018). The convergence of these calculations with respect to the kinetic energy cut-off for the dielectric function and the number of bands was tested using automatic workflows van Setten et al. (2017) based on the pymatgen Ong et al. (2013) and AbiPy packages Giantomassi et al. (2014); Gonze et al. (2016). For \ceCaTe, the convergence of the gap at the point (with a truncation error smaller than 0.01 eV) was obtained for Ha and . In the case of \ceLi3Sb, the convergence is significantly faster: using Ha and guarantee a truncation error smaller than 0.01 eV. More details about the convergence tests are available in the supplementary document. For the calculations of the screening and the quasi-particle self-energy, and k-point meshes were used for \ceCaTe and \ceLi3Sb, respectively. The band structures are then interpolated from these k-point meshes using AbiPy Giantomassi et al. (2014); Gonze et al. (2016).
The point defect computations were performed using the supercell technique Freysoldt et al. (2014) adopting supercells of the primitive cells. We calculated the defect formation energies first using the PBE XC functional but also with the more accurate HSE functional for \ceLi3Sb and \ceCaTe Heyd et al. (2003); Brothers et al. (2008). For the latter, the screening length and fraction of exact exchange were set to the common values of 0.2 Å and 25 % respectively. The kinetic energy cut-off for the wavefunctions was set to 19.1 Ha (520 eV) and the relaxations are stopped when the change in total energy between two ionic relaxation-steps is smaller than Ha (0.01 eV). The formation energy of defect in charged state can be written as Komsa et al. (2012); Zhang and Northrup (1991)
| (1) |
where and are the total energies of the supercell with a defect in the charge state and without any defects, respectively; is the number of atoms of type removed () or added (); and, is the corresponding chemical potential. is the energy of the valence band maximum (VBM), and is the Fermi level referenced to . The correction terms and are introduced to take care of the spurious image-charge interactions and the potential alignment for charged defects, respectively. The defect states with the charge were corrected using the extended Freysoldt’s (Kumagai’s) scheme Freysoldt et al. (2011); Kumagai and Oba (2014). All defects computations were performed using the PyCDT package Broberg et al. (2018).
The effective masses were calculated with BoltzTrap (based on Boltzmann transport theory framework) Madsen and Singh (2006) using the pymatgen Ong et al. (2013) interface and the Fireworks workflow package Jain et al. (2015). All the raw effective mass data is freely available in a separate paper which covers around 48,000 inorganic materials Ricci et al. (2017). The mobility depends on the effective mass through where the relaxation time (inverse of the scattering rate) depends on different scattering mechanisms. Carriers can be scattered by phonons, ionized and neutral impurities, grain boundaries,… In this work, we only took into account the scattering of electrons by phonons which is likely to be an important component of scattering and is an intrinsic mechanism, difficult to control through purity and microstructure. The carriers scattering by phonons can be computed theoretically if the electron-phonon matrix elements are known. In principle, one can employ Density Functional Perturbation Theory (DFPT) to obtain all the electron-phonon matrix elements from first principles. However, converging the relevant physical properties (such as the scattering rate of electrons by phonons) often requires very dense k-point and q-point meshes for electrons and phonons respectively leading to a considerable increase of computational time. The recently developed interpolation techniques based on Wannier functions offer a very practical and efficient solution to overcome this obstacle. In this work, we used the EPW code Noffsinger et al. (2010); Poncé et al. (2016) interfaced with Quantum ESPRESSO Giannozzi et al. (2009, 2017) to calculate the relaxation-time ( and k are band index and wave vector of a Bloch’s state, respectively). More details on the theory and the implementation can be found in Ref. Poncé et al., 2016. The were interpolated on a dense mesh for both k-points (for electrons) and q-points (for phonons) starting from the DFPT values on a mesh. The latter (together with the structural relaxation, self-consistent, non self-consistent calculations which are needed to run EPW) were obtained using Quantum ESPRESSO with NC pseudopotentials and very stringent parameters for convergence, e.g. high cut-off energy of 40 Ha. These are then used as an input to compute the carrier mobility by solving the Boltzmann transport equation by means of the BoltzTrap package Madsen and Singh (2006). In the latter calculations, the DFT band-energies (computed on a finite number of k-points) are interpolated using star functions (see section 2 of Ref. Madsen and Singh, 2006). Here, we have implemented another interpolation for the relaxation time in BoltzTrap in order to obtain the same very dense k-point grid as the one used for band-energies. The physical principle for this implementation is that the symmetries of the quasi-particle energies are the same as those of band-energies Giantomassi (2009) ( due to the interaction with phonons can be calculated from the imaginary part of the electron-phonon self-energy).
III Results
Starting from the Materials Project database, our first step was to extract materials with a low hole effective mass (, where is the free electron mass) and a large enough fundamental gap ( eV) and direct gap ( eV), based on PBE calculations. Regarding the effective masses, in the most general form, they are represented by a tensor. As most TCMs are used as polycrystalline films, materials with isotropic or close to isotropic transport are easier to use in practical applications. Therefore, for the screening, we focus on the three principal values of this tensor and sort the materials based on the highest of the three principal hole effective masses. There were about 390 compounds passing through this first filter.
We then screened out very unstable materials selecting only those with an energy above hull lower than 24 meV/atoms. This threshold corresponds to the typical standard deviation of computational errors (compared with experiment) of DFT formation-energies Hautier et al. (2012). For the 107 materials passing these criteria, more accurate fundamental and direct gaps were calculated using the HSE hybrid functional. All the results of this step are presented in Table SI of the Supplemental Material sup . For sake of clarity, Table LABEL:tableI shows a selection of 63 materials with a direct band gap eV. The materials are sorted in decreasing order as a function of the computed direct band gap.
| Formula | Space group | MP-id | T/RE | p-dopability | ||||||
|---|---|---|---|---|---|---|---|---|---|---|
| \ceBeS | 422 | 6.89 | 4.05 | 0.0 | 0.65 | 0.65 | 0.65 | - | ||
| \ceKMgH3 | 23737 | 5.76 | 3.58 | 0.0 | 0.75 | 0.75 | 0.75 | ✓ | - | |
| \ceSiC | 8062 | 5.75 | 2.25 | 0.7 | 0.58 | 0.58 | 0.58 | ✓ | ✓ Furukawa et al. (1986); Kondo et al. (1986); Shibahara et al. (1987); Weingärtner et al. (2002) | |
| \ceCsPbCl3 | 675524 | 5.69 | 5.69 | 0.0 | 0.30 | 0.32 | 0.33 | - | ||
| \ceBeSe | 1541 | 5.27 | 3.36 | 0.0 | 0.55 | 0.55 | 0.55 | - | ||
| \ceBeCN2 | 15703 | 5.21 | 5.21 | 0.0 | 0.75 | 0.75 | 0.78 | - | ||
| \ceRbPbF3 | 674508 | 5.20 | 4.84 | 0.0 | 0.71 | 0.83 | 0.95 | - | ||
| \ceMgS | 1315 | 4.95 | 3.84 | 0.0 | 0.98 | 0.98 | 0.98 | ✓ | - | |
| \ceRbHgF3 | 7482 | 4.90 | 2.11 | 0.0 | 0.93 | 0.93 | 0.93 | - | ||
| \ceAgCl | 22922 | 4.81 | 2.28 | 0.0 | 0.83 | 0.83 | 0.83 | ✓ | - | |
| \ceCsHgF3 | 561947 | 4.59 | 2.20 | 0.0 | 0.89 | 0.89 | 0.89 | - | ||
| \ceBe2C | 1569 | 4.56 | 1.63 | 0.0 | 0.37 | 0.37 | 0.37 | - | ||
| \ceSrMgH4 | 643009 | 4.52 | 3.78 | 0.0 | 0.84 | 0.90 | 0.95 | ✓ | - | |
| \ceLi2Se | 2286 | 4.36 | 3.70 | 0.0 | 0.95 | 0.95 | 0.95 | ✓ | - | |
| \ceBP | 1479 | 4.35 | 2.26 | 0.0 | 0.34 | 0.34 | 0.34 | ✓ | ✓Varley et al. (2017) | |
| \ceCaS | 1672 | 4.28 | 3.34 | 0.0 | 0.88 | 0.88 | 0.88 | ✓ | - | |
| \ceLiCa4B3N6 | 6799 | 4.25 | 3.38 | 0.0 | 0.86 | 0.86 | 0.86 | ✓ | - | |
| \ceBaSrI4 | 754852 | 4.22 | 4.22 | 21.8 | 0.73 | 0.73 | 0.80 | ✓ | - | |
| \ceLiSr4B3N6 | 9723 | 4.18 | 3.22 | 0.0 | 0.89 | 0.89 | 0.89 | ✓ | - | |
| \ceNaSr4B3N6 | 10811 | 4.08 | 3.14 | 0.0 | 0.92 | 0.92 | 0.92 | ✓ | - | |
| \ceK2LiAlH6 | 24411 | 4.04 | 3.70 | 9.1 | 0.65 | 0.65 | 0.65 | ✓ | - | |
| \ceBeTe | 252 | 4.04 | 2.45 | 0.0 | 0.42 | 0.42 | 0.42 | - | ||
| \ceBa3SrI8 | 756235 | 4.02 | 4.02 | 7.5 | 0.70 | 0.81 | 0.81 | ✓ | - | |
| \ceCaSe | 1415 | 4.01 | 2.95 | 0.0 | 0.77 | 0.77 | 0.77 | ✓ | - | |
| \ceLiH | 23703 | 3.97 | 3.97 | 0.0 | 0.46 | 0.46 | 0.46 | ✓ | ||
| \ceAlP | 1550 | 3.90 | 2.50 | 0.0 | 0.56 | 0.56 | 0.56 | ✓ | ||
| \ceYbS | 1820 | 3.76 | 2.96 | 0.0 | 0.76 | 0.76 | 0.76 | - | ||
| \ceNa2LiAlH6 | 644092 | 3.75 | 3.75 | 3.9 | 0.66 | 0.66 | 0.66 | ✓ | - | |
| \ceSrSe | 2758 | 3.68 | 3.03 | 0.0 | 0.83 | 0.83 | 0.83 | ✓ | - | |
| \ceBaLiH3 | 23818 | 3.62 | 3.26 | 0.0 | 0.36 | 0.36 | 0.36 | ✓ | ||
| \ceCsPbF3 | 5811 | 3.59 | 3.59 | 4.6 | 0.39 | 0.39 | 0.39 | - | ||
| \ceCs3ZnH5 | 643702 | 3.58 | 3.58 | 0.0 | 0.69 | 0.93 | 0.93 | ✓ | - | |
| \ceAl2CdS4 | 9993 | 3.56 | 3.55 | 20.0 | 0.78 | 0.78 | 0.78 | - | ||
| \ceK2LiAlH6 | 23774 | 3.52 | 3.52 | 0.0 | 0.68 | 0.84 | 0.84 | ✓ | - | |
| \ceBaMgH4 | 643718 | 3.51 | 3.26 | 4.8 | 0.48 | 0.55 | 0.70 | ✓ | - | |
| \ceCaTe | 1519 | 3.50 | 2.18 | 0.0 | 0.60 | 0.60 | 0.60 | ✓ | ✓ | |
| \ceCs3MgH5 | 23947 | 3.49 | 3.49 | 0.3 | 0.88 | 0.93 | 0.93 | ✓ | - | |
| \ceCs3MgH5 | 643895 | 3.49 | 3.49 | 0.0 | 0.83 | 0.94 | 0.94 | ✓ | - | |
| \ceYbSe | 286 | 3.48 | 2.43 | 0.0 | 0.67 | 0.67 | 0.67 | - | ||
| \ceZnS | 10695 | 3.46 | 3.46 | 0.0 | 0.81 | 0.81 | 0.81 | ✓ | ✓Woods-Robinson et al. (2016) | |
| \ceTaCu3S4 | 10748 | 3.46 | 2.95 | 0.0 | 0.98 | 0.98 | 0.98 | ✓ | - | |
| \ceAl2ZnS4 | 4842 | 3.46 | 3.43 | 0.0 | 0.66 | 0.66 | 0.66 | ✓ | ||
| \ceLi2ThN2 | 27487 | 3.46 | 3.33 | 0.0 | 0.85 | 0.95 | 0.95 | - | ||
| \ceMg2B24C | 568556 | 3.42 | 3.41 | 0.0 | 0.77 | 0.93 | 0.93 | ✓ | - | |
| \ceLi2GePbS4 | 19896 | 3.33 | 3.20 | 0.0 | 0.61 | 0.61 | 0.98 | - | ||
| \ceCs3H5Pd | 643006 | 3.32 | 3.09 | 0.0 | 0.79 | 0.83 | 0.83 | ✓ | - | |
| \ceSrTe | 1958 | 3.24 | 2.39 | 0.0 | 0.67 | 0.67 | 0.67 | ✓ | ||
| \ceMgTe | 13033 | 3.24 | 3.24 | 0.9 | 0.95 | 0.95 | 0.95 | ✓ | - | |
| \ceCsTaN2 | 34293 | 3.22 | 3.22 | 0.0 | 0.71 | 0.71 | 0.92 | ✓ | - | |
| \ceCs3MnH5 | 643706 | 3.21 | 3.18 | 0.0 | 0.82 | 0.96 | 0.96 | ✓ | - | |
| \ceLiMgP | 36111 | 3.18 | 2.00 | 0.0 | 0.65 | 0.65 | 0.65 | ✓ | - | |
| \ceBaS | 1500 | 3.17 | 3.02 | 0.0 | 0.85 | 0.85 | 0.85 | ✓ | - | |
| \ceLiAlTe2 | 4586 | 3.11 | 3.11 | 0.0 | 0.52 | 0.83 | 0.83 | ✓ | - | |
| \ceYbTe | 1779 | 3.09 | 1.76 | 0.0 | 0.54 | 0.54 | 0.54 | - | ||
| \ceLi3Sb | 2074 | 3.06 | 1.15 | 0.0 | 0.24 | 0.24 | 0.24 | ✓ | ✓ | |
| \ceSrAl2Te4 | 37091 | 3.06 | 2.66 | 0.0 | 0.42 | 0.79 | 0.80 | ✓ | - | |
| \ceTaCu3Te4 | 9295 | 3.05 | 2.50 | 0.0 | 0.63 | 0.63 | 0.63 | ✓ | - | |
| \ceTaCu3Se4 | 4081 | 2.98 | 2.43 | 0.0 | 0.82 | 0.82 | 0.82 | ✓ | - | |
| \ceBaSe | 1253 | 2.95 | 2.59 | 0.0 | 0.76 | 0.76 | 0.76 | ✓ | - | |
| \ceKAg2PS4 | 12532 | 2.87 | 2.53 | 0.0 | 0.67 | 0.82 | 0.82 | ✓ | - | |
| \ceAlAs | 2172 | 2.84 | 2.12 | 0.0 | 0.50 | 0.50 | 0.50 | - | ||
| \ceLiErS2 | 35591 | 2.80 | 2.80 | 10.4 | 0.62 | 0.99 | 0.99 | ✓ | - | |
| \ceGaN | 830 | 2.80 | 2.80 | 5.2 | 0.94 | 0.94 | 0.94 | ✓ | - |
Among the materials at the top of the list, \ceSiC is a well-known wide band gap semiconductor. This material exhibits polymorphism (e.g. cubic: 3C, Rhombohedral: 15R, hexagonal: 6H, 4H, 2H) Choyke and Pensl (1997) and can be doped both n- and p-type Furukawa et al. (1986); Kondo et al. (1986); Shibahara et al. (1987); Weingärtner et al. (2002). A high hole mobility of 40 cm2/Vs was obtained for the cubic phase Morkoç et al. (1994). The indirect optical absorption of cubic phase is very weak at room temperature with a coefficient of cm-1 at 3.1 eV Philipp (1958). We suggest that \ceSiC can be considered as a good p-type TCM. The main disadvantage of this compound is the difficulty of hole doping. Most known impurities such as Al, B, Ga and Sc create deep doping-levels leading to rather low concentrations of holes which were typically measured to be lower than cm-3 Morkoç et al. (1994) and is suitable for transistor applications.
Next comes a series of beryllium based compounds (\ceBeS, \ceBeSe, \ceBeCN2, \ceBe2C and \ceBeTe). While their computed performance in terms of band gap and hole effective masses are very attractive, the toxicity of beryllium lowers their interest for technological applications. Likewise, the many lead-based halide perovskites (\ceCsPbCl3, \ceRbPbF3, and \ceCsPbF3) and \ceLi2GePbS4 also present toxicity issues. It is interesting however to see these halide perovskites being of great interest as solar absorbers when they are made in chemistries showing smaller gaps Liu et al. (2013); Green et al. (2014). Toxicity is also an issue with the series of arsenides, e.g. AlAs. These arsenides are also very analogous to the phosphides such as BP and AlP that were identified in a previous work Varley et al. (2017). Some of the materials in the list contain rare-earth elements which might present some cost issues. We consider that further assessment of all these materials in terms of dopability and mobility is not a priority. Therefore, in the penultimate column of Table LABEL:tableI, the absence of toxic or rare-earth elements is verified, as indicated by a checkmark.
Continuing to explore the list of materials, many hydrides appear to be of interest with low hole effective mass and large direct band gaps for \ceLiH, \ceBaLiH3 and \ceCsH. Unfortunately, our subsequent defect computations indicate that these hydrides have low-lying hole-killing defects especially the hydrogen vacancy making unlikely their efficient p-type doping (see the Supplemental Material sup ). A few sulfides are also identified by our screening: ZnS and \ceZnAl2S4. ZnS has been indeed recently studied as a good performance p-type TCM Woods-Robinson et al. (2016). \ceZnAl2S4, on the other hand, is less studied but our defect computation indicates that it is very unlikely to be p-type dopable because Zn-Al anti-site defects form easily and act as hole-killers. \ceAl2CdS4 is likely to present the same issues. The defect formation energies computed by DFT for \ceZnAl2S4 are given in the Supplemental Material sup .
Among the different materials in the table, two promising candidates, \ceLi3Sb and \ceCaTe, also attracted our attention. The rest of the paper is dedicated to the further computations that were performed for these compounds.
The conventional cells of CaTe and \ceLi3Sb are shown in Fig. 1 (a) and (e). Ca atoms in CaTe are surrounded by six Te atoms forming an octahedral local environment. In \ceLi3Sb, the cation fills tetrahedral and octahedral sites. Both CaTe and \ceLi3Sb are cubic phases with high symmetry, which explains for their isotropy in hole effective masses (). CaTe and \ceLi3Sb exhibit very low hole effective masses with the eigenvalues being 0.60 and 0.25 (-mass of free electron), respectively. It is worth noting that the lowest hole effective masses found so far in a computational database for a p-type conducting oxides \ceK2Sn2O3 Hautier et al. (2013); Ha et al. (2017) is 0.27 . The promising non-oxide p-type TCM reported recently Varley et al. (2017), BP, shows an effective mass around 0.35 . Current Cu-based p-type TCOs show effective masses around 1.5 to 2 Hautier et al. (2013). The direct gaps of CaTe and \ceLi3Sb calculated using HSE hybrid functional are 3.5 and 3.06 eV respectively. Next to hybrid functional computations, we performed to confirm the value of these band gaps.
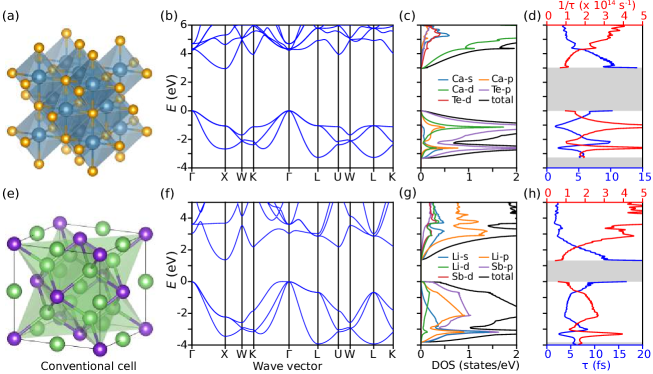
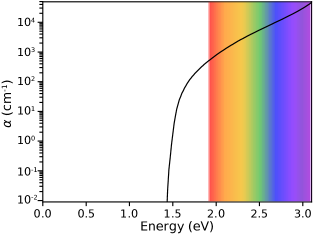
Fig. 1 (b) shows DFT band structure with a scissor shift to fit fundamental gap ( band structure of CaTe is shown in Fig. S6 of the Supplemental Material sup ). The fundamental gap () is 2.95 eV while the direct gap is located at -point and has a value of 4.14 eV. The direct gap is consistent with the optical gap of 4.1 eV measured experimentally Saum and Hensley (1959). We expect such a large band gap to lead to transparency in the visible region. \ceLi3Sb is also an indirect semiconductor. In the same way, the DFT electronic band structure with a scissor shift is presented in Fig. 1 (f) (see Fig. S7 of the Supplemental Material sup for band structure). The band gap and direct gap are 1.37 and 3.17 eV, respectively. The direct gap (located at the -point) of 3.17 eV. This is consistent with a experimental value of 3.1 eV measured recently Richardson (2003) but much lower than another experimental value of 3.9 eV reported earlier Gobrecht (1966). The indirect band gap is narrow and will lead to some absorption in the visible range. However, the indirect nature of the absorption makes it phonon-assisted and is expected to lead to weak absorption. To quantify this absorption, we computed the optical absorption including phonon-assisted processes using EPW Noffsinger et al. (2010); Poncé et al. (2016). Details about computational method can be found in Ref. Noffsinger et al., 2012. The result in Fig. 2 shows quite weak absorption in the visible range with the average intensity about cm-1, which means that a 100-nm film still allows more than 70 % of visible light energy to get through. This is suitable for applications and devices using thin-film form of \ceLi3Sb. The weak indirect optical absorption computed here is similar to that of established p-type TCOs such as SnO Quackenbush et al. (2013) or recently proposed p-type TCMs such as BP Varley et al. (2017).
CaTe and \ceLi3Sb show very low hole effective mass (0.60 and 0.24 within DFT). Indeed, both materials have threefold degeneracy at VBM ( point), therefore, the transport of holes occurs in three bands with some lighter and some heavier. Our definition of effective mass takes into account the competition among these three bands and give an average value that is representative of the transport which will happen in the different bands. More details about formulas and calculation techniques can be found in Ref. Hautier et al. (2014); Ricci et al. (2017). This should be kept in mind when comparing our results to other studies which sometimes only focus on one band when several competing bands are present Raghupathy et al. (2018a); Kuhar et al. (2018). Fig. 1 shows projected density of states (DOS) for (c) CaTe and (g) \ceLi3Sb. For both compounds, the top of valence band is mainly of anionic p-orbital characters (\ceSb^3- or \ceTe^2-) with some mixing from the cations. The effective masses are directly related to overlap and energy difference between orbitals Hautier et al. (2014). The lower value of hole effective masses obtained in these non-oxide compounds can be associated to both a better alignment between the anionic and cationic states than in oxides and larger anionic p-orbitals (5p and 4p versus 2p for oxides).
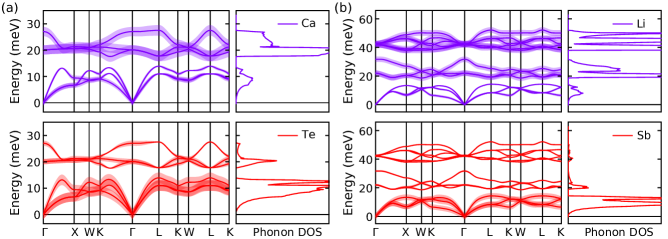
The effective mass is an important factor driving carrier mobility but not the only one. Scattering rate or relaxation time also affects the mobility. There are several mechanisms which can influence relaxation time as mentioned in II. Phonon scattering is the most intrinsic factor as it is not affected by purity and microstructure. The evaluation of relaxation time from phonon scattering can be performed ab initio using electron-phonon coupling matrices obtained from DFPT phonon computations. Fig. 3 shows phonon band structures (fat bands) and projected DOS of phonons for (a) CaTe and (b) \ceLi3Sb. The fat bands represent qualitatively characteristics of vibrational modes including what type of atoms participates in the phonon modes at a given energy, their direction and amplitude. The absence of modes with negative (purely imaginary) frequencies show that these materials are dynamically stable at 0 K. The lighter atoms (Ca and Li) mainly contribute to the optical modes at high frequencies (3 and 9 modes in CaTe and Li3Sb, respectively) while the heavier elements (Te and Sb) play an important role in the three acoustic modes at low frequencies.
Using the DFPT phonon computations and EPW, we can extract electron-phonon coupling matrices and the relaxation time on a dense k-point grid (see Eq. S1 of the Supplemental Material sup ). Fig. 1 (d) and (h) show the scattering rate and lifetime (inverse of scattering rate) as a function of energy at 300 K for CaTe and \ceLi3Sb respectively (see Eq. S2 of the Supplemental Material sup ). As commonly observed, the scattering rate is proportional to the DOS. A higher DOS offer more states available for the scattered electrons. At the doping hole concentration of cm-3, the Fermi levels are 90.5 and 120.8 meV above the VBMs for CaTe and \ceLi3Sb, respectively. For the highest doping of cm-3, the Fermi levels lie below VBMs of 264.5 and 168.5 meV for CaTe and \ceLi3Sb, respectively. The transport of holes, therefore, takes place around VBMs (-points). The DOS at -point of \ceLi3Sb is larger than that of CaTe but the scattering rate of \ceLi3Sb are fairly similar (see Fig. 1 (d) and (h)) indicating that a slightly weaker electron-phonon coupling is present in \ceLi3Sb.
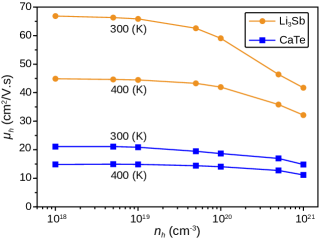
We computed scattering rates at temperatures of 300 and 400 K. Fig. 4 shows the hole mobilities as a function of hole concentrations at 300 and 400 K for both CaTe and \ceLi3Sb. The mobilities decreases with hole concentrations. As the Fermi levels shifts deeper below the VBMs, the DOS increases as well as the scattering rate (see Fig. 1 (d) and (h)). CaTe shows values of hole mobility around 20 cm2/Vs that is comparable with the mobility of \ceBa2BiTaO6, a recently reported p-type TCO Bhatia et al. (2016), and larger than mobilities of the traditional p-type TCOs such as \ceCuAlO2 Tate et al. (2009) and SnO Ogo et al. (2008). \ceLi3Sb exhibits an exceptional hole mobility up to about 70 cm2/Vs at room-temperature. This value nearly reaches the values of the electron mobilities of the best current n-TCOs such as \ceSnO2, ZnO, \ceIn2O3 and \ceGa2O3 which are around 100 cm2/Vs (see Table SII of the Supplemental Material sup ). It is worth noting that the mobility measured experimentally take into account other scattering processes. Our computed mobilities as they only take into account phonon scattering can be seen as an upper bound.
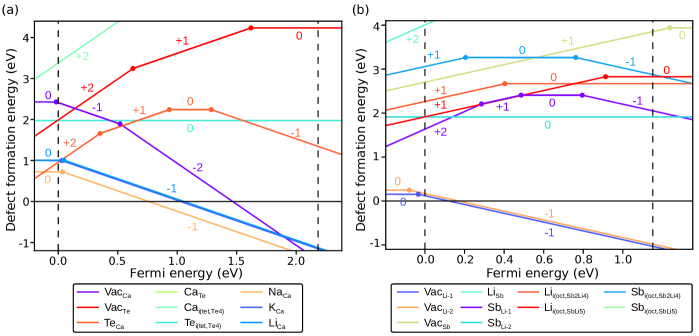
Our final assessment focuses on the dopability of CaTe and \ceLi3Sb. While we have assumed so far that the Fermi level of these two materials could be tuned to generate hole carriers, it remains to be seen if the defect chemistry is favorable to hole generation. To answer this question, we performed defect calculations using a HSE following the procedure described in section II. Fig. 5 (a) presents the defect formation energy for both intrinsic and extrinsic defects for each sort of defect in CaTe. The chemical potentials are chosen in conditions which lead to the most favorable p-type doping tendency for this material. The chemical potentials corresponding to different conditions in the phase diagrams are available in Fig. S8 of the Supplemental Material sup . Focusing first on intrinsic defects only including vacancies, anti-site defects and interstitial atoms, defect formation energies of these are plotted in Fig. 5 (a) with chemical potentials extracted in Te-rich condition of the phase diagram. Intrinsically, CaTe is unlikely to present p-type doping as no intrinsic defect acts as a low lying acceptor. The vacancy of Ca will be in competition with the hole killing vacancy of Te leading to a fermi level far from the valence band. However, the Te vacancy is not low enough in energy that it would prevent extrinsic p-type doping. When extrinsic defects with Na, K and Li substituting onto Ca-sites are considered, we find that all these substitutions offer shallow acceptor very competitive compared to the Te vacancy. The Ca by Na substitution is the lowest in energy. Extrinsic doping by Na might therefore lead to p-type doping in CaTe. The plots of formation energies of K, Na and Li in Fig. 5 (a) were achieved with chemical potentials extracted from \ceKTe-CaTe-K2Te3, \ceNaTe3-CaTe-Na2Te and \ceLi2Te-CaTe-Te facets of the three-element phase diagrams (see Fig. S8 of the Supplemental Material sup ). For \ceLi3Sb, Fig. 5 (b) shows an intrinsic tendency for hole doping with the lithium vacancy (Vac) acting as a shallow acceptor with a very low formation energy and no competing hole-killer. This plot is produced with chemical potentials computed in \ceLi3Sb-Li2Sb facet of the phase diagram (see Fig. S9 of the Supplemental Material sup ).
IV Discussions
The discovery of the quite unanticipated \ceLi3Sb with a potential for very high hole mobility demonstrates the interest of our HT screening strategy. \ceLi3Sb is an unexpected compound for TCM applications and would have been difficult to intuitively identify. Among other \ceA3B compounds (A = Li, Na, K and Rb; and B = N, P, As and Sb), \ceLi3Sb is exceptional because of its very low hole effective masses (see Table SIII in the Supplemental Material sup ). We suggest that the energy difference between A- ( for Li, Na, K and Rb, respectively) and B- ( for N, P, As and Sb, respectively) orbitals of valence electrons (A and B) might play important role here. In fact, the energy difference between Li- and Sb- is about 1.954 (eV) van Setten et al. (2018) and is the smallest value among many other ones of A-/B- pairs. This leads to a small orbital-energy difference and strong (anti-)bonding, which results in low hole effective mass. While we only focus on CaTe and \ceLi3Sb as they are likely the most potential candidates, there are other interesting materials with hole effective masses from 0.6 to 1.0 and high direct gaps (see Table LABEL:tableI) such as CaS, SrSe, SrTe, \ceLiCa4B3N6, \ceLiSr4B3N6, \ceNaSr4B3N6… Defects calculations for these materials have not performed in this work and we, therefore, cannot adjudge their p-type doping-tendency.
By going beyond oxides, we identified compounds with very high hole mobility. However, several other issues also arise and need to be considered. The processing of antimonides or tellurides might be more difficult than oxides. They are, however, very common chemistries in other applications such as thermoelectrics with several exemplary compounds such as PbTe, \ceBi2Te3 Maciá-Barber (2015), or more recently \ceMg3Sb2 Kajikawa et al. (2003); Condron et al. (2006); Zhang et al. (2017). The band gaps in non-oxide compounds are narrower, which lowers in average their transparency in the visible light. As we already discussed Varley et al. (2017), this can be overcome by exploiting the indirect gaps and weak phonon-assisted optical transitions. Lower band gaps are useful for p-dopability though as lower band gap materials tend to be easier to dope Zunger (2003).
We note that the defect chemistry of non-oxide can be different than in traditional TCOs. For oxides, the cation-anion anti-site defects (replacement of anions on cations’ sites and vice versa) are unlikely to be favorable energetically because of the large electronegativity difference between cations and anions. In non-oxide compounds, CaTe, the cation-anion anti-sites are more likely to be present leading to potentially different hole-killing defects. While the anion (oxygen) vacancy vacancy is the most common hole-killer in oxides, we see our non-oxide materials presenting anti-sites cation-anion defects lower in energy than the anion vacancy such as in CaTe. We also identify that the hydride chemistry while offering attractive electronic structures presents dopability issues (i.e., a low lying hydrogen vacancy acting as hole killer) preventing them for further consideration in p-type TCMs.
V Conclusions
Using a large database and appropriate filtering strategies, we report on a high-throughput search for non-oxide p-type TCMs. We identified two materials to be of interest: CaTe and \ceLi3Sb. We performed extensive follow-up computational investigation of these candidates, evaluating their band structure using beyond DFT techniques, their transport and phonon-assisted optical properties using electron-phonon computations as well as their defect chemistry. Both CaTe and Li3Sb present very attractive properties for p-type TCM applications. The \ceLi3Sb shows a very high hole mobility of around 70 cm2/Vs, which is close to electron mobility in the best n-type TCMs. Our work motivates further experimental investigation of these two materials for TCM applications.
VI Acknowledgments
V.-A.H. was funded through a grant from the FRIA. G.-M.R. is grateful to the F.R.S.-FNRS for financial support. G.H., G.-M.R., G.Y. and F.R. acknowledge the F.R.S.-FNRS project HTBaSE (contract N∘ PDR-T.1071.15) for financial support. We acknowledge access to various computational resources: the Tier-1 supercomputer of the Fédération Wallonie-Bruxelles funded by the Walloon Region (grant agreement N∘ 1117545), and all the facilities provided by the Université catholique de Louvain (CISM/UCLouvain) and by the Consortium des Équipements de Calcul Intensif en Fédération Wallonie Bruxelles (CÉCI). The authors thank Dr. Samuel Poncé and Professor Emmanouil Kioupakis for helpful discussions on the technical aspects of the electron-phonon computations.
References
- Ohta and Hosono (2004) H. Ohta and H. Hosono, Mater. Today 7, 42 (2004).
- Facchetti and Marks (2010) A. Facchetti and T. J. Marks, eds., “Transparent electronics: From synthesis to applications,” (Wiley, 2010).
- Ellmer (2012) K. Ellmer, Nat. Photonics 6, 809 (2012).
- Barquinha et al. (2012) P. Barquinha, R. Martins, L. Pereira, and E. Fortunato, “Transparent oxide electronics: From materials to devices,” (Wiley, 2012).
- Fortunato et al. (2012) E. Fortunato, P. Barquinha, and R. Martins, Adv. Mater. 24, 2945 (2012).
- Dixon et al. (2016) S. C. Dixon, D. O. Scanlon, C. J. Carmalt, and I. P. Parkin, J. Mater. Chem. C 4, 6946 (2016).
- Hautier et al. (2013) G. Hautier, A. Miglio, G. Ceder, G.-M. Rignanese, and X. Gonze, Nat. Commun. 4, 2292 (2013).
- Varley et al. (2014) J. B. Varley, V. Lordi, A. Miglio, and G. Hautier, Phys. Rev. B 90, 045205 (2014).
- Bhatia et al. (2016) A. Bhatia, G. Hautier, T. Nilgianskul, A. Miglio, J. Sun, H. J. Kim, K. H. Kim, S. Chen, G.-M. Rignanese, X. Gonze, and J. Suntivich, Chem. Mater. 28, 30 (2016).
- Yanagi et al. (2003) H. Yanagi, J. Tate, S. Park, C.-H. Park, and D. Keszler, Appl. Phys. Lett. 82, 2814 (2003).
- Park et al. (2002) S. Park, D. A. Keszler, M. M. Valencia, R. L. Hoffman, J. P. Bender, and J. F. Wager, Appl. Phys. Lett. 80, 4393 (2002).
- Woods-Robinson et al. (2016) R. Woods-Robinson, J. K. Cooper, X. Xu, L. T. Schelhas, V. L. Pool, A. Faghaninia, C. S. Lo, M. F. Toney, I. D. Sharp, and J. W. Ager, Adv. Electron. Mater. 2, 1500396 (2016).
- Ueda et al. (2000) K. Ueda, S. Inoue, S. Hirose, H. Kawazoe, and H. Hosono, Appl. Phys. Lett. 77, 2701 (2000).
- Yan et al. (2015) F. Yan, X. Zhang, Y. G. Yu, L. Yu, A. Nagaraja, T. O. Mason, and A. Zunger, Nat. Commun. 6, 7308 (2015).
- Varley et al. (2017) J. B. Varley, A. Miglio, V.-A. Ha, M. J. van Setten, G.-M. Rignanese, and G. Hautier, Chem. Mater. 29, 2568 (2017).
- Raghupathy et al. (2018a) R. K. M. Raghupathy, T. D. Kühne, C. Felser, and H. Mirhosseini, J. Mater. Chem. C 6, 541 (2018a).
- Raghupathy et al. (2018b) R. K. M. Raghupathy, H. Wiebeler, T. D. Kühne, C. Felser, and H. Mirhosseini, Chem. Mater. (2018b), 10.1021/acs.chemmater.8b02719.
- Ricci et al. (2017) F. Ricci, W. Chen, U. Aydemir, G. J. rey Snyder, G.-M. Rignanese, A. Jain, and G. Hautier, Sci. Data 4, 170085 (2017).
- ICS (2013) “Inorganic Crystal Structure Database,” https://www.fiz-karlsruhe.de/de/leistungen/kristallographie/icsd.html (2013), [FIZ Karlsruhe: Karlsruhe, Germany, 2013].
- Jain et al. (2013) A. Jain, S. P. Ong, G. Hautier, W. Chen, W. D. Richards, S. Dacek, S. Cholia, D. Gunter, D. Skinner, G. Ceder, and K. A. Persson, APL Materials 1, 011002 (2013).
- Mat (2013) “The Materials Project,” https://www.materialsproject.org/ (2013), [accessed September 1, 2013].
- Kresse and Furthmüller (1996a) G. Kresse and J. Furthmüller, Comput. Mater. Sci. 6, 15 (1996a).
- Kresse and Furthmüller (1996b) G. Kresse and J. Furthmüller, Phys. Rev. B 54, 11169 (1996b).
- Perdew et al. (1996) J. Perdew, K. Burke, and M. Ernzerhof, Phys. Rev. Lett. 77, 3865 (1996).
- Blöchl (1994) P. E. Blöchl, Phys. Rev. B 50, 17953 (1994).
- Heyd et al. (2003) J. Heyd, G. E. Scuseria, and M. Ernzerhof, J. Chem. Phys. 118, 8207 (2003).
- Brothers et al. (2008) E. N. Brothers, A. F. Izmaylov, J. O. Normand, V. Barone, and G. E. Scuseria, J. Chem. Phys. 129, 011102 (2008).
- Gonze et al. (2002) X. Gonze, J.-M. Beuken, R. Caracas, F. Detraux, M. Fuchs, G.-M. Rignanese, L. Sindic, M. Verstraete, G. Zerah, F. Jollet, M. Torrent, A. Roy, M. Mikami, P. Ghosez, J.-Y. Raty, and D. C. Allan, Comput. Mater. Sci. 25, 478 (2002).
- Gonze (2005) X. Gonze, Z. Kristallogr. 202, 558 (2005).
- Gonze et al. (2009) X. Gonze, B. Amadon, P.-M. Anglade, J.-M. Beuken, F. Bottin, P. Boulanger, F. Bruneval, D. Caliste, R. Caracas, M. Côté, T. Deutsch, L. Genovese, P. Ghosez, M. Giantomassi, S. Goedecker, D. R. Hamann, P. Hermet, F. Jollet, G. Jomard, S. Leroux, M. Mancini, S. Mazevet, M. J. T. Oliveira, G. Onida, Y. Pouillon, T. Rangel, G.-M. Rignanese, D. Sangalli, R. Shaltaf, M. Torrent, M. J. Verstraete, G. Zerah, and J. W. Zwanziger, Comput. Phys. Commun. 180, 2582 (2009).
- Gonze et al. (2016) X. Gonze, F. Jollet, F. A. Araujo, D. Adams, B. Amadon, T. Applencourt, C. Audouze, J.-M. Beuken, J. Bieder, A. Bokhanchuk, E. Bousquet, F. Bruneval, D. Caliste, M. Côté, F. Dahm, F. D. Pieve, M. Delaveau, M. D. Gennaro, B. Dorado, C. Espejo, G. Geneste, L. Genovese, A. Gerossier, M. Giantomassi, Y. Gillet, D. R. Hamann, L. He, G. Jomard, J. L. Janssen, S. L. Roux, A. Levitt, A. Lherbier, F. Liu, I. Lukačević, A. Martin, C. Martins, M. J. T. Oliveira, S. Poncé, Y. Pouillon, T. Rangel, G.-M. Rignanese, A. H. Romero, B. Rousseau, O. Rubel, A. A. Shukri, M. Stankovski, M. Torrent, M. J. V. Setten, B. V. Troeye, M. J. Verstraete, D. Waroquiers, J. Wiktor, B. Xu, A. Zhou, and J. W. Zwanziger, Comput. Phys. Commun. 205, 106 (2016).
- Hamann (2013) D. R. Hamann, Phys. Rev. B 88, 085117 (2013).
- van Setten et al. (2018) M. J. van Setten, M. Giantomassi, E. Bousquet, M. J. Verstraete, D. R. Hamann, X. Gonze, and G.-M. Rignanese, Comput. Phys. Commun. 226, 39 (2018).
- van Setten et al. (2017) M. J. van Setten, M. Giantomassi, X. Gonze, G.-M. Rignanese, and G. Hautier, Phys. Rev. B 96, 155207 (2017).
- Ong et al. (2013) S. P. Ong, W. D. Richards, A. Jain, G. Hautier, M. Kocher, S. Cholia, D. Gunter, V. L. Chevrier, K. A. Persson, and G. Ceder, Comput. Mater. Sci. 68, 314 (2013).
- Giantomassi et al. (2014) M. Giantomassi et al., “Open-source library for analyzing the results produced by ABINIT,” https://github.com/abinit/abipy (2014).
- Freysoldt et al. (2014) C. Freysoldt, B. Grabowski, T. Hickel, J. Neugebauer, G. Kresse, A. Janotti, and C. G. Van de Walle, Rev. Mod. Phys. 86, 253 (2014).
- Komsa et al. (2012) H.-P. Komsa, T. T. Rantala, and A. Pasquarello, Phys. Rev. B 86, 045112 (2012).
- Zhang and Northrup (1991) S. B. Zhang and J. E. Northrup, Phys. Rev. Lett. 67, 2339 (1991).
- Freysoldt et al. (2011) C. Freysoldt, J. Neugebauer, and C. G. Van de Walle, Phys. Status Solidi B 248, 1067 (2011).
- Kumagai and Oba (2014) Y. Kumagai and F. Oba, Phys. Rev. B 89, 195205 (2014).
- Broberg et al. (2018) D. Broberg, B. Medasani, N. E. Zimmermann, G. Yu, A. Canning, M. Haranczyk, M. Asta, and G. Hautier, Comput. Phys. Commun 226, 165 (2018).
- Madsen and Singh (2006) G. K. H. Madsen and D. J. Singh, Comput. Phys. Commun. 175, 67 (2006).
- Jain et al. (2015) A. Jain, S. P. Ong, W. Chen, B. Medasani, X. Qu, M. Kocher, M. Brafman, G. Petretto, G.-M. Rignanese, G. Hautier, D. Gunter, and K. A. Persson, Concurr. Comput. Pract. Exp. 27, 5037 (2015).
- Noffsinger et al. (2010) J. Noffsinger, F. Giustino, B. D. Malone, C.-H. Park, S. G. Louie, and M. L. Cohen, Comput. Phys. Commun. 181, 2140 (2010).
- Poncé et al. (2016) S. Poncé, E. R. Margine, C. Verdi, and F. Giustino, Comput. Phys. Commun. 209, 116 (2016).
- Giannozzi et al. (2009) P. Giannozzi, S. Baroni, N. Bonini, M. Calandra, R. Car, C. Cavazzoni, D. Ceresoli, G. L. Chiarotti, M. Cococcioni, I. Dabo, A. Dal Corso, S. de Gironcoli, S. Fabris, G. Fratesi, R. Gebauer, U. Gerstmann, C. Gougoussis, A. Kokalj, M. Lazzeri, L. Martin-Samos, N. Marzari, F. Mauri, R. Mazzarello, S. Paolini, A. Pasquarello, L. Paulatto, C. Sbraccia, S. Scandolo, G. Sclauzero, A. P. Seitsonen, A. Smogunov, P. Umari, and R. M. Wentzcovitch, J. Phys.: Condens. Matter 21, 395502 (2009).
- Giannozzi et al. (2017) P. Giannozzi, O. Andreussi, T. Brumme, O. Bunau, M. Buongiorno Nardelli, M. Calandra, R. Car, C. Cavazzoni, D. Ceresoli, M. Cococcioni, N. Colonna, I. Carnimeo, A. Dal Corso, S. de Gironcoli, P. Delugas, R. A. DiStasio, A. Ferretti, A. Floris, G. Fratesi, G. Fugallo, R. Gebauer, U. Gerstmann, F. Giustino, T. Gorni, J. Jia, M. Kawamura, H.-Y. Ko, A. Kokalj, E. Küçükbenli, M. Lazzeri, M. Marsili, N. Marzari, F. Mauri, N. L. Nguyen, H.-V. Nguyen, A. O. de-la Roza, L. Paulatto, S. Poncé, D. Rocca, R. Sabatini, B. Santra, M. Schlipf, A. P. Seitsonen, A. Smogunov, I. Timrov, T. Thonhauser, P. Umari, N. Vast, X. Wu, and S. Baroni, J. Phys.: Condens. Matter 29, 465901 (2017).
- Giantomassi (2009) M. Giantomassi, Core-electrons and self-consistency in the GW approximation from a PAW perspective, Ph.D. thesis, Université catholique de Louvain (2009), chapter 5 and appendix B.
- Hautier et al. (2012) G. Hautier, S. P. Ong, A. Jain, C. J. Moore, and G. Ceder, Phys. Rev. B 85 (2012), 10.1103/physrevb.85.155208.
- (51) See See Supplemental Material at [URL will be inserted by publisher] .
- Furukawa et al. (1986) K. Furukawa, A. Uemoto, M. Shigeta, A. Suzuki, and S. Nakajima, Appl. Phys. Lett. 48, 1536 (1986).
- Kondo et al. (1986) Y. Kondo, T. Takahashi, K. Ishii, Y. Hayashi, E. Sakuma, S. . Misawa, H. Daimon, M. Yamanaka, and S. . Yoshida, IEEE Electron Device Lett. 7, 404 (1986).
- Shibahara et al. (1987) K. Shibahara, N. Kuroda, S. Nishino, and H. Matsunami, Jpn. J. Appl. Phys. 26, 1815 (1987).
- Weingärtner et al. (2002) R. Weingärtner, P. J. Wellmann, M. Bickermann, D. Hofmann, T. L. Straubinger, and A. Winnacker, Appl. Phys. Lett. 80, 70 (2002).
- Choyke and Pensl (1997) W. J. Choyke and G. Pensl, MRS Bull. 22, 25 (1997).
- Morkoç et al. (1994) H. Morkoç, S. Strite, G. B. Gao, M. E. Lin, B. Sverdlov, and M. Burns, J. Appl. Phys. 76, 1363 (1994).
- Philipp (1958) H. R. Philipp, Phys. Rev. 111, 440 (1958).
- Liu et al. (2013) M. Liu, M. B. Johnston, and H. J. Snaith, Nature 501, 395 (2013).
- Green et al. (2014) M. A. Green, A. Ho-Baillie, and H. J. Snaith, Nat. Photonics 8, 506 (2014).
- Ha et al. (2017) V.-A. Ha, F. Ricci, G.-M. Rignanese, and G. Hautier, J. Mater. Chem. C 5, 5772 (2017).
- Saum and Hensley (1959) G. A. Saum and E. B. Hensley, Phys. Rev. 7, 1019 (1959).
- Richardson (2003) T. J. Richardson, Solid State Ionics 165, 305 (2003).
- Gobrecht (1966) R. Gobrecht, Phys. Status Solidi 13, 429 (1966).
- Noffsinger et al. (2012) J. Noffsinger, E. Kioupakis, C. G. Van de Walle, S. G. Louie, and M. L. Cohen, Phys. Rev. Lett. 108, 167402 (2012).
- Quackenbush et al. (2013) N. F. Quackenbush, J. P. Allen, D. O. Scanlon, S. Sallis, J. A. Hewlett, A. S. Nandur, B. Chen, K. E. Smith, C. Weiland, D. A. Fischer, J. C. Woicik, B. E. White, G. W. Watson, and L. F. J. Piper, Chem. Mater. 25, 3114 (2013).
- Hautier et al. (2014) G. Hautier, A. Miglio, D. Waroquiers, G.-M. Rignanese, and X. Gonze, Chem. Mater. 26, 5447 (2014).
- Kuhar et al. (2018) K. Kuhar, M. Pandey, K. S. Thygesen, and K. W. Jacobsen, ACS Energy Lett. 3, 436 (2018).
- Tate et al. (2009) J. Tate, H. L. Ju, J. C. Moon, A. Zakutayev, A. P. Richard, J. Russell, and D. H. McIntyre, Phys. Rev. B 80, 165206 (2009).
- Ogo et al. (2008) Y. Ogo, H. Hiramatsu, K. Nomura, H. Yanagi, T. Kamiya, M. Hirano, and H. Hosono, Appl. Phys. Lett. 93, 032113 (2008).
- Maciá-Barber (2015) E. Maciá-Barber, “Thermoelectric materials: Advances and applications,” (Pan Stanford, 2015).
- Kajikawa et al. (2003) T. Kajikawa, N. Kimura, and T. Yokoyama, in Proceedings ICT’03. 22nd International Conference on Thermoelectrics (IEEE Cat. No.03TH8726) (2003).
- Condron et al. (2006) C. L. Condron, S. M. Kauzlarich, F. Gascoin, and G. J. Snyder, J. Solid State Chem. 179, 2252 (2006).
- Zhang et al. (2017) J. Zhang, L. Song, A. Mamakhel, M. R. V. Jørgensen, and B. B. Iversen, Chem. Mater. 29, 5371 (2017).
- Zunger (2003) A. Zunger, Appl. Phys. Lett. 83, 57 (2003).