Discovery of Scuti Pulsations in the Young Hybrid Debris Disk Star HD 156623
Abstract
The bRing robotic observatory network was built to search for circumplanetary material within the transiting Hill sphere of the exoplanet Pic b across its bright host star Pic. During the bRing survey of Pic, it simultaneously monitored the brightnesses of thousands of bright stars in the southern sky ( 4-8, -30∘). In this work, we announce the discovery of Scuti pulsations in the A-type star HD 156623 using bRing data. HD 156623 is notable as it is a well-studied young star with a dusty and gas-rich debris disk, previously detected using ALMA. We present the observational results on the pulsation periods and amplitudes for HD 156623, discuss its evolutionary status, and provide further constraints on its nature and age. We find strong evidence of frequency regularity and grouping. We do not find evidence of frequency, amplitude, or phase modulation for any of the frequencies over the course of the observations. We show that HD 156623 is consistent with other hot and high frequency pre-MS and early ZAMS Scutis as predicted by theoretical models and corresponding evolutionary tracks, although we observe that HD 156623 lies hotter than the theoretical blue edge of the classical instability strip. This, coupled with our characterization and Sco-Cen membership analyses, suggest that the star is most likely an outlying ZAMS member of the 16 Myr Upper Centaurus-Lupus subgroup of the Sco-Cen association.
1 Introduction
The number of ground-based, wide-field photometric surveys that have been designed to detect transiting exoplanets has grown considerably over the past two decades (e.g., Bakos et al., 2002; Pollacco, 2006; Pepper et al., 2007; Talens et al., 2017). In addition to exoplanets, these surveys are sensitive to photometric variability due to eclipsing binaries, rotation periods, pulsations, amongst others (e.g., Mamajek et al., 2012; Mellon et al., 2017; Oberst et al., 2017; Burggraaff et al., 2018). These discoveries have been possible due to the high-cadence, high-precision photometry of stars typically fainter than . Fainter stars have been targeted due to their greater abundance per frame in the sky, making these surveys highly efficient.
These observations require exposure times on the order of tens of seconds to minutes. Brighter stars have been typically excluded from these surveys due to saturation of the detectors in their exposures. The bRing (Beta Pic b Ring) survey (Stuik et al., 2017) is a ground-based, wide-field photometric survey designed to monitor bright stars ( 4–8), including the bright nearby exoplanet and debris disk host star Pic, and observes stars brighter than many of the ground-based exoplanet surveys. Due to its high cadence and photometric precision, bRing is able to detect sub-mmag signals for these bright stars and is sensitive to large exoplanets and faint stellar signals, including Scuti pulsations. This paper presents the first science result from the bRing survey.
Scuti variable stars have been known to exhibit surface radial and non-radial pressure and gravitational pulsation modes (e.g., Fitch, 1981; Balona & Evers, 1999; Breger, 2000; Guenther et al., 2009; Zwintz et al., 2014a). One goal of asteroseismologists has been to develop models to identify and characterize these pulsations; such models can be used to probe the structure of a star (e.g., Kurtz et al., 2014) and help characterize its age and evolutionary status (e.g., Guenther et al., 2009; Zwintz et al., 2014b). These pulsation frequencies are also known to exhibit regular spacing in frequency and appear in groups (e.g., Zwintz et al., 2011, 2014a; Kurtz et al., 2014). Scutis have the tendency to lie within the classical instability strip on the HR diagram (Breger & Pamyatnykh, 1998), with some known to lie outside the strip (Bowman & Kurtz, 2018).
HD 156623 (HIP 84881, 2MASS J17205061-4525149) is a bright ( = 7.25; Cousins & Stoy, 1962; Mermilliod, 1991) A1 V star (Paunzen et al., 2001). Since 1962, it has served as a Harvard E region photometric standard in several systems, starting with the system (Cousins & Stoy, 1962; Menzies et al., 1980; Cousins, 1983; Menzies et al., 1989) and later the (Cousins, 1976; Menzies et al., 1980; Cousins, 1980; Menzies et al., 1989), (Cousins, 1987; Kilkenny & Laing, 1992), and H systems (Cousins, 1990). Reported mean photometry on the system is provided in the compendia of Hauck & Mermilliod (1997) and Paunzen (2015), and on the system by Mermilliod (1991).
The star was included both as a photometric standard, and as being an A-type star in the vicinity of the Sco-Cen OB association by Slawson et al. (1992) (although no membership analysis was conducted). The star was first noted as having an infrared excess in the WISE survey by McDonald et al. (2012). Rizzuto et al. (2012) considered the star (listed as HIP 84881) as a low probability member of Sco-Cen. The star’s membership to Sco-Cen is not obvious as it lies well below the Galactic plane ( = -4.8∘) on the opposite side of the plane from the Upper Centaurus-Lupus subgroup of Sco-Cen (spanning 0∘ 25∘; de Zeeuw et al., 1999). Trigonometric parallaxes of = 8.45 0.60 mas (van Leeuwen, 2007, using Hipparcos astrometry) and = 8.9484 0.0769 mas (Gaia Collaboration et al., 2016; Brown et al., 2018) have been reported, consistent with a distance = 111.41 pc (Bailer-Jones et al., 2018). Lieman-Sifry et al. (2016) report ALMA observations of HD 156623, both 1240 m continuum and 12CO(2-1) emission. Although detection of gas among young debris disk stars was relatively low in Sco-Cen (16%) (Lieman-Sifry et al., 2016), ALMA surveys focusing specifically on young A-type stars are now showing that CO gas appears to be very common (Moór et al., 2017; Kral et al., 2017).
The work presented in this paper reports bRing’s detection of Scuti pulsation frequencies in the A-type star HD 156623 and provides a characteristic analysis of the star and these frequencies. The paper is organized as follows: §2 describes the bRing observations; §3 details the data selection, reduction, frequency extraction, and stellar characterization; §4 discusses the refined properties of HD 156623, reassessing its membership to Sco-Cen and estimated age, and the reported Scuti pulsation frequencies and their analysis.
2 Observations
2.1 bRing Photometry
The Pictoris b Ring (bRing) survey was designed to monitor the 2017 – 2018 transit of the Hill sphere of the young giant exoplanet Pic b in front of the bright ( = 3.8) star Pic, and search for evidence of any circumplanetary matter (Wang et al., 2016; Stuik et al., 2017; Mellon et al., 2018). One telescope (constructed at Leiden University) was installed in Sutherland, South Africa – an observing facility of the South African Astronomical Observatory in Cape Town, South Africa – and the other (constructed at University of Rochester) at Siding Spring Observatory in Coonabarabran, NSW Australia. The South African bRing observatory has been observing continuously since 2017 January. The Australian bRing observatory started in 2017 November.
Each bRing station has two FLI Microline ML11002M cameras that were oriented to maximize the longitudinal coverage of Pic, which is nearly circumpolar at both sites (latitudes -32∘). One camera was pointed southeast (Az = 150∘) and the other southwest (Az = 210∘). The cameras came equipped with 40082672 pixel Grade 2 CCDs, which have a QE of 50% and 9 m pixels. The cameras were attached to Canon 24 mm f/1.4 wide-field lenses; this resulted in a 74∘53∘ FOV with 1′ pixels. The data were taken with alternating exposures of 6.38 and 2.54 seconds (Stuik et al., 2017).
The bRing calibration pipeline builds on the heritage of the MASCARA data pipeline (Stuik et al., 2014; Talens et al., 2017, 2018). The bRing pipeline (discussed in Stuik et al., 2017; Talens et al., 2018) utilizes relative aperture photometry calibrated to the ASCC catalog (Kharchenko, 2001), which itself is tied to the photometry of the Hipparcos and Tycho instruments (Perryman & ESA, 1997). The pipeline performs a preliminary data reduction correcting CCD quantum efficiency, total throughput of the lenses and sky, intra-pixel variations, and sky- and cloud-based temporal variations. An astrometric solution is calculated every 50 exposures. For each camera, the resulting data are binned to a 5 minute cadence and updated for download on a bi-weekly basis.
In addition to Pic, the survey also monitored the brightnesses of 20,000 of the brightest stars in the southern sky ( 4–8), granting it a unique role amongst ground-based, wide-field photometric surveys (similar to its sibling MASCARA; Snellen et al., 2012, 2013; Stuik et al., 2014; Talens et al., 2017, 2018). The combined sky coverage of both sites has provided nearly continuous coverage of stars (an ideal 24 hour day provides 20-21 hours of continuous coverage). This nearly continuous temporal coverage combined with a cadence of 5 minutes has made bRing sensitive to serendipitous aperiodic and high-frequency, low amplitude periodic events. The observations of HD 156623 in this work cover 2017 June – 2018 May.
2.2 FEROS Spectrum
A FEROS spectrum of HD 156623 taken from the European Southern Observatory (ESO) archive was used in this analysis. The FEROS instrument is a high-resolution (R=48000) Échelle spectrograph located at the ESO in La Silla, Chile (Kaufer et al., 1999). Science products processed through the FEROS Data Reduction System are available for query and download on the ESO data archive111http://archive.eso.org/wdb/wdb/adp/phase3_spectral/form?collection_name=FEROS.
Although HD 156623 has been observed by FEROS several times at various exposure times, we analyzed a single spectrum with the highest SNR (ADP.2016-09-28T11:26:17.118; Rebollido et al., 2018). This observation has the longest exposure time (1800.04 seconds) and the highest SNR (399.0). For the purposes of this work, this single spectrum was sufficient for providing estimates on the radial velocity and sin.
3 Analysis
3.1 Data Sample, Reduction, and Noise Discussion
A subset of the bRing light curves were originally chosen to search for new variable stars. Stars were chosen if they had no previously reported variability (simply assessed via lacking an entry in the AAVSO VSX catalog; Watson et al., 2006)222The VSX catalog is regularly updated at http://cdsarc.u-strasbg.fr/viz-bin/Cat?B/vsx. and no bright ( 10) neighboring stars within a 10′ radius (corresponding to 4 bRing inner apertures). These measurements were also used to help identify major systematics still present in the calibrated data.
Beyond the calibration, this study detrended additional strong systematics identified in the data. Due to the high cadence and stationary nature of bRing, strong systematic signals with frequencies at 1 sidereal day and 1 synodic day were generated from each star traveling across the CCD, as well as a systematic signal due to the Moon (Stuik et al., 2017; Burggraaff et al., 2018; Talens et al., 2018). These three sets of periodicities were simultaneously fit and detrended using an iterative median-binning routine. A second-order CCD QE response systematic was also fitted and subtracted for each camera. A heliocentric correction to the time series was also applied. Finally, the data from the individual cameras were median aligned to each other in order to remove scaling offsets due to the 1% differences in the calibrations. Composite light curves containing data from all 4 cameras were then generated. The detrended rms in each camera was also calculated for comparison to the predicted theoretical noise in each star.
At the time of this publication, the principal theoretical sources of Poisson noise have been quantified to first order, i.e., shot, background, dark current, and read noise. The uniqueness of the bRing survey and the detrended rms measurements of each star imply additional higher-order considerations must be included such as non-uniform transmission. We are presently working to incorporate these sources to better understand the residual noise and improve our post-calibration detrending routine. The goals of these analyses are to provide a post-calibration detrending routine that minimizes the residual noise in each star and to determine an overall scintillation noise-floor for each camera.
3.2 Lomb-Scargle Analysis and Frequency Extraction
The Lomb-Scargle (LS) periodogram (Press et al., 1992; Scargle, 1982) is useful for detecting periodic signals in unevenly sampled data (e.g., Hartman et al., 2008, 2010; Messina et al., 2010; Cargile et al., 2014; Mellon et al., 2017). The LS periodogram function available in the Python Scipy333https://scipy.org/ package was used to verify the removal of the major systematics and to search for stars in this sample that show signs of previously undetected variability. For the periodograms in this work, the Nyquist frequency (Press et al., 1992) of 135 was used as an upper limit on the frequency with frequency spacings of 510-4 . The Scipy normalized periodograms were generated for the composite light curve and four camera light curves.
The major systematics (sidereal, synodic, lunar) were clearly filtered out by our process with their peaks being cut by a factor of 100. There were a few remaining low frequency ( 5 ) peaks that were only a few tenths of mmags above the residual noise level. These could be residual beats, interference frequencies, or unidentified systematics in bRing. Other than one possible systematic at 24 shared by some of the stars in this sample, there were no other systematic peaks in the periodograms of these stars. To check for new variables, these stars were studied in order of largest peak in the composite light curve periodogram until stars whose peaks were consistent with the noise level were found. This final sample of stars with peaks above the noise in their periodograms were phase-folded on their strongest periods and analyzed further to see if new variability or systematics were detected, i.e., the detected variability was either exclusive to a star or shared with other stars.
This analysis yielded evidence of Scuti pulsations for HD 156623, previously unrecognized as a variable likely due to its high frequency ( 56 ), low amplitude ( 10 mmag) pulsations. All 4 bRing cameras had reported a total of 12500 data points between 2017 June 1 and the download date of 2018 May 28. The tool used to extract the frequencies was the literature standard Period04 software (Lenz & Breger, 2005). The Period04 analysis was performed on the composite light curve and the 4 individual camera light curves of HD 156623. The prewhitening residual noise in the Fourier spectrum from Period04 for the composite light curve was 0.2 mmag. Periods were searched for down to SNR = 4 (Kuschnig et al., 1997), which corresponded well with visual inspection of the Fourier spectrum revealing no more significant periods. The detected frequencies were entered into a spreadsheet for selection, analysis, and discussion (§4.2).
| Parameter | Value | Units | Reference |
|---|---|---|---|
| 260.21081592aaepoch J2015.5, ICRS (0.05 mas) | deg | 1 | |
| -45.42100519aaepoch J2015.5, ICRS (0.06 mas) | deg | 1 | |
| 8.9484 0.0769 | mas | 1 | |
| 111.41 | pc | 2 | |
| -14.3 0.1 | mas yr-1 | 1 | |
| -40.1 0.1 | mas yr-1 | 1 | |
| SpT | A1 V | … | 3 |
| 7.254 0.007 | mag | 4 | |
| 0.087 0.003 | mag | 4 | |
| () | 0.040 0.003 | mag | 5 |
| 0.193 0.004 | mag | 5 | |
| 0.960 0.002 | mag | 5 | |
| 2.904 0.001 | mag | 5 | |
| E() | 0.008 0.018 | mag | 6 |
3.3 Stellar Characteristics
In preparation for the intended Scuti frequency analysis, we performed a stellar characterization analysis of HD 156623 to better constrain its properties. The adopted observables are summarized in Table 1, including Strömgren-Crawford () photometry.
The Strömgren-Crawford photometric system is comprised of intermediate-band filters on either side of the Balmer break and two narrow-band filters that measure the strength of the H line (Crawford, 1958). For early-type stars, the strength of the Balmer break, the continuum slopes in this region, and the strength of the H line are indicators of temperature and gravity. More specifically, for early A-type stars such as HD 156623, the temperature is sensitive to the index :
| (1) |
while the surface gravity is highly sensitive to the reddening-free index :
| (2) |
where and (Napiwotzki et al., 1993).
For dereddening the photometry and estimating the extinction due to interstellar dust, we adopt the reddening based on the regularly updated tri-dimensional reddening maps from the STILISM program (Capitanio et al., 2017; Lallement et al., 2018)444https://stilism.obspm.fr/: = 0.008 0.018. Examining the results of McCall (2004) for low reddening and dwarf stars in the color range -0.32 1.5, one finds that the trend /E() + 0.167 is a reasonable approximation (where 3.07 is quoted as the most probably value for diffuse Galactic interstellar medium). Hence, we adopt the ratio of total to selective extinction /E() for our A1V star to be 3.08, and estimate the extinction to be = 0.025 0.055. Using the E() value, we use the “observed” extinction ratios reported in Table 2 of Fitzpatrick (1999) to calculate the color excesses among the Strömgren-Crawford colors (see Table 2). The color excesses are all negligible, within 2 of zero.
| Parameter | Value (mag) | Reference |
|---|---|---|
| 0.025 0.055 | 1 | |
| E() | 0.0131 0.0092 | 2 |
| E() | -0.0042 0.0029 | 2 |
| E() | 0.0026 0.0018 | 2 |
| E() | 0.020 0.014 | 2 |
| ()0 | 0.0269 0.0096 | 2 |
| 0.1972 0.0050 | 2 | |
| 0.9574 0.0027 | 2 | |
| 0.035 0.013 | 2 | |
| -0.0058 0.0012 | 2 |
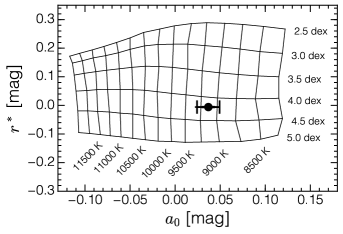
We then followed a procedure similar to that of David & Hillenbrand (2015) and derived and through a two-dimensional linear interpolation in the plane using a synthetic color grid distributed by Fiorella Castelli555http://wwwuser.oats.inaf.it/castelli/colors/uvbybeta/uvbybetap00k2odfnew.dat. The synthetic color grids are derived from ATLAS9 model atmospheres (Castelli & Kurucz, 2004, 2006). We calculated uncertainties in the atmospheric parameters using Monte Carlo simulations, modeling the input photometry as normal distributions with widths equal to the errors reported in Paunzen (2015) and using the previously estimated extinction value. The dereddened photometry and indices are presented in Table 2 and the position of HD 156623 in the plane with respect to the models is shown in Figure 1.
From this analysis we estimate K and dex. The values quoted here are the medians from the distributions resulting from the Monte Carlo simulations, while the errors quoted here are determined from the 16th and 84th percentiles of those distributions. We note that these errors are statistical in nature, and we have not attempted to account for any systematic uncertainties intrinsic to the synthetic color grids. We chose to instead adopt a systematic uncertainty of 0.14 dex for based on the analysis from David & Hillenbrand (2015). We adopt K and dex.
| Parameter | Value | Units |
|---|---|---|
| Teff | 9040 | K |
| 4.20 0.14 | dex | |
| BCV | -0.09 0.05 | mag |
| MV | 1.99 0.06 | mag |
| Mbol | 1.90 0.08 | mag |
| log(L/L | 1.137 0.031 | dex |
| Radius | 1.51 0.09 | R⊙ |
| Age | 16 7 | Myr |
| 3.8 6.9 | km/s | |
| sin | 88 2 | km/s |
We calculated the luminosity and radius of HD 156623 using the photometrically-derived parameters and Gaia parallax. We estimate the -band bolometric correction using our estimated combined with various published tables, all scaled to the new IAU 2015 bolometric magnitude system666https://www.iau.org/static/resolutions/IAU2015$_$English.pdf, see also Mamajek et al. (2015). The IAU 2015 bolometric magnitude system is set so that = 4.74 mag corresponds to the nominal solar luminosity of 3.828 1026 W.. Here we adopt the solar apparent magnitude from Torres (2010) (-26.76 0.03 mag), which when combined with the IAU 2015 apparent bolometric magnitude (-26.832 mag), equates to a solar = -0.072 0.03 mag. Comparing the scales from several studies (Balona, 1994; Flower, 1996; Bessell et al., 1998; Bertone et al., 2004), adjusting the scales slightly to reproduce (5772 K) = -0.072 mag, and accounting for the uncertainties, we estimate the -band bolometric correction for HD 156623 to be -0.09 0.05 mag. Accounting for the extinction ( = 0.025 0.055 mag), we derive bolometric flux = 35.11 2.42 pW m-2, apparent bolometric magnitude = 7.139 0.075 mag, absolute bolometric magnitude = 1.898 0.077 mag (IAU 2015 system), and absolute magnitude = 1.988 0.058 mag. We derive bolometric luminosity log(L/L⊙) = 1.137 0.031 dex or 13.71 , on the IAU 2015 scale where = 3.828 1026 W. Combined with the previously estimated effective temperature (Teff = 9040 K), we estimate the stellar radius to be 1.51 0.09 , where is the IAU 2015 nominal solar radius of 695,700 km. These estimated stellar parameters are summarized in Table 3.
To provide a consistency check on the parameters derived for HD 156623, we used the isoclassify code from Huber et al. (2017), which uses the MIST evolutionary models (Choi et al., 2016; Dotter, 2016) as well as the three-dimensional reddening map of Green et al. (2015) implemented in the mwdust package (Bovy et al., 2016). The isoclassify code has two modes: direct and grid. In the direct mode, the code takes an input parallax, -band magnitude and priors on , , and [Fe/H] in order to determine the luminosity and radius using theoretical -band bolometric corrections. The parallax is used to generate a distance posterior distribution, which is then used to calculate reddening given the star’s position and a 3D dust map. In the grid mode, the code does not rely on a reddening map but instead treats extinction as a free parameter. Using a fine grid of MIST isochrones, the code calculates reddened photometry in the 2MASS , Tycho , and Sloan passbands for given values of by interpolating the Cardelli et al. (1989) extinction law. The code then integrates over all isochrone points to find the maximum likelihood model that matches various combinations of input observables (e.g. colors).
The derived from photometry is consistent within 1 of the value found using the isoclassify grid mode (4.280.01 dex). The radii (Rgrid = 1.6350.026 R⊙, Rdirect 1.6180.092 R, (Teff,grid = 8920230 K, Teff,direct = 9040240 K), and luminosity (log(L/L⊙,grid) = 1.180.04 dex, log(L/L⊙,direct) = 1.200.01 dex) values found using both modes are consistent with one another and the results in Table 3 within 2.
3.4 Spectral Analysis
The FEROS spectrum of HD 156623 was downloaded in the FITS file format and analyzed with the SPLAT-VO tool777http://star-www.dur.ac.uk/$∼$pdraper/splat/splat-vo/. The wavelength range of 3900 – 6800 Å was used to avoid the Balmer jump and near-IR telluric lines interfering with the normalization process. Within SPLAT-VO, the spectrum was normalized by carefully using the line draw tool to interpolate an estimated continuum. The normalized spectrum was then analyzed to determine several properties of the star.
| Element | Air Wavelength (Å) | Measured Wavelength (Å) |
|---|---|---|
| H | 6562.800 | 6562.779 0.034 |
| H | 4861.330 | 4861.387 0.033 |
| H | 4340.470 | 4340.303 0.030 |
| H | 4101.760 | 4101.946 0.025 |
| Ca II K | 3933.636 | 3933.654 0.050 |
| Si II | 4128.070 | 4128.053 0.045 |
| Sr II | 4215.519 | 4215.577 0.015 |
| Ca I | 4226.728 | 4226.882 0.011 |
| Fe II | 4233.167 | 4233.273 0.017 |
| Sc II | 4246.820 | 4246.921 0.013 |
| Fe II | 4250.429 | 4250.509 0.011 |
| Fe II | 4271.400 | 4271.638 0.012 |
| Fe II | 4289.775 | 4289.962 0.011 |
| Fe I | 4404.750 | 4404.717 0.014 |
| Fe II | 4416.339 | 4416.319 0.053 |
| Ti II | 4468.507 | 4468.456 0.022 |
The Balmer series, Ca II K, and several metal lines in the spectrum (summarized in Table 4) were fit in SPLAT-VO with Gaussian, Lorentzian, and Voigt profiles. The best profile for each individual line was determined by the lowest rms of their fit. The profiles returned central wavelengths for each line, which were used to estimate a radial velocity for the star. The central wavelengths were compared to air wavelengths available in the NIST Atomic Spectra database888http://physics.nist.gov/PhysRefData/ASD/lines_form.html. Based on this analysis, the radial velocity for HD 156623 was determined to be = 3.8 6.9 km/s, which was reported in Table 3. The best value for the radial velocity was determined from the average value of the measured from each line; the uncertainty was propagated from the fit errors on the measured central wavelengths. Notably absent from this analysis were the H and Ca II H lines and the Mg II doublet at 4481 Å . Both sets of lines were blended in this spectrum and led to radial velocity values that were incompatible with the values measured in the other lines. This led to their exclusion from this analysis.
To estimate sin for HD 156623, several synthetic spectra from the POLLUX999http://pollux.graal.univ-montp2.fr/ service were generated. The POLLUX (Palacios et al., 2010) service provides synthetic ATLAS12 (Kurucz, 2005) atmospheres for early-A stars with Teff in steps of 100 K, in steps of 0.1 dex, and [Fe/H] in steps of 0.5 dex. Within the POLLUX service, the ATLAS12 models can be convolved with a synthetic broadening profile based on the work by Gray (2005). This broadening profile is determined by an input macroturbulent velocity, rotational velocity, instrument profile, and radial velocity. To extract a sin, we chose to fit these artificially broadened ATLAS12 models from the POLLUX service to the well-normalized H and narrow metal lines present in the spectrum. This method for estimating sin is similar to Method 2 described in Brown & Verschueren (1997) and is applicable for 50 km/s sin 200 km/s.
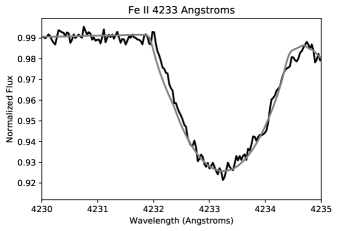
For a simple estimate of sin, we assumed a broadening profile due to rotation only, i.e., = 0 km/s and negligible instrument profile. The lines used to determine sin were selected based on their strength in the HD 156623 spectrum and their use in previous studies (H, Fe II 4233 Å , Ca I 4226 Å , Mg I 4702 Å: Ramella et al., 1989; Royer et al., 2002, 2014; Zwintz et al., 2014a). The first line analyzed was the Fe II Å line. This line provided a strong means of measuring a close value for the atmospheric parameters and broadening profile simultaneously. With initial guesses based on the Strömgren-derived parameters, we varied Teff, , [Fe/H], and sin in steps of 100 K, 0.1 dex, 0.5 dex, and 10 km/s respectively. Each fit was evaluated with a value. This located a starting atmosphere of Teff = 9200 K, = 4.2 dex, [Fe/H] = -0.5 dex, and sin = 90 km/s.
This initial guess of sin = 90 km/s was then varied in steps of 2 km/s and then 1 km/s. This resulted in a best fit sin for the Fe II line of Teff = 9200 K, 4.2 dex, [Fe/H] = -0.5 dex, and sin = 87 km/s. The Fe II 4233 Å line and its best fit were plotted in Figure 2 as an example. The black line in Figure 2 represents the measured FEROS spectrum and the gray line represents the best fit theoretical spectrum. The other two metal lines were best fit with this same atmosphere and the H line was better fit with Teff = 9300 K and sin = 90 km/s. Using these four lines, we adopt sin = 88 2 km/s. Our velocity results are consistent with Rebollido et al. (2018).
4 Results & Discussion
4.1 Group Membership and Age
The results and values in Table 3 were used to evaluate the age of HD 156623 based on its HR diagram position and perform a Sco-Cen membership analysis. The HR diagram position of the star is plotted (in Figure 3) along with solar composition isochrones from the PARSEC tracks (Marigo et al., 2017)101010Isochrones generated via the online CMD 3.0 tool at http://stev.oapd.inaf.it/cgi-bin/cmd, using initial composition X = 0.7092, Y = 0.2755, Z = 0.0152.. The HRD position for the star is consistent with a ZAMS star, likely older than 11 Myr and younger than 200 Myr.

Applying the BANYAN kinematic membership tool111111http://www.exoplanetes.umontreal.ca/banyan/banyansigma.php (which assesses membership probabilities for stars based on position and kinematic data (Gagné et al., 2018)) with the Gaia DR2 astrometry, we found a membership probability of 88.6% for the HD 156623 to belong to the Upper Centaurus-Lupus (UCL) subgroup of Sco-Cen (de Zeeuw et al., 1999; Mamajek et al., 2002; Preibisch & Mamajek, 2008; Pecaut & Mamajek, 2016). BANYAN also estimated a 11.4% probability that the star is a field star, and a probability of 0.1% for it to belong to any of the other known kinematic groups within 150 pc included in the code’s database. If the star belongs to UCL, its predicted radial velocity is 3.2 km/s, which is consistent with our measured value of 3.8 6.9 km/s. UCL has a mean age of 16 2 Myr, however the group covers tens of parsecs, and appears to have an intrinsic age spread of approximately 7 Myr (Pecaut & Mamajek, 2016). UCL surrounds the Lupus clouds, with 5-10 Myr-old stars in the vicinity (but outside of the star-forming clouds), and pockets of UCL appear to have ages as old 20-25 Myr. We surmise that HD 156623 is most likely an outlying member of UCL, with age 16 7 Myr, based on the intrinsic scatter in the ages of UCL members from (Pecaut & Mamajek, 2016), and consistent with the HR diagram position. This suggests that the star is ZAMS, or possibly slightly pre-MS if it is younger than about 12 Myr.
4.2 Scuti Frequencies
4.2.1 Reported Frequencies
The analysis of §3.2 recovered 16 p-mode frequencies for HD 156623. Since the noise characteristics of bRing were not completely understood (see §3.1), this study was conservative when reporting frequencies as astrophysical. Due to the design of bRing, we had the ability to check for each frequency in each camera individually when selecting frequencies. These 16 frequencies were subsequently broken into a group of 9 confirmed frequencies (Table 5) and 7 candidate frequencies (Table 6). The 9 confirmed frequencies were detected in data taken by at least one camera at each site. This criterion guaranteed that these frequencies are not single-camera and single-site systematics being mistakenly reported as real astrophysical frequencies intrinsic to the star. The 7 candidate frequencies were only detected in the South African West Camera (SAW), which had observed the star the most with 8500 data points. These frequencies reported in Table 6 could be either real astrophysical frequencies or unknown systematics intrinsic to either SAW or the South African bRing station itself. We also included in Table 5 the number of cameras each frequency was detected in. The cameras that missed some of the frequencies were either the Australia West or South Africa East cameras, which both observed the star the least at their respective site.
| Frequency | Amplitude | Phase | # of cameras |
|---|---|---|---|
| () | (mmag) | (Rad) | – |
| 71.143 0.002 | 6.63 1.23 | 0.565 0.001 | 4 |
| 67.005 0.002 | 2.60 0.99 | 0.542 0.001 | 4 |
| 67.306 0.002 | 2.31 0.65 | 0.114 0.001 | 4 |
| 63.562 0.002 | 2.18 1.29 | 0.570 0.001 | 3 |
| 63.426 0.002 | 1.70 0.34 | 0.072 0.001 | 4 |
| 59.002 0.003 | 1.69 0.33 | 0.413 0.001 | 3 |
| 63.701 0.003 | 1.58 0.31 | 0.637 0.001 | 3 |
| 59.970 0.003 | 1.03 0.09 | 0.556 0.001 | 2 |
| 70.880 0.003 | 1.00 0.18 | 0.258 0.001 | 2 |
Note. — Mean Epoch 2458193.3 HJD
| Frequency | Amplitude | Phase |
|---|---|---|
| () | (mmag) | (Rad) |
| 93.261 0.002 | 1.04 0.78 | 0.896 0.001 |
| 60.700 0.002 | 0.95 0.78 | 0.873 0.001 |
| 75.211 0.002 | 0.82 0.78 | 0.882 0.002 |
| 66.414 0.002 | 0.79 0.78 | 0.457 0.002 |
| 64.179 0.002 | 0.75 0.78 | 0.581 0.002 |
| 89.250 0.002 | 0.73 0.78 | 0.434 0.002 |
| 56.116 0.002 | 0.70 0.78 | 0.198 0.002 |
Note. — Mean Epoch 2458193.3 HJD
The frequencies and phases reported in Table 5 were the frequencies and phases detected using Period04 on the composite periodograms. The reported amplitudes in Table 5 were from averaging the composite and individual camera detections uncovered by Period04. The uncertainties for the frequencies and amplitudes were calculated based on the measurements made in each camera and the composite light curve. This resulted in uncertainties that were 1 order of magnitude larger in frequency than uncertainties calculated by the methods of Montgomery & Odonoghue (1999), but the presence of remaining unidentified systematics due to the high observing cadence and stationary nature of bRing requires a more conservative estimate of the noise until these systematics are investigated further and removed. The phase uncertainties, however, were calculated via Montgomery & Odonoghue (1999) using the amplitudes from Table 5. The frequencies, amplitudes, and phases in Table 6 were reported as detected in SAW. The uncertainties for the frequency and amplitude were computed using the uncertainties from Table 5. The uncertainty in the phase for Table 6 was similarly computed using Montgomery & Odonoghue (1999). The amplitude uncertainties were rather large compared to the reported amplitudes. The culprit was likely slight temporal systematics between the cameras.
To ensure that the frequencies were exclusive to HD 156623, the 3 nearest neighbors in the bRing catalog (HD 157661 68 pixels apart, HD 156274 75 pixels apart, HD 156293 80 pixels apart) were used as check stars. They were put through the same data reduction and periodogram analysis discussed in §3. These stars were chosen as they should be subject to similar sources of global and local noise on the CCD due to their proximity. Therefore, any unique signals detected in the periodogram of HD 156623 should be independent of any signals detected in the periodograms of these stars. We found no evidence of pulsations within the 50 – 100 frequency range of these three check stars.
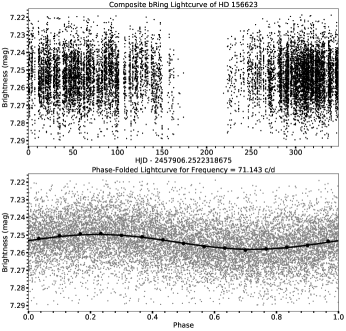
In the top panel of Figure 4, we plotted the full composite light curve of HD 156623. In the bottom panel of Figure 4, we plotted a phase-folded light curve of the primary frequency (71.143 ) in Figure 4. This bottom plot includes the bRing data in gray, 15 evenly spaced median-binned data points represented by black circles, and the sinusoidal solution from plotted as a black line.
4.2.2 Interpreting the Frequencies
HD 156623 has been a photometric standard star for decades. It is expected that any new detected pulsations in the star should be comparable or smaller than the best value of the magnitude and its associated uncertainty ( = 7.24 0.007 mag; Mermilliod et al., 1997). Considering the confirmed frequencies only, one finds the sum of the amplitudes to be 20 mmag, which is 3 times lower than the SEM of the magnitude hence it is unsurprising that the Scuti pulsations were previously missed.
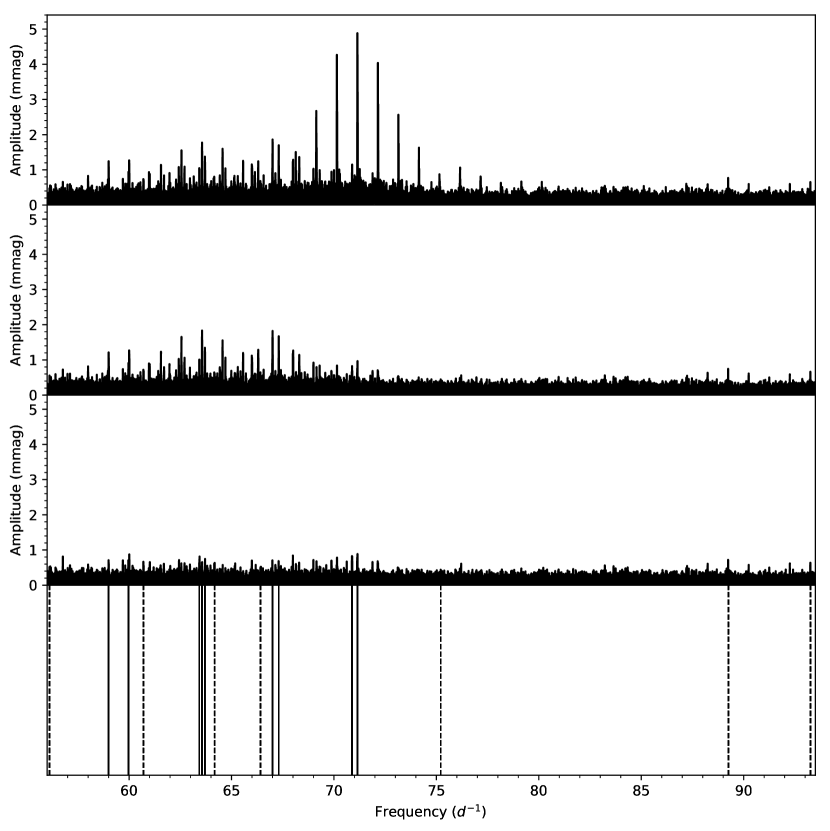
In the top panel of Figure 5, the periodogram of the HD 156623 composite light curve was plotted between 56 and 93.5 , within which the Scuti pulsations are contained. The second panel shows the periodogram after removal of the primary frequency and the third shows the residual periodogram after the removal of all frequencies above the noise threshold. The projections of the 9 reported frequencies from Table 5 were plotted with solid lines in the bottom panel of Figure 5 along with the projections of the 7 candidate frequencies from Table 6 plotted with dashed lines. The main frequency (71.143 ) generated several daily aliases, which are obvious in the periodogram. There were also several frequencies that seemed real; upon closer inspection, these appeared to be aliases between the peaks (several strong beat frequencies were also generated and are outside the window of Figure 5). The reported frequencies are not aliases of each other or linear combinations of one another. They were also well-resolved, despite our large uncertainties. In HD 156623, we clearly observed high-order radial modes (the fundamental radial should not exceed 25 ; Zwintz et al., 2011).
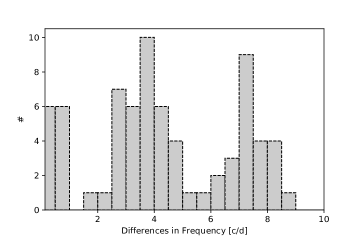
There was evidence of grouping between all 16 frequencies (frequencies clustered around each other; Kurtz et al., 2014). Without a proper model and 7 of our frequencies only reaching the candidate status, we deduced a possible interpretation of how the frequencies may be grouped based on a visual inspection of Figure 5. The main frequency (71.143 ) appeared to exist in a doublet with the frequency 70.880 . We also saw evidence for two sets of triplets ({67.005 , 67.306 , 66.414 } and {59.002 , 59.970 , 60.700 }) and 1 quadruplet {63.562 , 63.426 , 63.701 , 64.179 }. The rest of the frequencies appeared to be singlets. The frequencies reported by this analysis showed strong evidence of regularity (frequencies with common separation; Zwintz et al., 2011). We plotted a histogram of the differences between all 16 frequencies – using bins of size 0.5 – in Figure 6; we found evidence of regularity for three different separations: 3.75 , 7.25 , and 2.75 . To generate an accurate interpretation of these regularities and groupings, one would need to develop a model similar to the one from (Zwintz et al., 2014a), which is beyond the scope of this work.
To check for temporal variations in the frequencies, amplitudes, and phases, the data were broken up into 2 month segments in SAW (the best camera to individually sample the star with 8500 points). All three parameters for each set of frequencies stayed consistent (within uncertainty) throughout each segment. Therefore, period, amplitude, and phase variations were not detected in this study on the timescale of 1 year.
4.2.3 Evolutionary Stage Analysis
A critical parameter in the seismic analysis of pre-MS and ZAMS stars is the acoustic-cutoff frequency (Zwintz et al., 2014b). This corresponds to the highest frequency () pressure mode in the star (Zwintz et al., 2014a). Casey (2011) predicts that the highest acoustic-cutoff frequencies occur as the star approaches ZAMS. It is also expected that the acoustic-cutoff frequency scales with the frequency of maximum power (Aerts et al., 2010). The echographic study of Zwintz et al. (2014b) used pre-MS and ZAMS Scutis to show that the hottest and most evolved stars are consistent with these predictions. For HD 156623, we found that the acoustic-cutoff frequency is also the frequency of maximum power. This is similar to HD 34282, although for HD 34282 is higher (79.423 ; Casey et al., 2013). This implied – like HD 34282 – that HD 156623 should be consistent with the models and implications predicted by Casey (2011) and Aerts et al. (2010) and be consistent with the results of Zwintz et al. (2014b) if the age and evolutionary status estimations from §4.1 were correct.
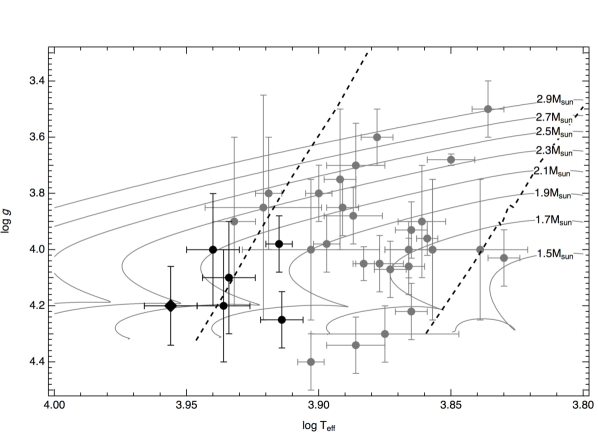
To check this, we used the estimated and from Table 3 and the acoustic-cutoff frequency (71.143 ) from Table 5 to plot HD 156623 (plotted as a black diamond) in a Kiel diagram alongside known pre-MS and early ZAMS Scutis from Zwintz et al. (2014b) in Figure 7. The five hottest pre-MS or early ZAMS Scutis from the sample by Zwintz et al. (2014b) – Pic (A6 V), HD 261711 (A2 V), HD 144277 (A1 V), HD 34282 (A0.5 V) and HD 37357 (A1 V) – have values of their highest excited frequency ranging between 70 and 90 . These were plotted in black instead of gray to highlight their similarity to HD 156623, which is the hottest star in the entire sample and its highest excited frequency is within this range. The theoretical blue edge (left dashed line) and the empirical red edge (right dashed line) of the classical Scuti instability strip as defined by Breger & Pamyatnykh (1998) were also plotted. The highest excited frequency and HD 156623’s placement on the diagram were consistent with the other pre-MS or early ZAMS Scuti stars of the sample as predicted. This star also lies to the left of the theoretical blue edge of the classical instability strip (Breger & Pamyatnykh, 1998). It was noted that any of the higher candidate frequencies from Table 6, i.e., 75.211 , 89.250 and 93.261 , were also consistent with our interpretation.
5 Conclusion
The bRing observatories are the first to identify Scuti pulsations in the young A1 V star HD 156623, which hosts a gas-rich debris disk. We detected 16 frequencies in total, 9 of which we confirmed to be real and the remaining 7 we determined to be candidate frequencies. We found that the total amplitude from the 9 confirmed frequencies was small and it is unsurprising that these pulsations were missed in previous studies of the star. We uncovered strong evidence of regularity between the frequencies. We found no evidence of frequency, amplitude, or phase modulation over the course of bRing’s observations. The predicted , along with our new estimated temperature and largest measured confirmed frequency, were used to compare HD 156623 to other pre-MS Scuti stars on a Kiel diagram with theoretical pre-MS and early ZAMS evolutionary tracks. HD 156623 is both consistent with similar stars and lies well within the predicted evolutionary tracks. HD 156623 also lies just beyond the theoretical blue edge of the classical instability strip.
In addition to the frequency analysis, we performed a stellar characterization, spectral, and Sco-Cen membership analysis. We found HD 156623 to be a negligibly reddened 16 7 Myr A1 V outlying member of the Sco-Cen subgroup Upper-Centaurus Lupus at 112 pc. The presence of the gas-rich debris disk supports a young age.
Future work could include a full asteroseismic modeling similar to Zwintz et al. (2014a) and a more detailed abundance analysis of the star. Before such modeling should be done, however, additional observations from bRing or other instruments should be made to verify the 7 candidate frequencies reported in Table 6. These observations should also attempt to discover fainter frequencies. With this information and improved frequencies, this star will provide a better understanding of the young, hot Scutis.
References
- Aerts et al. (2010) Aerts, C., Christensen-Dalsgaard, J., & Kurtz, D. W. 2010, Asteroseismology
- Bailer-Jones et al. (2018) Bailer-Jones, C. A. L., Rybizki, J., Fouesneau, M., Mantelet, G., & Andrae, R. 2018, AJ, 156, 58
- Bakos et al. (2002) Bakos, G. Á., Lázár, J., Papp, I., Sári, P., & Green, E. M. 2002, PASP, 114, 974
- Balona (1994) Balona, L. A. 1994, MNRAS, 268, 119
- Balona & Evers (1999) Balona, L. A., & Evers, E. A. 1999, MNRAS, 302, 349
- Bertone et al. (2004) Bertone, E., Buzzoni, A., Chávez, M., & Rodríguez-Merino, L. H. 2004, AJ, 128, 829
- Bessell et al. (1998) Bessell, M. S., Castelli, F., & Plez, B. 1998, A&A, 333, 231
- Bovy et al. (2016) Bovy, J., Rix, H.-W., Green, G. M., Schlafly, E. F., & Finkbeiner, D. P. 2016, ApJ, 818, 130
- Bowman & Kurtz (2018) Bowman, D. M., & Kurtz, D. W. 2018, MNRAS, 476, 3169
- Breger (2000) Breger, M. 2000, Baltic Astronomy, 9, 149
- Breger & Pamyatnykh (1998) Breger, M., & Pamyatnykh, A. A. 1998, A&A, 332, 958
- Brown & Verschueren (1997) Brown, A. G. A., & Verschueren, W. 1997, A&A, 319, 811
- Brown et al. (2018) Brown, A. G. A., Vallenari, A., Prusti, T., et al. 2018, A&A, 616, A1
- Burggraaff et al. (2018) Burggraaff, O., Talens, G. J. J., Spronck, J., et al. 2018, ArXiv e-prints, arXiv:1806.02247
- Capitanio et al. (2017) Capitanio, L., Lallement, R., Vergely, J. L., Elyajouri, M., & Monreal-Ibero, A. 2017, A&A, 606, A65
- Cardelli et al. (1989) Cardelli, J. A., Clayton, G. C., & Mathis, J. S. 1989, ApJ, 345, 245
- Cargile et al. (2014) Cargile, P. A., James, D. J., Pepper, J., et al. 2014, ApJ, 782, 29
- Casey (2011) Casey, M. P. 2011, PhD thesis, Saint Mary’s University (Canada
- Casey et al. (2013) Casey, M. P., Zwintz, K., Guenther, D. B., et al. 2013, MNRAS, 428, 2596
- Castelli & Kurucz (2004) Castelli, F., & Kurucz, R. L. 2004, ArXiv Astrophysics e-prints, astro-ph/0405087
- Castelli & Kurucz (2006) —. 2006, A&A, 454, 333
- Choi et al. (2016) Choi, J., Dotter, A., Conroy, C., et al. 2016, ApJ, 823, 102
- Cousins (1976) Cousins, A. W. J. 1976, Memoirs of the Royal Astronomical Society, 81, 25
- Cousins (1980) —. 1980, Monthly Notes of the Astronomical Society of South Africa, 39, 22
- Cousins (1983) —. 1983, South African Astronomical Observatory Circular, 7, 36
- Cousins (1987) —. 1987, South African Astronomical Observatory Circular, 11, 93
- Cousins (1990) —. 1990, South African Astronomical Observatory Circular, 14, 55
- Cousins & Stoy (1962) Cousins, A. W. J., & Stoy, R. H. 1962, Royal Greenwich Observatory Bulletins, 49, 3
- Crawford (1958) Crawford, D. L. 1958, ApJ, 128, 185
- David & Hillenbrand (2015) David, T. J., & Hillenbrand, L. A. 2015, ApJ, 804, 146
- de Zeeuw et al. (1999) de Zeeuw, P. T., Hoogerwerf, R., de Bruijne, J. H. J., Brown, A. G. A., & Blaauw, A. 1999, AJ, 117, 354
- Dotter (2016) Dotter, A. 2016, ApJS, 222, 8
- Fitch (1981) Fitch, W. S. 1981, ApJ, 249, 218
- Fitzpatrick (1999) Fitzpatrick, E. L. 1999, PASP, 111, 63
- Flower (1996) Flower, P. J. 1996, ApJ, 469, 355
- Gagné et al. (2018) Gagné, J., Mamajek, E. E., Malo, L., et al. 2018, ApJ, 856, 23
- Gaia Collaboration et al. (2016) Gaia Collaboration, Prusti, T., de Bruijne, J. H. J., et al. 2016, A&A, 595, A1
- Gray (2005) Gray, D. F. 2005, The Observation and Analysis of Stellar Photospheres
- Green et al. (2015) Green, G. M., Schlafly, E. F., Finkbeiner, D. P., et al. 2015, ApJ, 810, 25
- Guenther et al. (2009) Guenther, D. B., Kallinger, T., Zwintz, K., et al. 2009, The Astrophysical Journal, 704, 1710. http://stacks.iop.org/0004-637X/704/i=2/a=1710
- Hartman et al. (2010) Hartman, J. D., Bakos, G. Á., Kovács, G., & Noyes, R. W. 2010, MNRAS, 408, 475
- Hartman et al. (2008) Hartman, J. D., Gaudi, B. S., Holman, M. J., et al. 2008, ApJ, 675, 1254
- Hauck & Mermilliod (1997) Hauck, B., & Mermilliod, M. 1997, uvby-beta Catalogue, VizieR Online Data Catalog, 2215
- Huber et al. (2017) Huber, D., Zinn, J., Bojsen-Hansen, M., et al. 2017, ApJ, 844, 102
- Hunter (2007) Hunter, J. D. 2007, Matplotlib: A 2D Graphics Environment, , . http://www.scipy.org/
- Jones et al. (2001–) Jones, E., Oliphant, T., Peterson, P., et al. 2001–, SciPy: Open source scientific tools for Python, , . http://www.scipy.org/
- Kaufer et al. (1999) Kaufer, A., Stahl, O., Tubbesing, S., et al. 1999, The Messenger, 95, 8
- Kharchenko (2001) Kharchenko, N. V. 2001, Kinematika i Fizika Nebesnykh Tel, 17, 409
- Kilkenny & Laing (1992) Kilkenny, D., & Laing, J. D. 1992, MNRAS, 255, 308
- Kral et al. (2017) Kral, Q., Matrà, L., Wyatt, M. C., & Kennedy, G. M. 2017, MNRAS, 469, 521
- Kurtz et al. (2014) Kurtz, D. W., Saio, H., Takata, M., et al. 2014, MNRAS, 444, 102
- Kurucz (2005) Kurucz, R. L. 2005, Memorie della Societa Astronomica Italiana Supplementi, 8, 14
- Kuschnig et al. (1997) Kuschnig, R., Weiss, W. W., Gruber, R., Bely, P. Y., & Jenkner, H. 1997, A&A, 328, 544
- Lallement et al. (2018) Lallement, R., Capitanio, L., Ruiz-Dern, L., et al. 2018, A&A, 616, A132
- Lenz & Breger (2005) Lenz, P., & Breger, M. 2005, Communications in Asteroseismology, 146, 53
- Lieman-Sifry et al. (2016) Lieman-Sifry, J., Hughes, A. M., Carpenter, J. M., et al. 2016, ApJ, 828, doi:10.3847/0004-637X/828/1/25
- Mamajek et al. (2002) Mamajek, E. E., Meyer, M. R., & Liebert, J. 2002, AJ, 124, 1670
- Mamajek et al. (2012) Mamajek, E. E., Quillen, A. C., Pecaut, M. J., et al. 2012, AJ, 143, 72
- Mamajek et al. (2015) Mamajek, E. E., Torres, G., Prsa, A., et al. 2015, ArXiv e-prints, arXiv:1510.06262
- Marigo et al. (2017) Marigo, P., Girardi, L., Bressan, A., et al. 2017, ApJ, 835, 77
- McCall (2004) McCall, M. L. 2004, AJ, 128, 2144
- McDonald et al. (2012) McDonald, I., Zijlstra, A. A., & Boyer, M. L. 2012, MNRAS, 427, 343
- Mellon et al. (2018) Mellon, S., Stuik, R., Bailey, J., et al. 2018, in American Astronomical Society Meeting Abstracts, Vol. 231, American Astronomical Society Meeting Abstracts #231, #152.22
- Mellon et al. (2017) Mellon, S. N., Mamajek, E. E., Oberst, T. E., & Pecaut, M. J. 2017, ApJ, 844, 66
- Menzies et al. (1980) Menzies, J. W., Banfield, R. M., & Laing, J. D. 1980, South African Astronomical Observatory Circular, 1, 149
- Menzies et al. (1989) Menzies, J. W., Cousins, A. W. J., Banfield, R. M., & Laing, J. D. 1989, South African Astronomical Observatory Circular, 13, 1
- Mermilliod (1991) Mermilliod, J.-C. 1991, Homogeneous Means in the UBV System, VizieR Online Data Catalog, 2168
- Mermilliod et al. (1997) Mermilliod, J.-C., Mermilliod, M., & Hauck, B. 1997, A&AS, 124, 349
- Messina et al. (2010) Messina, S., Desidera, S., Turatto, M., Lanzafame, A. C., & Guinan, E. F. 2010, A&A, 520, A15
- Montgomery & Odonoghue (1999) Montgomery, M. H., & Odonoghue, D. 1999, Delta Scuti Star Newsletter, 13, 28
- Moór et al. (2017) Moór, A., Curé, M., Kóspál, Á., et al. 2017, ApJ, 849, doi:10.3847/1538-4357/aa8e4e
- Napiwotzki et al. (1993) Napiwotzki, R., Schoenberner, D., & Wenske, V. 1993, A&A, 268, 653
- Oberst et al. (2017) Oberst, T. E., Rodriguez, J. E., Colón, K. D., et al. 2017, AJ, 153, 97
- Palacios et al. (2010) Palacios, A., Gebran, M., Josselin, E., et al. 2010, A&A, 516, A13
- Paunzen (2015) Paunzen, E. 2015, A&A, 580, doi:10.1051/0004-6361/201526413
- Paunzen et al. (2001) Paunzen, E., Duffee, B., Heiter, U., Kuschnig, R., & Weiss, W. W. 2001, A&A, 373, 625
- Pecaut & Mamajek (2016) Pecaut, M. J., & Mamajek, E. E. 2016, MNRAS, 461, 794
- Pepper et al. (2007) Pepper, J., Pogge, R. W., DePoy, D. L., et al. 2007, Publications of the Astronomical Society of the Pacific, 119, 923. http://stacks.iop.org/1538-3873/119/i=858/a=923
- Perryman & ESA (1997) Perryman, M. A. C., & ESA, eds. 1997, ESA Special Publication, Vol. 1200, The HIPPARCOS and TYCHO catalogues. Astrometric and photometric star catalogues derived from the ESA HIPPARCOS Space Astrometry Mission
- Pollacco (2006) Pollacco, D. L., e. a. 2006, PASP, 118, 1407
- Preibisch & Mamajek (2008) Preibisch, T., & Mamajek, E. 2008, in Handbook of Star Forming Regions, Volume II: The Southern Sky – ASP Monograph Publications, Vol. 5., ed. B. Reipurth, 235
- Press et al. (1992) Press, W. H., Teukolsky, S. A., Vetterling, W. T., & Flannery, B. P. 1992, Numerical recipes in FORTRAN. The art of scientific computing
- Ramella et al. (1989) Ramella, M., Boehm, C., Gerbaldi, M., & Faraggiana, R. 1989, A&A, 209, 233
- Rebollido et al. (2018) Rebollido, I., Eiroa, C., Montesinos, B., et al. 2018, A&A, 614, A3
- Rizzuto et al. (2012) Rizzuto, A. C., Ireland, M. J., & Zucker, D. B. 2012, MNRAS, 421, L97
- Rossum (1995) Rossum, G. 1995, Python Reference Manual, Tech. rep., Amsterdam, The Netherlands, The Netherlands
- Royer et al. (2002) Royer, F., Grenier, S., Baylac, M.-O., Gómez, A. E., & Zorec, J. 2002, A&A, 393, 897
- Royer et al. (2014) Royer, F., Gebran, M., Monier, R., et al. 2014, A&A, 562, A84
- Scargle (1982) Scargle, J. D. 1982, ApJ, 263, 835
- Slawson et al. (1992) Slawson, R. W., Hill, R. J., & Landstreet, J. D. 1992, The Astrophysical Journal Supplement Series, 82, 117
- Snellen et al. (2013) Snellen, I., Stuik, R., Otten, G., et al. 2013, in European Physical Journal Web of Conferences, Vol. 47, European Physical Journal Web of Conferences, 03008
- Snellen et al. (2012) Snellen, I. A. G., Stuik, R., Navarro, R., et al. 2012, in Proc. SPIE, Vol. 8444, Ground-based and Airborne Telescopes IV, 84440I
- Stuik et al. (2014) Stuik, R., Lesage, A.-L., Jakobs, A., Spronck, J. F. P., & Snellen, I. A. G. 2014, in Proc. SPIE, Vol. 9152, Software and Cyberinfrastructure for Astronomy III, 91520N
- Stuik et al. (2017) Stuik, R., Bailey, J. I., Dorval, P., et al. 2017, A&A, 607, A45
- Stéfan van der Walt & Varoquaux (2011) Stéfan van der Walt, S. C. C., & Varoquaux, G. 2011, The NumPy Array: A Structure for Efficient Numerical Computation, , . http://www.scipy.org/
- Talens et al. (2017) Talens, G. J. J., Spronck, J. F. P., Lesage, A.-L., et al. 2017, A&A, 601, A11
- Talens et al. (2018) Talens, G. J. J., Deul, E. R., Stuik, R., et al. 2018, ArXiv e-prints, arXiv:1810.04060
- The Astropy Collaboration et al. (2018) The Astropy Collaboration, Price-Whelan, A. M., Sipőcz, B. M., et al. 2018, AJ, 156, 123
- Torres (2010) Torres, G. 2010, AJ, 140, 1158
- van Leeuwen (2007) van Leeuwen, F. 2007, A&A, 474, 653
- Wang et al. (2016) Wang, J. J., Graham, J. R., Pueyo, L., et al. 2016, AJ, 152, 97
- Watson et al. (2006) Watson, C. L., Henden, A. A., & Price, A. 2006, Society for Astronomical Sciences Annual Symposium, 25, 47
- Zwintz et al. (2011) Zwintz, K., Lenz, P., Breger, M., et al. 2011, A&A, 533, A133
- Zwintz et al. (2014a) Zwintz, K., Ryabchikova, T., Lenz, P., et al. 2014a, A&A, 567, A4
- Zwintz et al. (2014b) Zwintz, K., Fossati, L., Ryabchikova, T., et al. 2014b, Science, 345, 550. http://science.sciencemag.org/content/345/6196/550