Measuring the Expansion and Age of the Nova Shell IPHASX J210204.7+471015
Abstract
The parallax expansion and kinematics of a nova shell can be used to assess its age and distance, and to investigate the interaction of the ejecta with the circumstellar medium. These are key to understand the expansion and dispersal of the nova ejecta in the Galaxy. Multi-epoch images and high-dispersion spectroscopic observations of the recently discovered classical nova shell IPHASX J210204.7+471015 around a nova-like system have been used to derive a present day expansion rate of 0100 yr-1 and an expansion velocity of 285 km s-1. These data are combined to obtain a distance of 600 pc to the nova. The secular expansion of the nova shell place the event sometime between 1850 and 1890, yet it seems to have been missed at that time. Despite its young age, 130-170 yrs, we found indications that the ejecta has already experienced a noticeable deceleration, indicating the interaction of this young nova shell with the surrounding medium.
keywords:
techniques: image processing – imaging spectroscopy – stars: individual: novae – cataclysmic variables – ISM: kinematics and dynamics1 Introduction
Cataclysmic variables (CVs) are binary systems in close orbit in which a secondary component, typically a late-type dwarf, giant or sub-giant star, transfers H-rich material to the white dwarf (WD) main component via an accretion disc or directly onto the surface of highly magnetized WDs. This material builds up onto the WD surface until it reaches a critical mass limit and experiences a thermonuclear runaway in a classical nova (CN) event. Significant amounts of highly processed material () are ejected at high speeds (1000 km s-1). The expansion of the nebular shell into the interstellar medium (ISM) can be followed in the next years (Evans et al., 1992).
Nebular shells around CNe are scarce (Sahman et al., 2015), but their morphologies provide important clues about the geometry of the ejecta (e.g., in HR Del, Harman & O’Brien, 2003; Moraes & Diaz, 2009) and its interactions with the circumstellar material and newly developed stellar winds (e.g., as in DQ Her and RR Pic, Gill & O’Brien, 1999; Vaytet et al., 2007). They can also be used to determine important properties of the binary system, such as its orbit inclination (e.g., in V2491 Cyg, Ribeiro et al., 2011), whereas the distance and age of the nova event can be derived in conjunction with kinematic information (Gill & O’Brien, 2000) or via the expansion parallax (Downes & Duerbeck, 2000). The shape of the nova shell is probably correlated with the nova speed class (Slavin, O’Brien, & Dunlop, 1995).
There are, however, very few studies on the angular expansion of nova shells. Shara et al. (2012a) could not detect expansion in the nebular remnant of Z Cam, while Chesneau et al. (2012) had to resort to NACO/Very Large Telescope (VLT) adaptive optics to detect the expansion of the nova shell around V1280 Sco. The nova shell GK Per is probably the best case study, with multiple knots expanding isotropically at an angular velocity 03-05 yr-1 (Shara et al., 2012b; Liimets et al., 2012). The expansion velocity of these knots has remained unchanged since their ejection about a century ago. This is somehow surprising, because individual knots reveal notable interactions with each other and with the ISM (Harvey et al., 2016).

Since the expansion of a nova shell varies according to the local properties of the ISM, each object is by itself a case study offering the possibility to investigate the interaction of highly processed material with the ISM and its subsequent dispersal into the Galaxy (Shara et al., 2017). Here we present an analysis of the expansion of the recently discovered CN shell IPHASX J210204.7+471015 (hereafter J210204, Guerrero et al., 2018) using multi-epoch images and high-dispersion spectra. The observational material in this work is presented in §2. The present day expansion of the nova, its expansion velocity and distance, and its long-term expansion and age are reported in §3, §4, and §5, respectively. Finally a short discussion of these results are presented in §6.
2 Observations
2.1 Multi-epoch Imaging
Contemporary narrow-band images of J210204 were obtained using the Andalucia Faint Object Spectrograph and Camera (ALFOSC) attached to the 2.5m Nordic Optical Telescope (NOT) of the Roque de los Muchachos Observatory (ORM) in La Palma, Spain. The images were obtained during three different runs in 2015 July 19, 2016 November 26, and 2017 May 28. The E2V 42-40 2k2k CCD with pixel size 13.5 m was used in 2015, providing a plate scale of 0189 pix-1 and a field of view (FoV) of 65 arcmin, whereas the E2V 231-42 2k2k CCD with pixel size 15.0 m was used in 2016 and 2017, providing a plate scale of 0211 pix-1 and a FoV of 72 arcmin. The 2015 images were acquired through [N ii] (=6583 Å, =36 Å) and [O iii] (=5007 Å, =43 Å) narrow-band filters with total exposure times of 900 and 600 s, respectively. The 2016 images were acquired through the same [N ii] narrow-band filter with total exposure time of 1,800 s. Although the bandwidth of this [N ii] filter includes the H line, the contribution of this line to the [N ii] image presented here is negligible as the H line emission is considerably weaker than the [N ii] emission (Guerrero et al., 2018). The 2017 images were acquired through [N ii] (=6584 Å, =10 Å) and [O iii] (=5007 Å, =30 Å) narrow-band filters with total exposure times of 1,800 and 3,600 s, respectively. All images were processed using standard IRAF111 IRAF is distributed by the National Optical Astronomy Observatory, which is operated by the Association of Universities for Research in Astronomy (AURA) under a cooperative agreement with the National Science Foundation. routines. In all cases, images were bias subtracted and flat-field corrected using appropriate sky flat field frames. Multiple exposures (typically three) were obtained and combined to reject cosmic ray hits. A small (few arcsec) dither was applied between individual exposures to improve the image cosmetics. The spatial resolution, as determined from the FWHM of field stars, was 06 in 2015, 06 in 2016, and 07 in 2017.
Intermediate-epoch narrow-band H images of J210204 obtained in 2003 and 2009 were downloaded from the IPHAS database (the INT Photometric H Survey, Drew et al., 2005). The images were obtained using the Wide Field Camera (WFC), with a plate scale of 03 pix-1 and FoV 30′. Exposure times were 120 s, with typical spatial resolution of 14. An additional 1,200 s INT WFC H image obtained in 2007 with similar image quality was also used.
Early broad-band images of J210204 are available in the Digitized Sky Survey (DSS). A POSS-I-E image was obtained on 1952 July 20 with the Palomar Schmidt telescope on a red-sensitive 103aE plate with a plexi filter. The exposure time was 5 min. The image has a plate scale of 17 pix-1 and a spatial resolution of 35. A POSS-II-F UKSTU Red image was obtained on 1990 September 19, with the Oschin Schmidt Telescope on a IIIaF plate with a RG610 filter. The exposure time was 6 min. The image has a plate scale of 10 pix-1 and a spatial resolution of 30. We emphasize that the DSS broadband images and INT narrowband H images are mostly dominated by the [N ii] 6548,6584 emission lines, thus allowing a direct comparison with the NOT narrow-band [N ii] images.
2.2 Spectroscopy
High-dispersion long-slit echelle spectra of J210204 were obtained using the Manchester Echelle Spectrometer (MES) at the 2.1m telescope of the Observatorio Astronómico Nacional at San Pedro Mártir, Mexico (OAN-SPM) on 2016 April 19. MES was used with a 65-long slit using an H filter to isolate the H and [N ii] 6548,6584 emission lines. The E2V 42-40 CCD was used with a 44 binning, resulting in a plate scale of 0702 pix-1 and a spectral scale of 0.1 Å pix-1. The slit width of 150 m (19) implies a spectral resolution of 121 km s-1. A single exposure of 1800 s was obtained. The data were reduced using standard IRAF routines to subtract the bias and rectify the spectrum and apply a wavelength calibration using a ThAr arc spectrum obtained at the same telescope position as the science exposure. The wavelength-calibration resulted in an accuracy 1 km s-1.
In this work we also use the GTC OSIRIS intermediate-dispersion spectra presented by Guerrero et al. (2018). Although these data have low spectral dispersion, 9 Å, i.e. 400 km s-1 at the [N ii] 6584 Å emission line, a Gaussian fit can provide a measurement of the centroid of a well-detected line with an accuracy 10% the line width.
3 Current Nova Expansion
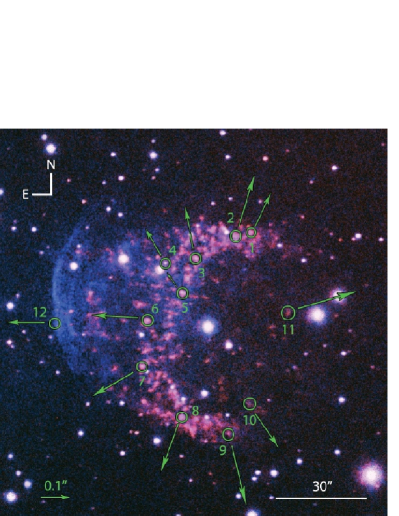
A color-composite picture of the 2017 images of J210204 is shown in Figure 1. The nova shell J210204 presents a multitude of [N ii]-bright knots distributed along a broken ring. The morphology of this arc is very similar to the 3′ in size ring of the shell surrounding the dwarf nova AT Cnc (Shara et al., 2012c). In contrast to that nova shell, J210204 displays an additional bow-shock-like structure very prominent in the [O iii] emission line. The chemical abundances differences between the ring and bow-shock structures imply that the ring is composed of freshly nova ejecta, whereas the bow-shock consists mainly of piled up ISM material. The reader is referred to Guerrero et al. (2018) for further details.
An inspection of the July 2015 and May 2017 images reveals the nova expansion. To quantify the current expansion of J210204 and to investigate possible anisotropies, the images from these two epochs were compared using different methods. As a preliminary step, the images were accurately registered using 30 reference stars in the FoV, the pixel size of the 2017 images (0211 pix-1) was scaled to that of the 2015 images (0189 pix-1), and the surface brightness normalized to the nebular peak value.
| Feature | Emission | Angular | Expansion | Magnification |
|---|---|---|---|---|
| Label | Line | Expansion | Rate | |
| (′′) | (′′ yr-1) | |||
| PCC Profile Cross-Correlation | ||||
| 1 | [N ii] | 0.142 | 0.0753 | 0.0043 |
| 2 | [N ii] | 0.203 | 0.1075 | 0.0066 |
| 3 | [N ii] | 0.150 | 0.0794 | 0.0067 |
| 4 | [N ii] | 0.116 | 0.0613 | 0.0047 |
| 5 | [N ii] | 0.068 | 0.0361 | 0.0051 |
| 6 | [N ii] | 0.156 | 0.0824 | 0.0079 |
| 7 | [N ii] | 0.161 | 0.0854 | 0.0065 |
| 8 | [N ii] | 0.173 | 0.0914 | 0.0057 |
| 9 | [N ii] | 0.213 | 0.1125 | 0.0061 |
| 10 | [N ii] | 0.133 | 0.0703 | 0.0048 |
| 11 | [N ii] | 0.221 | 0.1166 | 0.0083 |
| 12 | [O iii] | 0.127 | 0.0673 | 0.0026 |
| SF-QM Single Feature Quantified Magnification | ||||
| a | [N ii] | 0.148 | 0.0784 | 0.0044 |
| b | [N ii] | 0.110 | 0.0583 | 0.0036 |
| c | [N ii] | 0.136 | 0.0723 | 0.0061 |
| d | [N ii] | 0.093 | 0.0492 | 0.0038 |
| e | [N ii] | 0.079 | 0.0422 | 0.0059 |
| f | [N ii] | 0.134 | 0.0713 | 0.0072 |
| g | [N ii] | 0.134 | 0.0713 | 0.0056 |
| h | [N ii] | 0.169 | 0.0894 | 0.0057 |
| i | [N ii] | 0.212 | 0.1125 | 0.0061 |
| j | [N ii] | 0.144 | 0.0764 | 0.0053 |
| k | [N ii] | 0.115 | 0.0613 | 0.0044 |
| GS-QM Global Structure Quantified Magnification | ||||
| A | [N ii] | 0.136 | 0.0723 | 0.0045 |
| B | [N ii] | 0.114 | 0.0603 | 0.0052 |
| C | [N ii] | 0.096 | 0.0512 | 0.0059 |
| D | [N ii] | 0.115 | 0.0613 | 0.0068 |
| E | [N ii] | 0.152 | 0.0804 | 0.0052 |
| G | [O iii] | 0.108 | 0.0573 | 0.0021 |
| H | [O iii] | 0.098 | 0.0522 | 0.0021 |
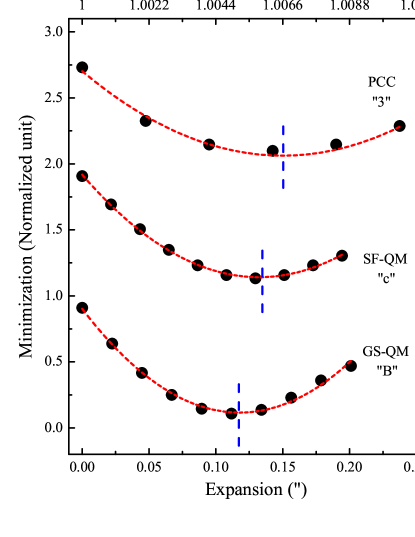
The first method consisted in the cross-correlation of radial profiles extracted along directions chosen to include prominent knots and filaments. We will refer to it as the Profile Cross-Correlation (PCC) method. A set of twelve features were considered, as labeled in Figure 1-left. The radial profiles extracted from the 2015 images were then shifted and its difference with respect to the profiles from the 2017 images computed to derive the shift that minimizes this difference, as illustrated in Figure 2. The expansion rate for the aforementioned features are listed in Table 1, where features 1-11 correspond to the [N ii] image and feature 12 to the [O iii] image.
The second method consisted in the minimization of residuals between images of different epochs. In this method, that will be referred to as the Quantified Magnification (QM) method, the 2015 images are magnified by a factor 1+f and then subtracted from the corresponding 2017 images. The best magnification factor f is derived by computing the statistics in the difference image in boxes around prominent features and minimizing the dispersion (Fig. 2), i.e., looking for the difference image with the smallest noise. This procedure is methodologically similar to that applied by Szyszka et al. (2011) using the IDL routine MPFIT (Markwardt, 2009) to the planetary nebula NGC 6302. Eleven small boxes around the single features (SF-QM method) labeled with lowercase letters in Figure 1-right, and eight large boxes around global structures (GS-QM method) labeled with uppercase letters in the same figure were considered. The magnification factors for these boxes are listed in Table 1, where a-k correspond to single features in [N ii]222 For a fair comparison between the PCC and QM methods, the 11 features selected for the PCC method correspond to the 11 features selected for the SF-QM method., A-F to global structures in [N ii], and G-H to global structures in [O iii].
Table 1 compiles the magnification factors f and expansion rates derived for different features of J210204 using the PCC and QM methods. The averaged magnification factors for the [N ii] ring are 0.00610.0013 for the PCC method, 0.00530.0011 for the SF-QM method, and 0.00570.0009 for the GS-QM method, i.e. they agree within the 1- standard deviation. The comparison between these methods is illustrated in Figure 2 for the particular case of knot 3cB, for which the three methods provides very similar values of the expansion rate. This is the general rule, but features 2b and 11k exhibit very discrepant values of the expansion rates, which seem to be associated with noticeable morphological changes in the features between the two epochs.
The averaged magnification factor is 0.00570.0012 for the ring and 0.00230.0003 for the bow-shock. The small dispersion of the magnification factor of the ring, 20% the value of the magnification factor, implies that the ring expands mostly coherently. It also implies that there are no significant anisotropies. Otherwise, there is a noticeable difference for the expansion rate derived for the ring and the bow-shock. At the tip of the ring, the magnification factor implies an angular expansion rate 01000021 yr-1, while it is 00590008 yr-1 for the bow-shock.
4 Nova Expansion Velocity and Distance
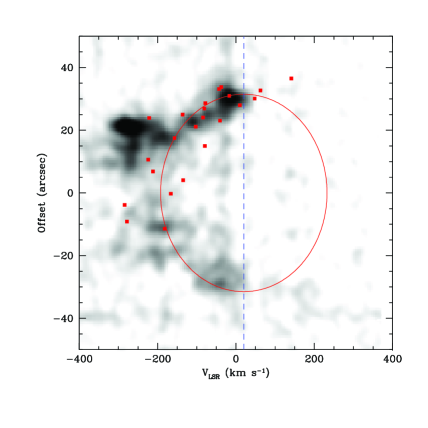
The GTC OSIRIS and OAN-SPM MES data used in this work can be used to build a spatio-kinematics model of the ring of J210204 aiming at deriving an averaged expansion velocity. The MES 65-long slit, placed across the main ring of J210204 along of position angle of –13∘, results in the position-velocity (PV) map shown in Figure 3. The OSIRIS slits A and C presented by Guerrero et al. (2018) contain information on the region of the ring probed by the MES slit, thus the velocity of discrete knots along these OSIRIS slits has been measured, corrected to the local standard of rest (LSR) system, and over-plotted on the MES PV map in Figure 3. We note that the MES data have higher resolution than the OSIRIS data, but the latter have much higher sensitivity.
The kinematics derived from these data confirm the high-velocity of the knots. Compared to the systemic velocity of the nova shell, which is here assumed to be that of the central star, km s-1 (Guerrero et al., 2018), the knots in the ring of J210204 are mostly distributed along an arc with radial systemic velocities up to km s-1. Although the MES PV map reveals features with notably higher expansion velocities, up to km s-1, the general kinematics and morphology of the [N ii] ring are coherent, implying ordered motion patterns. Following other spatio-kinematics models of nova shells, two basic geometrical models can be adopted to describe the observed kinematics and morphology of this structure: a homologous expanding prolate ellipsoid (as in DQ Her, Vaytet et al., 2007) or a flat ring expanding at constant speed (as the equatorial rings of the bipolar nova shells FH Ser and HR Del, Gill & O’Brien, 2000; Harman & O’Brien, 2003). In the former case, a noticeable line tilt at the tip of the major axis would be expected (as in the Ring Nebula, Guerrero, Manchado, & Chu, 1997), thus we have adopted a model consisting of an expanding flat circular ring. Note that an oblate ellipsoid would result in a very similar velocity field and morphology.
The ring inclination angle with respect to the line of sight has been adopted to be 538∘, as derived from the observed ring aspect ratio, assuming it is the elliptical projection onto the sky of a circular ring.
The data points and PV maps in Figure 3 have then been fitted using a least-square minimization method. The expansion velocity is derived to be 28530 km s-1, where the error-bar already accounts for the uncertainty in the system inclination. The expansion velocity of the ring, in conjunction with its angular expansion, result in a distance of 0.600.13 kpc. GAIA DR-2 provides a parallax for the central star of J210204 (source ID #2163877198882886656) of =1.3480.037 milli-arcsec, i.e. a distance of 0.740.03 kpc, which is very similar to the value derived in this work.
5 Long-term Nova Expansion and Age
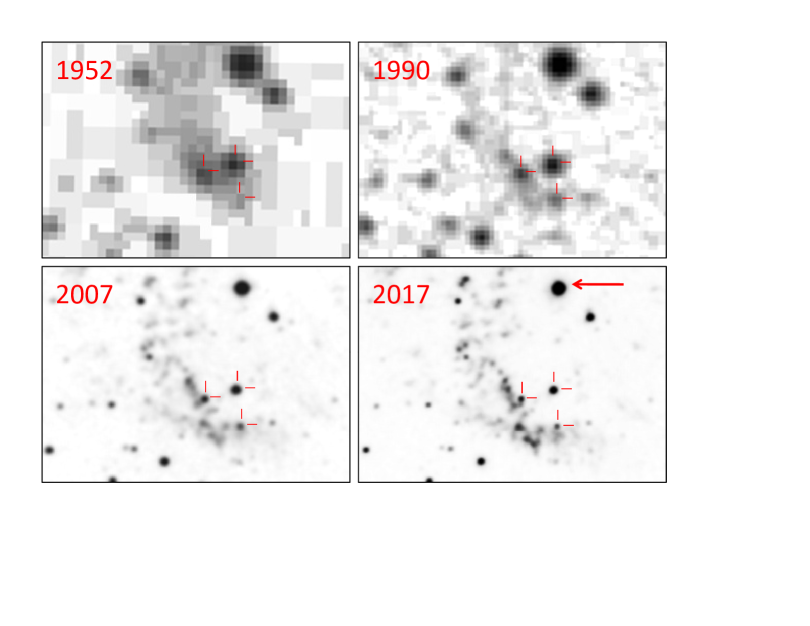
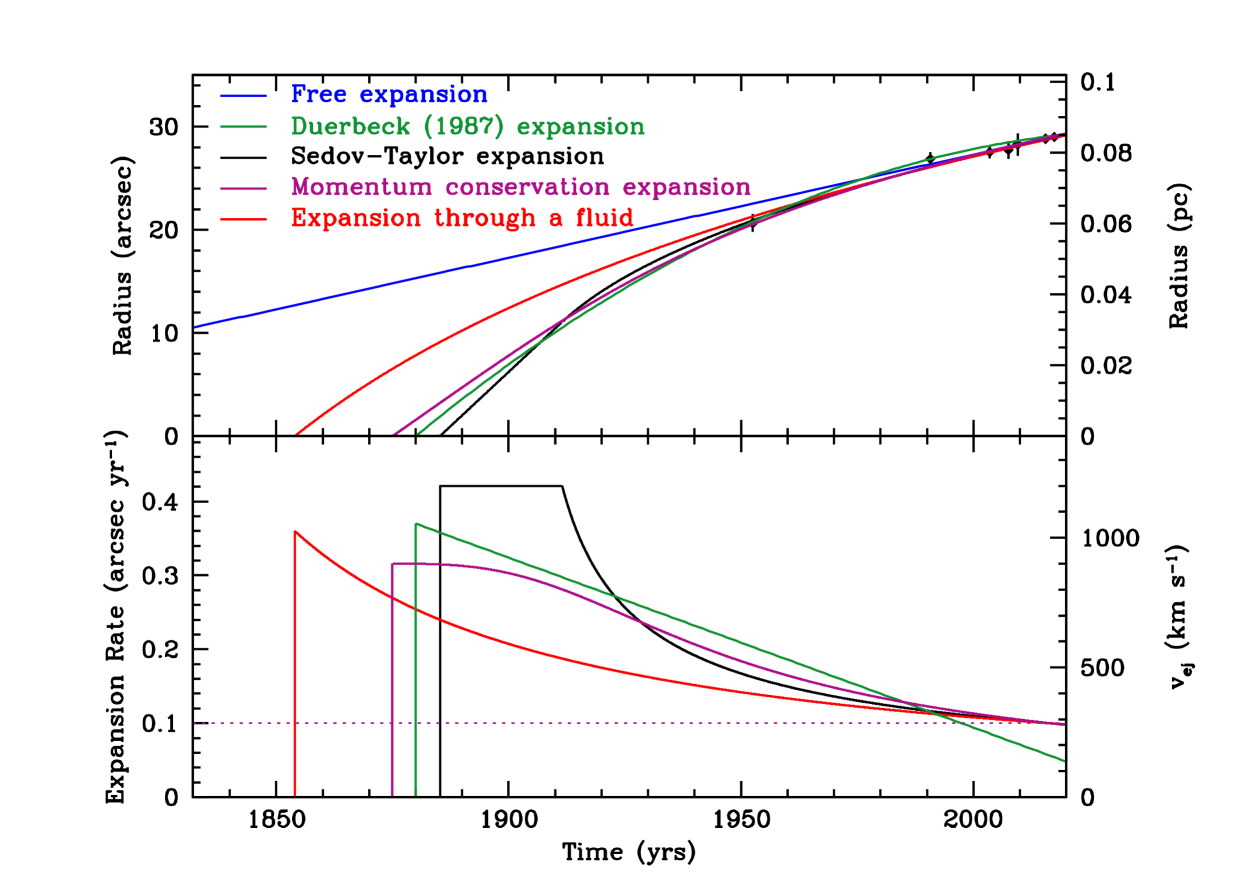
The long-term expansion of J210204 is illustrated for the ring Southernmost tip in Figure 4 using 1952 and 1990 DSS, 2007 INT, and 2017 NOT images. The measurement of the expansion rate, however, is hampered by the different plate scale and spatial resolution of these images. To overcome this problem, radial profiles along selected directions including isolated knots in the ring were extracted and the distances of these knots to the central star were then determined. Adopting for the ring the same geometrical model as in §4, i.e. the ring is a flat expanding circular ring tilted to the line of sight by 53∘, the position angle on the sky of each of these knots and their radial distances can be used to derive the semi-major axis of the ring at each epoch. The time evolution of the semi-major axis at different epochs is plotted in the top-panel of Figure 5.
A free expansion () of J210204 would imply the linear increase of radius with time shown by the blue line in Figure 5-top, for a nova event time circa 1730. The radius of J210204 in 1952, below this prediction, indicates that the expansion of the ejecta is not free, but it has slowed down with time. Furthermore, a free expansion would imply an expansion velocity of 285 km s-1, which is lower than the typical initial expansion velocity of novae. Different expansions laws are investigated next to determine the nova age from the observed angular expansion with time.
Duerbeck (1987) assumed a quadratic law to describe a nova expansion:
| (1) |
The best fit to the data using this expansion law (green in Fig. 5) suggests that the nova event took place circa 1880 with initial expansion velocity 1050 km s-1. Whereas an expansion law with a constant deceleration does not have a physical support, we note that the fit underestimates the current expansion rate of J210204 (lower panel of Fig. 5).
In a supernova there is an initial phase of free expansion followed by a deceleration phase, the Sedov-Taylor phase, which starts when the swept mass is greater than the ejected mass. The expansion is described by the following expressions (Sedov, 1959; Taylor, 1950):
| (2) |
where an initial expansion velocity of 1200 km s-1 has been assumed. Under this assumption, the phase of free expansion lasts 25 yr (black lines in Figure 5), whereas in supernovae this phase may last up to 1000 yr. The nova event is estimated to have happened circa 1885.
In late evolutionary phases of supernovae the ejecta cools down and expands against the ISM due to its own inertia. If we assume J210204 already entered this so-called momentum conservation or snow-plow phase, its initial mass and initial and present expansion velocities and are related to the medium density as:
| (3) |
resulting in the purple line in Figure 5, which implies the nova event took place in 1875 and had an initial expansion velocity of 900 km s-1.
Finally, if J210204 were expanding as discrete bullets moving through the ISM (Williams, 2013), its motion could be described by the drag equation:
| (4) |
The fit of this equation to the data points is shown in red in Figure 5), for a nova event circa 1850.
5.1 Historical search
Adopting either a typical absolute magnitude =–7 mag for a CNe (Warner, 1987) at the distance of 0.60 kpc, or an average brightening of 11 mag (Bode & Evans, 2008) from its present =15.8 mag, J210204 would have been at =1.9–4.8 mag at peak brightness. Such a nova should have been detectable to the naked eye. Although none of the expansion laws considered above produce a perfect match to the variation of radius with time and to the present expansion rate of J210204, a consistent time for the nova event between 1850 and 1890 is achieved by different models accounting for the deceleration of the ejecta.
At that time, most of the brighter novae continued to be found by amateurs, although the use of wide-field photography was introduced and extended in professional observatories in the last two decades of the 19th century. We searched evidence for diffuse emission from the nova shell in the Heidelberg Digitized Astronomical Plates taken at least half a century after the nova event. No detection can be claimed, but it must be noted that most of these images were obtained through blue filters or using blue sensitive plates, which are not suited for the prevalent H and [N ii] (red) emission lines of J210204.
We have examined the most complete list of Galactic novae provided at https://projectpluto.com/galnovae/galnovae.htm, which includes a small sample of objects discovered before 1900. Apparently there is no record of this event. Only eight bright novae were visible to the naked eye in the 19th century (with T CrB and Q Cyg discovered in 1866 and 1876 at 2.0 and 3.0 mag, respectively, among the brightest ones; Warner, 2006), compared to the 30 bright novae visible to the naked eye in the 20th century. Assuming similar nova rate for the 19th and 20th centuries, the figures above imply that 75% of novae visible to the naked eye were missed in the 19th century. It looks like J210204 is one of those novae missed at their time.
6 Discussion
The analysis of the long-term expansion of J210204 presented in the previous section certainly discards its free expansion. On the other hand, all expansion laws accounting for the deceleration of the ejecta imply consistent times for the nova event between 1850 and 1890, and initial expansion velocities in the range 1000–1500 km s-1 typical of novae. Since then, the expansion of the main component of the nova ejecta, the [N ii]-bright arc, has decelerated down to the current expansion speed of 285 km s-1. The situation could be more extreme for the bow-shock, whose larger distance from the central star and lower angular expansion would imply a stronger deceleration. Its chemical composition, mostly consistent with that of the ISM (Guerrero et al., 2018), indeed suggests it has swept up a significant volume of the surrounding medium.
The expansion and deceleration of nova shells has received little attention in the past. It is a difficult task that requires the availability of high-quality multi-epoch images with a suitably long time baseline. For instance, Shara et al. (2012a) could only determine an upper limit of 017 yr-1 for the expansion of the Z Cam shell using images obtained in 2007 and 2010, i.e. a time baseline of 3 yrs. Duerbeck (1987) compared photographic plates obtained around 1950 with more recent (mid 80’s) CCD images of four novae (DQ Her, GK Per, V476 Cyg, and V603 Aql) to conclude that they decelerate with a mean half-times of 75 yrs, i.e. the expansion velocity of a nova drops to half its value every 75 yrs. Further evidence for shell deceleration is presented by Downes & Duerbeck (2000). This expansion behavior is consistent with Oort (1946) theoretical estimate based on a simple model of the nova shell interaction with the surrounding ISM.
These results, however, have been disputed for the nova shells GK Per and DQ Her. GK Per nova shell has multiple knots expanding at an angular velocity 03-05 yr-1 that has remained unchanged since their ejection about a century ago (Anupama & Kantharia, 2005; Liimets et al., 2012). The interaction of these knots with the wind emanating from GK Per has been claimed responsible for their kinematic behaviour (Shara et al., 2012b). This is also the case for DQ Her nova shell, where the presence of ablated flows associated with clumps, with notable tails extending outwards with increasing radial velocities, most likely implies the action of a stellar wind that speeds up the material in the nova shell (Vaytet et al., 2007). More and higher quality images of nova shells spanning over long time baselines are most required to investigate the interaction of nova shells with their ambient medium.
Otherwise, many high quality studies of the kinematics of nova shells disclose overall expansion patterns, 3-D structures, and dynamical interactions as well as undeniable bipolar structures (e.g. della Valle et al., 1997; Gill & O’Brien, 2000; Harman & O’Brien, 2003; Vaytet et al., 2007; Moraes & Diaz, 2009; Woudt et al., 2009; Shara et al., 2012b, 2017).
It is not clear, however, what are the key mechanisms behind the ejection of bipolar structures in nova shells (for example, the shaping is attributed to the binary companion or to rotation of the WD envelope; Lloyd et al., 1997; Porter et al., 1998), but it is accepted that it produces an interaction of the fast ejecta with slow-moving or stationary material (see, e.g., Chomiuk et al., 2014). Although there are not many detailed numerical works in the literature addressing these interactions, the consequences of the bipolar ejections on the observational properties of nova shells have been discussed thoroughly (Shore, 2013). This interaction piles up material along the equatorial plane, creating dense ring-like structures around the binary system (Chochol et al., 1997). Along with these lines, the morphology of the bright [N ii] arc of J210204 (or AT Cnc) can be matched by the simple models of nova shells presented by Gill & O’Brien (1999) for cases of bright rings close to the equatorial plane and faint polar caps.
Our combined analysis of the angular expansion and radial velocity of the [N ii]-bright arc of J210204 indicate that the overall expansion of the different knots is not completely coherent, as shown by their varying magnification factors and by the complex kinematics. Nonetheless, these variations are not as large as suggested by the intricate morphology of this [N ii]-bright arc. The angular expansion and kinematics of the nova ejecta provide a value for the distance to J210204 which is consistent with that derived from GAIA DR-2, although not exactly the same. The difference may be due to dynamical effects.
We suggest that, similarly to other astrophysical systems, the interaction of the current stellar wind of the central star of J210204 with the ring structure causes hydrodynamical instabilities, most likely of Rayleigh-Taylor nature. This could break the ring-structure into clumps that would further develop cometary tails (see Fang et al., 2014; Harvey et al., 2016). Detailed hydro-dynamical modeling to interpret the morphological evolution of the knots and to investigate the dynamical evolution of the nova ejecta will be presented in a future paper (Toalá et al. in prep.).
To summarize, J210204 is a CN shell resulting from a nova event that took place about 130-170 yrs ago, although it was unnoticed at that time. The nova has experienced a notable deceleration, most likely due to its occurrence inside a high density medium as suggested by the complex H emission around it (Guerrero et al., 2018). As many other “young” novae, the CV at its center is in a nova-like (NL) stage (Guerrero et al., 2018) with the WD still experiencing accretion at a high rate (Collazzi et al., 2009).
Acknowledgments
E.S. acknowledges support from Universidad de Guadalajara and CONACyT. M.A.G. acknowledges support of the grant AYA2014- 57280-P, cofunded with FEDER funds. G.R.-L. acknowledges support from Fundación Marcos Moshinsky, CONACyT, and PRODEP (Mexico). L.S. acknowledges support from PAPIIT grant IA-101316 (Mexico). J.A.T. and M.A.G. are funded by UNAM DGAPA PAPIIT project IA100318. We thank Martin Henze for his advise on historical records of novae and photographic plates.
This article is based upon observations obtained with ALFOSC, which is provided by the Instituto de Astrofísica de Andalucía (IAA) under a joint agreement with the University of Copenhagen and NOTSA, and with OSIRIS at the Gran Telescopio Canarias (GTC), both installed in the Spanish Observatorio del Roque de los Muchachos of the Instituto de Astrofísica de Canarias, in the island of La Palma, Spain. Observations carried out at the Observatorio Astronómico Nacional on the Sierra San Pedro Mártir (OAN-SPM), Baja California, México, were also used.
This paper also makes use of data obtained as part of the INT Photometric H Survey of the Northern Galactic Plane (IPHAS: http://www.iphas.org) carried out at the Isaac Newton Telescope (INT). The INT is operated on the island of La Palma by the Isaac Newton Group in the Spanish Observatorio del Roque de los Muchachos of the Instituto de Astrofísica de Canarias. All IPHAS data are processed by the Cambridge Astronomical Survey Unit at the Institute of Astronomy in Cambridge. The band-merged DR2 catalog was assembled at the Centre for Astrophysics Research, University of Hertfordshire, supported by STFC grant ST/J001333/1. The Digitized Sky Surveys were produced at the Space Telescope Science Institute (STScI) under US Government grant NAGW-2166. The images of these surveys are based on photographic data obtained using the Oschin Schmidt Telescope on Palomar Mountain and the UK Schmidt Telescope. The plates were processed into the present compressed digital form with the permission of these institutions. The National Geographic Society - Palomar Observatory Sky Atlas (POSS-I) was made by the California Institute of Technology with grants from the National Geographic Society. The second Palomar Observatory Sky Atlas (POSS-II) was made by the California Institute of Technology with funds from the National Science Foundation, the National Geographic Society, the Sloan Foundation, the Samuel Oschin Foundation and the Eastman Kodak Corporation. The Oschin Schmidt Telescope is operated by the California Institute of Technology and Palomar Observatory. The UK Schmidt Telescope was operated by the Royal Observatory, Edinburgh, with funding from the UK Science and Engineering Research Council (later the UK Particle Physics and Astronomy Research Council), until 1988 June, and thereafter by the Anglo-Australian Observatory. Supplemental funding for sky-survey work at the STScI is provided by the European Southern Observatory. This work made use of the HDAP which was produced at Landessternwarte Heidelberg-Königstuhl under grant No. 00.071.2005 of the Klaus-Tschira-Foundation.
References
- Anupama & Kantharia (2005) Anupama, G. C., & Kantharia, N. G. 2005, A&A, 435, 167
- Bode & Evans (2008) Bode, M. F., & Evans, A. 2008, Classical Novae, 2nd Edition. Edited by M.F. Bode and A. Evans. Cambridge Astrophysics Series, No. 43, Cambridge: Cambridge University Press, 2008, 43
- Chesneau et al. (2012) Chesneau, O., Lagadec, E., Otulakowska-Hypka, M., et al. 2012, A&A, 545, A63
- Chochol et al. (1997) Chochol, D., Grygar, J., Pribulla, T., et al. 1997, A&A, 318, 908
- Chomiuk et al. (2014) Chomiuk, L., Linford, J. D., Yang, J., et al. 2014, Nature, 514, 339
- Collazzi et al. (2009) Collazzi, A. C., Schaefer, B. E., Xiao, L., et al. 2009, AJ, 138, 1846
- della Valle et al. (1997) della Valle, M., Gilmozzi, R., Bianchini, A., & Esenoglu, H. 1997, A&A, 325, 1151
- Downes & Duerbeck (2000) Downes R. A., Duerbeck H. W., 2000, AJ, 120, 2007
- Drew et al. (2005) Drew J. E., et al., 2005, MNRAS, 362, 753
- Duerbeck (1987) Duerbeck, H. W. 1987, Ap&SS, 131, 461
- Evans et al. (1992) Evans, A., Bode, M. F., Duerbeck, H. W., & Seitter, W. C. 1992, MNRAS, 258, 7P
- Fang et al. (2014) Fang, X., Guerrero, M. A., Marquez-Lugo, R. A., et al. 2014, ApJ, 797, 100
- Gill & O’Brien (1999) Gill, C. D., & O’Brien, T. J. 1998, MNRAS, 300, 221
- Gill & O’Brien (1999) Gill, C. D., & O’Brien, T. J. 1999, MNRAS, 307, 677
- Gill & O’Brien (2000) Gill, C. D., & O’Brien, T. J. 2000, MNRAS, 314, 175
- Guerrero, Manchado, & Chu (1997) Guerrero M. A., Manchado A., Chu Y.-H., 1997, ApJ, 487, 328
- Guerrero et al. (2018) Guerrero, M.A., Sabin, L., Tovmassian, G., et al. 2018, ApJ, 857, 80
- Harman & O’Brien (2003) Harman, D. J., & O’Brien, T. J. 2003, MNRAS, 344, 1219
- Harvey et al. (2016) Harvey, E., Redman, M. P., Boumis, P., & Akras, S. 2016, A&A, 595, A64
- Liimets et al. (2012) Liimets, T., Corradi, R. L. M., Santander-García, M., et al. 2012, ApJ, 761, 34
- Lloyd et al. (1997) Lloyd, H. M., O’Brien, T. J., & Bode, M. F. 1997, MNRAS, 284, 137
- Markwardt (2009) Markwardt, C. B. 2009, Astronomical Data Analysis Software and Systems XVIII, 411, 251
- Moraes & Diaz (2009) Moraes, M., & Diaz, M. 2009, AJ, 138, 1541
- Oort (1946) Oort, J. H. 1946, MNRAS, 106, 159
- Porter et al. (1998) Porter, J. M., O’Brien, T. J., & Bode, M. F. 1998, MNRAS, 296, 943
- Ribeiro et al. (2011) Ribeiro V. A. R. M., Darnley M. J., Bode M. F., Munari U., Harman D. J., Steele I. A., Meaburn J., 2011, MNRAS, 412, 1701
- Sahman et al. (2015) Sahman, D.I., Dhillon, V.S., Knigge, C., & Marsh, T. R. 2015, MNRAS, 451, 2863
- Sedov (1959) Sedov, L.I. 1959, Similarity and Dimensional Methods in Mechanics, New York: Academic Press
- Shara et al. (2012c) Shara M. M., Mizusawa T., Wehinger P., Zurek D., Martin C. D., Neill J. D., Forster K., Seibert M., 2012c, ApJ, 758, 121
- Shara et al. (2012a) Shara, M.M., Mizusawa, T., Zurek, D., et al. 2012a, ApJ, 756, 107
- Shara et al. (2012b) Shara, M.M., Zurek, D., De Marco, O., et al. 2012b, AJ, 143, 143
- Shara et al. (2017) Shara, M.M., Drissen, L., Martin, T., Alarie, A., & Stephenson, F.R. 2017, MNRAS, 465, 739
- Shore (2013) Shore, S. N. 2013, A&A, 559, L7
- Slavin, O’Brien, & Dunlop (1995) Slavin A. J., O’Brien T. J., Dunlop J. S., 1995, MNRAS, 276, 353
- Szyszka et al. (2011) Szyszka, C., Zijlstra, A.A., & Walsh, J.R. 2011, MNRAS, 416, 715
- Taylor (1950) Taylor, G. 1950, Proceedings of the Royal Society of London Series A, 201, 175
- Vaytet et al. (2007) Vaytet, N. M. H., O’Brien, T. J., & Rushton, A. P. 2007, MNRAS, 380, 175
- Warner (1987) Warner, B. 1987, MNRAS, 227, 23
- Warner (2006) Warner, B. 2006, Astronomy and Geophysics, 47, 1.29
- Williams (2013) Williams, R. 2013, AJ, 146, 55
- Woudt et al. (2009) Woudt, P. A., Steeghs, D., Karovska, M., et al. 2009, ApJ, 706, 738