A catalogue of nuclear stellar velocity dispersions of nearby galaxies from H STIS spectra to constrain supermassive black hole masses
Abstract
We present new measurements for the nuclear stellar velocity dispersion within sub-arcsecond apertures for 28 nearby galaxies. Our data consist of Space Telescope Imaging Spectrograph (STIS) long-slit spectra obtained with the G750M grating centred on the H spectral range. We fit the spectra using a library of single stellar population models and Gaussian emission lines, while constraining in most cases the stellar-population content from an initial fit to G430L STIS spectra. We illustrate how these measurements can be useful for constraining the mass of supermassive black holes (SBHs) by concentrating on the cases of the lenticular galaxies NGC 4435 and NGC 4459. These are characterized by similar ground-based half-light radii stellar velocity dispersion values but remarkably different as obtained from modelling their central ionised-gas kinematics, where NGC 4435 appears to host a significantly undermassive SBH compared to what is expected from the relation. For both galaxies, we build Jeans axisymmetric dynamical models to match the ground-based stellar kinematics obtained with SAURON integral-field spectrograph, including a SBH with value as predicted by the relation and using high-resolution HST images taken with the Advanced Camera for Surveys to construct the stellar-mass model. By mimicking the HST observing conditions we use such reference models to make a prediction for the nuclear value. Whereas this was found to agree with our nuclear measurement for NGC 4459, for NGC 4435 the observed is remarkably smaller than the predicted one, which further suggests that this galaxy could host an undermassive SBH.
keywords:
black hole physics – galaxies: fundamental parameters – galaxies: kinematics and dynamics – galaxies: photometry1 Introduction
Nowadays, there is a large body of evidence supporting the idea that a supermassive black hole (SBH), with a mass ranging from to , lies in the centre of most of galaxies. Over the last two decades, the SBH mass was found to correlate with several properties of their host galaxy and, in particular, of its spheroidal component, which corresponds to the entire galaxy in the case of ellipticals or to the bulge for lenticulars and spirals. These correlations suggest that the SBHs and their host spheroids grew together, and since the slope and scatter of such correlations are thought to relate to the details of the SBH-galaxy coevolution there is constant demand for collecting measurements across a large number of galaxies encompassing a wide range of host-galaxy masses and morphologies (see Kormendy & Ho, 2013, for a review).
The relationship between and the stellar velocity dispersion of the spheroidal component is currently the tightest correlation discovered so far (Beifiori et al., 2012; Kormendy & Ho, 2013; van den Bosch, 2016), although there are open issues about its slope (Saglia et al., 2016), whether the SBHs in barred and ordinary galaxies and/or classical and pseudobulges follow the same correlation (Graham, 2016), and the role of the over and undermassive SBHs with respect to those tracing the correlation (Savorgnan & Graham 2015, Krajnović et al. 2018). In fact, there is still the need of increasing the statistics of in some specific physical ranges. Indeed van den Bosch et al. (2015) and Shankar et al. (2016) showed that the available estimates and their scaling relations suffer from a remarkable bias since less dense galaxies are under represented in the SBH demography. The variety of tracers, dynamical models, and algorithms adopted to recover the mass distribution in the centre of galaxies and constrain is a further complication when building an unbiased sample. One significant contribution in this direction was given by the stringent limits obtained for more than one hundred galaxies by Sarzi et al. (2002), Beifiori et al. (2009) and Pagotto et al. (2017), using nuclear line-width measurement for the nebular emission observed at sub-arcsecond resolution with the Hubble Space Telescope (HST).
Outlier galaxies with far from the predictions of scaling relations represent an interesting challenge for understanding the coevolution of galaxies and SBHs. High outliers include NGC 4468b (Kormendy et al., 1997) and NGC 1277 (van den Bosch et al., 2012), which are characterized by a steep inward gradient with central values not consistent with the Faber-Jackson relation, NGC 4342 (Cretton & van den Bosch, 1999), which is the strongest outlier in the correlation, NGC 1271 (Walsh et al., 2015) and MRK 1216 (Walsh et al., 2017), which have too large with respect to their -band luminosity. The finding of low outliers, or even ruling out the presence of a SBH is a more challenging task given to the detection threshold imposed by the angular resolution of present telescopes. Yet, remarkable low outlier examples do exist, such as the radio-loud elliptical NGC 4335 (Verdoes Kleijn et al., 2002) and the barred lenticular NGC 4435 (Coccato et al., 2006), where was constrained from the central ionised-gas kinematics observed with HST, or the lenticular NGC 4474 and elliptical NGC 4551, where stringent limits were derived from stellar dynamical models and ground-based integral-field observations assisted by adaptive optics (Krajnović et al., 2018). The merging galaxies NGC 1316 (Nowak et al., 2008) and NGC 4382 (Gültekin et al., 2011) have also quite small for their galaxy luminosities but in these cases it is not clear if this could be linked to the merger physics and to limitations in search techniques. From a theoretical perspective, models of SBH evolution (e.g., Volonteri et al., 2011) predict that about 20 per cent of galaxies with masses between and should be characterized by values critically below those predicted from present scaling relations. This is explained with an ineffective growth of the SBHs, which also could be ejected or not formed at all from the very beginning. Therefore, assessing the fraction of undermassive black holes in nearby galaxies is crucial to understand how the SBHs increased their mass and settled in galactic nuclei.
In this context, this paper provides a catalogue of new measurements of nuclear that can be useful for the purpose of constraining . The paper is organized as follows. We describe the sample selection in Section 2. We measure the nuclear of the sample galaxies from Space Telescope Imaging Spectrograph (STIS) spectra in Section 3. We study in more detail NGC 4435 and NGC 4459 in Section 4 to illustrate how combining Advanced Camera for Surveys (ACS) photometry along with Spectrographic Areal Unit for Research on Optical Nebulae (SAURON) integral-field spectroscopy can constrain . Finally, we present our conclusions in Section 5. We adopt km s-1 Mpc-1, , and as cosmological parameters all through the paper.
G430L G750M Galaxy Morph. Sp. Cl. Prop. Id. PA Exp. Time SP. Range Bin. Apert. Prop. Id. PA Exp. Time SP. Range Bin. Apert. ,fix ,free [Mpc] [∘] [h] [Å] [″] [pc] [∘] [h] [Å] [″] [pc] [ km s-1] [ km s-1] (1) (2) (3) (4) (5) (6) (7) (8) (9) (10) (11) (12) (13) (14) (15) (16) (17) (18) IC0342 SABcd(rs) H 4.3 - - - - - - - 8591 13.9 0.80 – - NGC 2685 (R)SB0+pec S2/T2: 14.3 8607 54.4 0.72 – 8607 54.4 0.86 – NGC 3245 SA00(r):? T2: 23.2 - - - - - - - 7403 2.4 0.75 – - NGC 3368 SABab(rs) L2 17.8 7361 69.5 0.44 – 7361 69.5 0.75 – NGC 3379 E1 L2/T2:: 18.0 - - - - - - - 8589 75.3 1.78 – - NGC 3489 SAB0+(rs) T2/S2 14.6 7361 59.1 0.46 – 7361 59.1 0.71 – NGC 3627 SABb(s) T2/S2 15.4 8607 80.1 0.65 – 8607 80.1 0.79 – - NGC 3675 SAb(s) T2 14.4 8607 25.9 0.69 – 8607 25.9 0.83 – NGC 3992 SBbc(rs) T2: 17.5 7361 155.3 0.50 – 7361 155.3 0.82 – NGC 4030 SAbc(s) H* 26.1 9783 90.7 0.61 – 8228 42.1 0.24 – NGC 4245 SB0/a(r): H 16.7 7361 85.7 0.46 – 7361 85.7 0.75 – NGC 4314 SBa(rs) L2 17.8 7361 105.3 0.46 – 7361 105.3 0.75 – NGC 4321 SABbc(s) T2 27.1 7361 92.9 0.46 – 7361 92.9 0.74 – NGC 4414 SAc(rs)? T2: 14.2 8607 125.1 0.67 – 8607 125.1 0.81 – NGC 4429 SA0+(r) T2 20.5 8607 81.1 0.65 – 8607 81.1 0.79 – NGC 4435 SB00(s) T2/H: 16.0 7361 89.6 0.46 – 7361 89.6 0.74 – NGC 4459 SA0+(r) T2: 21.7 7361 92.9 0.46 – 7361 92.9 0.74 – NGC 4477 SB0(s):? S2 23.8 7361 92.8 0.46 – 7361 92.8 0.73 – NGC 4501 SAb(rs) S2 37.2 7361 91.9 0.46 – 7361 91.9 0.74 – NGC 4548 SBb(rs) L2 11.5 7361 73.2 0.46 – 7361 73.2 0.74 – NGC 4596 SB0+(r) L2:: 31.7 7361 70.3 0.46 – 7361 70.3 0.75 – NGC 4698 SAab(s) S2 19.1 7361 79.0 0.46 – 7361 79.0 0.74 – NGC 4736 (R)SAab(r) L2 7.6 - - - - - - - 8591 50.1 1.09 – - NGC 4800 SAb(rs) H 15.5 7361 177.5 0.48 – 7361 177.5 0.80 – NGC 4826 (R)SAab(rs) T2 10.0 8607 88.1 0.65 – 8607 88.1 0.80 – NGC 5055 SAbc(rs) T2 9.8 7361 164.5 0.47 – 7361 164.5 0.79 – NGC 7252 (R)SA00: H* 64.1 7435 38.1 4.25 – 8669 126.1 0.19 – NGC 7331 SAb(s) T2 7.0 8607 178.9 0.67 – 8607 178.9 0.81 –
Notes. Col.(1): galaxy name. Col.(2): morphological type from de Vaucouleurs et al. (1991, RC3). Col.(3): nuclear spectral class (Ho et al., 1997), where S = Seyfert, L = LINER, H = H ii nucleus, T = transition object (LINER/H ii), and 2 = type 2. Classifications evaluated as uncertain or highly uncertain are marked with a single or double colon, respectively. Classifications marked with * are from NASA/IPAC Extragalactic Database (NED). Col.(4): distance from NED. The distances are obtained as , where is the weighted mean recessional velocity corrected to the reference frame of the microwave background radiation and . For IC 0342 we assume the distance reported in Beifiori et al. (2009) and rescaled for since is not provided by NED. Col(5): HST proposal number for the G430L spectra. Col.(6): position angle of the slit for the G430L spectra. Col.(7): total exposure time for the G430L spectra. Col.(8): spectral range for the G430L spectra. Col.(9): pixel binning for the G430L spectra. Col.(10): size of the nuclear aperture within which the fit was performed for the G430L spectra. Col.(11): physical size of the nuclear aperture within which the fit was performed for the G430L spectra. Col.(12): HST proposal number for the G750M spectra. Col.(13): position angle of the slit for the G750M spectra. Col.(14): total exposure time for the G750M spectra. Col.(15): spectral range for the G750M spectra. Col.(16): pixel binning for the G750M spectra. Col.(17): size of the nuclear aperture within which the fit was performed for the G750M spectra. Col.(18): physical size of the nuclear aperture within which the fit was performed for the G750M spectra. Col.(19): nuclear obtained using the G430L optimal template when fitting the G750M spectra. Col.(20): nuclear obtained without using the G430L optimal template when fitting the G750M spectra.
2 Sample selection
In order to measure the nuclear in nearby galaxies, we looked in the Hubble Data Archive for all the STIS medium-resolution spectra that were obtained with the slit crossing the nucleus.
We first considered the archival spectra of galaxies obtained with the G430M grating, except for those already obtained by Krajnović & Jaffe (2004) who already measured the stellar velocity and velocity dispersion along the major axis of four early-type galaxies. Unfortunately, almost all the other spectra were heavily contaminated by strong and broad [O iii] emission lines due to the presence of an AGN which prevented us to successfully measure the stellar kinematics. We then looked for archival spectra obtained with the G750M grating, excluding also in this case the observations of Batcheldor et al. (2013) who already provided stellar kinematics measurements for 36 galaxies in the wavelength range centred on the Ca ii absorption triplet at about 8500 Å. This initial pruning left us with the same sample of 177 galaxies compiled by Beifiori et al. (2009) for which the G750M grating was centred on the H line, to which we added 9 more galaxies observed with STIS in the same wavelength range after 2009. Among these 186 objects we then excluded those with STIS spectra displaying a strong AGN emission and adopted a threshold for the signal-to-noise ratio in the stellar continuum at per resolution element to perform reliable measurements.
This selection led to a final sample composed by 28 nearby galaxies ( Mpc), covering a wide range of morphological types (from E to Scd) and nuclear activities (Seyfert 2, LINERs, H ii nuclei), which are listed in Table 1. Almost all of them were observed with the 02-wide slit and this yielded nearly the same spectral resolution of the template spectra we used to measure the stellar kinematics (see Section 3.2 for details). We considered only two galaxies (IC 0342 and NGC 4736) observed with the 01-wide slit, owing to the superb of the data. All other archival G750M spectra obtained with the 01-wide slit have too low .
Finally, to help with our stellar kinematics extraction based on the G750M spectra we also looked in the Hubble Data Archive for similarly centred low-resolution G430L spectra for all our sample galaxies, since these spectra can provide useful constraints on the nuclear stellar population composition (see, e.g. Sarzi et al., 2005 and Section 3.2). G430L spectra were found for 24 objects.
3 Nuclear stellar velocity dispersion
3.1 Long-slit spectroscopy
We retrieved from the Hubble Data Archive the STIS spectra of the sample galaxies obtained with the G430L and G750M gratings through either the 01 52″ or the 02 52″ slit positioned on the galaxy nucleus. The detector was a SITe CCD with pixel of m2. The G430L spectra covered the wavelength range between about – Å, whereas the G750M spectra were characterized by a wavelength range of either – Å or – Å, depending on the tilt angle of the grating. For the G750M spectra, the reciprocal dispersion was 0.554 and 1.108 Å for the 1-pixel and 2-pixel binning read-out mode along the dispersion direction, respectively. For an extended source, this setup yielded for the 01-wide slit an instrumental FWHM of 5.5 and 1.1 Å with the G430L and G750M grating, respectively and it yielded for the 02-wide slit 10.9 and 2.2 Å with the G430L and G750M grating, respectively (Riley et al., 2017). The spatial scale was 00507 and 0101 pixel-1 for the 1-pixel and 2-pixel binning read-out mode along the spatial direction, respectively. The proposal number, slit width and position angle, pixel binning, wavelength range, and total exposure times of the STIS spectra of the sample galaxies are reported in Table 1.
We reduced the spectra as done in Beifiori et al. (2009) and Pagotto et al. (2017). We used both IRAF111Image Reduction and Analysis Facility is distributed by the National Optical Astronomy Observatory (NOAO), which is operated by the AURA, Inc., under cooperative agreement with the National Science Foundation. tasks and STIS reduction pipeline (Dressel et al., 2007), which we combined in a customized IRAF procedure running the lacos_spec task (van Dokkum, 2001) to remove the cosmic rays events or hot pixels. The reduction steps included the subtraction of the overscan, bias and dark contributions, correction for internal flat-field, trimming of the spectra, removal of bad pixels and cosmic rays, wavelength and flux calibration, correction for geometrical distortion, alignment and combination of the spectra obtained for the same galaxy with the same setup. Finally, we averaged the innermost spectral rows of each resulting spectrum for the purpose of analysing a nearly squared aperture as prescribed by Beifiori et al. (2009).

3.2 Stellar kinematics
We measured the nuclear with the Penalized Pixel Fitting (pPXF, Cappellari & Emsellem, 2004) and the Gas and Absorption Line Fitting (GANDALF, Sarzi et al., 2006) IDL222Interactive Data Language is distributed by Harris Geospatial Solutions. algorithms. In both instances, to model the stellar continuum we used the library of synthetic spectral energy distributions (SEDs) for single-age, single-metallicity stellar populations provided by Vazdekis et al. (2010), which is based on the Medium Resolution Isaac Newton Telescope Library of Empirical Spectra (MILES, Sánchez-Blázquez et al., 2006) and covers the full optical spectral range of both our G430L and G750M STIS spectra at moderately high resolution (FWHM Å, Falcón-Barroso et al., 2011).
The fitting procedure consists of the following steps. We first rebinned each galaxy spectrum and MILES SED template along the dispersion direction to a common logarithmic scale. For each galaxy, we then run a preliminary fit to its STIS G750M spectrum using pPXF while masking the emission lines and considering a Gaussian LOSVD in order to obtain a starting guess on both velocity and . We then run a series of GANDALF fits to the nuclear spectrum while optimising the values for the velocity and that GANDALF takes as input using a downhill simplex method (AMOEBA, Nelder & Mead, 1965). This optimisation yields a final GANDALF fit and best velocity and values, as well an initial estimate for the errors on these parameters. These error estimates are then refined by means of a grid of GANDALF models based on velocity and values around the previously found best-fitting results. When necessary we also included a broad-line emission component in our GANDALF fits.
It should be noticed that the spectral resolution of the MILES SEDs is somewhat poorer than that of the G750M ones. The MILES resolution, near the H line corresponds to an instrumental velocity dispersion of about 49 km s-1 whereas for the G750M spectra and 43 km s-1 for the 01 and 02-wide slit, respectively. During our pPXF and GANDALF fits we decided against degrading the resolution of our G750M spectra, since this would artificially smooth our spectra and lead to less reliable error estimates. Instead, we corrected the measured to account for the mismatch between the instrumental resolution of our G750M data and the MILES templates, by summing such a difference in quadrature to our best-fitting values. Such a correction is quite significant for 01-wide slit spectra (ranging from 16 to 8 km s-1 for original estimates of 50 and 100 km s-1, respectively) whereas it remains quite small for the 02-wide slit ones (ranging from 5 to less than 3 km s-1 in the same range).
For the 24 sample galaxies with a G430L spectrum, we further re-fit the G750M spectrum drawing from the results of a previous fit to the G430L spectra in order to better constrain the stellar-population content of the nuclear regions. More specifically, we performed a GANDALF fit to determine the weights of the best-fitting linear combination of MILES SEDs when modelling the G430L spectra and use these to construct an optimal stellar-population template that, in turn, can be used in our GANDALF fit to the G750M spectra. As in the case of the G430L the spectral resolution is significantly worse than that of the MILES SEDs (which is also the reason why the G430L cannot be used to measure in first place), we proceeded to degrade the resolution of the latter templates to match that of G430L spectra before the fit, as it is common practice in these cases.
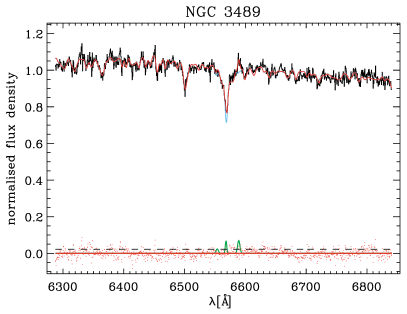
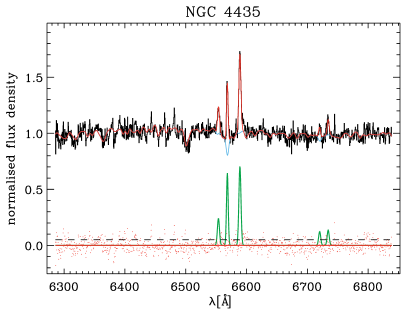
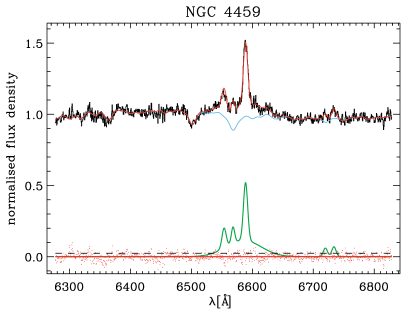
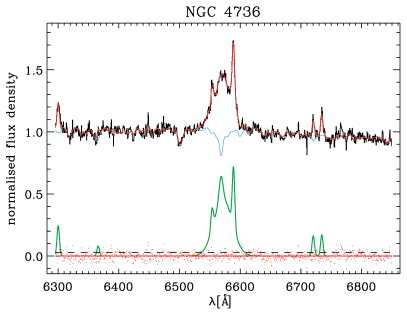
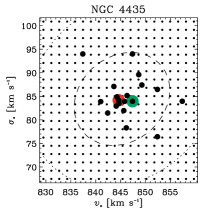
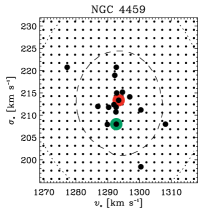
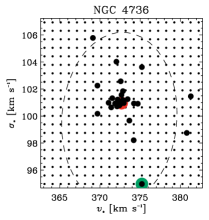
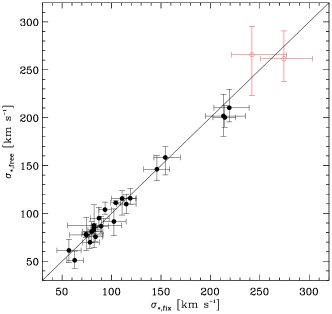
Fig. 1 and 2 illustrate for four sample objects both the quality of our GANDALF fit to the G750M spectra as well as the working of our error estimation. For NGC 4736 the GANDALF fit employs the whole library of MILES SEDs, whereas all other examples correspond to fit based on the previously-derived G430L optimal template. In this respect, Fig. 3 shows the comparison between the values ,fix of the nuclear velocity dispersion obtained from the G750M spectra adopting the G430L optimal templates and values ,free measured from G750M spectra using the entire MILES SED library, for all but one of the 24 objects with both G430L and G750M spectra (for NGC 3627 only the fit adopting the optimal template was successful). In addition to these, in Fig. 3 we also add NGC 3245 and NGC 3379 for which we adopted as G430L optimal template the built by averaging those from the fit to NGC 4429, NGC 4459, and NGC 4596. This is appropriate since there are good indications that both NGC 3245 and NGC 3379 host central old stellar population (Kuntschner et al., 2010; McDermid et al., 2015) as indicated by the stellar-population mix returned in the case of the G430L fits to NGC 4429, NGC 4459, and NGC 4596. We found km s-1 for NGC 3245 and km s-1 for NGC 3379. Fig. 3 shows that the values of ,fix and ,free are consistent each other within errors in almost all cases (see also Table 1), which gives us confidence in the ,free obtained for those objects (IC 0342, NGC 3245, NGC 3379, and NGC 4736) for which G430L spectra are not available.
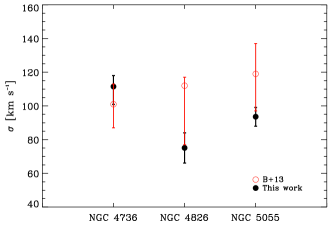
Batcheldor et al. (2013) already measured the nuclear of NGC 4736, NGC 4826, and NGC 5055 from G750M spectra and 01-wide slit in the wavelength range centred on the Ca ii absorption triplet at about 8500 Å. This allowed us to make a comparison between obtained on sub-arcsecond apertures from G750M spectra in different wavelength ranges and with a different fitting technique. To this aim, we re-extracted the nuclear spectra of these galaxies in apertures matching as much as possible that of Batcheldor et al. (2013, 01005) and repeated the fit. For NGC 4736, we were able to match the aperture and found km s-1. For NGC 4826 and NGC 5055, we could analyse only a wider aperture since our G750M spectra were taken with the 02-wide slit. From the spectra extracted from the smallest possible aperture (0201 for NGC 4826 and 02005 for NGC 5055), we measured km s-1 for NGC 4826 and a km s-1 for NGC 5055. Our measurements are in agreement with those by Batcheldor et al. (2013) within the 1 error bars (Fig. 4).
4 Stellar dynamical models for NGC 4435 and NGC 4459
In this section we focused on the particular cases of NGC 4435 and NGC 4459 since these have very similar ground-based but quite different STIS measurements of , which in turn may be indicative of a significantly different at a given, similar bulge mass.
Indeed, whereas the values for (the stellar velocity dispersion measured within a circular aperture corresponding to the galaxy effective radius ) obtained by Cappellari et al. (2013) using SAURON integral-field spectroscopy are fairly similar for these two galaxies (amounting to = and km s-1 for NGC 4435 and NGC 4459, respectively), our STIS measurements return a much smaller ,fix value for NGC 4435 than for NGC 4459 (amounting to and km s-1, respectively, see Table 1). In fact, the nuclear value for NGC 4435 is also at odds with what expected from the aperture velocity dispersion correction for early-type galaxies of Falcón-Barroso et al. (2017), which for a = 235 would lead to a km s-1. On the other hand, for NGC 4459 and a = 431 the same aperture correction returns a km s-1 that is entirely consistent with our actual STIS measurement. Although the use of such an aperture correction down to sub-arcsecond scales represents almost an extrapolation given that the work of Falcón-Barroso et al. (2017) is based on ground-based data, the previous comparison further suggests that NGC 4435 and NGC 4459 have very different central stellar kinematics. As to whether this may indicate a different black-hole mass budget, we note that gas-dynamical measurements already point in this direction. Indeed, whereas NGC 4459 shows a value consistent with the relation (Sarzi et al., 2001), the of NGC 4435 falls significantly below it (Coccato et al., 2006) in spite of their similar values.
Given these indications, we decided to use the cases of NGC 4435 and NGC 4459 to explore how our STIS sub-arcsecond measurements can be used to constrain the central mass concentration of galaxies, in particular when large integral-field spectroscopic measurements are available to provide further constraints on the stellar motions. To this goal, in what follows we describe how we proceeded to deproject the stellar surface-brightness distribution to obtain the galaxy luminosity density with the multi Gaussian expansion (MGE) method of Emsellem et al. (1994) and how we built a stellar dynamical model using the Jeans axisymmetric modelling (JAM) algorithm of Cappellari (2008), while assuming the value predicted by the relation and by matching the SAURON stellar kinematic maps provided by Krajnović et al. (2011).
4.1 Properties of NGC 4435
NGC 4435 is a barred lenticular galaxy at a distance Mpc with a central nebular activity of intermediate type between that of LINERs and H ii nuclei (Table 1). It is a member of the Virgo cluster (Binggeli et al., 1985) and has an absolute total corrected magnitude mag, as obtained from mag (RC3).
Although the proximity to the highly disturbed spiral NGC 4438 and the presence of optical plume that appears to connect NGC 4438 to NGC 4435 initially lead to suggest that these two galaxies are currently interacting (Vollmer et al., 2005), subsequent works indicate instead that NGC 4435 is relatively undisturbed. Kenney et al. (2008) indeed found that NGC 4438 has in fact collided with the nearby elliptical M86, whereas Cortese et al. (2010) interpreted the optical plume between NGC 4438 and NGC 4435 as due to Galactic cirrus.
NGC 4435 has boxy isophotes out to about 10″ from the centre and disky isophotes outwards. It hosts an inclined dust disc with blue star forming regions in the innermost 4″ from the centre (Ferrarese et al., 2006). Coccato et al. (2006) measured an upper limit of from the modelling of resolved, ionised-gas kinematics based on STIS observations along various slit directions and pointed out how this value is far below the prediction of the relation.
4.2 Properties of NGC 4459
NGC 4459 is an unbarred lenticular at a distance Mpc with a central LINER/H ii nebular activity (Table 1) belonging to the Virgo cluster (Binggeli et al., 1985). It has mag from mag (RC3). The early-type morphology of this galaxy was investigated by several authors by performing a photometric decomposition. Kormendy et al. (2009) fitted the -band surface-brightness radial profile along the major axis of NGC 4459 with a Sérsic law and classified it as an elliptical galaxy. A Sérsic profile was also adopted by Vika et al. (2012) and Beifiori et al. (2012) in their two-dimensional fit of the UKIDSS -band and SDSS -band images of the galaxy, respectively. On the contrary, Sani et al. (2011) and Savorgnan & Graham (2016) considered an exponential disc in addition to the Sérsic bulge in their photometric decomposition of the Spitzer 3.6-µm image. In their decomposition, Savorgnan & Graham (2016) pointed out that the disc starts to dominate the surface brightness profile for radii larger than 100″. The galaxy has regular elliptical isophotes although it hosts a dust disc which is extended out to about 85 from the centre and characterised by clumps of star formation (Ferrarese et al., 2006). From the STIS kinematics of the ionised gas Sarzi et al. (2001) measured a by assuming an inclination for the gaseous disc. This inclination value was determined by fitting ellipses to the innermost dust lanes, and is consistent with what found by Cappellari et al. (2007) based on stellar-dynamical models.
4.3 Broad band photometry
In order to build a stellar-mass model for NGC 4435 and NGC 4459 and in turn dynamical models capable of constraining using our nuclear measurements, we need both high-spatial resolution and wide-field images. Therefore, for both galaxies we retrieved Wide Field Camera (WFC) images (Prop. Id. 9401, P.I. Patrick Côté) obtained with the F850LP filter by ACS (Lucas et al., 2016) from the Hubble Legacy Archive (HLA). The available ACS/WFC frames were already reduced and combined with the Python tool DrizzlePac (Gonzaga et al., 2012). The final image is characterised by a field of view of 202″ 202″ and a plate scale of 0049 pixel-1. The images were oriented with north at the top and east to the left and given in electrons per second.
We flux calibrated the F850LP images in the AB photometric system as follows
| (1) |
where is the surface brightness of each pixel in units of electrons per second, is the gain in electrons per ADU, is the plate scale in , is the calibration constant from the header of the images and is the Galactic extinction by Schlafly & Finkbeiner (2011). It is electrons per ADU and mag for both galaxies whereas it is and 0.057 mag for NGC 4435 and NGC 4459, respectively. We converted the resulting surface brightness into the luminosity surface density in solar units using mag for the -band absolute AB magnitude of the Sun.
We subtracted the sky level tabulated in Pavlovsky et al. (2004). For each galaxy, we did a sanity check by comparing the given value with the mean value of the sky level we determined in a large number of pixel areas of the image using the imexamine task in IRAF. We selected these areas in apparently empty regions far from the galaxy, which we considered free of objects to avoid the contamination of the light of field stars and galaxies, as well as of the target galaxy itself. For the estimated sky value and its error we adopted the average and rms of the mean values, respectively. The estimated sky value of NGC 4435 is consistent with that of Pavlovsky et al. (2004). On the contrary, our estimated sky level of NGC 4459 is significantly larger than that by Pavlovsky et al. (2004), suggesting that the light contribution of the galaxy nearly extends out to the edge of the field of view.
4.4 Dust masking
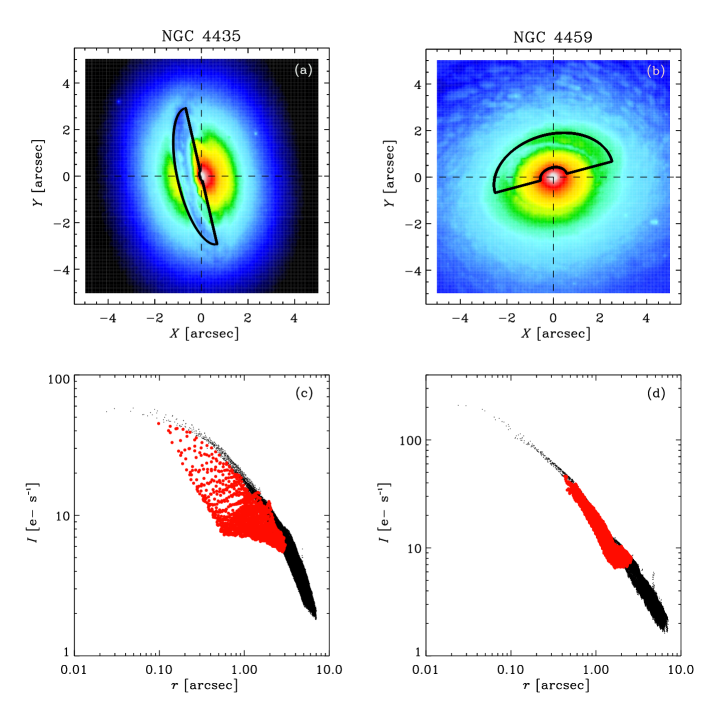
As both galaxies display prominent dust lanes in their central regions, we needed to account for their presence when fitting the surface brightness distribution. First, we carefully inspected the distribution of the dust to identify the regions where it may affect the surface brightness analysis. Indeed, NGC 4435 harbours a highly-inclined disc of dust near to the centre, while NGC 4459 has a more extended dust disc with the outer parts following the surface brightness distribution and the inner ones displaying a more irregular pattern (Fig. 5).
Ferrarese et al. (2006) performed a correction for dust absorption for NGC 4435, but they failed in recovering the surface brightness profile within the inner 20 . The dust disc can still be seen in the corrected image by Coccato et al. (2006) too, although it is less optically thick than in the uncorrected image. Ferrarese et al. (2006) considered as not reliable their dust correction of NGC 4459 out to 75 from the centre. Therefore, we preferred to mask the dusty regions on the images of galaxies rather than correcting them. In both cases, the mask has the shape of half elliptical annulus with an ellipticity given by the inclination of the dust disc. This was measured by Coccato et al. (2006) and Ferrarese et al. (2006) for NGC 4435 () and NGC 4459 (), respectively (Fig. 5). To define the location and size of the masked region and verify whether the galaxy centre was obscured, we compared the surface brightness measured in each pixel of the central portion of the image as a function of the distance from the galaxy centre.
The mask of NGC 4435 extends between 01 and 4″ along the galaxy major axis. The resulting surface brightness profile reveals a lack of dust in the inner 01. In fact, the unmasked pixels on the unobscured northwestern side of the galaxy have systematically a brighter surface brightness than those on the dusty southeastern side (Fig. 5).
The fact that the outer parts of the dust disc of NGC 4459 follow the surface brightness distribution made not possible to clearly distinguish obscured and unobscured pixels as we did in the previous case. We chose to mask only the galaxy portion where the dust absorption was stronger and more irregular. Therefore, we masked the northeastern half between 04 and 3″ along the galaxy major axis since there were a few dust-affected pixels in the innermost region (Fig. 5).
4.5 Multi-Gaussian expansion analysis
In order to obtain a model for the luminosity volume density of both NGC 4435 and NGC 4459, and in turn for their mass density and gravitational potential, we started by parametrizing the surface brightness of the sky-subtracted and dust-masked image of each galaxy as the sum of a set of Gaussian components by using the MGE IDL algorithm by Cappellari (2002). The MGE method indeed allows for a simple reconstruction of the intrinsic surface brightness distribution (provided that the PSF can be approximated as a sum of Gaussian components) and to a straightforward deprojection of the intrinsic surface brightness into the luminosity volume density (which can also be expressed as the sum of a set of Gaussian components too).
Before using the MGE program we performed a photometric analysis in order to estimate the centre and position angle of both galaxies. For this we run ellipse task in IRAF after masking out the remaining foreground stars and background galaxies in the ACS images and inspected the results for the azimuthally-averaged surface brightness, ellipticity, position angle, and centre coordinates. In particular, we found no evidence of a varying centre within the errors and calculated the mean position angle by averaging the values measured between 3″ and 6″ for NGC 4435 and between 3″ and 5″ for NGC 4459.
We then obtained an MGE best-fitting model to the galaxy surface brightness by keeping constant the centre and position angle of the Gaussians and while further restricting the range of the resulting axial ratios of the Gaussian components but keeping the fit acceptable, as described in Scott et al. (2013). This ensured that the permitted galaxy inclinations were not limited to a narrower range than that allowed by the data. We looked for the MGE best-fitting model by using different values of the position angle within 10° from the guess value we obtained from the isophotal fitting. In the fitting process, we used the MGE model of the synthetic F850LP image of the PSF, which we generated with the TINY TIM package (Krist et al., 2011).
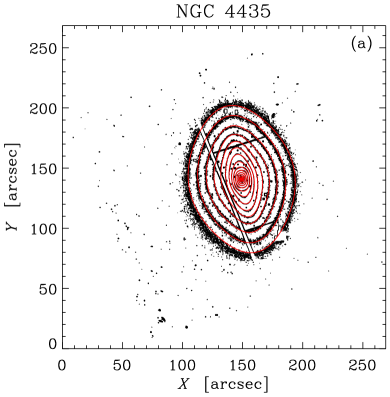
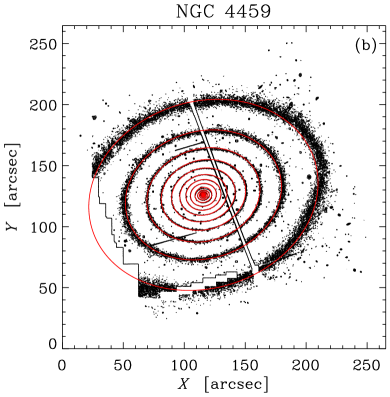
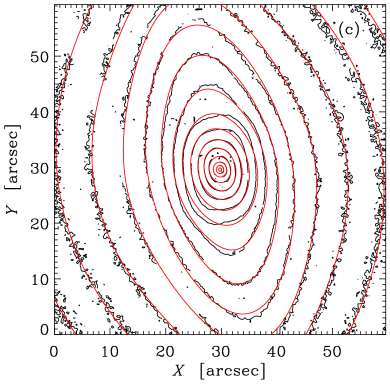
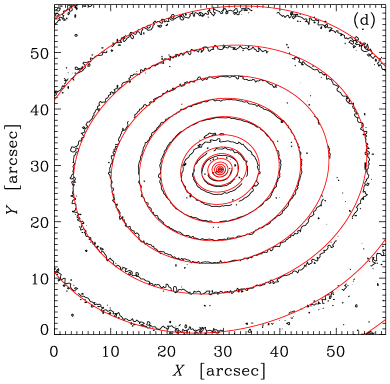
In Fig. 6 we show the F850LP images of NGC 4435 and NGC 4459 at two different scales with a few representative galaxy isophotes and compare these to their MGE best-fitting models. We modeled the surface brightness radial profile of NGC 4459 as at large radii, where Savorgnan & Graham (2016) reported the presence of an exponential disc.
4.6 Jeans axisymmetric dynamical models
With the MGE models at hand, we proceeded to use the JAM IDL algorithm (Cappellari, 2008) to build Jeans axisymmetric dynamical models for NGC 4435 and NGC 4459 in order to test the usefulness of our nuclear measurements in constraining the of these objects. In particular we aimed at anchoring these models by matching the JAM predictions for the stellar to the SAURON stellar kinematic measurements of Krajnović et al. (2011) and then to obtain from such best-fitting JAM models a nuclear value at the HST spatial resolution that can be directly compared to our STIS measurements.
To begin with, we built a set of mass-follows-light models by assuming that the mass volume density follows the luminosity volume density derived from the MGE fit and the deprojection of the galaxy surface brightness. These models have three free parameters that are optimised while matching the observed . They are the dynamical mass-to-light ratio , the galaxy inclination and the anisotropy parameter , where and are the radial and vertical components of the velocity dispersion, respectively, in a cylindrical coordinate system with the origin in the centre of the galaxy and symmetry axis aligned with its rotation axis. To build such models, we took advantage of the two-dimensional maps of and provided by the ATLAS3D survey333The ATLAS3D data are available at http://www-astro.physics.ox.ac.uk/atlas3d/. (see Emsellem et al., 2004; Cappellari et al., 2011; McDermid et al., 2015, for all details). The integral-field spectroscopic data were obtained with SAURON working at William Herschel Telescope (Bacon et al., 2001) in low resolution mode with a field of view of about 30″40″. The spatial scale per spaxel was 08 08 and the wavelength range between about 4800 and 5380 Å was covered with spectral resolution of FWHM Å corresponding to km s-1. The observations were characterised by a typical seeing of FWHM 15 . The data reduction and extraction of the stellar kinematics was presented in Cappellari et al. (2011), while the and maps of NGC 4435 and NGC 4459 were shown in Krajnović et al. (2011, but see also , for NGC 4459). We derived and corresponding errors from the available SAURON kinematics with no further modification.
For NGC 4435 the MGE results allowed only for inclination angles in excess of when deprojecting the surface brightness, which is a limit that corresponds well with inclination for the central ionised-gas disc as inferred by Coccato et al. (2006) from the dust lane morphology. For NGC 4459 we fixed the inclination by adopting the value of from Cappellari et al. (2013), which also corresponds well to the value for the central ionised-gas and dust disc measured by Sarzi et al. (2001). For both galaxies we then adopt radially constant values for both and , which were optimised by -minimisation based on the measurements and associated errors. For NGC 4459, considering would imply a lower /DOF, but for the fast rotators the assumption that is observationally motivated (Cappellari, 2008).
The best-fitting parameters of the mass-follows-light models of NGC 4435 were M⊙/L⊙, and °, while for NGC 4459 we found M⊙/L⊙ and best-fitting values with °. By construction these mass-follows-light dynamical models do not include a SBH, so we also constructed a second set of models including a SBH with as predicted by the relation of Kormendy & Ho (2013) and considering the values given by Cappellari et al. (2013), that is, and for NGC 4435 and NGC 4459, respectively. With these values the JAM best-fitting parameters for NGC 4435 were M⊙/L⊙, and °, while for NGC 4459 we found M⊙/L⊙ and with °. Unsurprisingly, these are very similar to the =0 models given that ground-based data generally do not provide much leverage on measurements at the distance of these galaxies.
The comparison between the SAURON maps of NGC 4435 and NGC 4459 and JAM prediction including a SBH are shown in Fig. 7. Although the models broadly compare well with the data in these maps, formally the JAM models are not good since they lead to reduced- values around 2.8 and 2.5, for NGC 4435 and NGC 4459 respectively. As typical errors for the JAM best-fitting parameters we therefore adopted the estimates that Lablanche et al. (2012) obtained on the basis of simulations for early-type barred and unbarred galaxies, which correspond to errors smaller than 5∘ for the inclination, smaller than 0.15 for and smaller than 0.3 for . A comparison between our best-fitting values and those of the models of Cappellari et al. (2013) is not possible as the latter do not provide their values.
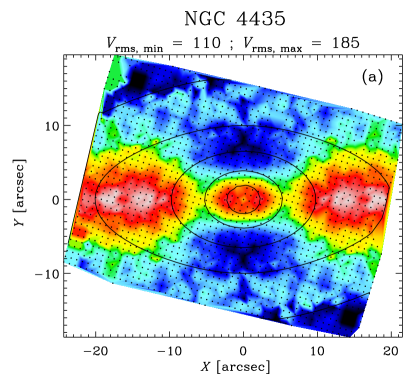
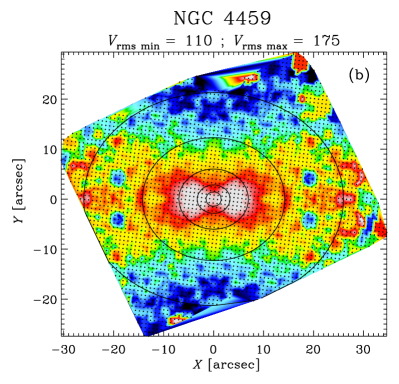
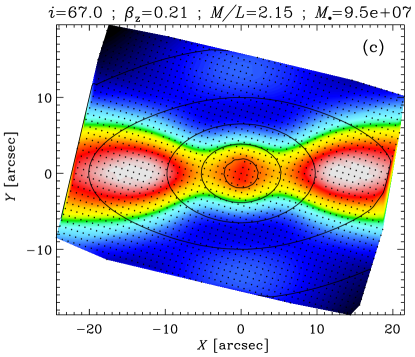
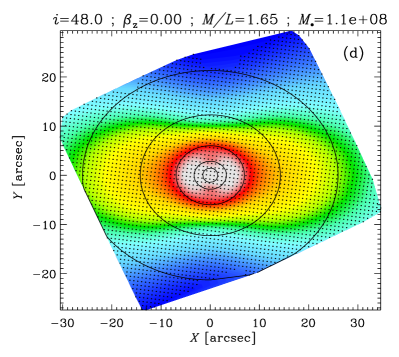
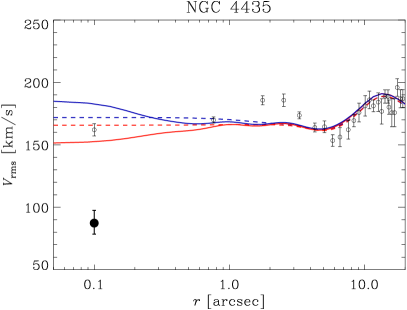
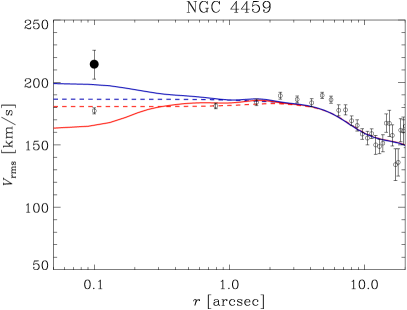
Fig. 8 further illustrates how the JAM models compare to the SAURON measurements by showing major-axis profiles for both data and models within a 08-wide slit. Fig. 8 shows both models with and from the relation, which allows to better appreciate how these models differ by less than 10 km s-1 in the central regions, as expected for models tailored to match ground-based observations of limited spatial resolution. The large discrepancy between data and models seen between about 1″ and 3″ for NGC 4435 is due to the two-lobes structure of the SAURON map, which is quite difficult to reproduce (Fig. 7).
Having anchored the JAM models to match the SAURON data, we finally obtained the radial profiles of along the major axis of both galaxies by simply changing the spatial resolution and spatial sampling of the JAM models with and from the relation to match that of HST/STIS observations (Fig. 8). As expected, the profiles at ground-based and HST resolution begin to differ only in the inner 1″, with a maximum difference of about 35 km s-1 in the centre in both the case of NGC 4435 and NGC 4459. This allowed a direct comparison with values of ,fix we measured from STIS spectra, which are also shown in Fig. 8.
For NGC 4435 the STIS km s-1 is much smaller than the model prediction, at the HST resolution, of km s-1 for . In fact, our nuclear value is even much smaller than the JAM prediction for . On the other hand the STIS km s-1 of NGC 4459 is almost consistent within the 1 errors with the model prediction km s-1 for .
Even though our reference JAM models are clearly somehow simplistic, in particular since they are based on the common assumption of constant vertical anisotropy profile and also in light of their limited ability to match the SAURON data in detail, we consider it unlikely that more sophisticated models for NGC 4435 will be able to predict nuclear values as low as those that we observe. For instance, to match the STIS ,fix alone we would currently need rather extreme vertical anisotropy values of about . More mild variations, on the other hand, may help bridging the gap between the STIS measurements and the JAM model predictions in the case of NGC 4459.
5 Conclusions
We considered all the STIS spectra obtained with the G750M grating and bracketing the H line available in the Hubble Data Archive and which were placed on the nucleus of a galaxy, in order to obtain stellar velocity dispersion measurements within sub-arcsecond apertures. In this way, we arrived at a sample of 28 relatively nearby galaxies ( Mpc, see Table 1), spanning a wide range of morphological types (from E to Scd), central nuclear activity (Seyfert 2, LINERs, H ii nuclei) and nuclear stellar velocity dispersion measurements ( km s-1). For these objects, we extracted the stellar kinematics by matching the nuclear STIS spectra using the single-age, single-metallicity stellar population models of Vazdekis et al. (2010) and both narrow and broad Gaussian emission lines. For 24 objects we further constrained such a fit by using the optimal template from a similar fit to the G430L low-resolution STIS spectra that were also available for these galaxies, thus effectively fixing the stellar population mix while matching the G750M spectra. The good agreement between the nuclear values obtained with and without using such additional information, and additionally with the G750M measurements of Batcheldor et al. (2013) in the Ca ii triplet near-infrared wavelength region, gave us further confidence in the measurements for the 4 galaxies for which we could only rely on the G750M spectra.
To start investigating the usefulness of such nuclear measurements in constraining in nearby galaxies we then considered the case of NGC 4435 and NGC 4459, since these indeed appear to have quite different values of from ionised-gas kinematical measurements despite showing similar ground-based values. Indeed, while NGC 4459 shows a value consistent with the relation (Sarzi et al., 2001), the of NGC 4435 falls significantly below it (Coccato et al., 2006). Furthermore, these two galaxies feature quite different nuclear values in our catalogue, with NGC 4435 displaying a particularly lower value compared to NGC 4459 that could support the finding of Coccato et al. (2006).
We looked into this puzzle by building Jeans axisymmetric stellar dynamical models for NGC 4435 and NGC 4459 starting from archival ACS images and while matching the available integral-field SAURON stellar kinematics. In addition, in these models we adopted either M⊙ or the value from the relation, which allowed us to predict the by mimicking the HST spatial resolution and sampling, while essentially holding to JAM the values for stellar mass-to-light ratio, inclination, and anisotropy parameter that best matched the ground-based kinematics (see Section 4.6). In the case of NGC 4459 our nuclear value ( km s-1) was nearly consistent with the high-spatial resolution prediction for at the value given by the relation ( km s-1), whereas for NGC 4435 the nuclear value ( km s-1) falls significantly below the model predictions even for M⊙ ( 151.6 km s-1).
Although our models are somehow simplistic, these results lend further support to the idea that the SBH of NGC 4435 is a genuine low outlier in the relation, which deserves more investigation. For instance NGC 4435 would be an ideal target for future near-infrared observations from either space (e.g. with JWST) or from the ground while being assisted by adaptive optics (AO), such as those presented by Krajnović et al. (2018), who indeed also found evidence for undermassive SBH in two nearby early-type galaxies. AO assisted integral-field observations would also allow to establish if our nuclear dip can be explained by the presence of a central dynamically cold component such as a nuclear disc, although we note that in that case the presence of a SBH would be betrayed by an increased central stellar rotation (as also discussed by Krajnović et al., 2018). Theoretical works indicate that assessing the fraction of undermassive black holes in nearby galaxies would be quite important to constrain the processes driving the mass growth of SBHs and how they settled in galactic nuclei (Volonteri et al., 2011).
Acknowledgements
We acknowledge the anonymous referee. We are also grateful to John Magorrian, Bradley M. Peterson and Sébastien Viaene for their valuable comments. IP is supported by Fondazione Cassa di Risparmio di Padova e Rovigo (Cariparo) through the 2015 Ph.D. fellowship “Accurate mass determination of supermassive black holes in nearby galaxies". EMC, EDB, LM, and AP acknowledge financial support from Padua University through grants DOR1699945/16, DOR1715817/17, DOR1885254/18, and BIRD164402/16. IP acknowledges the Centre for Astrophysics Research of the University of Hertfordshire, EMC and EDB acknowledge the Space Telescope Science Institute, and MS and BP acknowledge the Institut d’Astrophysique de Paris for the hospitality while this paper was in progress. This research is based on observations made with the NASA/ESA Hubble Space Telescope, and obtained from the Hubble Legacy Archive (http://hla.stsci.edu/), which is a collaboration between the Space Telescope Science Institute (STScI/NASA), the Space Telescope European Coordinating Facility (ST-ECF/ESA) and the Canadian Astronomy Data Centre (CADC/NRC/CSA). This research made use of data from the Hubble Data Archive (https://archive.stsci.edu/hst/) and of the NASA/IPAC Extragalactic Database (http://ned.ipac.caltech.edu/).
References
- Bacon et al. (2001) Bacon R., et al., 2001, MNRAS, 326, 23
- Batcheldor et al. (2013) Batcheldor D., Axon D., Valluri M., Mandalou J., Merritt D., 2013, AJ, 146, 67
- Beifiori et al. (2009) Beifiori A., Sarzi M., Corsini E. M., Dalla Bontà E., Pizzella A., Coccato L., Bertola F., 2009, ApJ, 692, 856
- Beifiori et al. (2012) Beifiori A., Courteau S., Corsini E. M., Zhu Y., 2012, MNRAS, 419, 2497
- Binggeli et al. (1985) Binggeli B., Sandage A., Tammann G. A., 1985, AJ, 90, 1681
- Cappellari (2002) Cappellari M., 2002, MNRAS, 333, 400
- Cappellari (2008) Cappellari M., 2008, MNRAS, 390, 71
- Cappellari & Emsellem (2004) Cappellari M., Emsellem E., 2004, PASP, 116, 138
- Cappellari et al. (2007) Cappellari M., et al., 2007, MNRAS, 379, 418
- Cappellari et al. (2011) Cappellari M., et al., 2011, MNRAS, 413, 813
- Cappellari et al. (2013) Cappellari M., et al., 2013, MNRAS, 432, 1709
- Coccato et al. (2006) Coccato L., Sarzi M., Pizzella A., Corsini E. M., Dalla Bontà E., Bertola F., 2006, MNRAS, 366, 1050
- Cortese et al. (2010) Cortese L., Bendo G. J., Isaak K. G., Davies J. I., Kent B. R., 2010, MNRAS, 403, L26
- Cretton & van den Bosch (1999) Cretton N., van den Bosch F. C., 1999, ApJ, 514, 704
- Dressel et al. (2007) Dressel L., Holfeltz S., Quijano J. K., 2007, STIS Data Handbook, Version 5.0. STScI, Baltimore
- Emsellem et al. (1994) Emsellem E., Monnet G., Bacon R., 1994, A&A, 285, 723
- Emsellem et al. (2004) Emsellem E., et al., 2004, MNRAS, 352, 721
- Falcón-Barroso et al. (2011) Falcón-Barroso J., Sánchez-Blázquez P., Vazdekis A., Ricciardelli E., Cardiel N., Cenarro A. J., Gorgas J., Peletier R. F., 2011, A&A, 532, A95
- Falcón-Barroso et al. (2017) Falcón-Barroso J., et al., 2017, A&A, 597, A48
- Ferrarese et al. (2006) Ferrarese L., et al., 2006, ApJS, 164, 334
- Gonzaga et al. (2012) Gonzaga S., et al., 2012, The DrizzlePac Handbook, Version 1.0. STScI, Baltimore
- Graham (2016) Graham A. W., 2016, in Laurikainen E., Peletier R., Gadotti D., eds, Astrophysics and Space Science Library Vol. 418, Galactic Bulges. p. 263
- Gültekin et al. (2011) Gültekin K., Richstone D. O., Gebhardt K., Faber S. M., Lauer T. R., Bender R., Kormendy J., Pinkney J., 2011, ApJ, 741, 38
- Ho et al. (1997) Ho L. C., Filippenko A. V., Sargent W. L. W., 1997, ApJS, 112, 315
- Kenney et al. (2008) Kenney J. D. P., Tal T., Crowl H. H., Feldmeier J., Jacoby G. H., 2008, ApJ, 687, L69
- Kormendy & Ho (2013) Kormendy J., Ho L. C., 2013, ARA&A, 51, 511
- Kormendy et al. (1997) Kormendy J., et al., 1997, ApJ, 482, L139
- Kormendy et al. (2009) Kormendy J., Fisher D. B., Cornell M. E., Bender R., 2009, ApJS, 182, 216
- Krajnović & Jaffe (2004) Krajnović D., Jaffe W., 2004, A&A, 428, 877
- Krajnović et al. (2011) Krajnović D., et al., 2011, MNRAS, 414, 2923
- Krajnović et al. (2018) Krajnović D., et al., 2018, MNRAS,
- Krist et al. (2011) Krist J. E., Hook R. N., Stoehr F., 2011, in Optical Modeling and Performance Predictions V. p. 81270J
- Kuntschner et al. (2010) Kuntschner H., et al., 2010, MNRAS, 408, 97
- Lablanche et al. (2012) Lablanche P.-Y., et al., 2012, MNRAS, 424, 1495
- Lucas et al. (2016) Lucas R. A., et al., 2016, ACS Instrument Handbook, Version 8.0. STScI, Baltimore
- McDermid et al. (2015) McDermid R. M., et al., 2015, MNRAS, 448, 3484
- Nelder & Mead (1965) Nelder J. A., Mead R., 1965, Computer Journal, 7, 308
- Nowak et al. (2008) Nowak N., Saglia R. P., Thomas J., Bender R., Davies R. I., Gebhardt K., 2008, MNRAS, 391, 1629
- Pagotto et al. (2017) Pagotto I., et al., 2017, Astronomische Nachrichten, 338, 841
- Pavlovsky et al. (2004) Pavlovsky C., et al., 2004, ACS Instrument Handbook, Version 5.0. STScI, Baltimore
- Riley et al. (2017) Riley A., et al., 2017, STIS Instrument Handbook, Version 16.0. STScI, Baltimore
- Saglia et al. (2016) Saglia R. P., et al., 2016, ApJ, 818, 47
- Sánchez-Blázquez et al. (2006) Sánchez-Blázquez P., et al., 2006, MNRAS, 371, 703
- Sani et al. (2011) Sani E., Marconi A., Hunt L. K., Risaliti G., 2011, MNRAS, 413, 1479
- Sarzi et al. (2001) Sarzi M., Rix H.-W., Shields J. C., Rudnick G., Ho L. C., McIntosh D. H., Filippenko A. V., Sargent W. L. W., 2001, ApJ, 550, 65
- Sarzi et al. (2002) Sarzi M., et al., 2002, ApJ, 567, 237
- Sarzi et al. (2005) Sarzi M., Rix H.-W., Shields J. C., Ho L. C., Barth A. J., Rudnick G., Filippenko A. V., Sargent W. L. W., 2005, ApJ, 628, 169
- Sarzi et al. (2006) Sarzi M., et al., 2006, MNRAS, 366, 1151
- Savorgnan & Graham (2015) Savorgnan G. A. D., Graham A. W., 2015, MNRAS, 446, 2330
- Savorgnan & Graham (2016) Savorgnan G. A. D., Graham A. W., 2016, ApJS, 222, 10
- Schlafly & Finkbeiner (2011) Schlafly E. F., Finkbeiner D. P., 2011, ApJ, 737, 103
- Scott et al. (2013) Scott N., et al., 2013, MNRAS, 432, 1894
- Shankar et al. (2016) Shankar F., et al., 2016, MNRAS, 460, 3119
- Vazdekis et al. (2010) Vazdekis A., Sánchez-Blázquez P., Falcón-Barroso J., Cenarro A. J., Beasley M. A., Cardiel N., Gorgas J., Peletier R. F., 2010, MNRAS, 404, 1639
- Verdoes Kleijn et al. (2002) Verdoes Kleijn G. A., van der Marel R. P., de Zeeuw P. T., Noel-Storr J., Baum S. A., 2002, AJ, 124, 2524
- Vika et al. (2012) Vika M., Driver S. P., Cameron E., Kelvin L., Robotham A., 2012, MNRAS, 419, 2264
- Vollmer et al. (2005) Vollmer B., Braine J., Combes F., Sofue Y., 2005, A&A, 441, 473
- Volonteri et al. (2011) Volonteri M., Natarajan P., Gültekin K., 2011, ApJ, 737, 50
- Walsh et al. (2015) Walsh J. L., van den Bosch R. C. E., Gebhardt K., Yildirim A., Gültekin K., Husemann B., Richstone D. O., 2015, ApJ, 808, 183
- Walsh et al. (2017) Walsh J. L., van den Bosch R. C. E., Gebhardt K., Yıldırım A., Gültekin K., Husemann B., Richstone D. O., 2017, ApJ, 835, 208
- de Vaucouleurs et al. (1991) de Vaucouleurs G., de Vaucouleurs A., Corwin Jr. H. G., Buta R. J., Paturel G., Fouqué P., 1991, Third Reference Catalogue of Bright Galaxies, Springer-Verlag, New York (RC3)
- van Dokkum (2001) van Dokkum P. G., 2001, PASP, 113, 1420
- van den Bosch (2016) van den Bosch R. C. E., 2016, ApJ, 831, 134
- van den Bosch et al. (2012) van den Bosch R. C. E., Gebhardt K., Gültekin K., van de Ven G., van der Wel A., Walsh J. L., 2012, Nature, 491, 729
- van den Bosch et al. (2015) van den Bosch R. C. E., Gebhardt K., Gültekin K., Yıldırım A., Walsh J. L., 2015, ApJS, 218, 10