11email: terwisga@strw.leidenuniv.nl22institutetext: Max-Planck-Institut für Extraterrestrische Physik, Gießenbachstraße, D-85741 Garching bei München, Germany 33institutetext: Institute for Astronomy, University of Hawai‘i at Mānoa, 2680 Woodlawn Dr., Honolulu, HI, USA 44institutetext: Herzberg Astronomy & Astrophysics Programs, NRC of Canada, 5017 West Saanich Road, Victoria, BC V9E 2E7, Canada 55institutetext: Department of Astronomy, University of California, Berkeley, CA 94720, USA 66institutetext: Institute of Astronomy, University of Cambridge, Madingley Road, CB3 0HA, Cambridge, UK 77institutetext: Anton Pannekoek Institute for Astronomy, University of Amsterdam, Postbus 94249, 1090 GE Amsterdam, The Netherlands 88institutetext: European Southern Observatory, Karl-Schwarzschild-Str. 2, D-85748 Garching bei München, Germany 99institutetext: INAF-Osservatorio Astrofisico di Arcetri, Largo E. Fermi 5, I-50125 Firenze, Italy
The ALMA Lupus protoplanetary disk survey: evidence for compact gas disks and molecular rings from CN
?abstractname?
Context. The cyanide radical CN is abundant in protoplanetary disks, with line fluxes often comparable to those of 13CO. It is known to be sensitive to UV irradiation of the upper disk atmosphere, with models predicting ring-shaped emission.
Aims. We seek to characterize the CN emission from 94 Class II disks in the Lupus star forming region, compare it to observations in other regions, and interpret our observations with a grid of models. The CN emission morphology is discussed for two primordial disks, Sz 71 and Sz 98, and modeled in more detail.
Methods. ALMA observed CN in Lupus disks down to sensitivities better than previous surveys. Models constructed with the physico-chemical code DALI are used to study the integrated fluxes of the disks and resolved emission of CN in disks without (dust) substructures.
Results. CN is bright, and detected in of sources, but its disk-integrated flux is not strongly correlated to either 13CO or continuum flux. Compared to pre-ALMA single-dish surveys, no significant difference in the CN flux distributions in Lupus and Taurus-Auriga is found, although Ophiuchus disks may be fainter on average. We find ring-shaped CN emission with peak radii of AU in two resolved disks.
Conclusions. A large fraction of sources is faint in CN; only exponential gas surface density cutoffs at AU can reconcile observations with models. This is the first observational evidence of such a compact gas disk population in Lupus. Absolute intensities and the emission morphology of CN are reproduced by DALI models without the need for any continuum substructure; they are unrelated to the CO snowline location. These observations and the successful modeling of these rings provide a new probe of the structure and conditions in disks, and particularly their incident UV radiation field, if disk size is determined by the data.
Key Words.:
astrochemistry - protoplanetary disks - stars:pre-main sequence - stars: individual: Sz98, Sz71 - techniques: interferometric1 Introduction
The primary motivation for the study of protoplanetary disks is to understand the formation of planetary systems. For this purpose it is essential to characterize the structure and composition of both dust and gas in the disks, with different molecules providing different information on the gas structure and conditions.
Initially, most disk observations were limited by low spatial resolution and sensitivity, and focused on disk-integrated observations of well-known, bright objects (see the review by Henning & Semenov 2013). In recent years, ALMA has been instrumental in detecting as well as resolving the mm-sized dust and a number of gas species near the midplanes of protoplanetary disks, thus providing a new window on the environment where planets are formed. A number of large, unbiased, and deep surveys have significantly improved our understanding of the protoplanetary disk populations in nearby star-forming regions (e.g. Andrews & Williams 2005; Pascucci et al. 2016; Barenfeld et al. 2016; Ansdell et al. 2016). Among the puzzling results from these surveys is that the CO isotopologue emission is weaker than expected when assuming normal CO abundances and an ISM-like gas-to-dust ratio (Ansdell et al. 2016; Miotello et al. 2017; Long et al. 2017).
While most of these surveys focused exclusively on the (resolved) continuum emission of Class II disks, or on CO and its isotopologues, relatively few surveys have targeted other molecular species. Targeting other molecules is scientifically valuable: if their chemistry is sufficiently well understood, they can provide additional independent constraints on the properties of disks. However, molecular lines are often faint, or the chemical pathways behind their formation and destruction not well understood, making them less attractive targets for a survey.
The cyanide radical (CN) is, in this context, of particular interest. After 12CO, it is one of the brightest molecules in disks, and has line fluxes comparable to or higher than those of 13CO (e.g. Dutrey et al. 1997; Thi et al. 2004; Öberg et al. 2011; Salter et al. 2011). Due to its brightness, several large single-dish surveys of this molecule have already been performed, using the IRAM 30-meter telescope (Guilloteau et al. 2013; Reboussin et al. 2015). Together these surveys cover 74 disks in Taurus and Ophiuchi. However, the samples studied suffer from two key drawbacks: they are not complete, and are biased towards the brightest or most radially extended sources at millimeter wavelengths.
Despite these issues, the abundance of CN has been suggested to be enhanced in Class II versus Class I disks (Kastner et al. 2014; Guilloteau et al. 2016). Also, Guilloteau et al. (2014) have successfully used the cyanide radical as a stellar mass probe. However, in order to get a better understanding of the dependence of CN on disk properties, it is necessary to use an unbiased, large, and uniformly observed sample of disk observations.
The observational basis for this study is the complete survey of Class II disks in the Lupus star-forming region (Ansdell et al. 2016, 2018). This survey offers good angular resolution at , or a AU radius at pc (the typical distance for these objects, based on Gaia DR2 Gaia Collaboration et al. 2018; Bailer-Jones et al. 2018). The sensitivity of this dataset is a factor of better than previous large single-dish CN surveys. Moreover, the sample studied here is unbiased. By covering 94 of 95 Class II disks in Lupus I, III, and IV with how star masses , this survey is very complete and more than doubles the total number of disks observed in CN.
From an evolutionary perspective, the objects in the Lupus survey must be relatively close in age, around Myr (Comerón 2008), and formed in a similar environment. This reduces the impact of different disk ages on observational properties. Finally, the Lupus disks have been characterized at multiple wavelengths. Apart from the dust continuum, the Lupus disk survey targeted 12CO and its most common isotopologues 13CO and C18O. Additionally, intermediate-resolution XSHOOTER spectra of most sources in the sample have also been taken (Alcalá et al. 2014, 2017), so that accurate measurements of the host star properties and accretion rates are available.
Apart from providing disk-integrated observations of CN towards many sources, resolved images are also obtained, even at integration times of just one minute. In comparison to pre-ALMA interferometric studies of individual objects (e.g. Öberg et al. 2011; Guilloteau et al. 2014), our effective physical resolution is improved by a factor of . With these short integration times, the of the molecular gas emission is low: for the brightest sources in CN, the line peak has an relative to the channel noise. However, we are able to discuss in greater detail the ring-like radial distribution of CN emission in two favorably inclined, bright sources, and study its underlying causes in a general way.
This is relevant because, in recent years, the high-resolution capabilities of ALMA have lead to the discovery of many rings and other radial structures, in gas emission (e.g. Kastner et al. 2015; Teague et al. 2017) as well as in dust (e.g. ALMA Partnership et al. 2015; Isella et al. 2016), in a variety of sources and molecules. These structures occur both in transitional disks, which are characterized by central cavities in their dust distribution (Espaillat et al. 2014; van der Marel et al. 2016a) as well as in full disks, which are the focus of this article. Indeed, ALMA observations of TW Hya also show CN to be distributed in a ring (Teague et al. 2016), suggesting this type of emission morphology may be more common for this species.
For molecular species with ring-like emission, several different processes have been identified as their root cause: CO is depleted in at least some of the gaps in the dust in the HD 163296 system (Isella et al. 2016), while CS emission coincides with a region of decreased dust surface density in TW Hya (Teague et al. 2017). More complex chemical processes also play a role for some species: dust grains locking up volatile carbon and oxygen in the outer disk have been suggested as an explanation for rings observed in C2H and -C3H2 (Kastner et al. 2015; Bergin et al. 2016). Snow lines are also an important mechanism for causing the ring-like emission of some molecules. For instance, N2H+ is distributed in a ring in several disks (Qi et al. 2013, 2015), of which the radius is sensitive to the position of the CO ice line (Aikawa et al. 2015; van’t Hoff et al. 2017). Many other molecular species are now showing a rich variety of emission morphologies, including single and multiple rings: DCO+, DCN, H13CN, and H13CO+, H2CO (Mathews et al. 2013; Öberg et al. 2015; Huang et al. 2017; Carney et al. 2017; Salinas et al. 2017). However, for many of these species, finding the underlying cause of the emission morphology from observations alone is difficult, due to the variety in emission profiles between different molecules, and between disks.
To study integrated fluxes and the radial distribution of CN emission in disks, the chemical network that sets its formation and destruction must be understood. Significant advances have recently been made on this front: the physical-chemical code DALI (Bruderer et al. 2012; Bruderer 2013), which self-consistently calculates the chemical and thermal structure of the disk models, has been expanded to include nitrogen chemistry (Visser et al. 2018) using the most recent rates and branching ratios from Loison et al. (2014). Moreover, DALI now uses updated UV cross-sections for CN photodissociation (Heays et al. 2017). This allows us to predict the CN emission expected for a wide variety of disks, and study how the models depend on various disk parameters, such as radius, mass, and incident UV flux (Cazzoletti et al. 2018). Several key predictions have been found: first, an increasing integrated CN flux with increasing disk size; second, a strong dependence of CN flux on the UV radiation field of stars; and a relatively weak dependence on total disk mass and on the volatile carbon abundance. In terms of the distribution of CN emission over the disk, a ring-like morphology is always found in the models, with the ring radius depending on the characteristic radius of the gas disk, the vertical profile of the disk, and the UV radiation field.
In this paper, we discuss the CN emission in the full Lupus Class-II disk population (Section 3), investigate possible correlations with other disk tracers, and compare the Lupus disks to previous large single-dish surveys. In Section 3.3, the properties of the full disk sample are compared to a DALI model grid, focusing on the consequences for disk gas radii and the sensitivity to UV radiation. To investigate resolved CN emission, two full (i.e. non-transitional) disks are described in detail (Section 4). These disks – Sz 98 and Sz 71 – are amongst the brightest sources in CN, have clearly detected and resolved emission in both lines and continuum, and are not strongly inclined (around ). Section 4.2 discusses individual DALI models for CN emission in Sz 98 and Sz 71, to see if a smooth power-law surface density distribution can reproduce their CN intensity profiles.
2 Observations and data reduction
The data for this project are part of the ALMA Lupus disk survey (Ansdell et al. 2016, 2018), which targeted 86 Class II stars with ALMA Band 7 and 6 (ID: 2013.1.00220.S, 2015.1.00222.S, PI: J. Williams), combined with the 7 sources from the Lupus Completion Survey (ID: 2016.1.01239.S, PI: S. van Terwisga). To these 93 disks we add previously-published data for IM Lup (Öberg et al. 2011). On top of the 12CO , 13CO and C18O and lines, and and GHz continuum, the spectral settings of these surveys targeted the CN transition in Band 7. Of the fine-structure transitions of this molecule, we focus on the brightest () line, and in particular the and transitions at 340.247770 GHz and the partially overlapping transition; all others are too faint to be detected in our data but these transitions together are responsible for of the flux in the line in the optically thin case (Hily-Blant et al. 2017). CN was observed at a lower spectral resolution of 0.24 MHz compared to 13CO , for which a 0.12 MHz resolution was used. The analysis in this article mainly focuses on the Band 7 results, and only uses the Band 6 12CO data.
In Band 7, all M-type stars were observed for 1 minute on source, while earlier-type stars were observed for 30 s, giving continuum sensitivities of and mJy beam-1. Band 6 integration times were twice as long. For the sources in the Lupus Completion Survey longer integration times were used, of 3.5 and 4.5 minutes in Band 6 and Band 7 respectively, but a smaller beam lead to similar sensitivities (Ansdell et al. 2018); otherwise all observing parameters were identical.
Pipeline calibration of the data was performed by the NRAO. Flux, phase, bandpass and gain were calibrated using observations of Titan, J1427-4206, and J1604-4228 and J1610-3958 respectively. We also performed self-calibration on the data in order to maximize the of the resulting images. Phase- and gain self-calibration were performed for all objects at the largest solution interval of one minute (for the highest sensitivity). These disks are not so bright as to be dominated by phase- and gain noise even in the continuum images, but this procedure resulted in an improvement in .
Both continuum and line imaging were performed using the clean task in CASA. The continuum of the sources discussed in detail was imaged using Briggs weighting with a robust parameter of after averaging over all continuum channels. This optimized our resolution and in the image. The resulting effective beam size in Band 7 is , while in Band 6, it is . In the Lupus completion survey, the beams were (Band 6) and (Band 7), respectively.
The CN channels were binned for an effective velocity resolution of 0.5 km s-1, and imaged using natural weighting to maximize . The resulting typical beam shape is ; for the Lupus completion survey it is . The 12CO and 13CO lines were imaged with the same parameters. In these observations, the typical resulting channel rms of these CN observations is 10 mJy beam-1. The median noise level on the disk- and velocity integrated line fluxes is 48 mJy km s-1.
Of the 93 disks observed with ALMA, we focus specifically on the two brightest disks that are moderately inclined (), resolved across multiple beams, have high moment-zero maps, and do not show any signs of depleted inner dust cavities. For these two disks, Sz 98 and Sz 71, it is possible to study the spatial distribution of CN. To generate and analyze the moment-zero maps at the highest sensitivity without introducing biases (by, e.g., using significance cuts in the individual channels), image-plane Keplerian masking was used to create their moment-zero maps (Loomis et al. 2018; Salinas et al. 2017). For this method to work, several properties of the system must be known. The stellar masses have been derived by determining the stellar properties of the targets with optical spectroscopy (Alcalá et al. 2017) and comparing the stellar temperature and luminosity with evolutionary models by Siess et al. (2000), while the mm-continuum observations allowed us to constrain the disks’ position angles and inclinations using the imfit task in CASA, version 4.3.1. These results are combined with a line-width uncertainty factor (here taken as 0.5 km s-1 for CN, and 0.3 km s-1 for the CO isotopologue lines) which accounts for uncertainties in the precise stellar position, the disk position angle and inclination, and the effect of adjacent hyperfine lines in CN (specifically, the partial overlap of the and transition with the transition). The resulting mask allowed us to use only those voxels in the objects’ data cubes in which a signal can be reasonably expected. Compared to a normal moment-zero map, the biggest gain in sensitivity using this mask is in the outer regions of the disk, where (often) only a single channel contains a line signal. For 13CO in Sz 98, we additionally used -plane tapering to create an circular beam, in order to maximize .
3 Integrated CN flux survey results
The full Lupus sample consists of 95 Class II disks, 93 of which have been observed in CN in this survey. Of the two missing objects, Sz 91 and IM Lup, only Sz 91 has no CN observations available. Instead of the CN transition, CN has been observed and detected towards IM Lup by Öberg et al. (2011).
In these observations, 36 of 94 sources are detected, for a total detection rate of across the sample. All but 3 of these sources are also detected in 13CO. The brightest sources in terms of CN flux are the transition disk J16083070-3828268 (van der Marel et al. 2018), Sz 98, V1094 Sco (van Terwisga et al. 2018), IM Lup, Sz 133, and Sz 71. Interestingly, the transition disks with large inner cavities in the sample that were identified in van der Marel et al. (2018) are all detected in CN. These sources were also found to be among the brightest in the sample in continuum and 13CO emission. Integrated fluxes for these objects were determined in the same way as those in Ansdell et al. (2016, 2018): circular aperture photometry was performed on the source position after integrating over all channels with significant emission, with the smallest aperture containing the full disk flux determined using a curve-of-growth method. For non-detections, a beam-sized aperture was used, and a conservative velocity range with a width of km s-1, to be consistent with our previously used noise definitions.
3.1 CN versus other disk tracers: 13CO and continuum
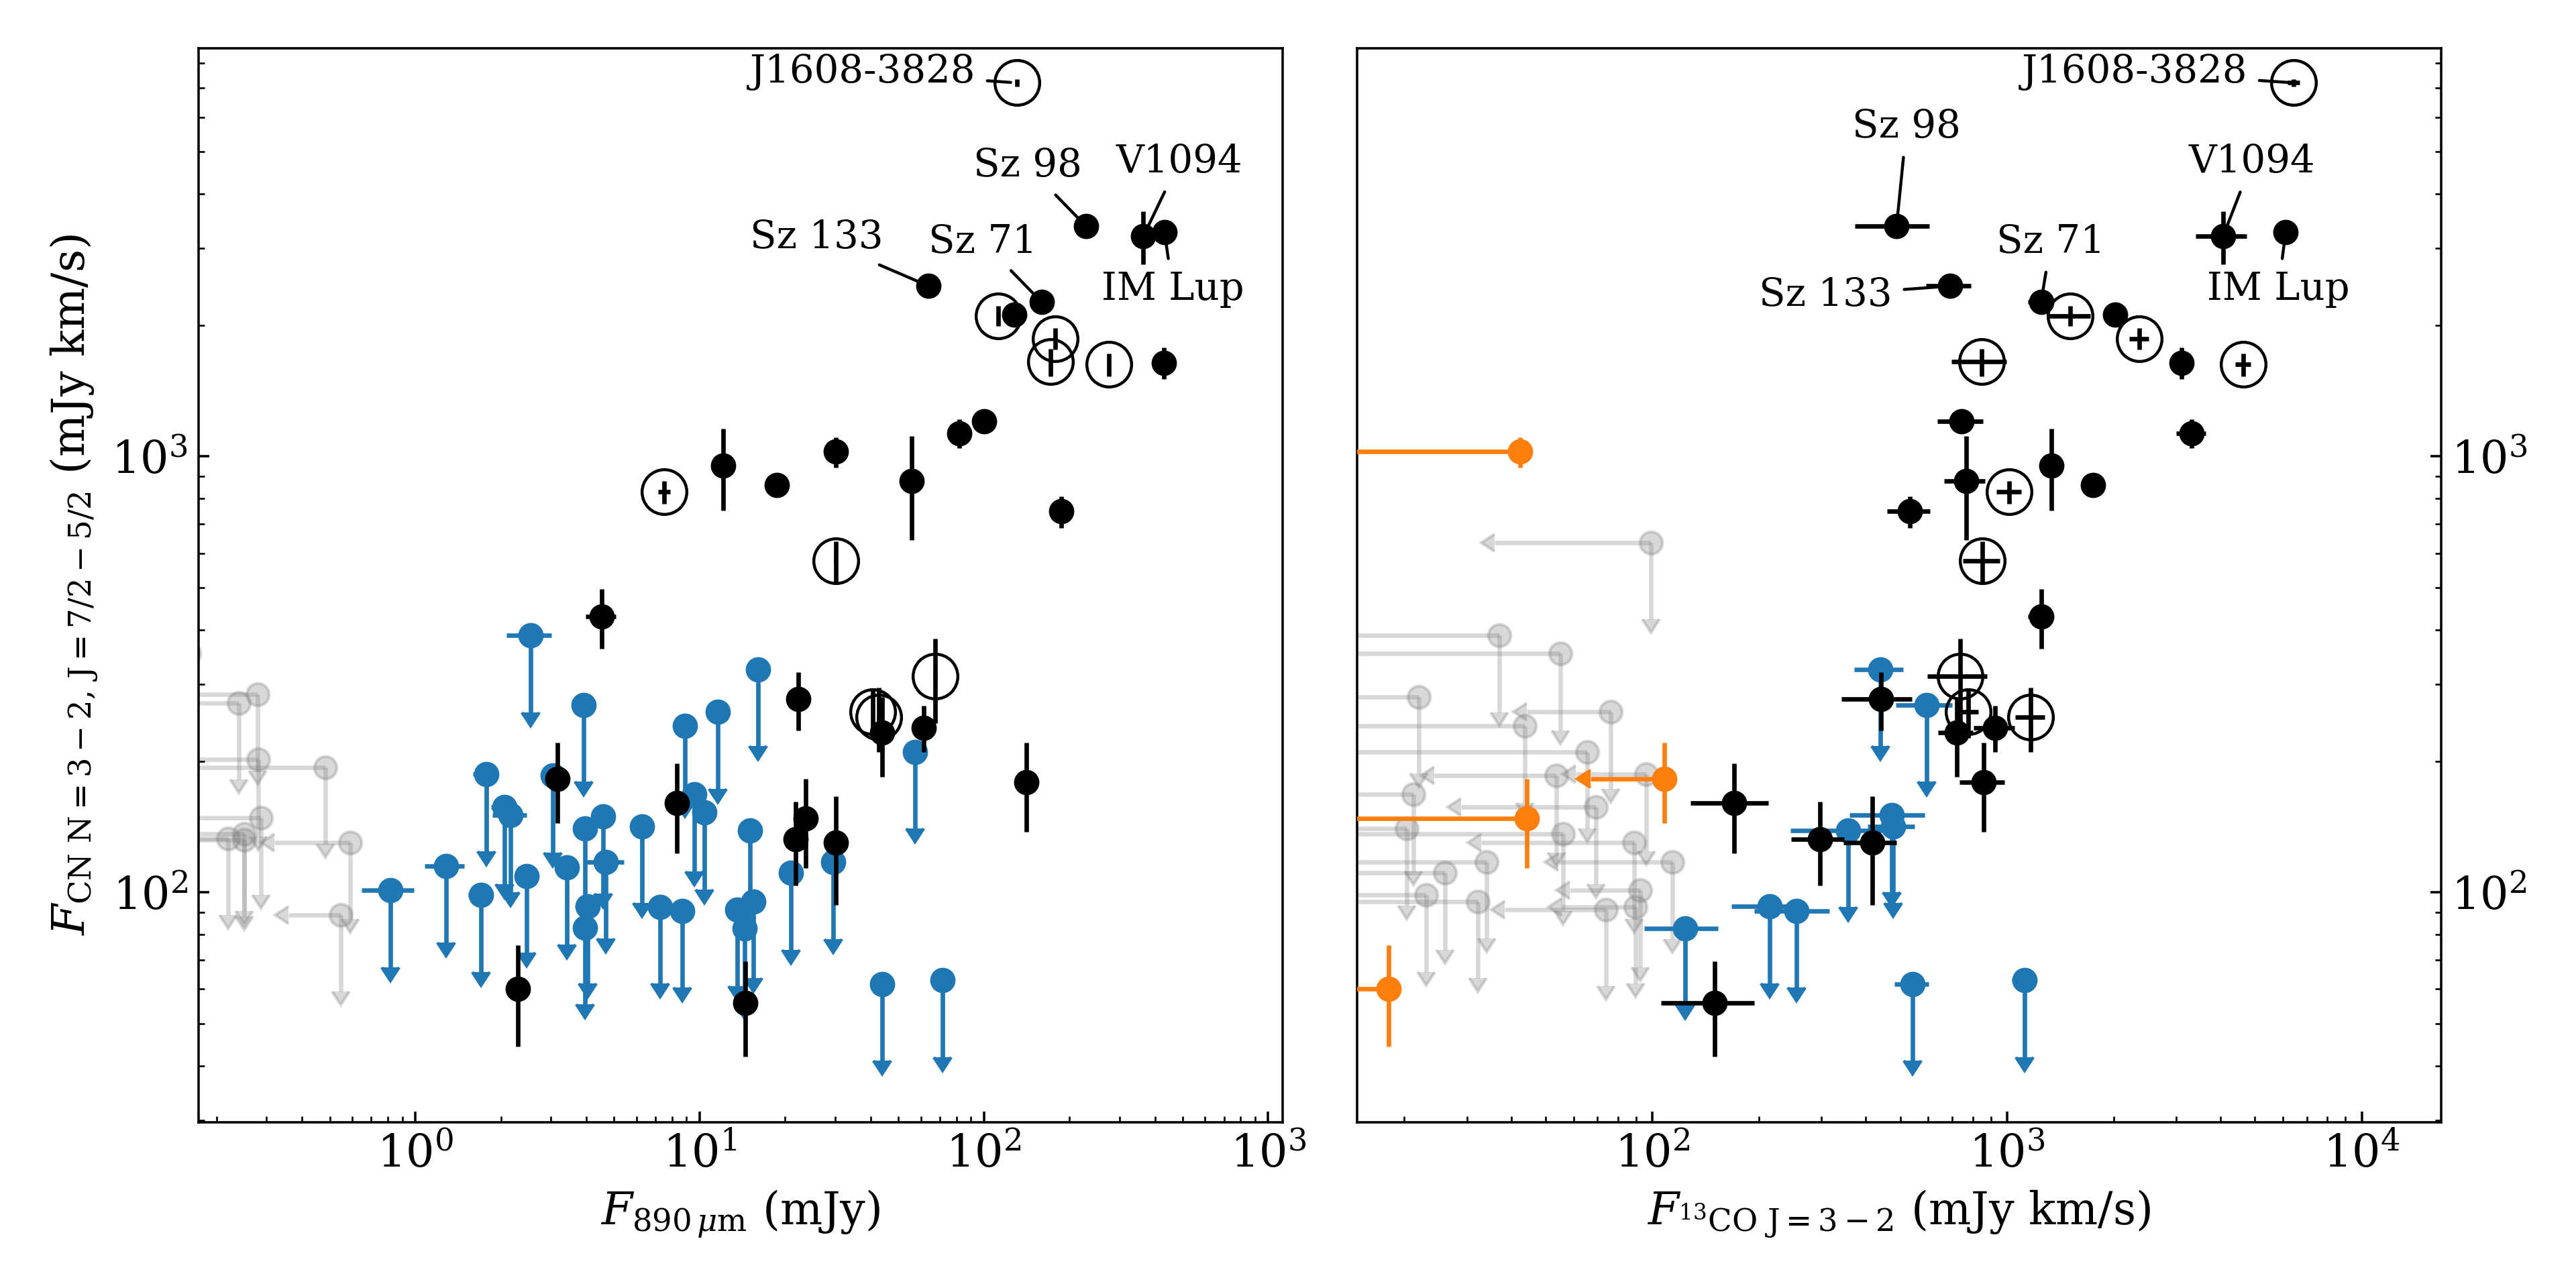
The large, unbiased sample of Class II disks in Lupus allows us to compare the resulting CN fluxes to the other important disk tracers: their continuum flux (proportional to the disk dust mass, if we assume the emission to be optically thin at these wavelengths) and integrated 13CO emission, which is the most commonly detected CO isotopologue, and more optically thin than 12CO . The results of this comparison are presented in Figure 1. Appendix A shows CN versus the C18O emission in Figure A.1, but we do not discuss it further here, due to the low detection rate of this molecule in both Band 6 and Band 7.
The CN fluxes detected towards Lupus span several orders of magnitude, and are presented in full in Table LABEL:tab:all_cn. Compared to the continuum- and 13CO fluxes, a large scatter becomes apparent, of several orders of magnitude, especially due to the impact of upper limits in the data. Consider, for example, the position of Sz 71 (labeled) in both panels of Figure 1: a source with similarly bright 13CO is undetected in CN, while another disk with a similar 890 m flux has CN emission that is an order of magnitude fainter. Similar behavior is seen in the other direction.
To formally test for correlations between these observables, a modified Kendall-rank test taking into account upper limits was used (Isobe et al. 1986). This test confirms that neither the m continuum nor the 13CO line flux are correlated with the CN flux (), consistent with the results from the IRAM 30-m telescope survey in Taurus-Auriga by Guilloteau et al. (2013). Not being able to reject the null result does not mean that no information can be extracted from this figure; however, to do so, more sophisticated models are needed, which are discussed in Section 3.3.
3.2 CN in Lupus versus Taurus-Auriga and Ophiuchi
Comparing the results of the Lupus sample to those of other literature surveys allows us to test if different regions (possibly with different ages, typical disk sizes, or external UV fields) have different CN emission properties. Here, we compare the Lupus CN observations to the results presented for CN in Guilloteau et al. (2013) and Reboussin et al. (2015), who targeted 42 and 30 stars respectively with the IRAM 30-m single-dish telescope, primarily in the Taurus-Auriga and Oph star-forming regions.
Some caveats apply to this analysis. First, the IRAM 30-m sample covers a range of spectral types, stellar luminosities, and disk masses, but might be biased to bright or radially extended targets. Large-scale cloud contamination is a possibility, but ruled out by the authors of both studies. Likewise, we must assume similar underlying stellar properties in all these samples. Fortunately, this assumption has been found to hold previously for these regions (Ansdell et al. 2016; Cieza et al. 2018), and we do not expect this to have a significant effect.
Second, previous CN observations have typically targeted the lines. Specifically, both Guilloteau et al. (2013) and Reboussin et al. (2015) quote integrated fluxes for the , components, which need to be related to the transition observed here. The CN -ratio is partially dependent on the disk (temperature) structure. Based on the grid of models discussed in Cazzoletti et al. (2018), this ratio is found to vary between 1.1 and 2.1, depending on the disk flaring angle and scale height, but only weakly on mass. For IM Lup, a detailed model of the disk structure exists, based on both gas and dust observations (Cleeves et al. 2016). For this disk, with flaring angle and scale height , we can infer a scaling ratio of 1.4, and an flux of Jy km s-1.
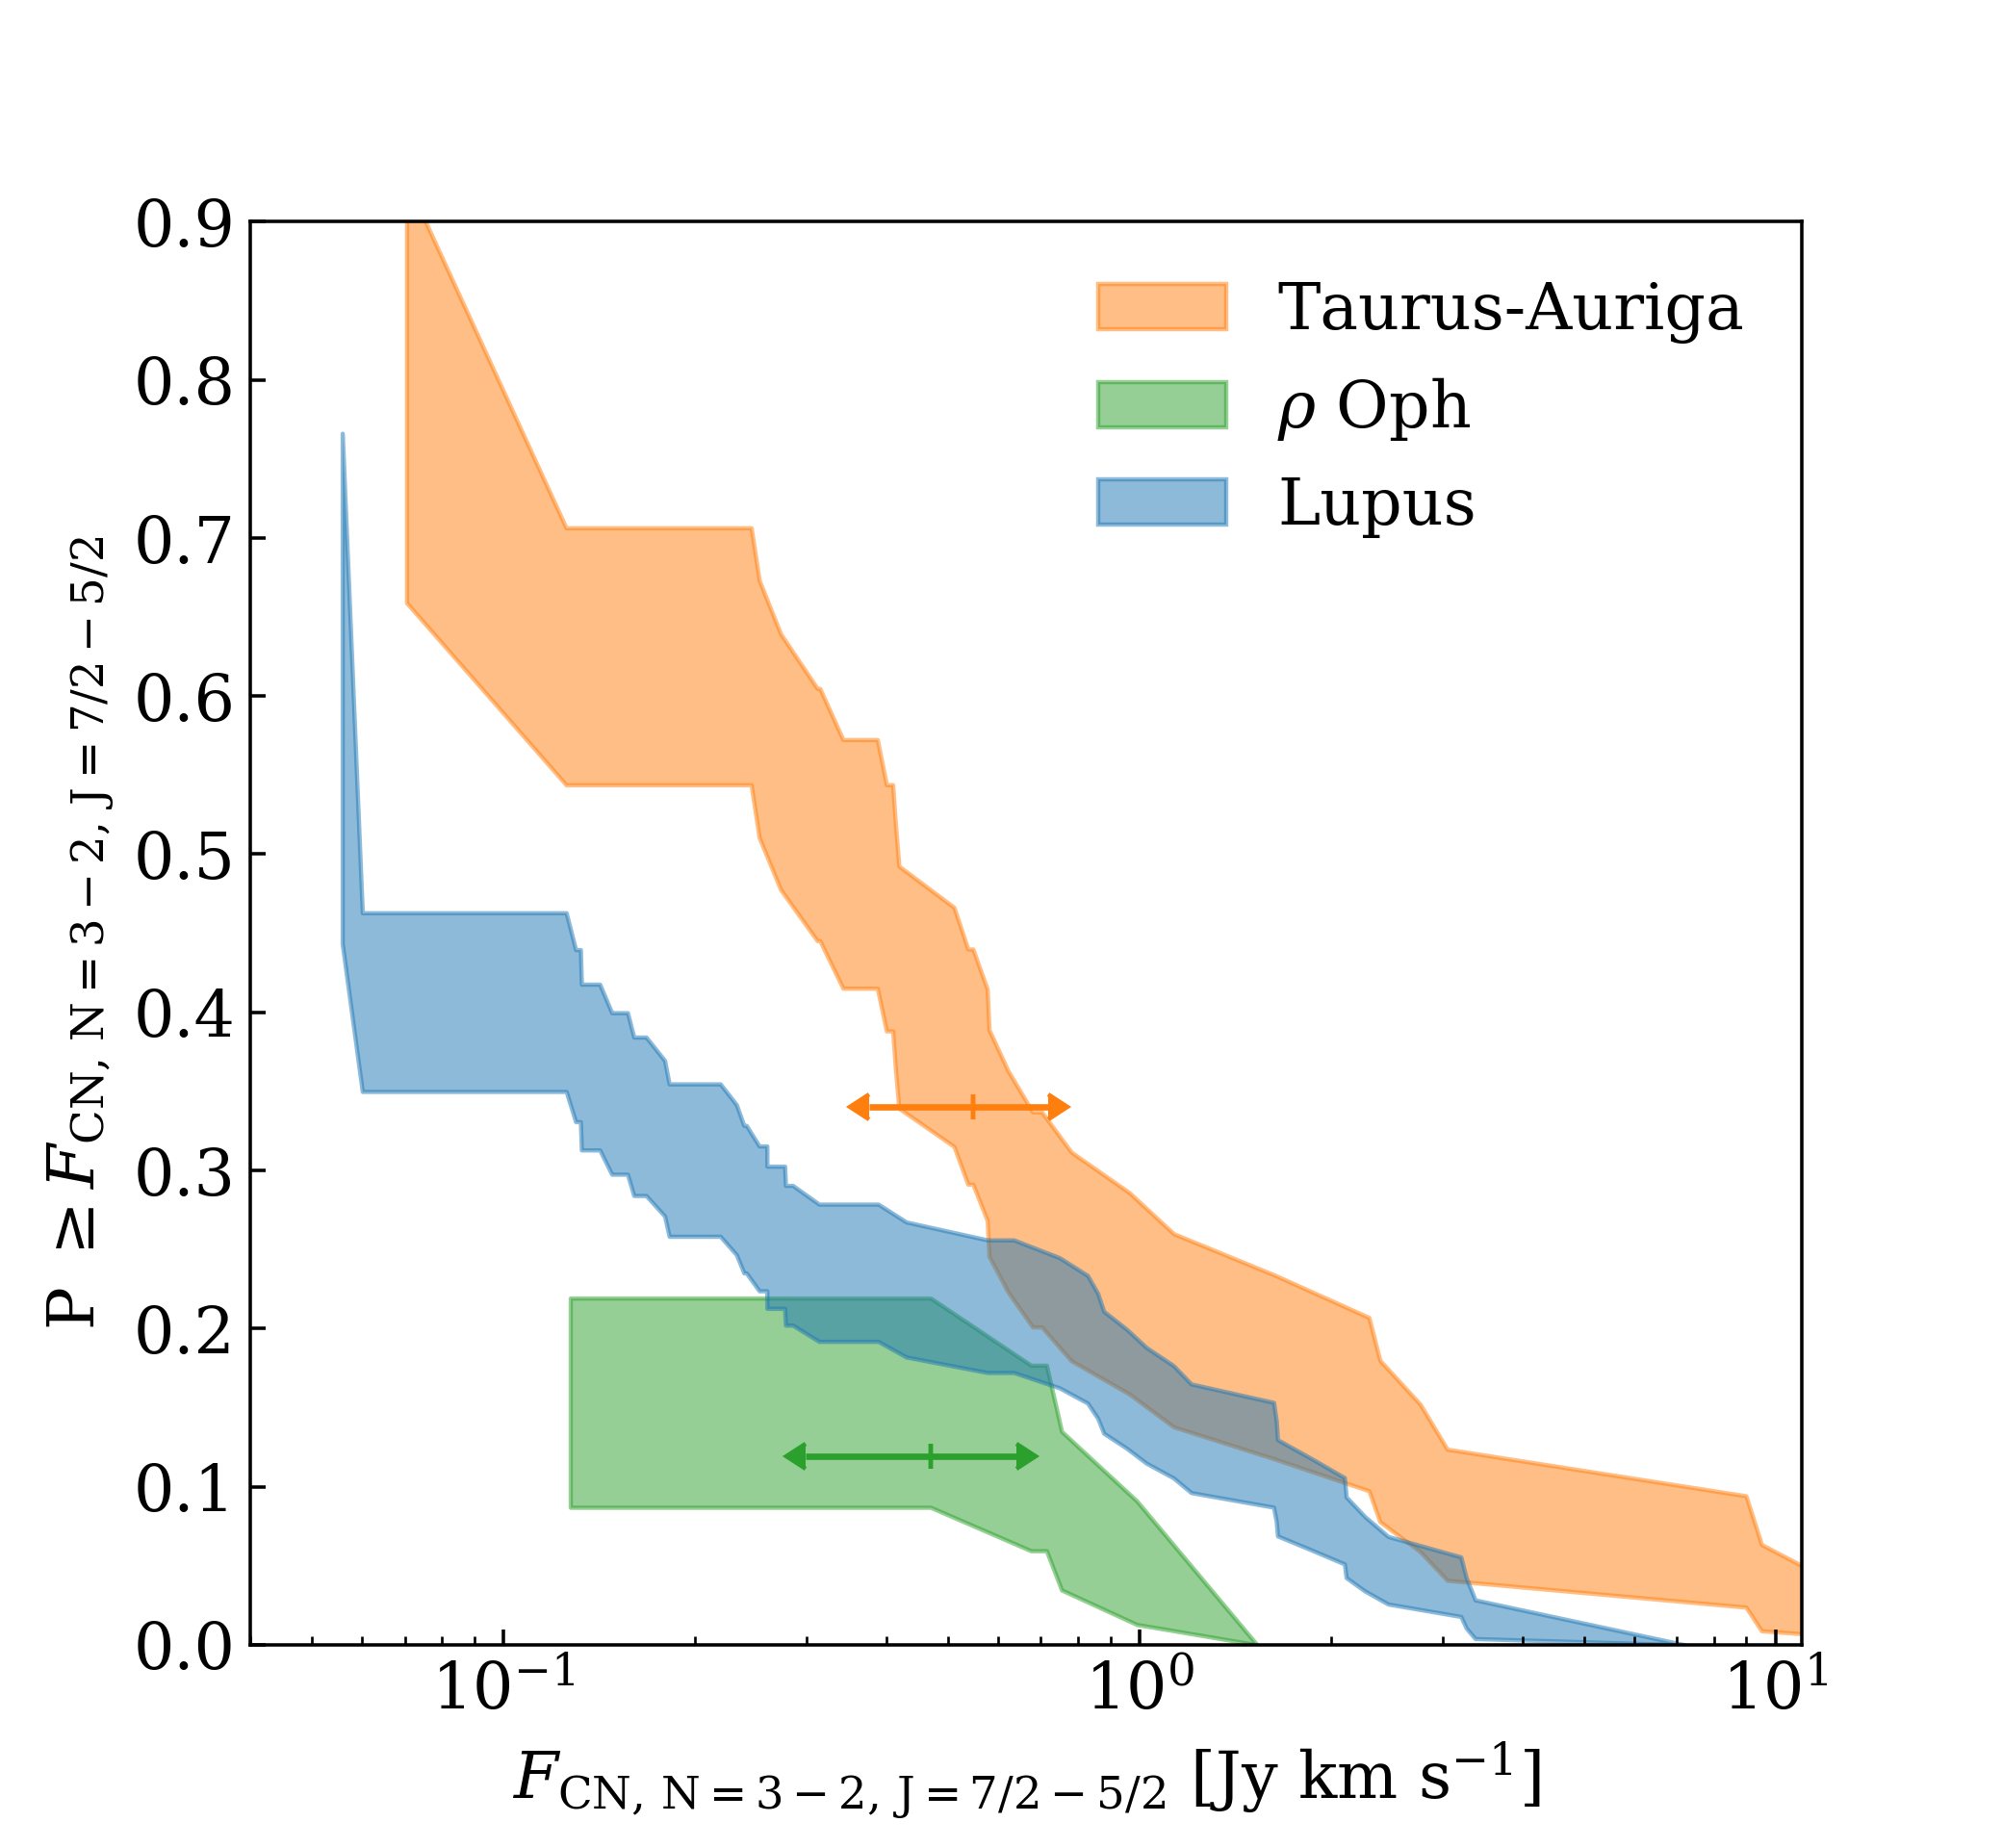
Since such detailed models are not generally available, a single scaling factor was used here to obtain estimated CN fluxes from these surveys, assuming an intermediate value of 1.6. Where appropriate, the typical spread of values introduced by this assumption is indicated in the Figures by arrows to either side. It is important to note that – while some transition disks are included – these were not included in the models used to derive the flux ratios used here. However, transition disks with large inner cavities are rare enough (making up of the Lupus disks van der Marel et al. 2018) that we do not expect this to significantly affect our results.
The results of three different CN surveys are shown in Figure 2. Using a logrank test (applicable to unbiased data with upper limits), we cannot identify a significant difference in the CN flux distribution between the disks in Lupus (this survey) and Taurus-Auriga (Guilloteau et al. 2013) () if we use as the rejection criterium, and the difference becomes significant only if we take an ) flux ratio of 1.1. Taurus-Auriga seems to be relatively richer in intermediate-luminosity disks, which drive most of this trend. It is however possible that the disks sampled in the Guilloteau et al. (2013) survey are biased towards those disks in which both continuum and lines are more readily detected, leading to apparently brighter disks in CN. This seems to be the case for the Ophiuchus sample; comparing it to the resolved ALMA images in Cieza et al. (2018) reveals a trend towards more radially extended disks, with only two objects included in the CN survey being unresolved. In Taurus-Auriga, such a bias would lead to the difference with Lupus becoming less significant, especially at lower CN luminosities. Comparing the Lupus CN results to those of the Oph disk sample presented in Reboussin et al. (2015), however, the difference in flux distributions is always significant: Oph has fainter overall CN emission, and a lower detection rate. A bias towards more radially extended disks in this region would make the lack of CN emission more significant, since we would expect such disks to be brighter rather than fainter on average (see Section 3.3.1, below).
3.3 CN models in the context of the Lupus population
The Lupus disk survey is uniquely suited to testing models of CN production in protoplanetary disks, both by looking at individual resolved objects and by comparing the full sample properties to the results from a large grid of models. In this Section, this model grid is generated by the DALI physical-chemical disk code, which produces chemical abundances, performs non-LTE excitation calculations, and produces ray-traced images. As mentioned, Cazzoletti et al. (2018) find several key results for CN emission in disks in their models made with this version of the code: first, an increasing integrated CN flux with increasing disk size; second, a strong dependence of flux on the UV radiation field of stars; and a relatively weak dependence on total disk mass or volatile carbon abundance.
Here, a small DALI grid is used for comparison with our data, and the results of two previous surveys by Guilloteau et al. (2013) and Reboussin et al. (2015). Since both the Lupus data and the previous surveys give fine-structure fluxes, we used CN the collisional rates from Lique et al. (2010), and raytrace the and lines. The grid is constructed using the standard viscous disk model of Lynden-Bell & Pringle (1974) as used, for example, in Andrews et al. (2011), and samples disks with critical radii in the gas disk between 15 – 60 AU, and between in total disk mass. The stellar spectrum is given by a 4000 K black-body spectrum emitted by a star; the grid includes models with UV excess (spanning two orders of magnitude in flux) as well as models without excess UV added to this stellar spectrum. The disk structure does not vary in these models: the surface density parameter , while the scale height at 60 AU and the flaring angle . While the CN flux is sensitive to these parameters, their effect is smaller than that of the varying UV luminosity used in these models (Cazzoletti et al. 2018), especially since the variation in flaring angles seems to be fairly small (Bustamante et al. 2015). Although our disks are not in hydrostatic equilibrium, the range of scale heights used here generally reproduces the observed SEDs of disks (van der Marel et al. 2016b).
In order to compare the models to the observational data, several assumptions must be made. First, a disk (gas) mass tracer is needed. Since 13CO is not be a good tracer of the total gas mass, we will assume that the gas-to-dust ratio of these disks is throughout, and that the dust is optically thin, leading to the same approximation used in Ansdell et al. (2016):
| (1) |
where the factor 100 comes from the gas-to-dust ratio (assumed to be constant and equal to the ISM value), is the m flux, and is the distance (typically around 160 pc, and taken from the Gaia DR2 results for the individual objects in the sample). is the grain opacity (assumed to be cm2 g-1 at 1000 GHz with a power-law index of (Beckwith et al. 1990)). The used here is 20 K.
The assumed initial abundances of carbon and oxygen are also potentially important, in the context of volatile carbon depletion found in protoplanetary disks (e.g. Bergin et al. 2013; Favre et al. 2013; McClure et al. 2016). However, for CN this is less relevant. For all disk models discussed here, the initial overall abundances are the same as those used in the default models of Cazzoletti et al. (2018), since the CN abundance was found not to be sensitive to the depletion of volatile C and O.
A final important assumption is the strength of the UV radiation field. As Cazzoletti et al. (2018) discuss, CN is very sensitive to the local abundance of excited molecular hydrogen , which in turn is sensitive to FUV line pumping. However, typically, no UV spectra exist for these sources (excepting RU Lup and RY Lup Ardila et al. 2013; France et al. 2014; Arulanantham et al. 2018). We use a range of UV luminosities, where we focus on the region between nm. In that wavelength range, the UV luminosities sampled are between for models with a UV excess, versus for models with a purely stellar radiation field. Using a rough approximation, this UV field can be linked to the accretion rate onto the star. Following Kama et al. (2016), the UV is produced from the accretion rate, the stellar mass, and a 10000 K blackbody spectrum for the accreting material. Using this formulation an accretion rate of yr-1 corresponds to a UV luminosity of , but as will be shown below, this may be uncertain by as much as an order of magnitude.
3.3.1 Linking CN to disk radii
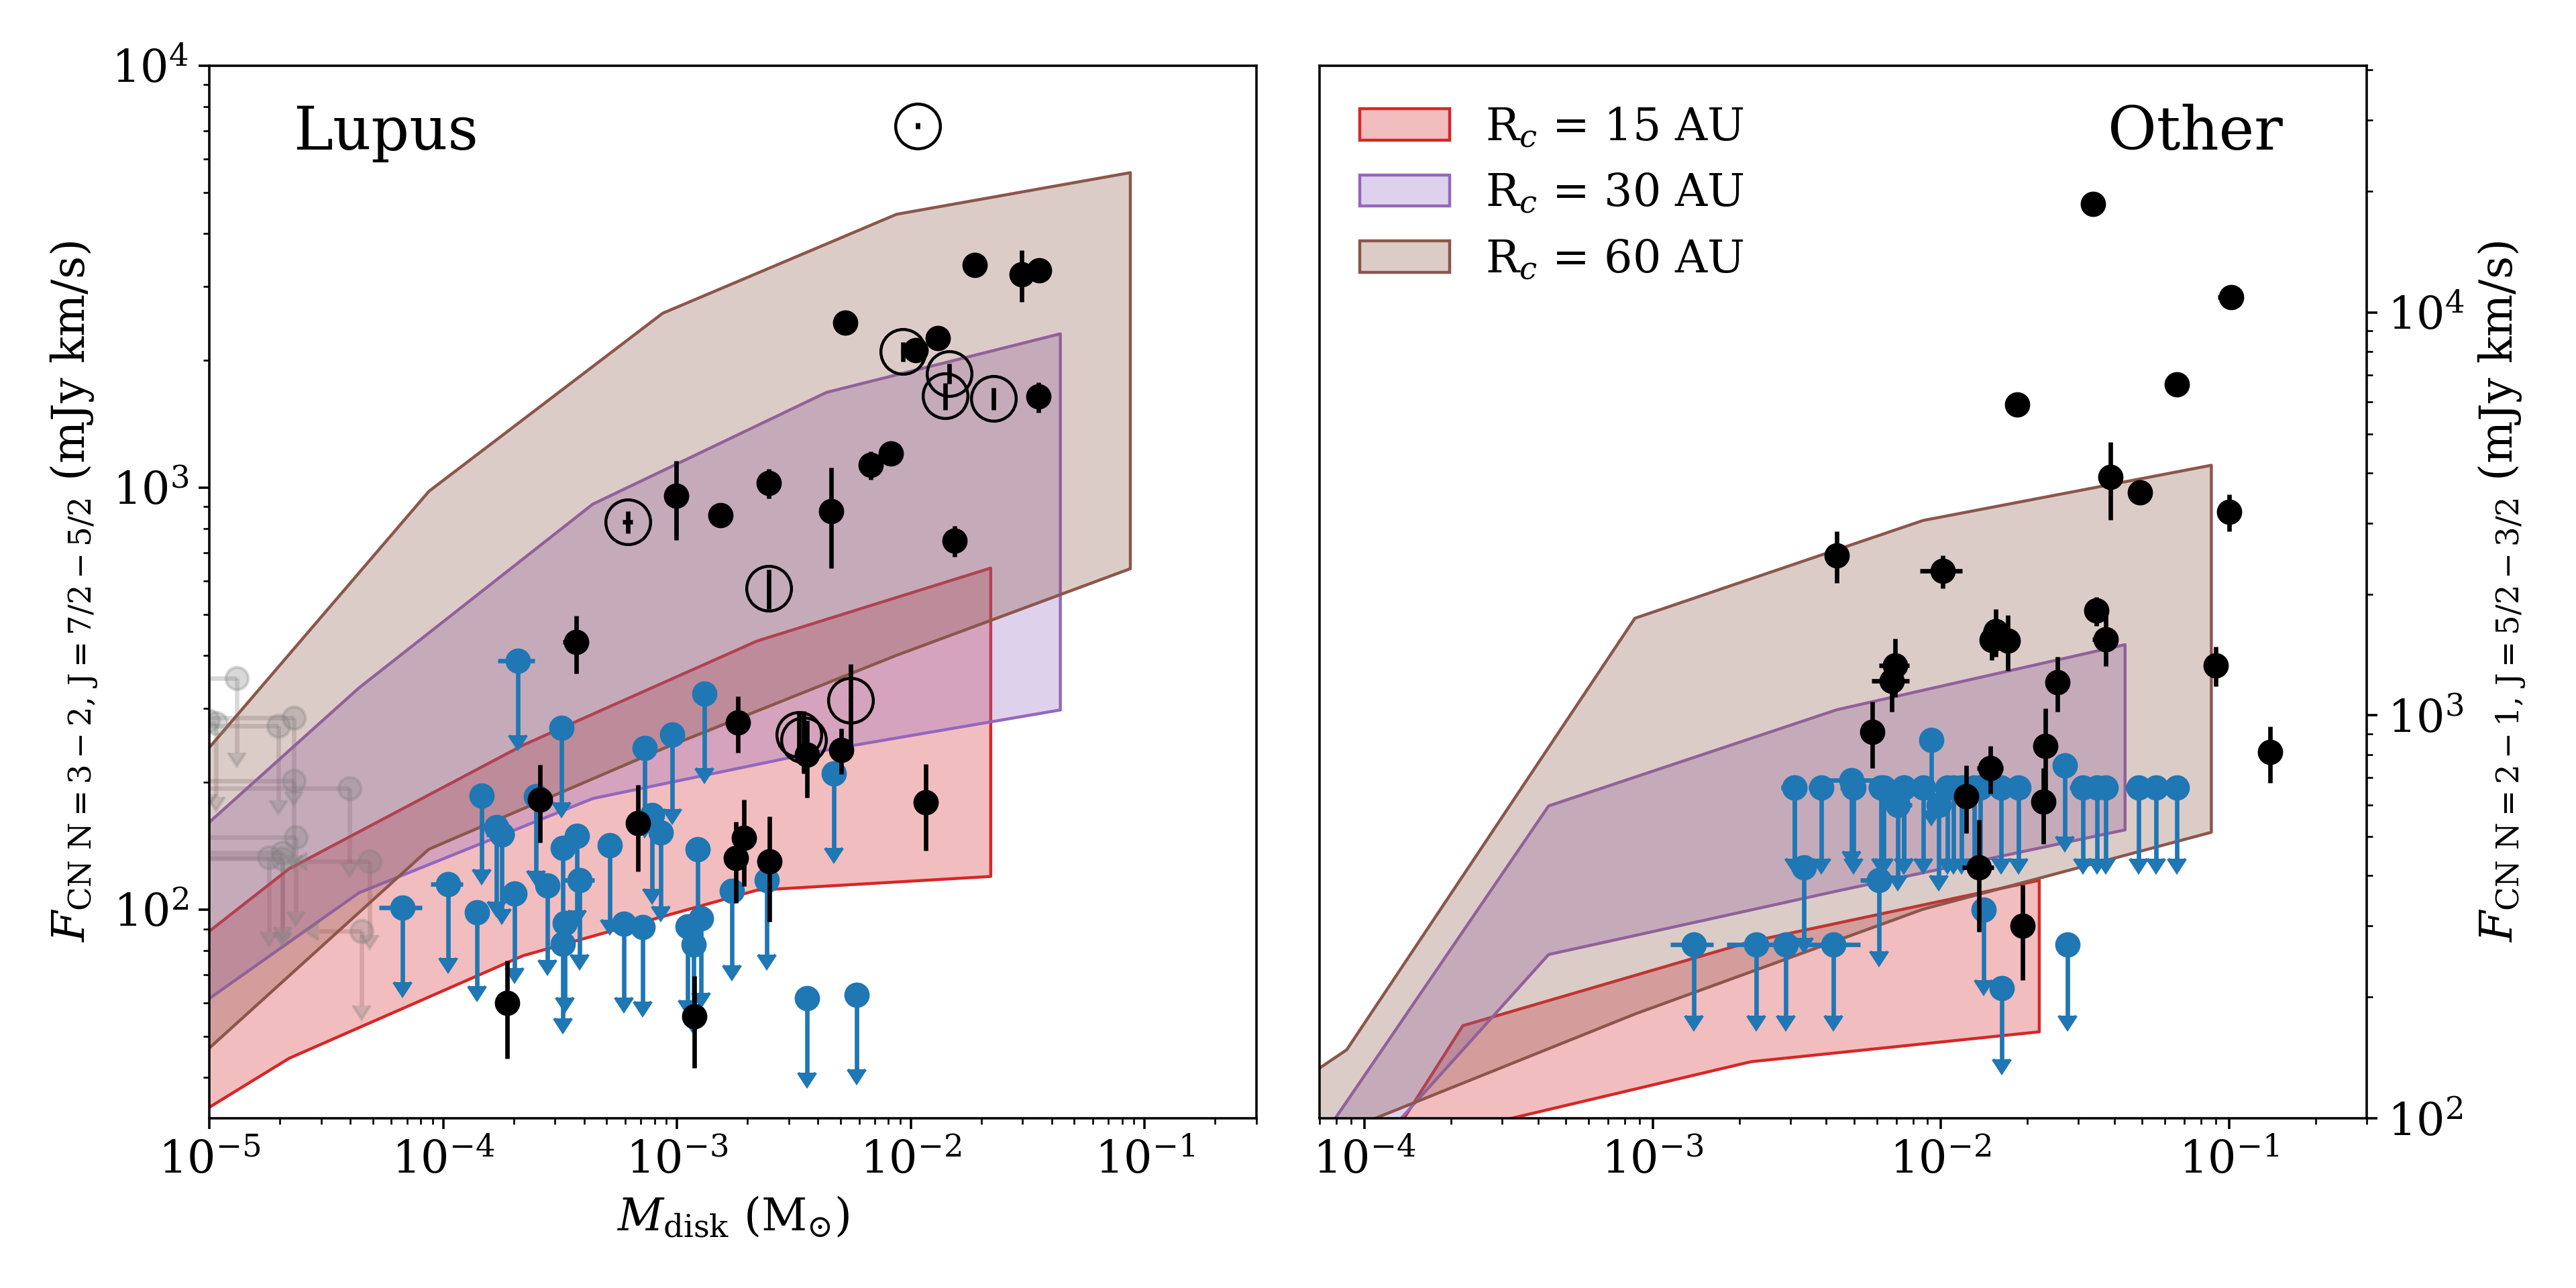
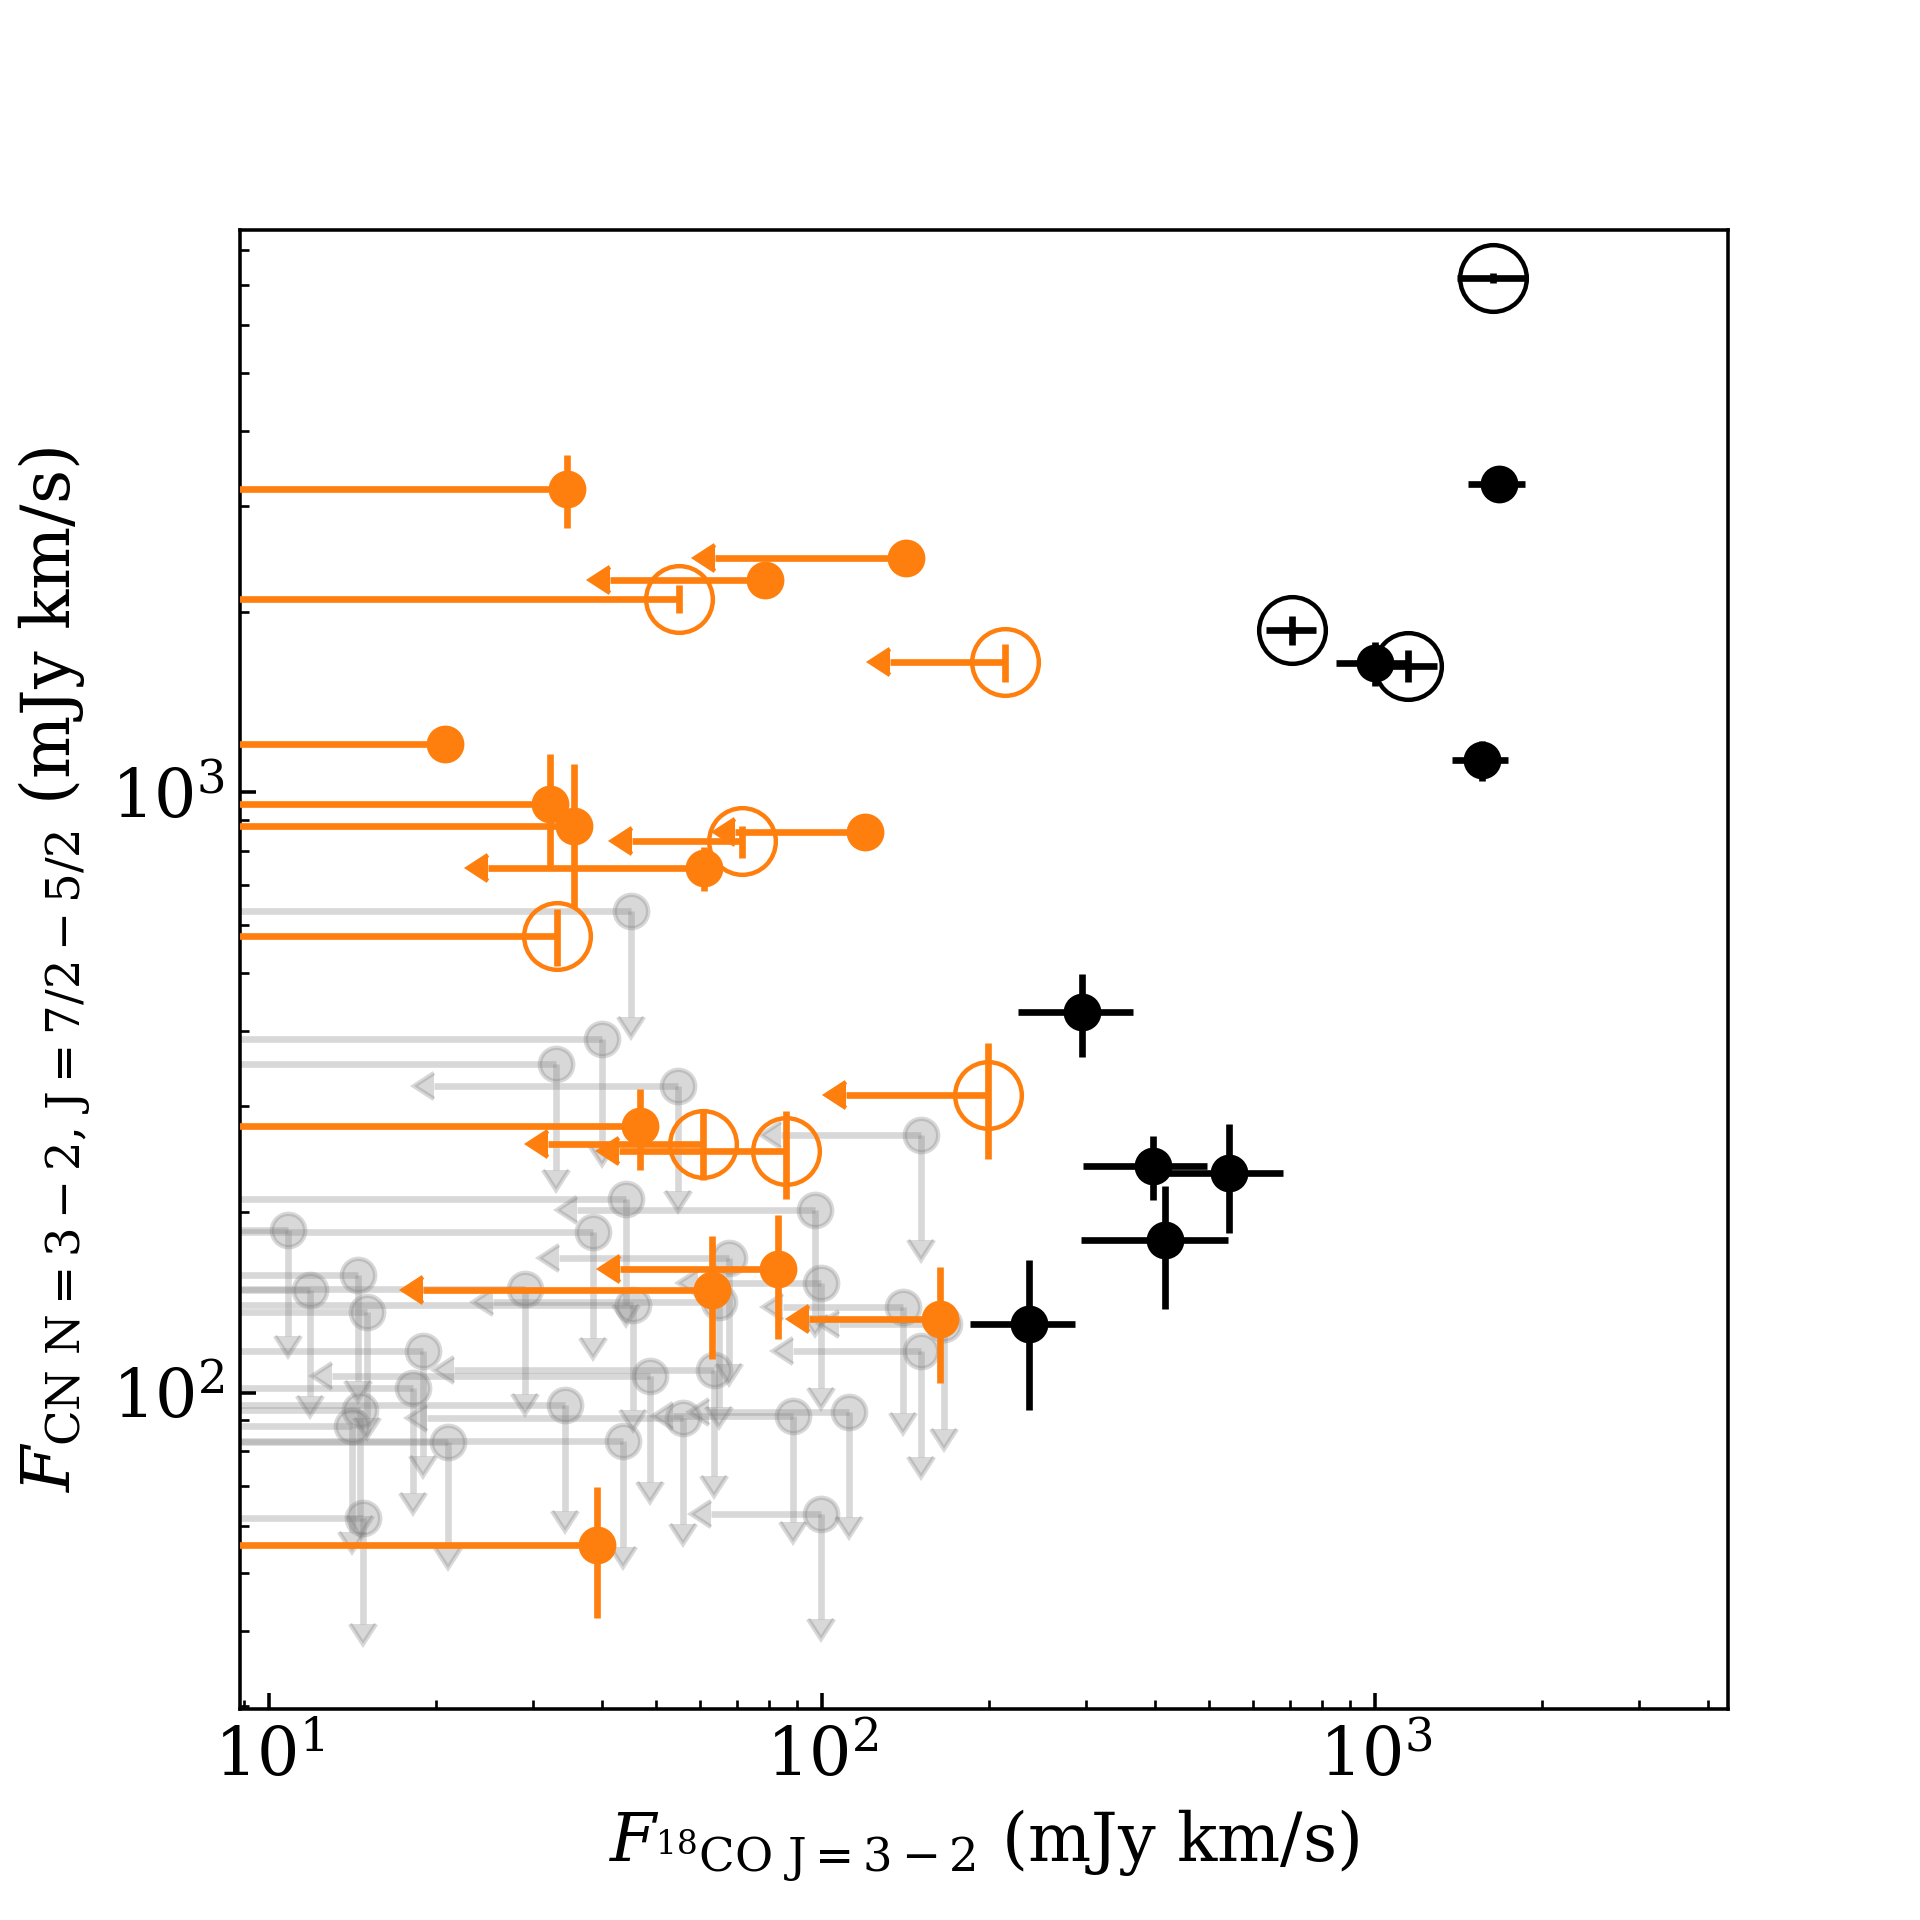
In Figure 3, the model grid is overplotted to both the Lupus data and the previous large samples presented in Guilloteau et al. (2013) and Reboussin et al. (2015), after raytracing the appropriate transitions. The left panel shows the Lupus data and the corresponding CN transition from the models; on the right panel the transition fluxes are shown. In this comparison, no assumptions on the line ratios have to be made, since we directly compare to the model fluxes. The colored areas show models with different UV luminosities and disk masses at given . From this Figure, several conclusions can be drawn.
First, the large and unbiased disk population sampled in Lupus makes it apparent that for many of these disks the critical radius must be small, even less than 15 AU, in order to reproduce the observed low CN fluxes. This result holds even when considering the impact of large variations in UV luminosity, and when considering variations in disk structure, as in Cazzoletti et al. (2018): the faintest detections and non-detections require compact gas disks. In the DALI models, the physical cause behind this strong effect is that, as the disk becomes more compact, the radius at which the CN emission would otherwise peak is located further out than the bulk of the disk material: the disk runs out before the CN can form in significant quantities.
Meanwhile, in line with Guilloteau & Dutrey (1998) and the model results in Cazzoletti et al. (2018), the brightest disks in CN clearly require large radii, and values of larger than AU, suggesting that the observed Taurus sample contains more massive, but also more radially extended sources than are found, on average, in Lupus.
The observational determination of a disk’s from resolved images is challenging, both for line- and continuum data. Even at high , emission below the noise level may be missed. Moreover, gas- and continuum-derived outer radii for the same disk can differ: if a gas line is optically thick it may be detected further out than the dust (by a factor up to 3) (Facchini et al. 2017). The inward drift and growth of dust grains further change the appearance of the continuum, while leaving the gas unaffected. Both of these effects have been shown in the Lupus star forming region (Ansdell et al. 2018, Trapman et al. in prep.). While a population of unresolved or marginally resolved dust disks had previously been identified in the uniformly deep continuum survey, our CN models allow us to conclude that their underlying density structure also has a compact gas surface density distribution when compared to well-studied disks like IM Lup (which has an of 60 AU) or TW Hya ( AU) (Cleeves et al. 2016; Huang et al. 2018).
3.3.2 CN as a UV tracer
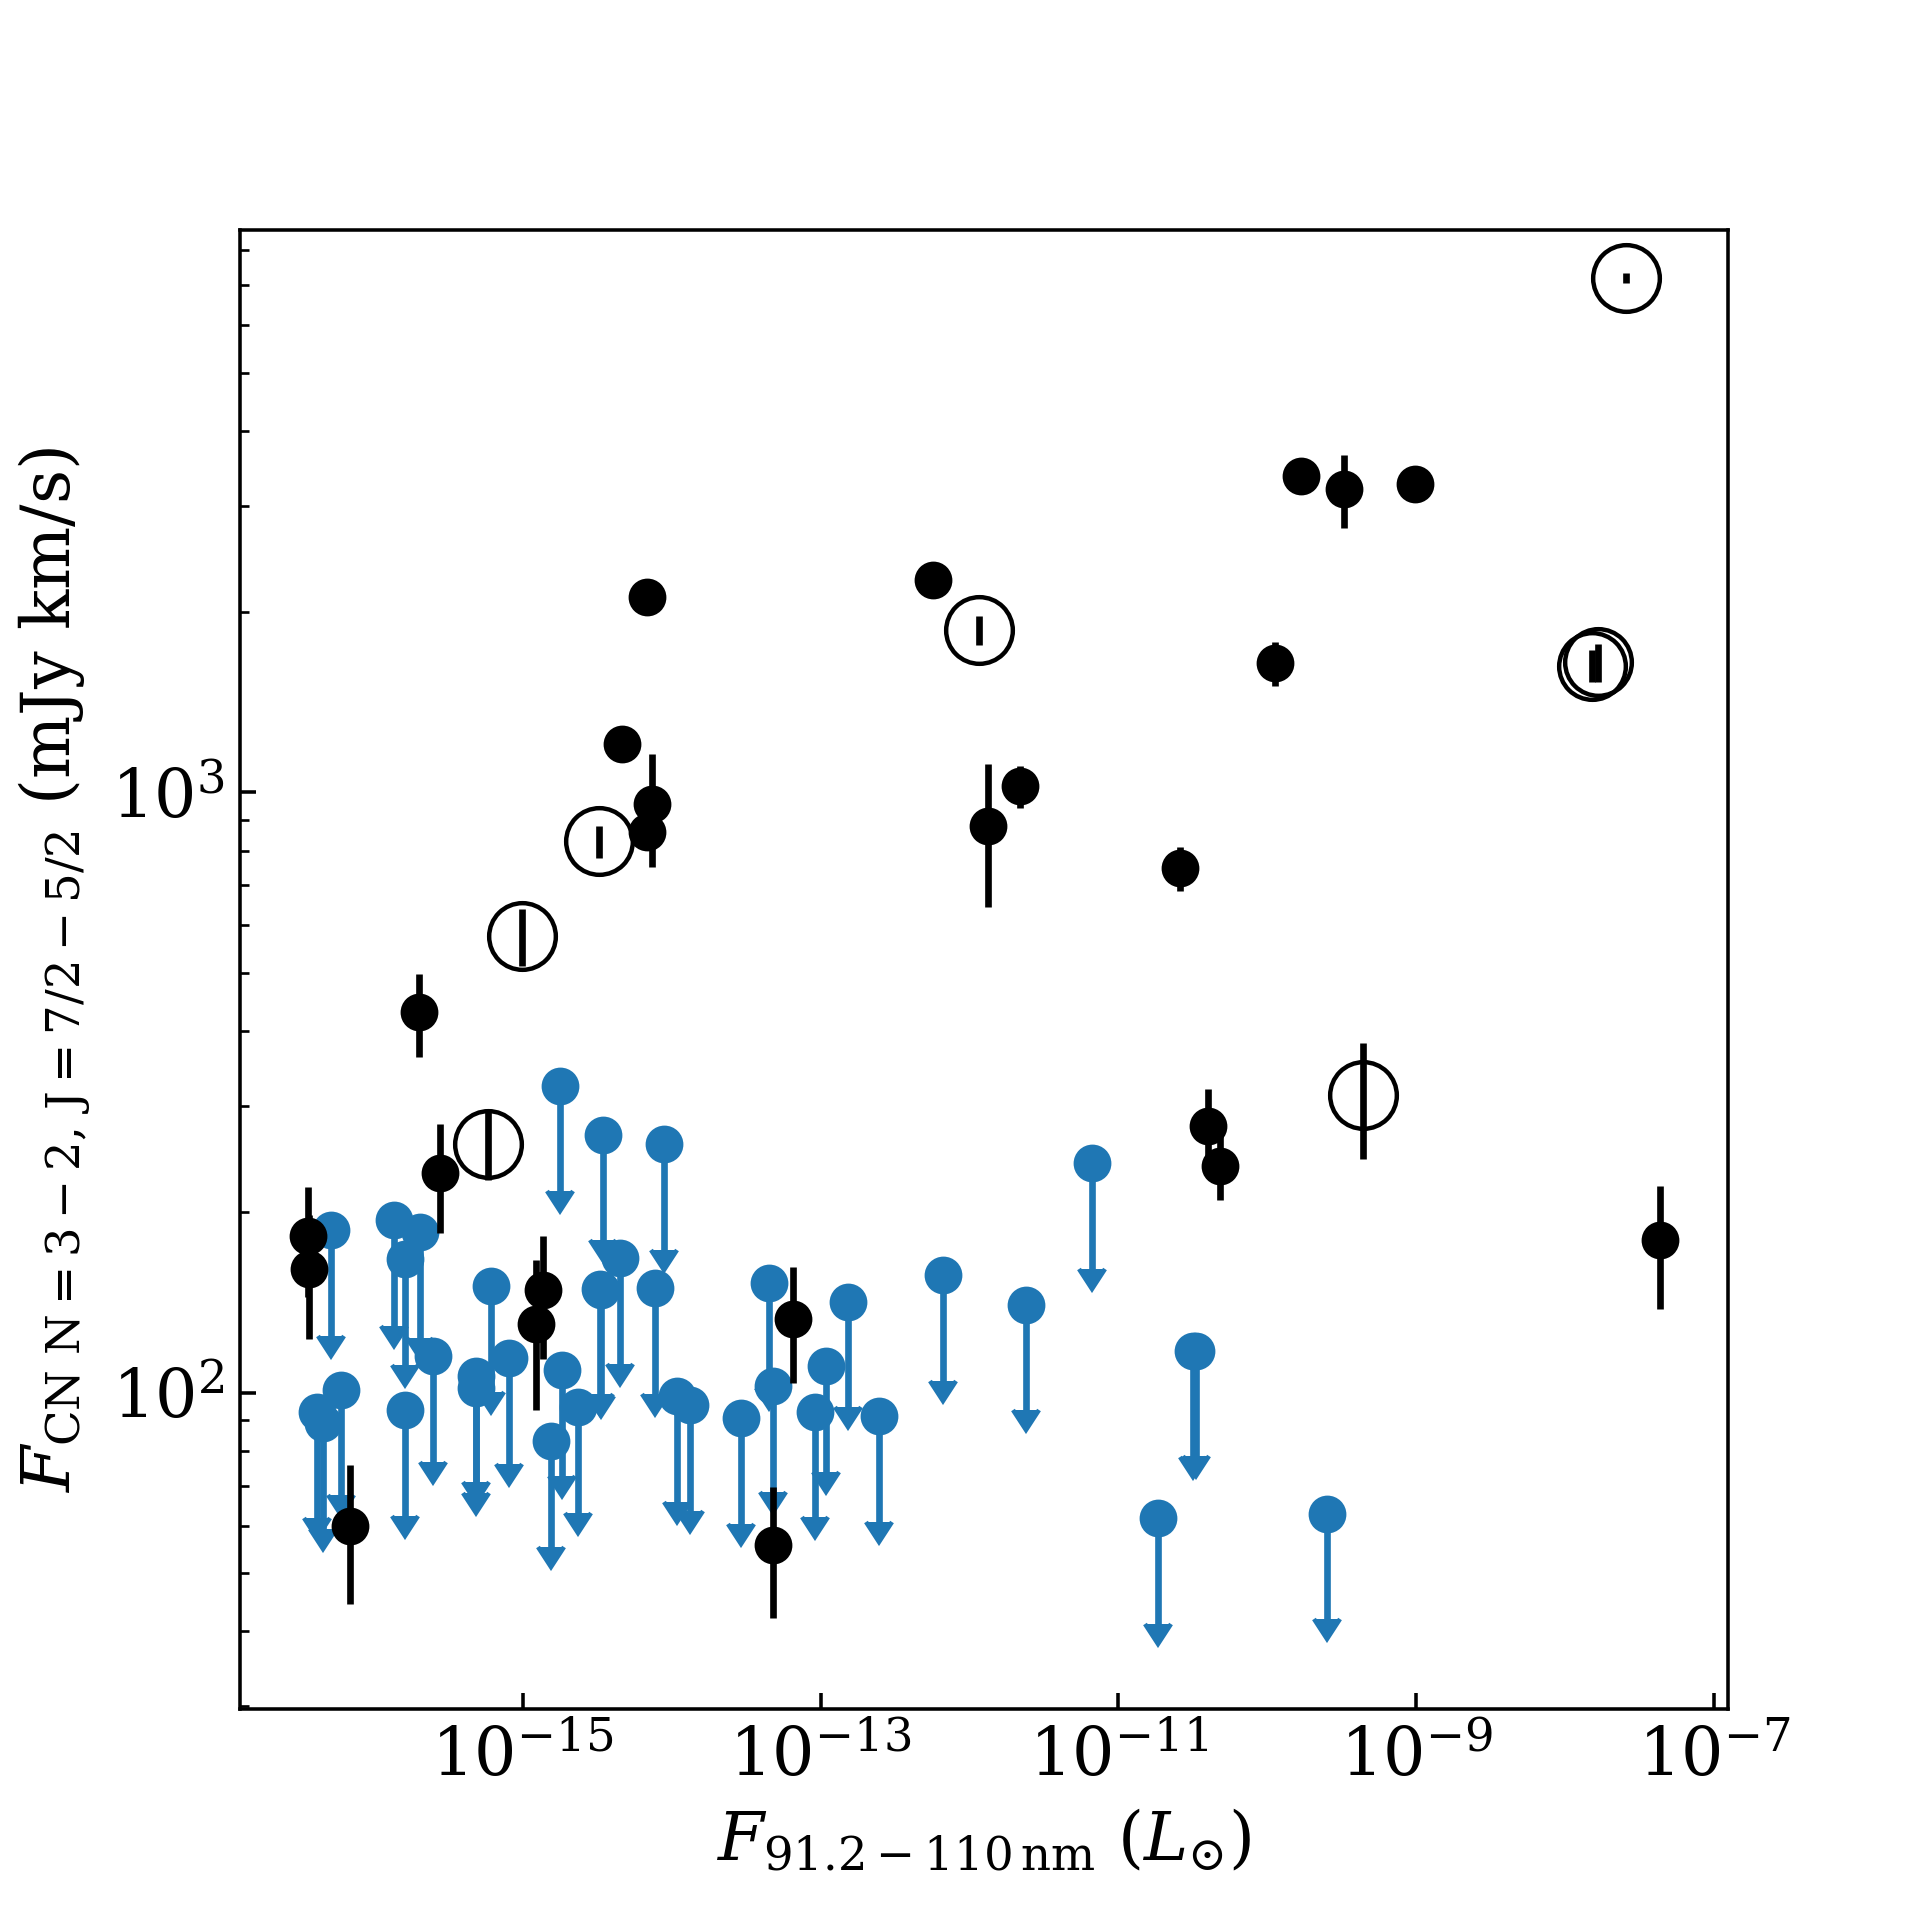
The models run in Cazzoletti et al. (2018) and the grid used here both predict stronger CN emission from disks around stars that are more luminous in the UV, due to the sensitivity of the CN chemical network to the abundance of . With the (known) stellar properties and accretion rates for the disk-bearing stars in Lupus, and the approximation for the UV excess introduced above for the DALI models, we can calculate a nm UV flux for each object in the sample. In Figure 4, these UV fluxes are compared to the observed CN flux. It is clear that, in contrast to the model predictions, no correlation exists between the CN flux and the UV flux estimated from the stellar flux and accretion rate, and this is confirmed by using a modified Kendall -test.
This apparently contradictory result, however, can be reconciled with the model predictions. The accretion rates used to infer the UV flux of these disks are accurate up to a factor of a few, being based on the Balmer continuum excess between nm and optical line emission (Alcalá et al. 2017). More importantly, while the total excess UV should be proportional to the accretion rate , it is not only emitted as continuum but also as line emission, which is more difficult to constrain (e.g. Herczeg et al. 2004; Bergin et al. 2004). In particular, the lines between nm are relevant, since they may overlap with UV pumping lines for to create via UV pumping. From previous studies of the UV lines of protoplanetary disks at these wavelengths, strong emission lines in this wavelength range have been shown to be present, and responsible for a significant fraction of UV radiation (e.g. Herczeg et al. 2005; Ardila et al. 2013; France et al. 2014).
One way to provide extra, independent information on the UV excess is to use the spatially resolved data, as opposed to the disk-integrated fluxes discussed here. This is because, as demonstrated in Figure 11 of Cazzoletti et al. (2018), the radial intensity profile of CN is also very sensitive to the UV radiation field. In the following, two disks for which CN is spatially resolved are discussed in greater detail.
4 CN images
4.1 Observations of Sz 98 and Sz 71
| PAa𝑎aa𝑎aDerived from the continuum data using the CASA imfit-task | a𝑎aa𝑎aDerived from the continuum data using the CASA imfit-task | |||||
|---|---|---|---|---|---|---|
| [mJy] | [Jy km s-1] | [Jy km s-1] | [Jy km s-1] | [∘] | [∘] | |
| Sz 71 | b𝑏bb𝑏bAffected by foreground absorption and thus a lower limit. | -37.5 | 47.0 | |||
| Sz 98 | b𝑏bb𝑏bAffected by foreground absorption and thus a lower limit. | 107.4 | -40.8 |
The targets selected for detailed discussion in this Section, Sz 98 and Sz 71, are the second and sixth brightest object in CN, respectively. These disks are particularly suited to modeling: their data have high and show clear evidence of a ring-like emission morphology, as well as well-resolved emission. Based on their continuum emission, both disks have a favorable, relatively face-on inclination ( for Sz 98, for Sz 71). The stars do not cover the peak of the spectral type distribution in Lupus, which lies between M3 and M4: Sz 71 is an M1.5 star and Sz 98 is a K7 star.
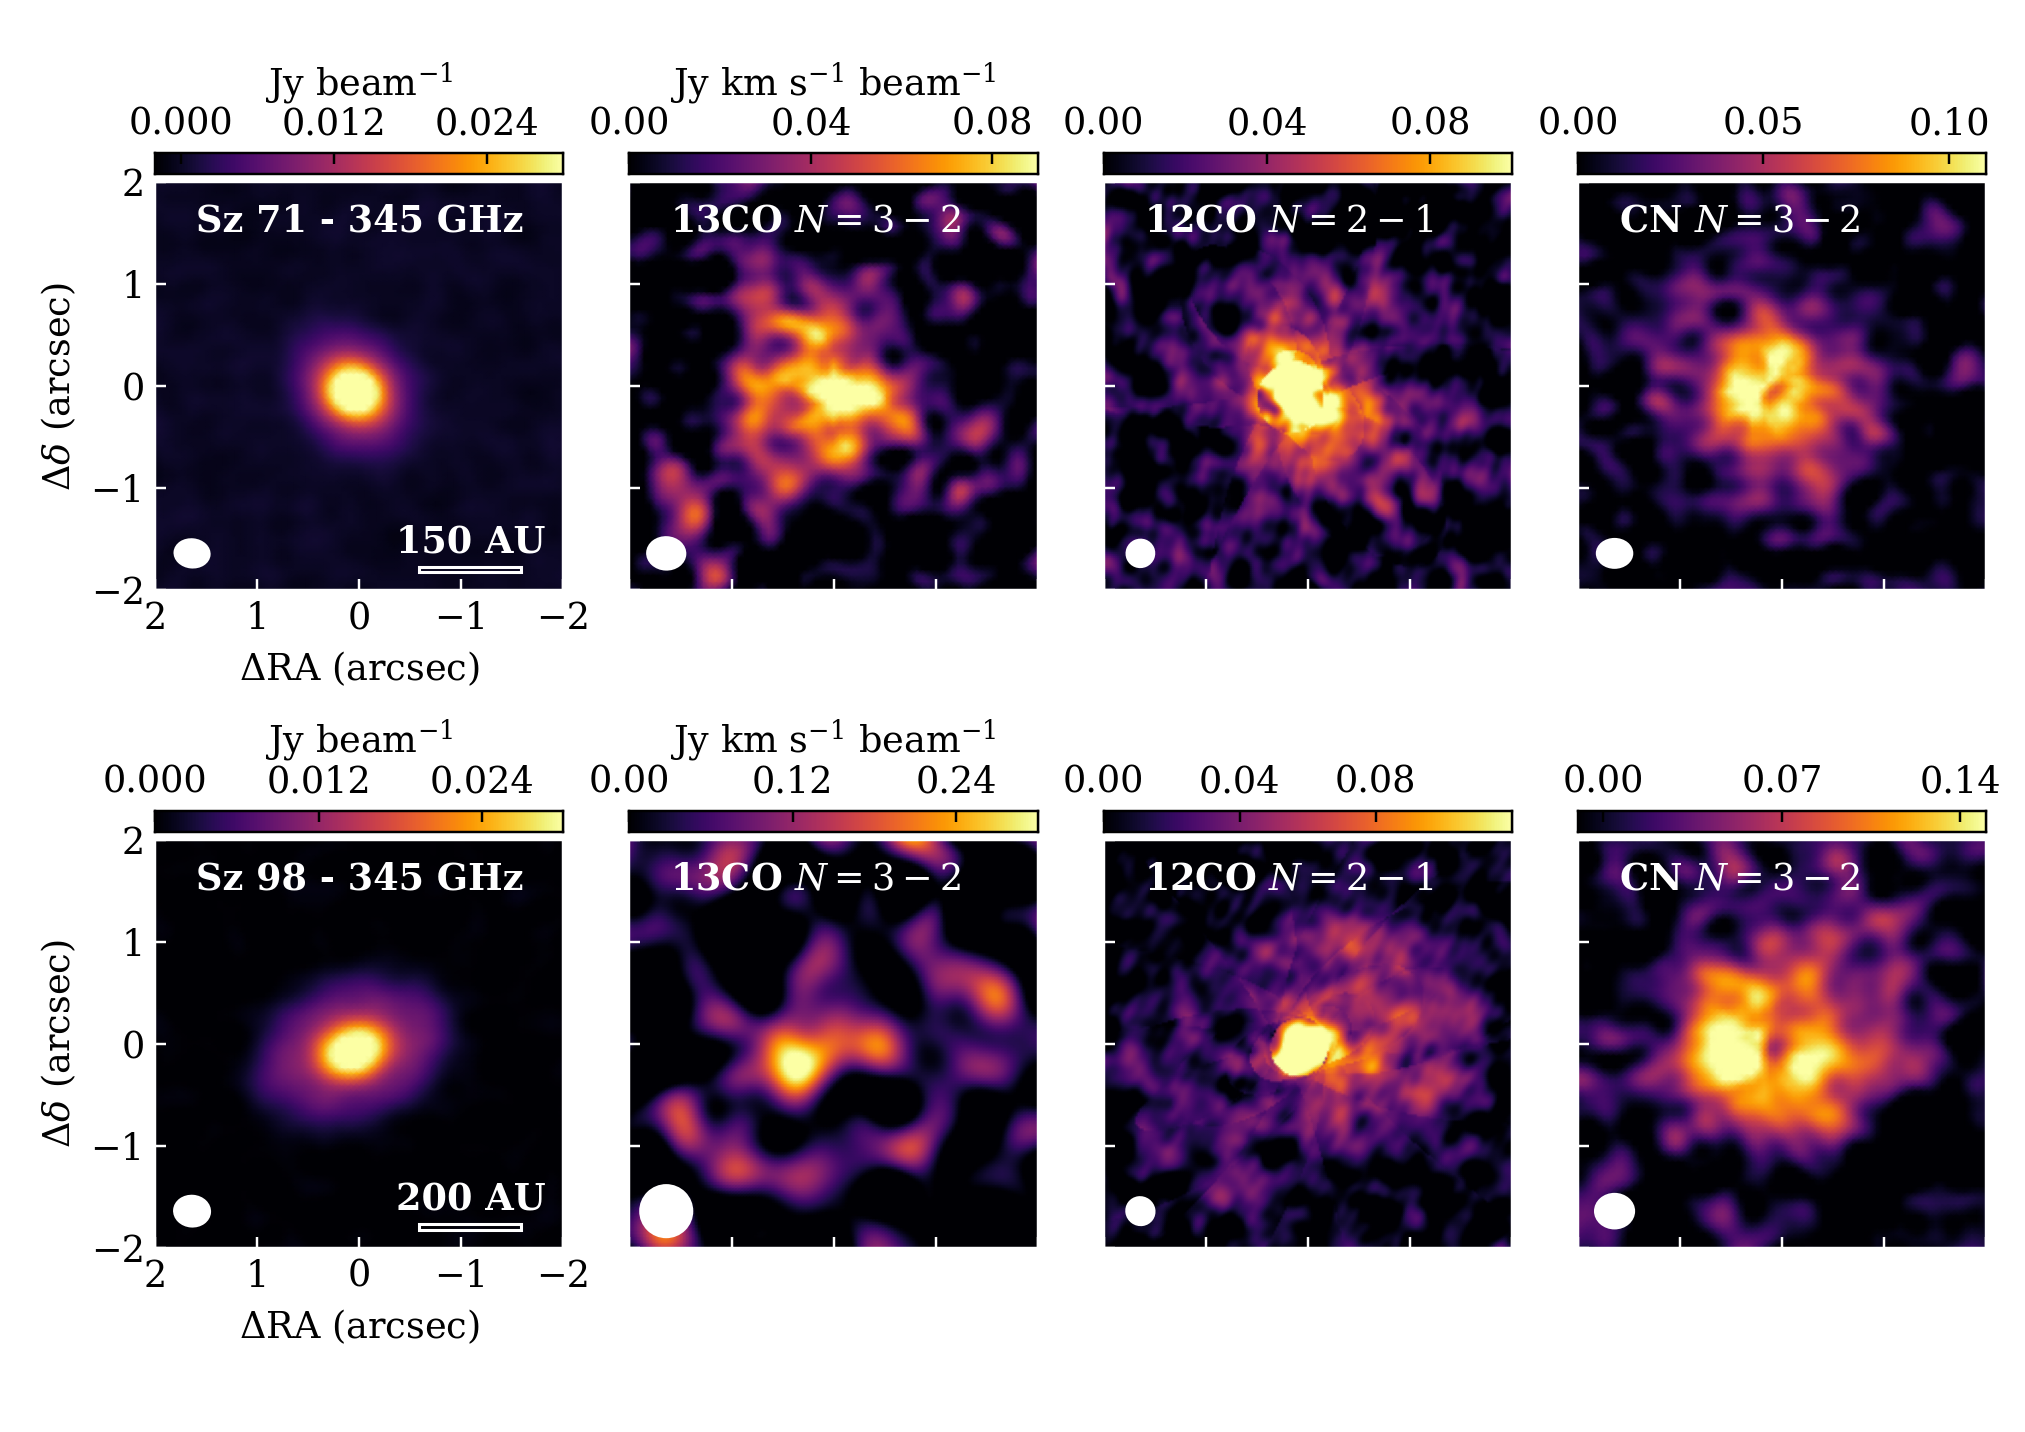
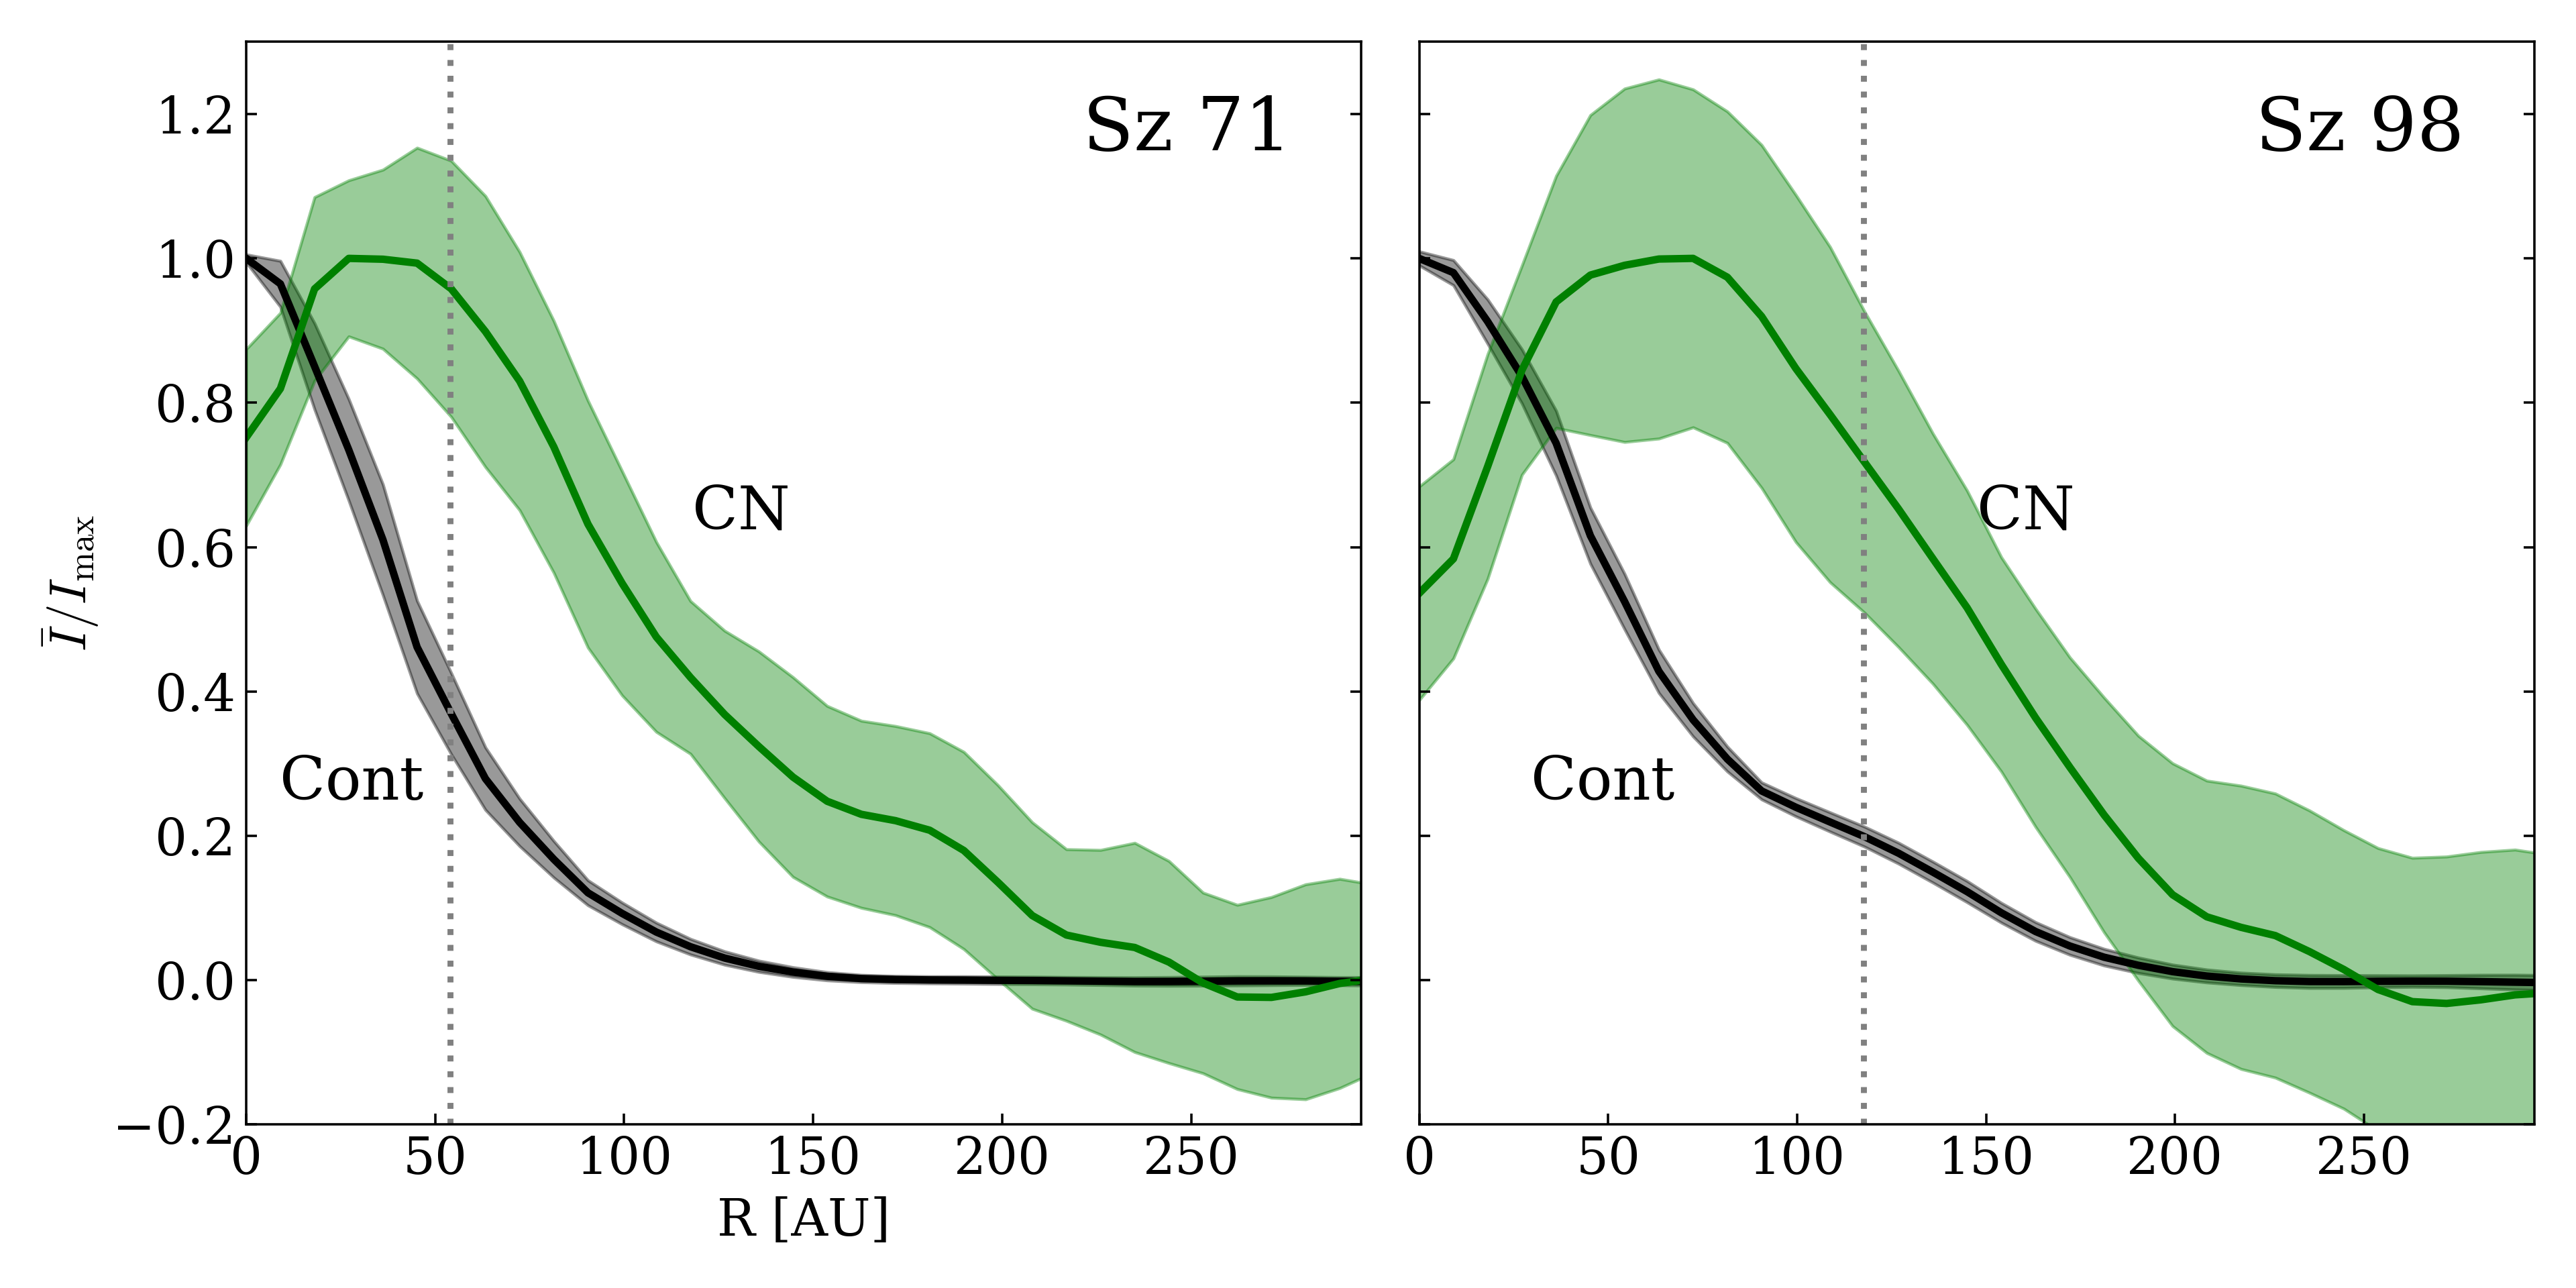
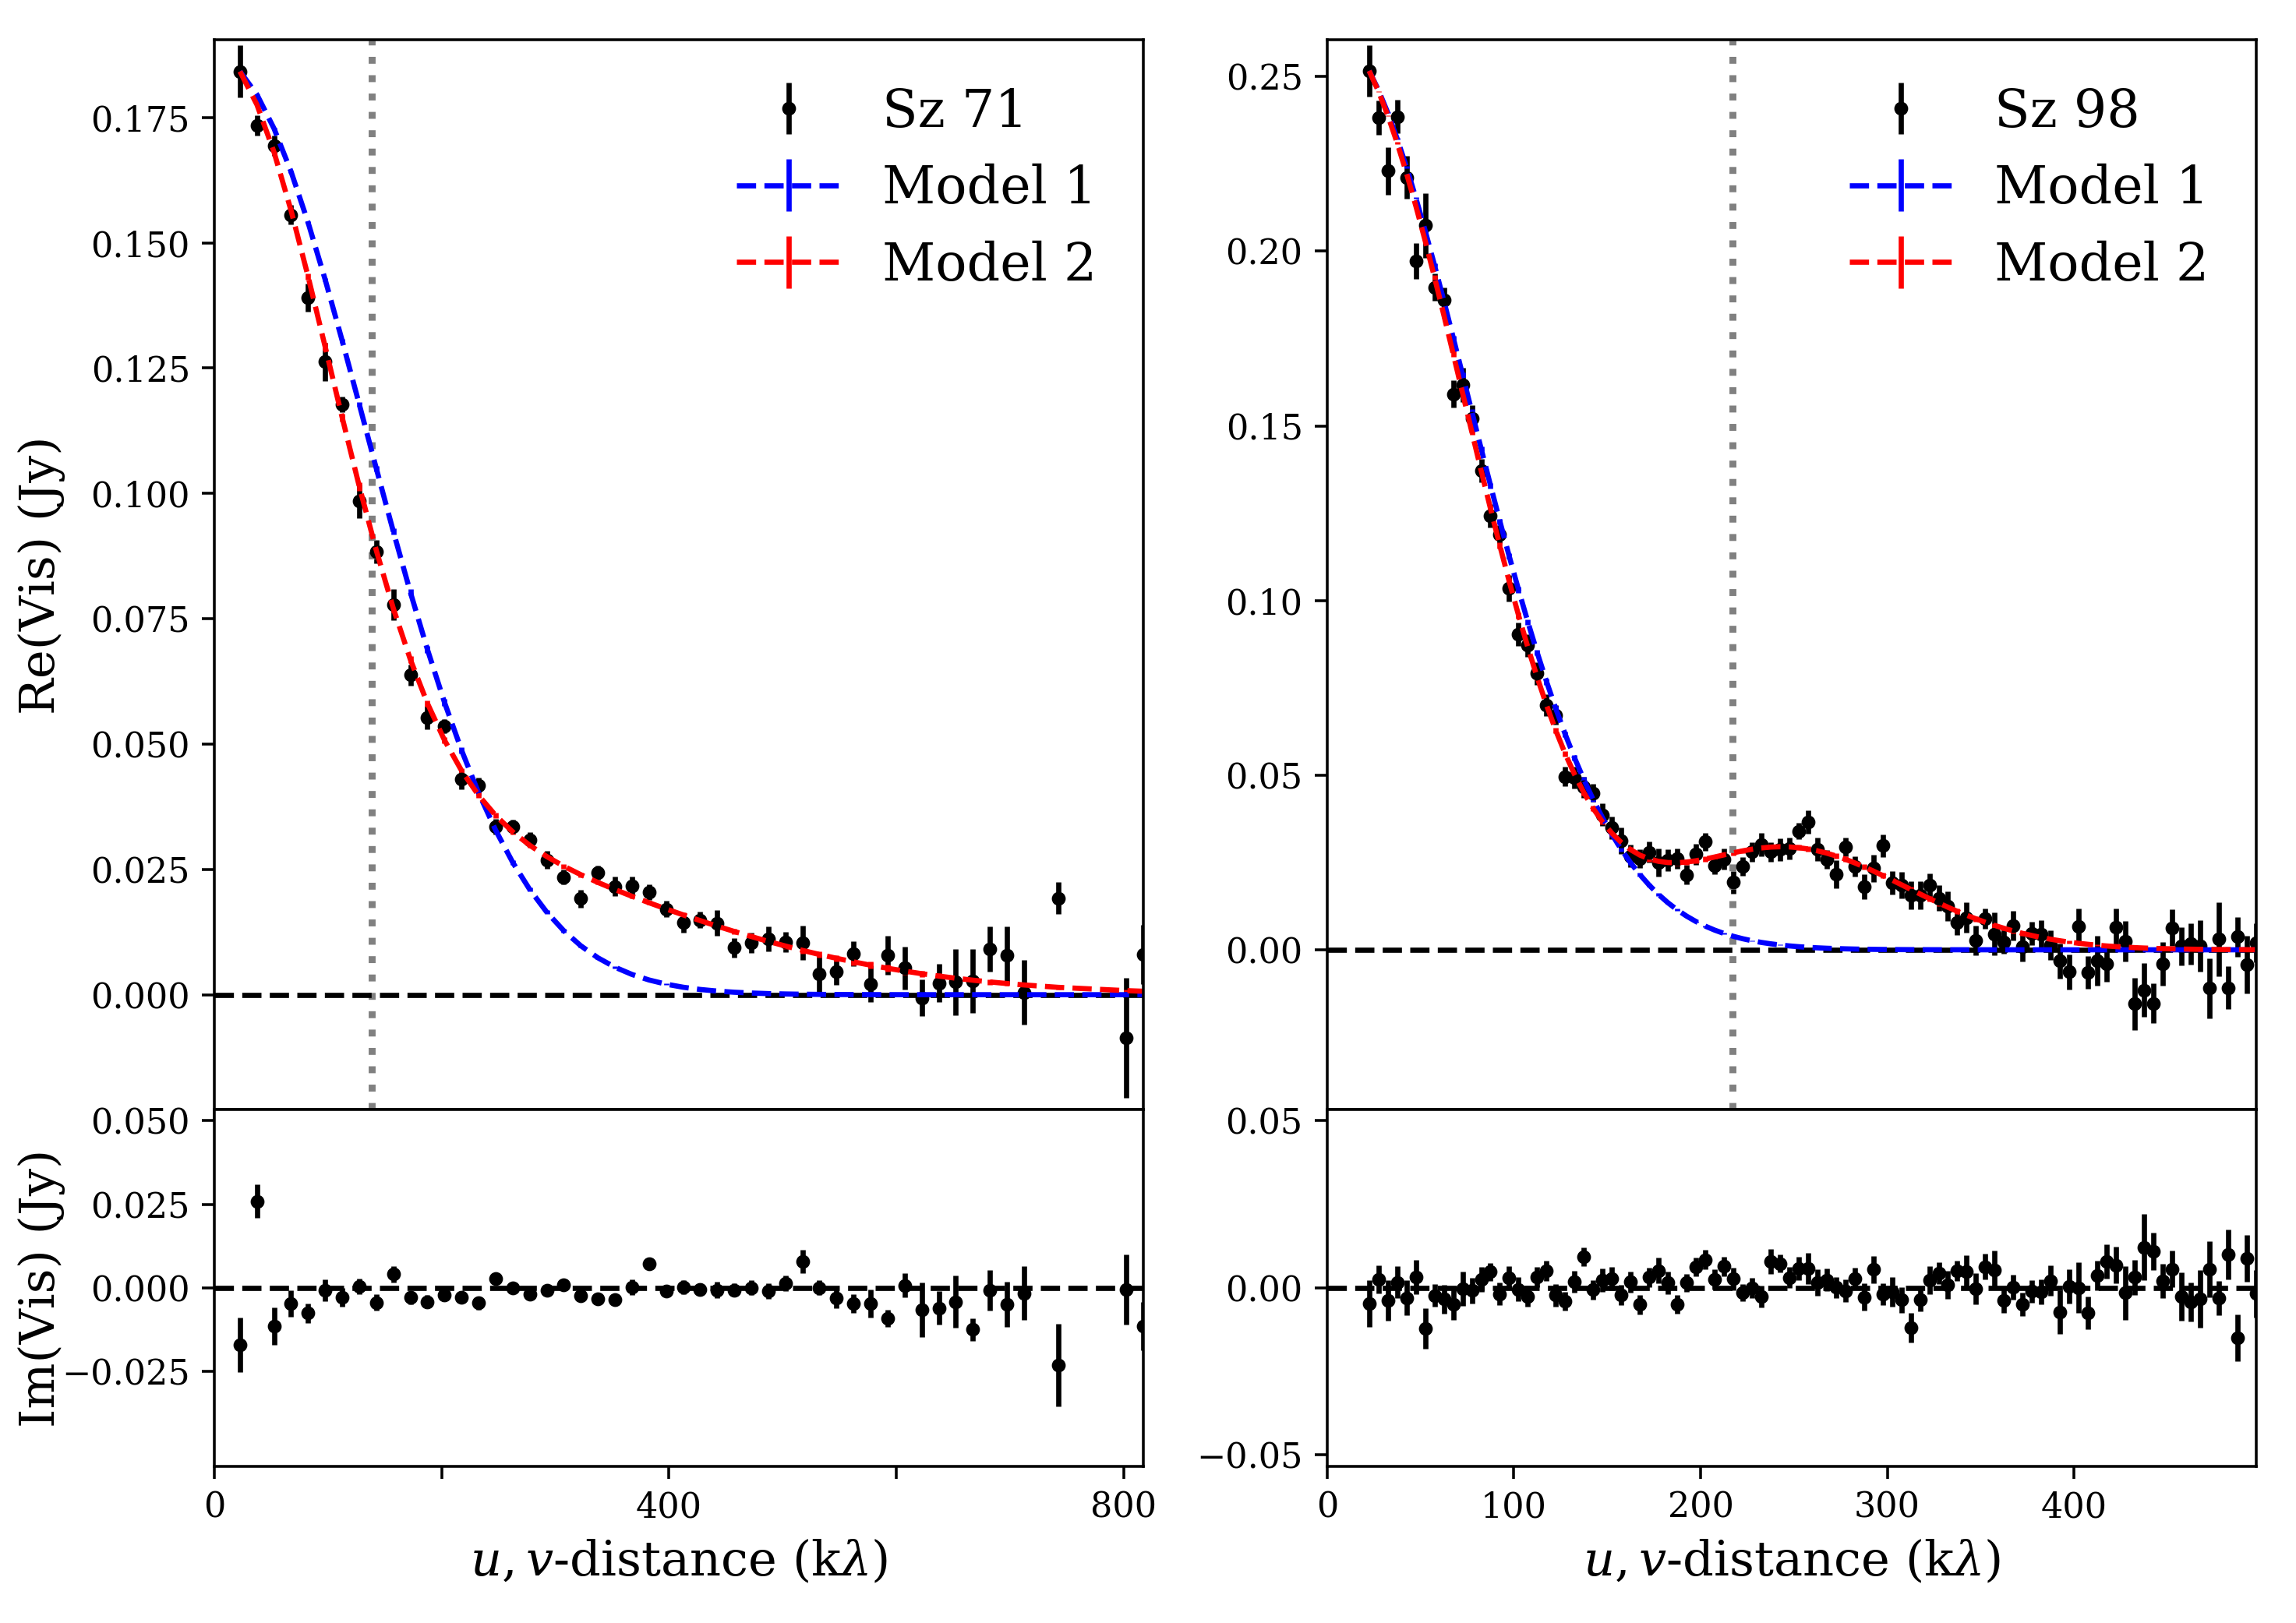
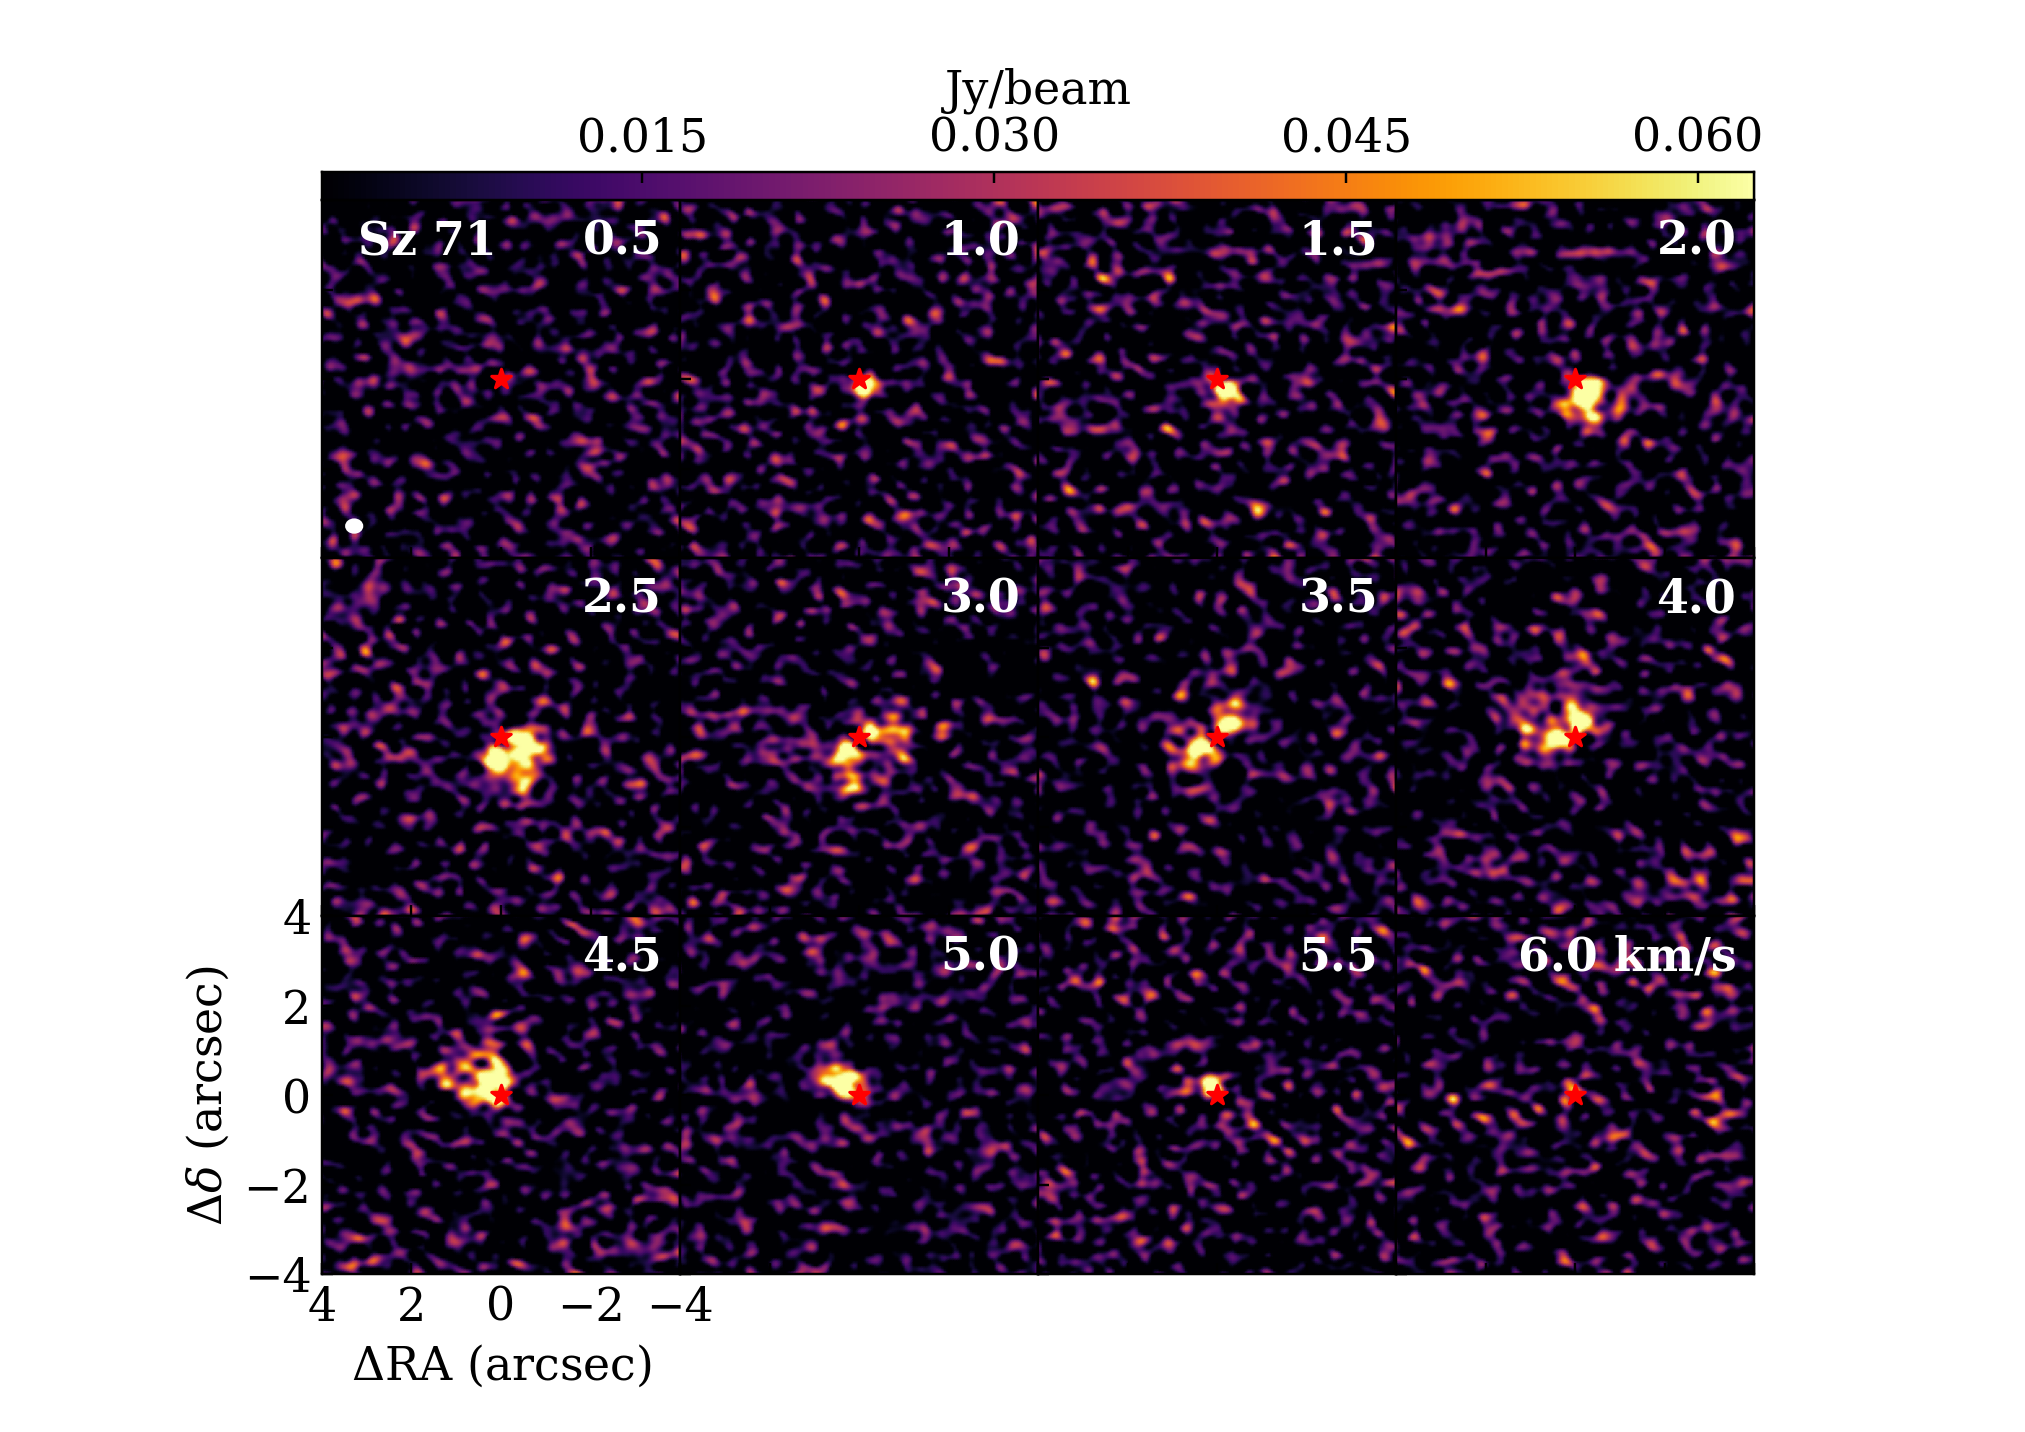
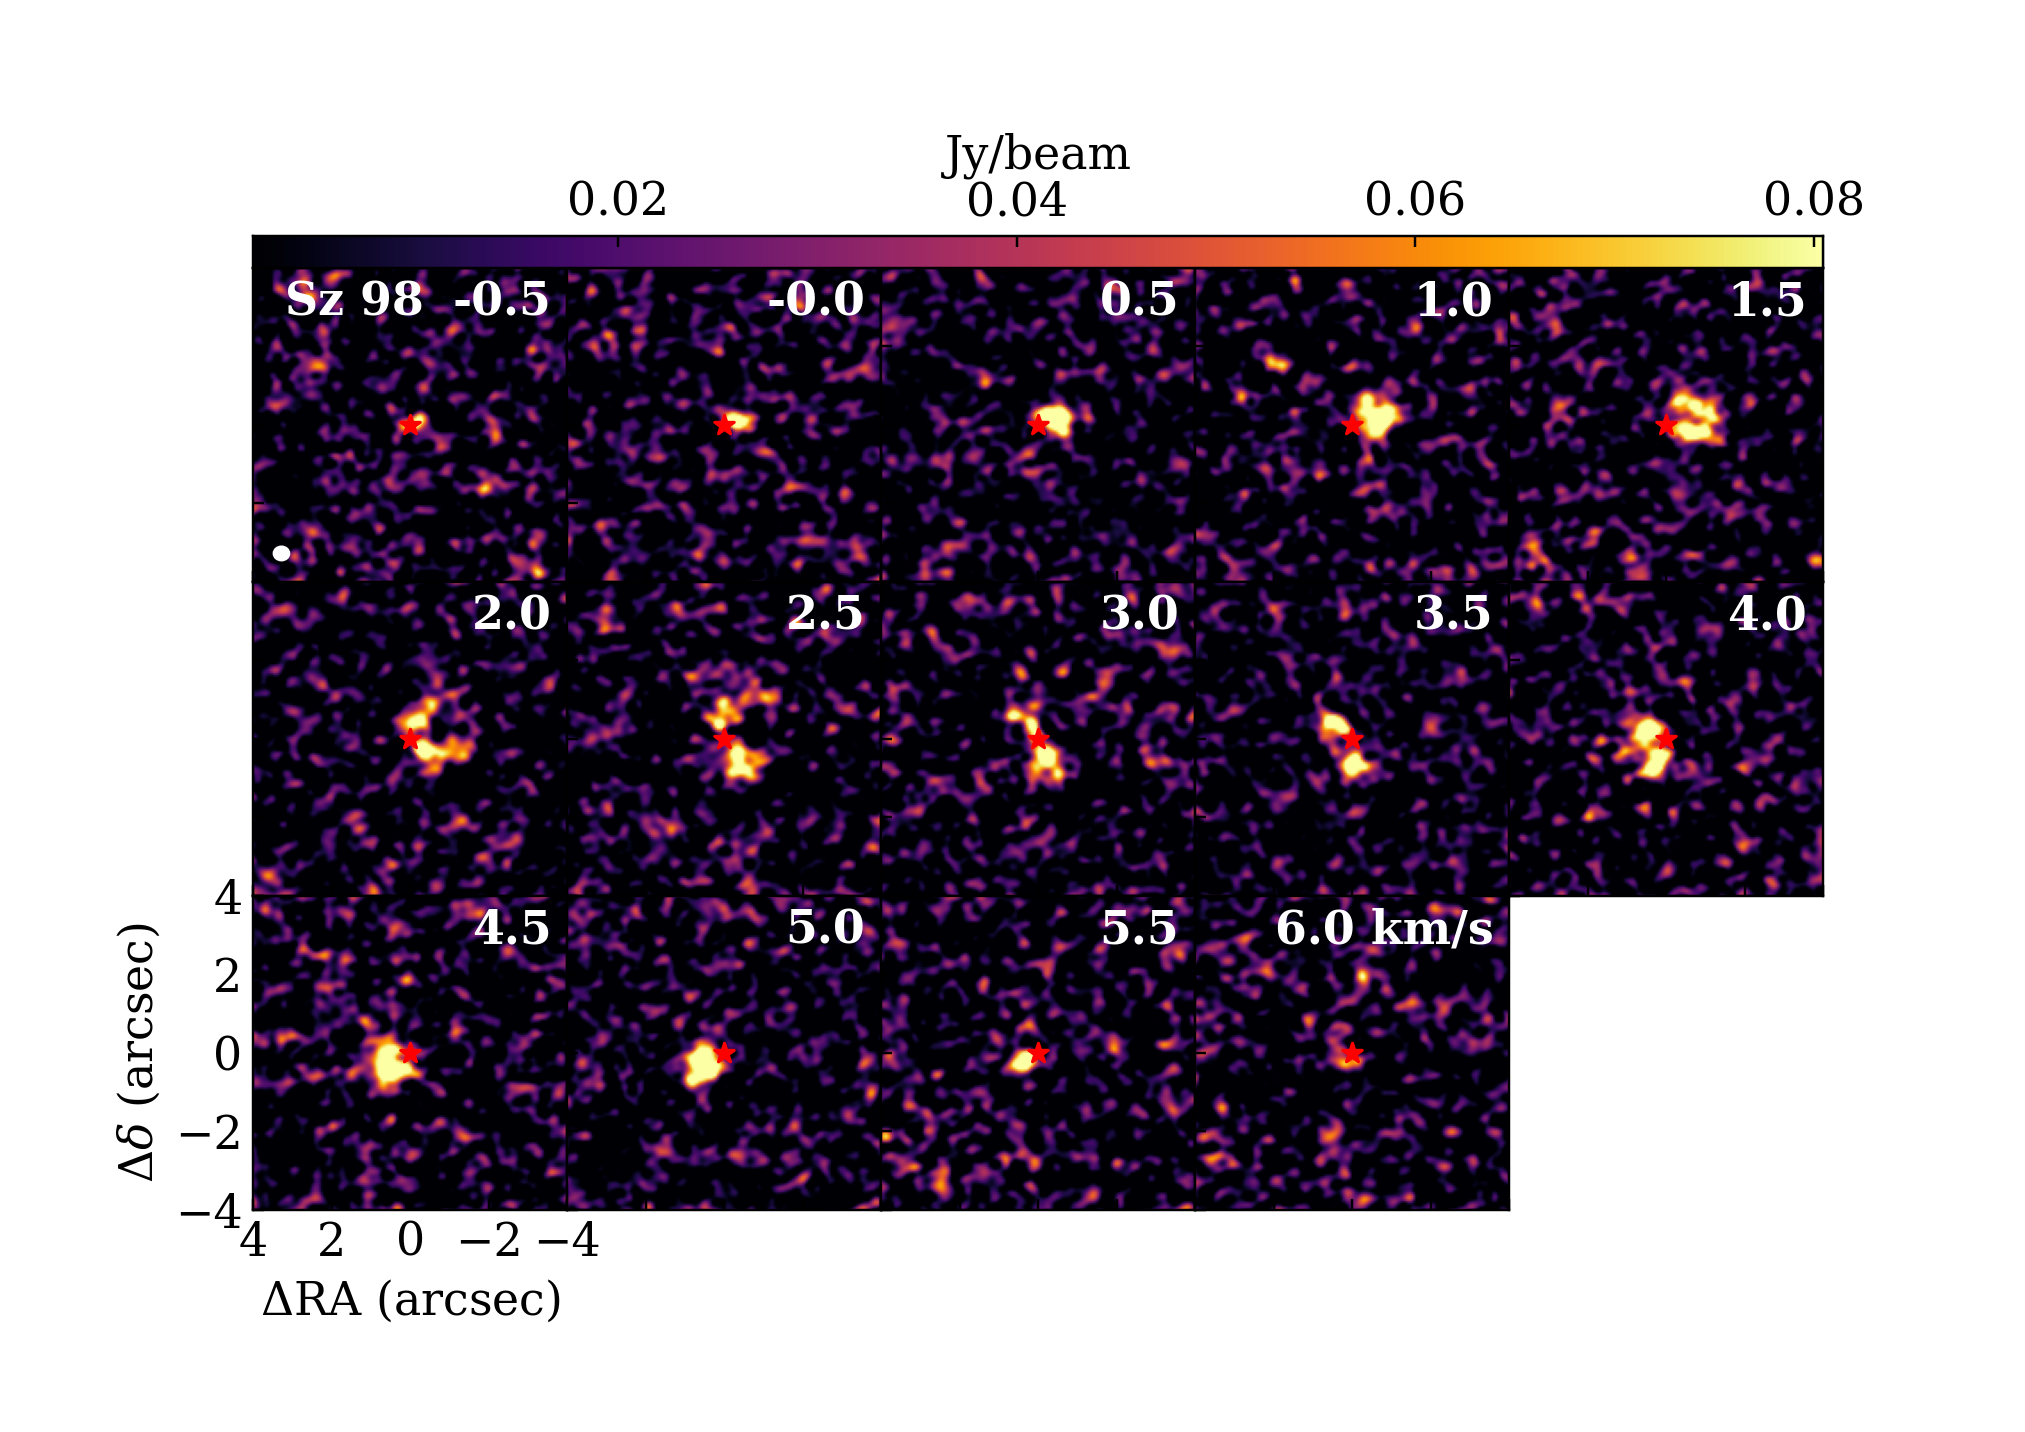
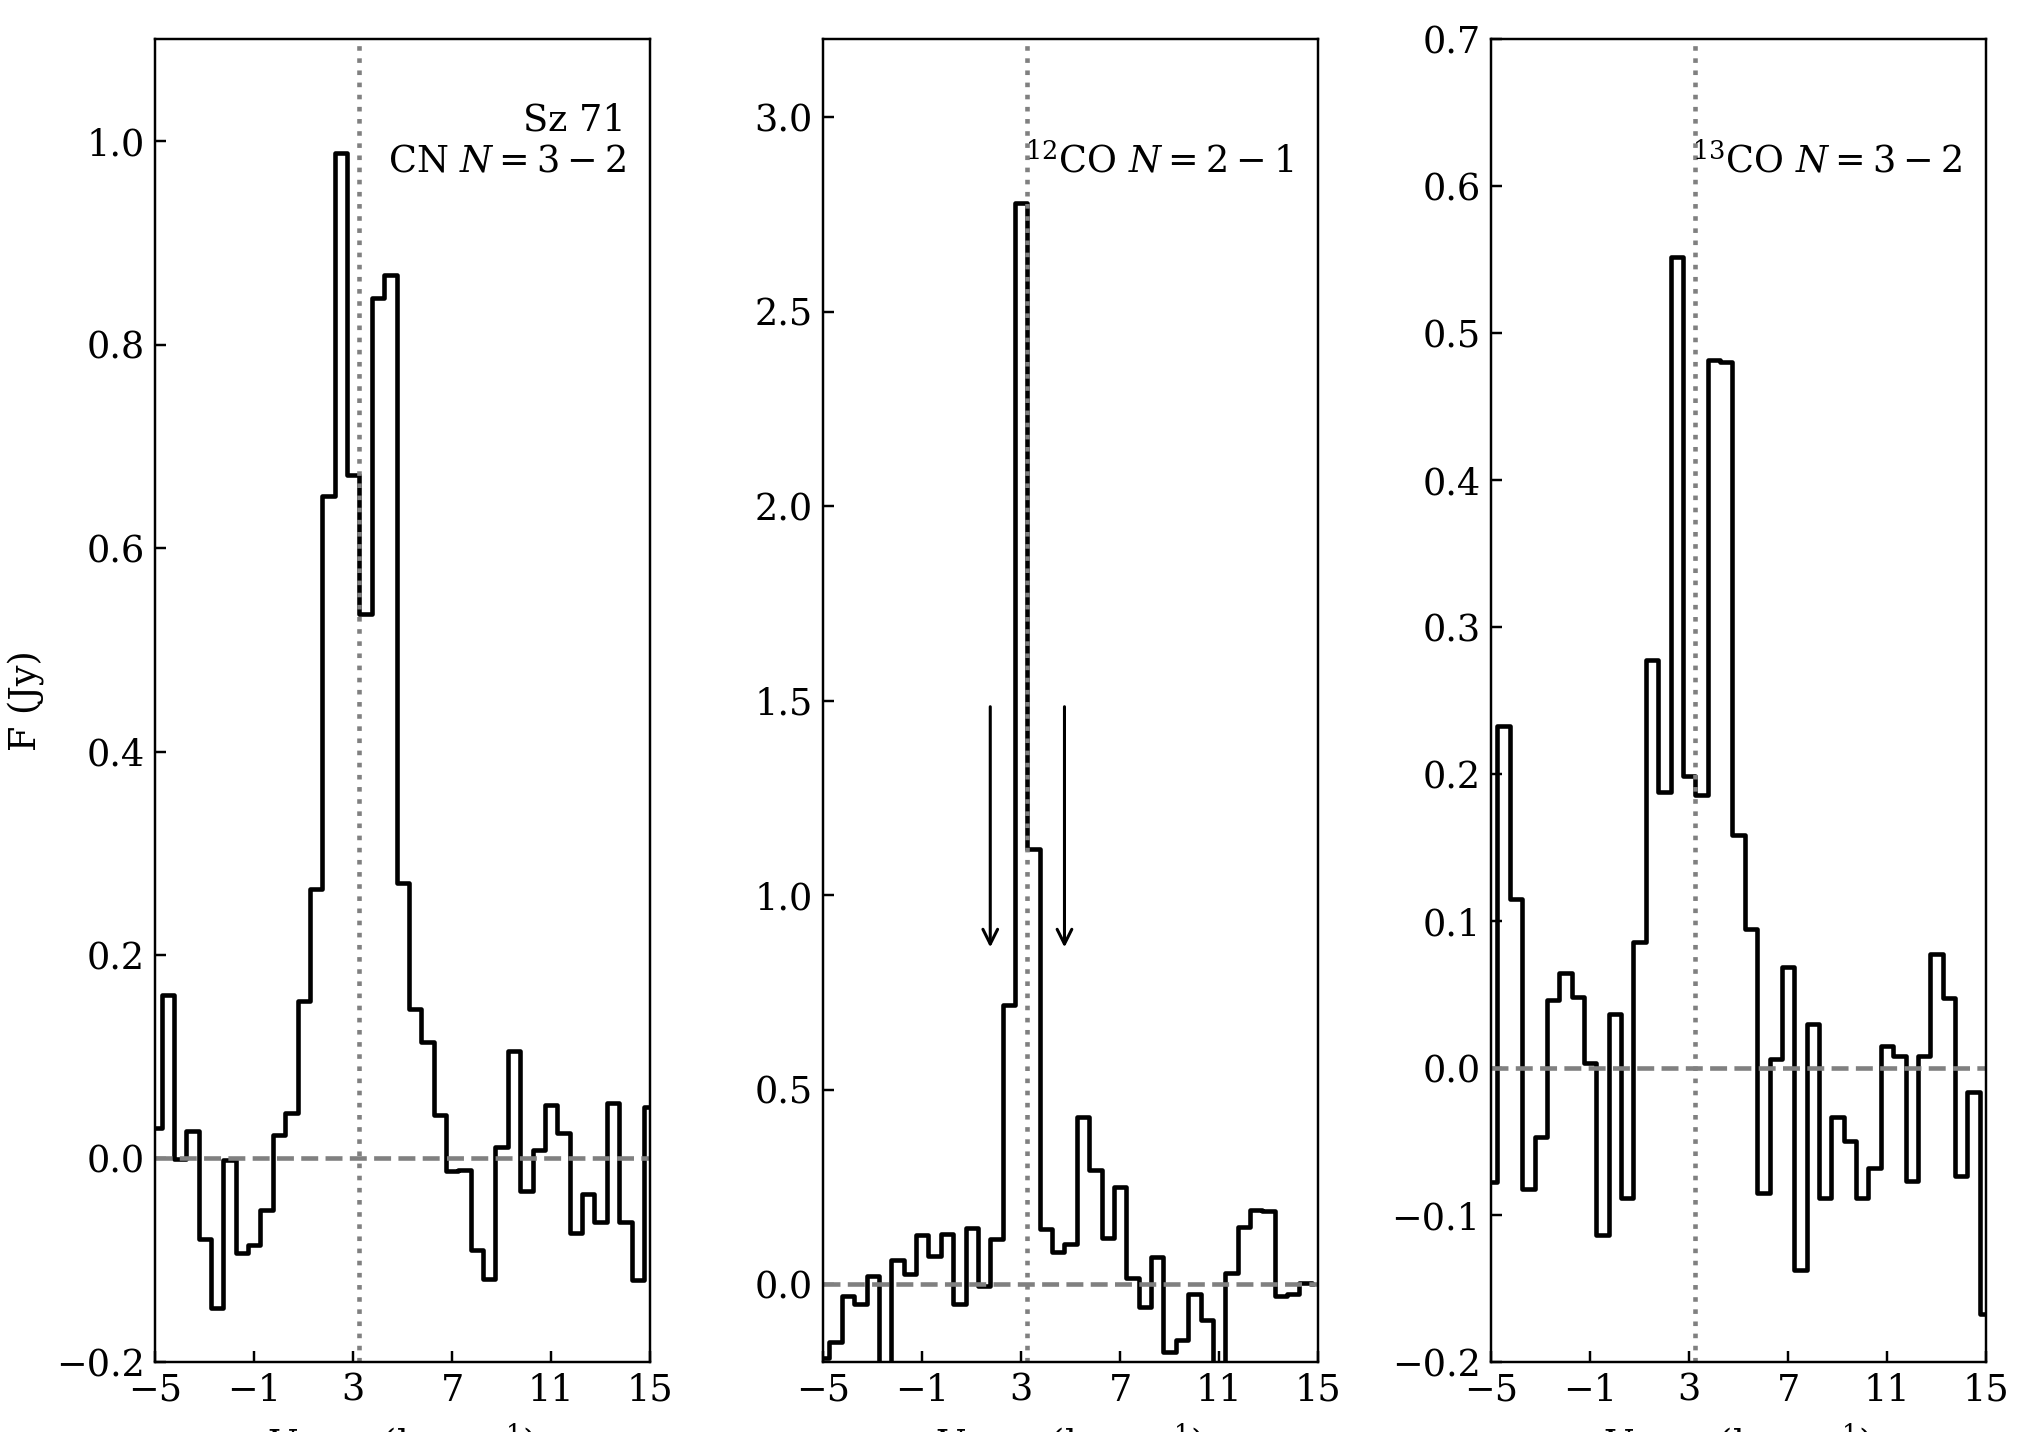
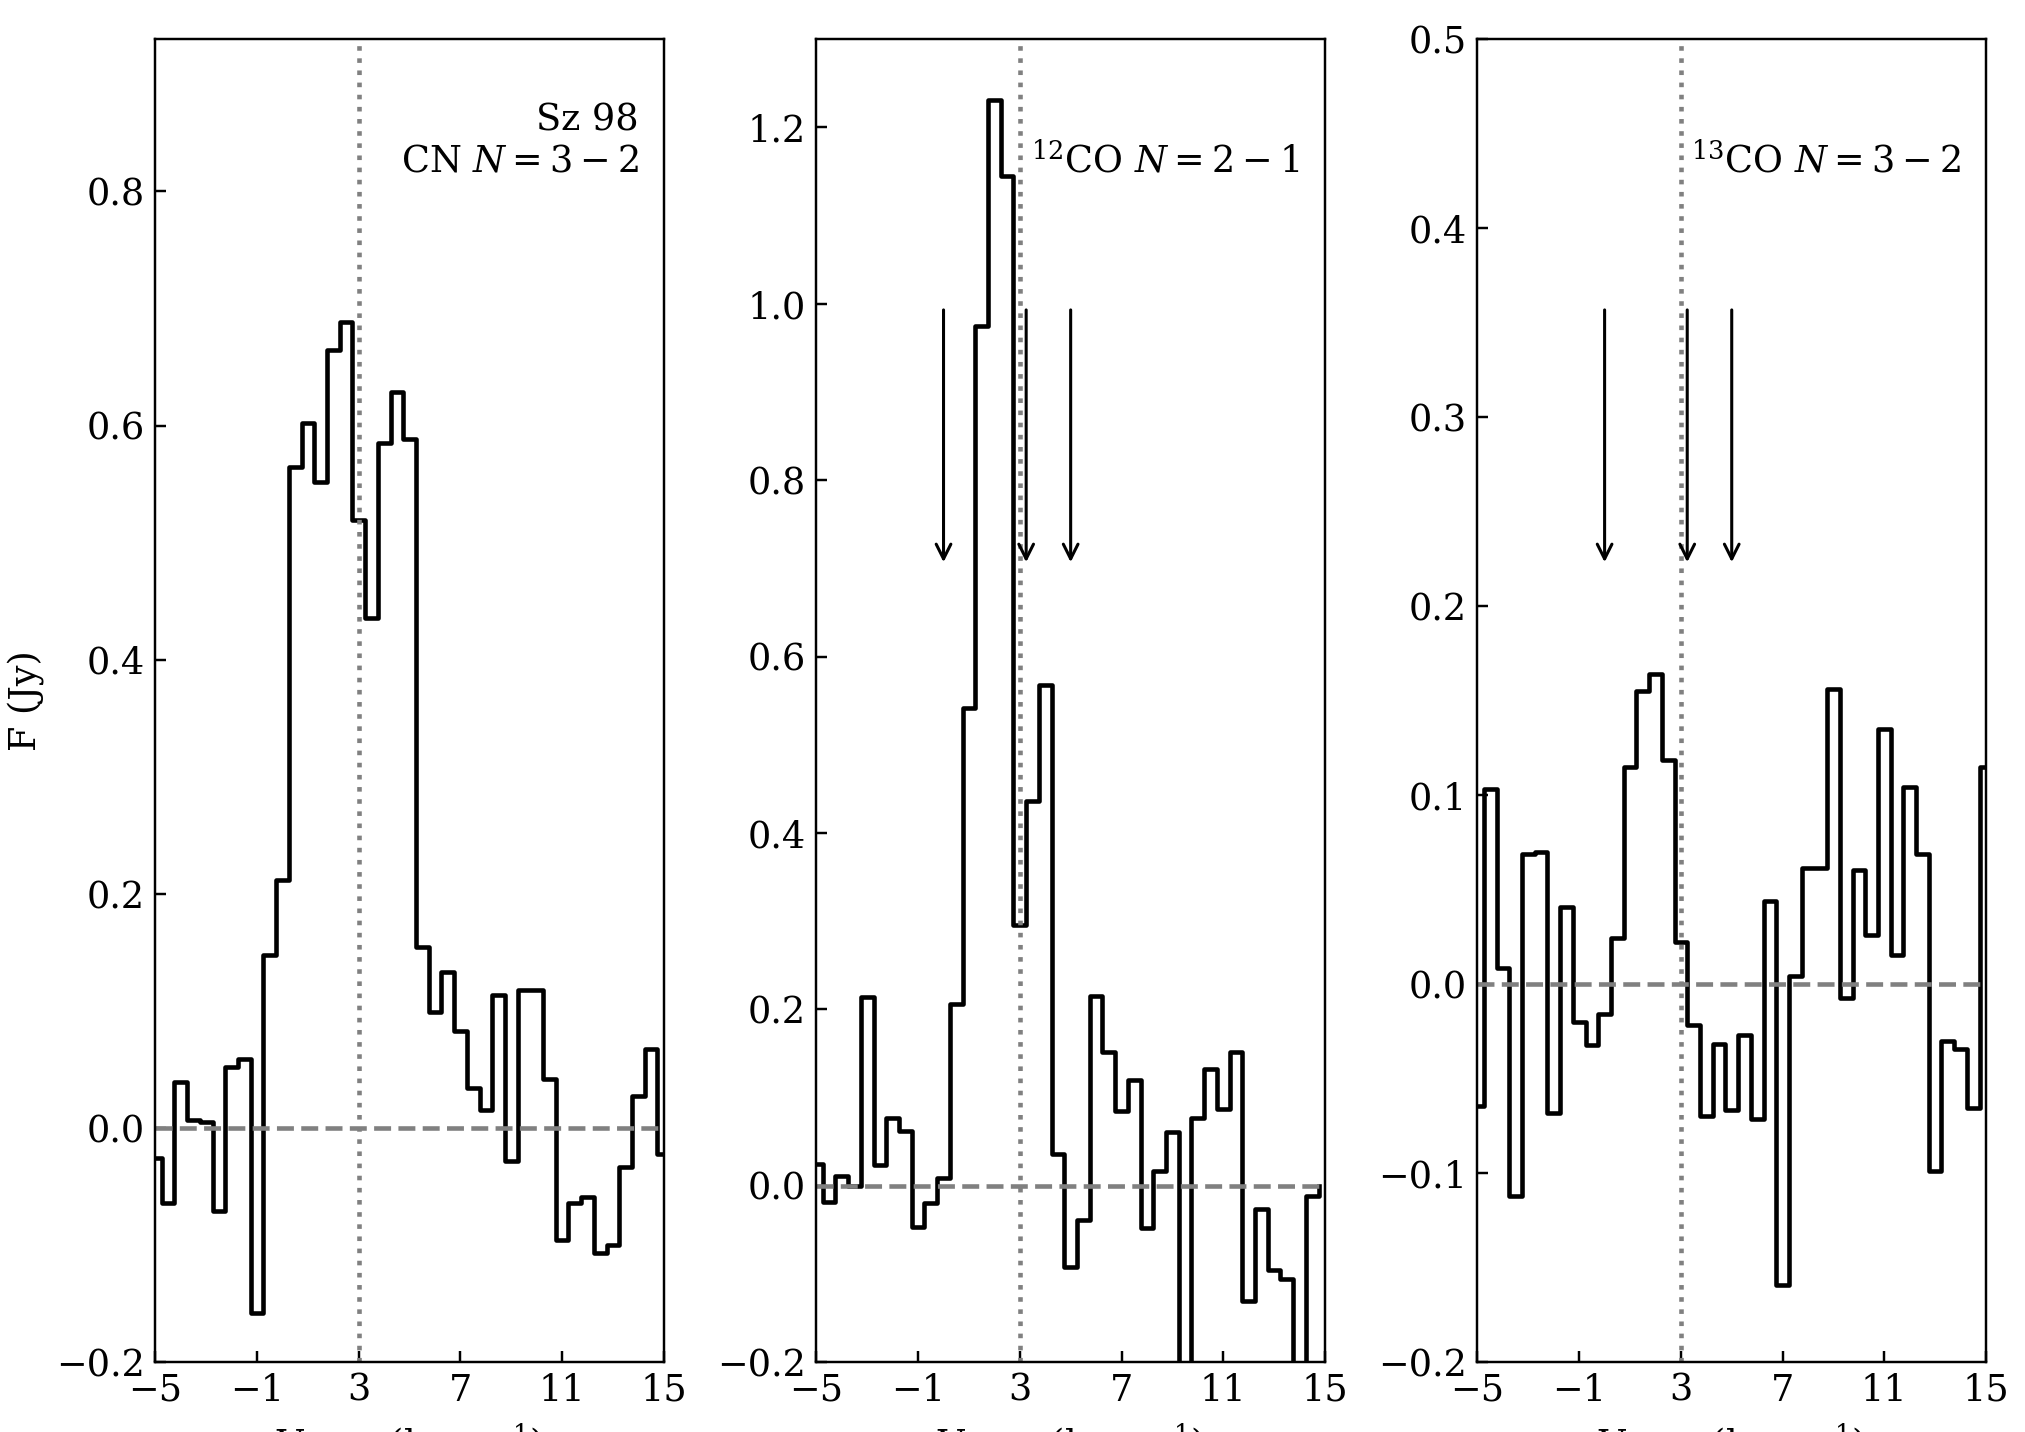
Figure 5 presents the moment-zero maps as well as the disk continuum, showing CN and the bulk-gas tracers 13CO and 12CO . In Figure 6, the radial intensity profiles of the continuum and CN line for both sources are shown. Both sources show CN rings, while Sz 98 shows evidence of significant, but non-coincident, continuum substructure. To improve the sensitivity of our analysis, these profiles have been made by azimuthally averaging over the (deprojected) moment-zero maps. In Figure D.3 the spectra of these lines are shown; channel maps of the CN emission towards both sources can be found in Appendix D. C18O is not detected at the -level towards either source. Table 2 shows the integrated fluxes for the lines discussed here, as well as the source Position Angles (PAs) and inclinations derived with the imfit task in CASA.
The other CN-bright sources are less suited for this purpose. A large fraction of the sources are too compact for structure in the CN emission to be apparent; of the CN-detected sources are unresolved. Of the rest, many have low signal-to-noise levels that make their detailed image-plane analysis impossible. Some of the brightest disks in CN are transition disks, which present a unique continuum structure with a large, central cavity and are exposed to a different UV radiation field as a consequence. This may change the typical behavior of CN. Of the full disks, V1094 Sco is both radially extended and bright, both in continuum and gas emission, but its CN line is partly resolved-out at the largest scales in low-velocity channels, and optically thick continuum emission in the inner disk may obscure the CN emission in those parts (van Terwisga et al. 2018). For IM Lup, only Submillimeter Array (SMA) data of CN are available, at much lower resolution, and Sz 133 is edge-on.
4.1.1 CN 3-2
CN 3-2 emission in both disks is ring-like, despite the relatively high noise levels of the final moment-zero maps. The peak emission is found at 40 and 60 AU for Sz 71 and Sz 98 respectively, although the emission does not completely vanish in the central region of the disk. The CN emission extends to large radii in both sources, and is clearly more extended than the continuum: in Sz 71, CN is detected out to approximately 200 AU, and in Sz 98 it can be seen out to 250 AU, while the continuum outer radii for both disks are 150 AU and 200 AU, respectively. The peak emission radius is further from the star in Sz 98 than in Sz 71. The latter source has the smallest contrast between emission at the disk center and peak intensity of these two sources.
In the moment-zero maps of CN, some asymmetry in the emission can be observed: this is likely due to the second-brightest hyperfine structure component (, ) at 0.5 km s-1 from the targeted transition which is blended with the strongest hyperfine transition lines of and , contaminating the emission redward of the primary hyperfine line. The theoretical relative intensity is expected to be up to of the primary (Kastner et al. 2014; Hily-Blant et al. 2017). However, this does not appear to significantly impact the radial profile observed for the source, apart from some increase in noise in the most affected areas.
Another possible influence on the CN morphology is the existence of optically thick continuum, blanketing the lines. However, we can exclude this possibility: the observed brightness temperatures at the source center (where such an effect would be the most likely) of 6.0 K and 4.4 K for Sz 71 and Sz 98 respectively are too low to be consistent with an optically thick continuum if an effective dust temperature of 20 K is assumed. This midplane temperature value is not unlikely given the relatively large beam size of our observations. Moreover, we do detect CO inside the CN rings in both sources, and unambiguously detect 13CO in the CN hole location in Sz 71.
4.1.2 12CO 2-1
12CO is a bright and optically thick line in the atmospheres of protoplanetary disks, but it is strongly affected by absorption by foreground clouds towards both sources discussed here, at several separate velocity ranges. By inspecting the spectra in Figure D.3, some cloud absorption appears to be present in the 12CO line. This is consistent with single-dish observations of CO in the Lupus clouds (van Kempen et al. 2007). Cloud absorption should not have a similar effect on our CN data: the transition has a much higher critical density (of cm-3) than the low-density foreground cloud, and no evidence of cloud contamination of CN is found by Guilloteau et al. (2013) in Taurus.
Despite the absorption, there is sufficient signal to infer an outer radius for the 12CO emission: the low-velocity channels blueward of the source velocity are not very absorbed. The outer radius at which CO is detected is larger than that of the CN emission radius towards both sources. Both Sz 98 and Sz 71 have detectable 12CO out to about 250 AU, where the outer radius is limited by the of our observations. Thus the gas extends at least a factor of further than the continuum in both disks, which is typical for most Lupus disks (Ansdell et al. 2018).
4.1.3 13CO 3-2
The 13CO emission towards both sources is surprisingly faint and thus the maps suffer from low (Ansdell et al. 2016; Miotello et al. 2017). Towards Sz 98, the detection of the line is marginal. Binning the data to 1 km s-1-wide channels and lowering the resolution to by removing short baselines improves our sensitivity. The moment-zero map of 13CO in this source does not show emission across the full disk, but only in ‘lobes’ towards the sides; this is probably caused by low of the data, as well as the limb-brightening effect of optically thin emission. In Sz 71, the emission is brighter and clearly centrally peaked, but also faint. Because of the low surface brightness of the line and the large difference between the sources, we have not included 13CO radial cuts in Figure 6.
The faintness of 13CO in Sz 98 is especially surprising: it is one of the largest and brightest (in both 12CO and continuum) disks in the Lupus sample, even including transition disks. Comparing the regions of the spectrum where 12CO is absorbed to the 13CO spectrum in Sz 71 (Figure D.3, top) shows that foreground absorption is unlikely to be the full explanation for the faintness of the 13CO line.
4.1.4 CN versus continuum
It is possible that – similar to the situation for CO (e.g. Isella et al. 2016; Fedele et al. 2017) – a link exists between continuum structure and the radial distribution of CN. Of the two disks discussed here, Sz 98 has the most obvious continuum feature: as shown in Figure 6, based on the -plane fit in Appendix B, a secondary maximum exists at the location of the ‘bump’ in the continuum at AU. No counterpart of this feature is seen in the CN emission profile: CN peaks at a radius interior to it, and seems to present a fairly constant downward slope outside 100 AU.
For Sz 71, the continuum structure is less obvious: around 50 AU, the continuum profile begins to drop off less steeply. This is possibly related to an unresolved feature, but this is not clear even from the -plane. The dashed line in Figure 6 for this object indicates the point where the turnover to a less steep profile occurs; it is fairly close to the CN peak.
Given the differences in the comparison between continuum and CN for these two sources, we therefore conclude that no obvious relation between the two is present in all cases. The clear presence of ring-like CN emission profiles in Sz 71 and Sz 98 is consistent with the predictions for rings of CN emission (Cazzoletti et al. 2018), and suggests that these features may be the result of chemistry alone, without the need for underlying continuum structures.
4.2 DALI modeling of CN rings
Here, a purely chemical cause for CN rings is investigated by more detailed modeling of the two bright, resolved disks discussed previously. The thermo-chemical disk modeling code DALI was used to test if simple models without the dust substructures identified in the previous subsection can produce radial distributions and integrated intensities of CN similar to those observed.
Based on the results of Cazzoletti et al. (2018), the presence of CN rings appears to be a common feature for their grid of protoplanetary disk models. Our goal is not to provide a perfect fit to the data, but rather to investigate whether rings similar (in terms of total flux and radial profile) to those observed in these two disks can be produced without continuum substructure, and to isolate the main parameters governing CN emission strength and morphology. It is important, in this context, to note that in an absolute sense the uncertainties resulting from the assumptions in the chemical network alone, as well as from disk structure, lead to an uncertainty of a factor of a few in flux (Woitke et al. 2018).
4.2.1 Individual disk model details
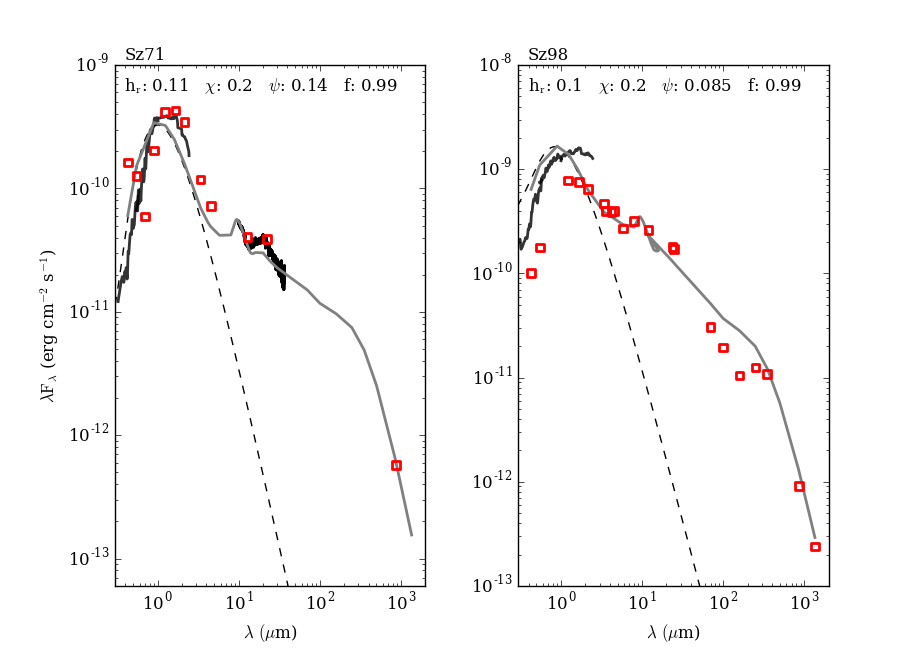
In order to find a rough physical structure of the disk models, we first attempted to reproduce the objects’ SED, described in more detail in Appendix C. This ensures that the large-scale distribution of the dust temperatures in the DALI models is similar to that of the source, and allows us to find, for instance, the CO snowline in the disks. Again, a parametric dust distribution model, as in Andrews et al. (2011), was used, constrained by data spanning a wide range of wavelengths between visible and mm-wavelengths. The gas surface density is the dust surface density and is not decoupled. The disk structure parameters used for the models of both disks have not been varied further in their respective DALI models and can be found in Table 5. The outer radii of the disks were taken to be AU, based on the CN data. The stellar parameters adopted for the input photosphere in the models were taken from Alcalá et al. (2014, 2017). As before, an initial estimate of the relevant UV flux for CN formation, , the UV excess emission from the model star was parametrized by the mass accretion rate, assuming K blackbody emission from the accreted material; due to the aforementioned uncertainties we have allowed for variations in the UV excess at these wavelengths of up to a factor 10.
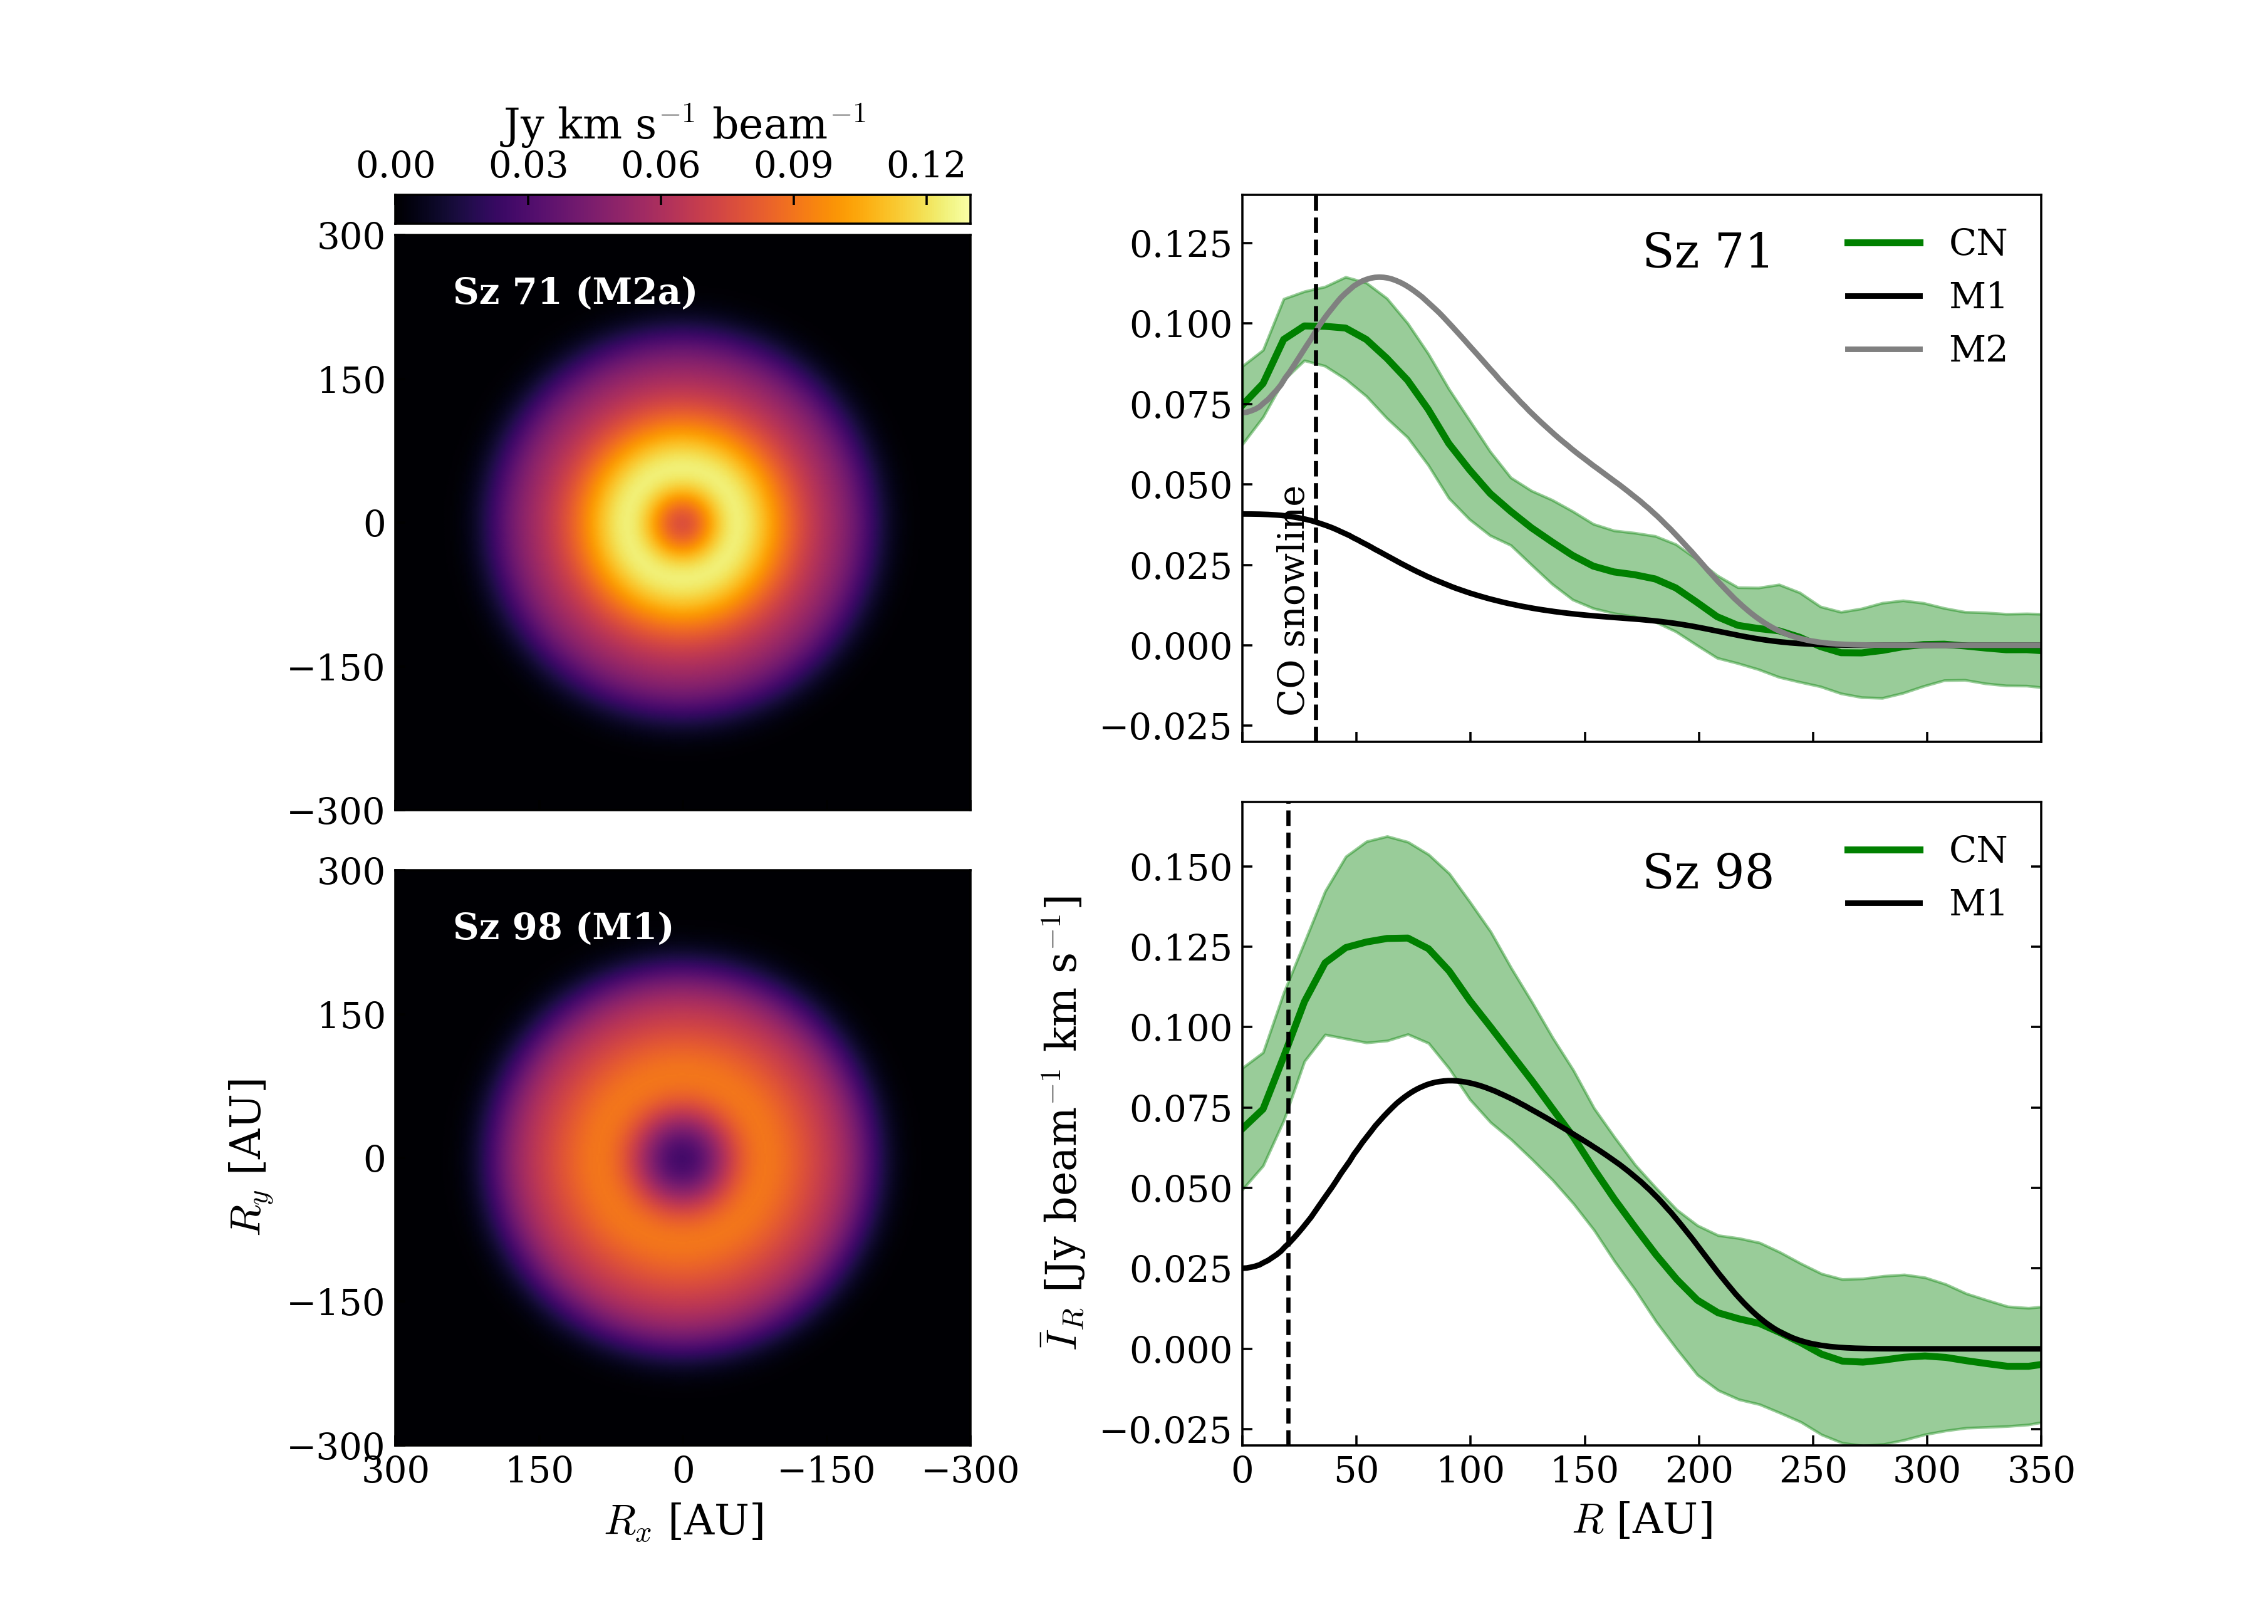
A model of Sz 71 with a UV-excess of , based on the measured accretion rate, as well as a model with an increased UV excess luminosity of , denoted as M1 and M2 respectively, are presented in this Section. For Sz 98, we only ran models with a single UV luminosity based on the observed accretion properties, and thus only have an M1, since this disk model already performed quite well in reproducing the CN flux and radial profile. The surface density profiles were kept fixed for all models of a single source. After ray-tracing each model, the images were convolved with an circular Gaussian beam, to see if the CN emission was similar to the observations.
4.2.2 Model results
As can be seen in Figure 7, the most remarkable feature of the CN emission, its concentration in a ring, is indeed reproduced in the model radial profiles, and occurs at radii within 20 AU of those seen in the data for Sz 71 model M2 and Sz 98 model M1. Also, the peak intensity of the emission is close (within ) to the observed peak value for the most similar models. The similarity in the emission profiles outside the peak is also encouraging, especially considering the factor few uncertainty in absolute fluxes from this type of chemical model.
Table 3 presents the total CN fluxes for the different models. The agreement is closest for Sz 98: the model flux and observed flux only differ by . For Sz 71, if an increased UV luminosity is used, a larger difference can be seen, of for all models; but the emission profile for M2 is clearly closer than that of model M1 for this disk, primarily due to the increase in peak intensity radius with increased UV flux.
No clear link appears between the CO snowline position (defined as the location where the disk midplane reaches 20 K, following Öberg et al. 2005) and the location of the CN peak in Sz 98. For Sz 71, the CO snowline, CN peak, and – possibly – the continuum slope change lie within 10 AU, but the location of the snowline is quite uncertain, and both it and the continuum structure may not be closely related to the CN emission, which generally arises from the upper parts of the disk in models (Cazzoletti et al. 2018). In either case, the significant difference between the radii of the expected CO snowline position, the CN peak, and the continuum structure in Sz 98 seem to preclude a clear, one-to-one link between these quantities in all disks.
| [Jy km s-1] | |||
|---|---|---|---|
| Sz 71 | M1 | -5.2 | 0.8 |
| M2 | -4.1 | 3.9 | |
| Obs | 2.4 | ||
| Sz 98 | M1 | -3.4 | 3.7 |
| Obs | 3.5 |
4.2.3 CN rings as a disk probe
The main factor determining the CN radius and emission strength in these large-disk models is the excess UV flux due to accretion of material onto the star. This is especially obvious from comparing models M1 and M2 for Sz 71. It is crucial to note that in none of our models we need the presence of substructure in the disks’ surface density, either in the dust or gas components: CN rings arise purely from a chemical effect.
In the wider grid of disks in Cazzoletti et al. (2018), as well as in these models, CN rings are identified as a common feature. However, the ring radii and fluxes decrease with stellar and disk size, which explains why we can only study them in these two sources in the survey: below AU, which applies to most of the objects in our sample, the ring radius drops rapidly and starts to become unresolved at our observations’ effective resolution. At the same time, the flux – and therefore of the resolved CN images – fall off. In the grid of models discussed in Section 3, the smallest CN peak radii would be resolved with an effective beam size of AU, given a face-on inclination and sufficiently good .
Ultimately, CN is best used as a probe of the nm UV radiation field impacting the upper disk. This is especially the case if the other disk parameters, particularly the characteristic radius , can be constrained independently. For this, other common molecular tracers like 12CO or 13CO can be used, leaving the way open for such studies in the future.
5 Conclusions
Our ALMA observations of a complete sample of Class II disks in Lupus allow us to study the behavior of CN, both in the full sample and – using individual models – in two resolved sources, and to use this common molecule as a probe of upper-disk atmosphere properties. With higher resolution and deeper observations, this molecule can be used to gain essential information on the properties of protoplanetary disks. The main results obtained from the observations discussed here are as follows:
-
•
The CN , transition is bright, and has a similar detection rate to 13CO in disks in Lupus, but is not strongly correlated with either 13CO or continuum fluxes in these disks.
-
•
Comparing the CN flux distribution in Lupus to that of a population of Taurus-Auriga disks shows no significant difference, while disks in Oph may be fainter on average.
-
•
Comparing the CN fluxes of the full Lupus sample to a model grid with varying UV fluxes and gas disk characteristic radii supports the conclusion that a significant number of disks in Lupus has a compact gas surface density profile, with AU needed to explain part of the population.
-
•
CN shows a ring-shaped emission morphology towards the bright, resolved sources Sz 71 and Sz 98, consistent with model predictions that CN is generally distributed in rings. For the bulk of objects, it is not possible to detect rings at this sensitivity and resolution, consistent with the expectations for compact, low-mass disks around late-type stars.
-
•
Continuum substructure unrelated to the CN rings appears to be present in both sources, and particularly in Sz 98, where we infer an unresolved continuum ring at AU. No connection between the CO snowline, the continuum structure, and the CN ring are seen in Sz 98.
-
•
Disk models without substructure retrieve CN rings similar to those observed towards both sources, in terms of both peak emission radii and absolute intensities. Their radii strongly dependent on the amount of excess UV emission. This implies that CN rings are purely chemical in nature, and good tracers of the effective UV irradiation of the upper disk atmosphere, especially if gas disk sizes are determined from other data.
Acknowledgements.
We kindly thank J. M. Alcalá for providing us with X-shooter spectra of both sources, and A. Bosman, and D. Harsono for useful discussions. We also thank S. Bruderer for his role in the continued development of DALI and his advice on how best to use it. Astrochemistry in Leiden is supported by the European Union A-ERC grant 291141 CHEMPLAN, by the Netherlands Research School for Astronomy (NOVA), and by a Royal Netherlands Academy of Arts and Sciences (KNAW) professor prize. This paper makes use of the following ALMA data: ADS/JAO.ALMA#2013.1.00220.S and ADS/JAO.ALMA#2015.1.00222.S. ALMA is a partnership of ESO (representing its member states) NSF (USA) and NINS (Japan) together with NRC (Canada) MOST and ASIAA (Taiwan), and KASI (Republic of Korea), in cooperation with the Republic of Chile. The Joint ALMA Observatory is operated by ESO, AUI/NRAO and NAOJ. The authors acknowledge support by Allegro, the European ALMA Regional Center node in The Netherlands, and expert advice from L.T. Maud in particular. MT has been supported by the DISCSIM project, grant agreement 341137 funded by the European Research Council under ERC-2013-ADG. SF, CFM and AM acknowledge an ESO Fellowship.?refname?
- Aikawa et al. (2015) Aikawa, Y., Furuya, K., Nomura, H., & Qi, C. 2015, ApJ, 807, 120
- Alcalá et al. (2017) Alcalá, J. M., Manara, C. F., Natta, A., et al. 2017, A&A, 600, A20
- Alcalá et al. (2014) Alcalá, J. M., Natta, A., Manara, C. F., et al. 2014, A&A, 561, A2
- ALMA Partnership et al. (2015) ALMA Partnership, Brogan, C. L., Pérez, L. M., et al. 2015, ApJ, 808, L3
- Andrews & Williams (2005) Andrews, S. M. & Williams, J. P. 2005, ApJ, 631, 1134
- Andrews et al. (2011) Andrews, S. M., Wilner, D. J., Espaillat, C., et al. 2011, ApJ, 732, 42
- Andrews et al. (2016) Andrews, S. M., Wilner, D. J., Zhu, Z., et al. 2016, ApJ, 820, L40
- Ansdell et al. (2018) Ansdell, M., Williams, J. P., Trapman, L., et al. 2018, ApJ, 859, 21
- Ansdell et al. (2016) Ansdell, M., Williams, J. P., van der Marel, N., et al. 2016, ApJ, 828, 46
- Ardila et al. (2013) Ardila, D. R., Herczeg, G. J., Gregory, S. G., et al. 2013, The Astrophysical Journal Supplement Series, 207, 1
- Arulanantham et al. (2018) Arulanantham, N., France, K., Hoadley, K., et al. 2018, ApJ, 855, 98
- Bailer-Jones et al. (2018) Bailer-Jones, C. A. L., Rybizki, J., Fouesneau, M., Mantelet, G., & Andrae, R. 2018, AJ, 156, 58
- Barenfeld et al. (2016) Barenfeld, S. A., Carpenter, J. M., Ricci, L., & Isella, A. 2016, The Astrophysical Journal, 827, 142
- Beckwith et al. (1990) Beckwith, S. V. W., Sargent, A. I., Chini, R. S., & Guesten, R. 1990, AJ, 99, 924
- Bergin et al. (2004) Bergin, E., Calvet, N., Sitko, M. L., et al. 2004, ApJ, 614, L133
- Bergin et al. (2013) Bergin, E. A., Cleeves, L. I., Gorti, U., et al. 2013, Nature, 493, 644
- Bergin et al. (2016) Bergin, E. A., Du, F., Cleeves, L. I., et al. 2016, ApJ, 831, 101
- Bruderer (2013) Bruderer, S. 2013, A&A, 559, A46
- Bruderer et al. (2012) Bruderer, S., van Dishoeck, E. F., Doty, S. D., & Herczeg, G. J. 2012, A&A, 541, A91
- Bustamante et al. (2015) Bustamante, I., Merín, B., Ribas, Á., et al. 2015, A&A, 578, A23
- Carney et al. (2017) Carney, M. T., Hogerheijde, M. R., Loomis, R. A., et al. 2017, A&A, 605, A21
- Cazzoletti et al. (2018) Cazzoletti, P., van Dishoeck, E. F., Visser, R., Facchini, S., & Bruderer, S. 2018, A&A, 609, A93
- Cieza et al. (2018) Cieza, L. A., Ruíz-Rodríguez, D., Hales, A., et al. 2018, MNRAS, 2538
- Cleeves et al. (2016) Cleeves, L. I., Öberg, K. I., Wilner, D. J., et al. 2016, ApJ, 832, 110
- Comerón (2008) Comerón, F. 2008, in Handbook of Star Forming Regions, Volume II: The Southern Sky ASP Monograph Publications, Vol. 5. Edited by Bo Reipurth, p.295, ed. B. Reipurth (The Southern Sky ASP Monograph Publications), 295
- Cutri et al. (2003) Cutri, R. M., Skrutskie, M. F., van Dyk, S., et al. 2003, VizieR Online Data Catalog, 2246
- Dullemond & Dominik (2005) Dullemond, C. P. & Dominik, C. 2005, A&A, 434, 971
- Dutrey et al. (1997) Dutrey, A., Guilloteau, S., & Guelin, M. 1997, A&A, 317, L55
- Espaillat et al. (2014) Espaillat, C., Muzerolle, J., Najita, J., et al. 2014, Protostars and Planets VI, 497
- Facchini et al. (2017) Facchini, S., Birnstiel, T., Bruderer, S., & van Dishoeck, E. F. 2017, A&A, 605, A16
- Favre et al. (2013) Favre, C., Cleeves, L. I., Bergin, E. A., Qi, C., & Blake, G. A. 2013, ApJ, 776, L38
- Fedele et al. (2017) Fedele, D., Carney, M., Hogerheijde, M. R., et al. 2017, A&A, 600, A72
- France et al. (2014) France, K., Schindhelm, E., Bergin, E. A., Roueff, E., & Abgrall, H. 2014, ApJ, 784, 127
- Gaia Collaboration et al. (2018) Gaia Collaboration, Brown, A. G. A., Vallenari, A., et al. 2018, A&A, 616, A1
- Guilloteau et al. (2013) Guilloteau, S., Di Folco, E., Dutrey, A., et al. 2013, A&A, 549, A92
- Guilloteau & Dutrey (1998) Guilloteau, S. & Dutrey, A. 1998, A&A, 339, 467
- Guilloteau et al. (2016) Guilloteau, S., Reboussin, L., Dutrey, A., et al. 2016, A&A, 592, A124
- Guilloteau et al. (2014) Guilloteau, S., Simon, M., Piétu, V., et al. 2014, A&A, 567, A117
- Heays et al. (2017) Heays, A. N., Bosman, A. D., & van Dishoeck, E. F. 2017, A&A, 602, A105
- Henning & Semenov (2013) Henning, T. & Semenov, D. 2013, Chemical Reviews, 113, 9016
- Herczeg et al. (2005) Herczeg, G. J., Walter, F. M., Linsky, J. L., et al. 2005, AJ, 129, 2777
- Herczeg et al. (2004) Herczeg, G. J., Wood, B. E., Linsky, J. L., Valenti, J. A., & Johns-Krull, C. M. 2004, ApJ, 607, 369
- Hily-Blant et al. (2017) Hily-Blant, P., Magalhaes, V., Kastner, J., et al. 2017, A&A, 603, L6
- Huang et al. (2018) Huang, J., Andrews, S. M., Cleeves, L. I., et al. 2018, ApJ, 852, 122
- Huang et al. (2017) Huang, J., Öberg, K. I., Qi, C., et al. 2017, ApJ, 835, 231
- Isella et al. (2016) Isella, A., Guidi, G., Testi, L., et al. 2016, Physical Review Letters, 117, 251101
- Isobe et al. (1986) Isobe, T., Feigelson, E. D., & Nelson, P. I. 1986, ApJ, 306, 490
- Kama et al. (2016) Kama, M., Bruderer, S., van Dishoeck, E. F., et al. 2016, A&A, 592, A83
- Kastner et al. (2014) Kastner, J. H., Hily-Blant, P., Rodriguez, D. R., Punzi, K., & Forveille, T. 2014, ApJ, 793, 55
- Kastner et al. (2015) Kastner, J. H., Qi, C., Gorti, U., et al. 2015, ApJ, 806, 75
- Lebouteiller et al. (2015) Lebouteiller, V., Barry, D. J., Goes, C., et al. 2015, ApJS, 218, 21
- Lique et al. (2010) Lique, F., Spielfiedel, A., Feautrier, N., et al. 2010, J. Chem. Phys., 132, 024303
- Loison et al. (2014) Loison, J.-C., Wakelam, V., & Hickson, K. M. 2014, MNRAS, 443, 398
- Long et al. (2017) Long, F., Herczeg, G. J., Pascucci, I., et al. 2017, ApJ, 844, 99
- Loomis et al. (2018) Loomis, R. A., Öberg, K. I., Andrews, S. M., et al. 2018, AJ, 155, 182
- Lynden-Bell & Pringle (1974) Lynden-Bell, D. & Pringle, J. E. 1974, MNRAS, 168, 603
- Mathews et al. (2013) Mathews, G. S., Klaassen, P. D., Juhász, A., et al. 2013, A&A, 557, A132
- McClure et al. (2016) McClure, M. K., Bergin, E. A., Cleeves, L. I., et al. 2016, ApJ, 831, 167
- Miotello et al. (2017) Miotello, A., van Dishoeck, E. F., Williams, J. P., et al. 2017, A&A, 599, A113
- Öberg et al. (2015) Öberg, K. I., Furuya, K., Loomis, R., et al. 2015, ApJ, 810, 112
- Öberg et al. (2011) Öberg, K. I., Qi, C., Fogel, J. K. J., et al. 2011, ApJ, 734, 98
- Öberg et al. (2005) Öberg, K. I., van Broekhuizen, F., Fraser, H. J., et al. 2005, ApJ, 621, L33
- Pascucci et al. (2016) Pascucci, I., Testi, L., Herczeg, G. J., et al. 2016, The Astrophysical Journal, 831, 125
- Pinte et al. (2016) Pinte, C., Dent, W. R. F., Ménard, F., et al. 2016, ApJ, 816, 25
- Qi et al. (2015) Qi, C., Öberg, K. I., Andrews, S. M., et al. 2015, ApJ, 813, 128
- Qi et al. (2013) Qi, C., Öberg, K. I., Wilner, D. J., et al. 2013, Science, 341, 630
- Reboussin et al. (2015) Reboussin, L., Guilloteau, S., Simon, M., et al. 2015, A&A, 578, A31
- Salinas et al. (2017) Salinas, V. N., Hogerheijde, M. R., Mathews, G. S., et al. 2017, A&A, 606, A125
- Salter et al. (2011) Salter, D. M., Hogerheijde, M. R., van der Burg, R. F. J., Kristensen, L. E., & Brinch, C. 2011, A&A, 536, A80
- Schwarz (1978) Schwarz, G. 1978, Ann. Statist., 6, 461
- Siess et al. (2000) Siess, L., Dufour, E., & Forestini, M. 2000, A&A, 358, 593
- Tazzari et al. (2017) Tazzari, M., Testi, L., Natta, A., et al. 2017, A&A, 606, A88
- Teague et al. (2016) Teague, R., Guilloteau, S., Semenov, D., et al. 2016, A&A, 592, A49
- Teague et al. (2017) Teague, R., Semenov, D., Gorti, U., et al. 2017, ApJ, 835, 228
- Thi et al. (2004) Thi, W.-F., van Zadelhoff, G.-J., & van Dishoeck, E. F. 2004, A&A, 425, 955
- van der Marel et al. (2016a) van der Marel, N., van Dishoeck, E. F., Bruderer, S., et al. 2016a, A&A, 585, A58
- van der Marel et al. (2016b) van der Marel, N., Verhaar, B. W., van Terwisga, S., et al. 2016b, A&A, 592, A126
- van der Marel et al. (2016c) van der Marel, N., Verhaar, B. W., van Terwisga, S., et al. 2016c, A&A, 592, A126
- van der Marel et al. (2018) van der Marel, N., Williams, J. P., Ansdell, M., et al. 2018, ApJ, 854, 177
- van Kempen et al. (2007) van Kempen, T. A., van Dishoeck, E. F., Brinch, C., & Hogerheijde, M. R. 2007, A&A, 461, 983
- van Terwisga et al. (2018) van Terwisga, S. E., van Dishoeck, E. F., Ansdell, M., et al. 2018, A&A, 616, A88
- van’t Hoff et al. (2017) van’t Hoff, M. L. R., Walsh, C., Kama, M., Facchini, S., & van Dishoeck, E. F. 2017, A&A, 599, A101
- Visser et al. (2018) Visser, R., Bruderer, S., Cazzoletti, P., et al. 2018, A&A, 615, A75
- Weingartner & Draine (2001) Weingartner, J. C. & Draine, B. T. 2001, ApJ, 548, 296
- Woitke et al. (2018) Woitke, P., Min, M., Thi, W. F., et al. 2018, ArXiv e-prints, arXiv:1807.05784
- Zhang et al. (2016) Zhang, K., Bergin, E. A., Blake, G. A., et al. 2016, ApJ, 818, L16
?appendixname? A CN versus C18O in Lupus disks
?appendixname? B -plane analysis
It is possible that, in the disks in which a clear CN ring is present, some underlying continuum structure is responsible, for instance, by causing a local density enhancement. Therefore, it is relevant to first establish if any such structures are present in the disks we study in detail, and if so, where they are located.
In the two disks discussed here, based on their continuum intensity profile (Fig. 6), Sz 98 seems to have a bright central core, with a large, fainter outer region, giving it something of a ‘fried-egg’-appearance similar to V1094 Sco (van Terwisga et al. 2018); the radial profile seems to suggest an unresolved structure in this outer region. Sz 71, on the other hand, may have a ‘knee’ in its intensity profile at around 50 AU. Analysing the continuum emission in the u,v-plane can provide a more thorough picture of the mm-dust structure underlying the CN emission, even if such features are difficult to detect in the image plane due to the deconvolution algorithm. Tazzari et al. (2017) performed a fit of both disks with a smooth self-similar disk model, including radiative transfer. However, such a smooth model is not expected to be able to fit radial substructures in the continuum, if any are present. For that reason, a simpler fitting method is used here, focusing only on reproducing the radial intensity profile.
Both sources were deprojected and derotated based on an image-plane fit with the CASA imfit-task. We confirmed that, within the uncertainties given by these values, the results of our analysis did not significantly change. Subsequently the data were binned to k bins in u,v-space, and finally scaled and fit with two simple models: a Gaussian core (Model 1), the single-component model, and a Gaussian core modulated with a cosinusoidal term (Model 2), the two-component model, to mimic the behavior of an (unresolved) ring of particles. This method was successfully used by Zhang et al. (2016) to describe rings in a variety of transitional and full disks, and has the important property that it uses a minimal number of parameters, while being smooth (making it similar to these disks’ appearance) and not necessarily containing nulls (which must occur for sharp-edged models).
| (2) |
Here, is the relative intensity of the th component, its width (converted, for ease of reading, to AU in Table 4), and the spatial frequency which modulates the th Gaussian, and is the angle to the source center (in radians). Baselines up to 800 k are used for our fit to Sz 71, and up to 500 k for Sz 98; beyond these values, noise starts dominating our u,v-plane data. Parameter values for two models, with and , were obtained from MCMC-fits to the observations with the PyMC Python module.
In Figure B.1 and Table 4, the results of the fitting procedure are shown. For both Sz 71 and Sz 98, the two-component Gaussian model fits the continuum significantly better than the single-component one, when comparing the Bayesian Information Criterion (BIC) (Schwarz 1978): for Sz 71, and for Sz98, in favor of the two-component model. The two-component model performs especially well at large baselines, suggesting that there is continuum structure at small spatial scales. For Sz 98, a true second maximum is immediately obvious in the visibility plane.The similarity of this feature to those seen (at much higher resolutions and sensitivities) in e.g. Zhang et al. (2016), ALMA Partnership et al. (2015) and Andrews et al. (2016) is remarkable, all the more so considering its amplitude – not much fainter than the structures identified in the V1094 Sco disk (van Terwisga et al. 2018). For Sz 71 the best-fit values of show a fairly large uncertainty, and the amplitude of the small-scale signal is not very large.
In Sz 98, we can assign the identified u,v-plane feature to the presence of an (unresolved) ring in the image plane, located at 117 AU, depicted with a dotted gray line in Figure 6 (right); this is consistent with the knee that is tentatively identified in the continuum radial intensity profile. Moreover, Tazzari et al. (2017) find a clear ring-like residual when comparing their best-fit model of Sz 98 to the data, located in the same part of the disk. The visibility feature in Sz 71 is weaker and overlaps with the bright ‘core’ of the disk; thus, without higher-resolution and deeper data, we can only say that its brightness profile drops off less steeply beyond 50 AU in this disk (Figure 6 (left)). Given the similarity of these disks’ visibilities, it is possible that a structure similar to that of Sz 98 is present in Sz 71, but at a fainter level and closer to the central star. However, no ring-like residual is present for this disk in the best-fit smooth disk model by Tazzari et al. (2017). It is also important to note that our intensity profiles do not provide any information on the vertical structure of the continuum, since the mm-sized grains responsible for the emission modeled here are expected to be vertically settled with respect to the disk gas (Dullemond & Dominik 2005; Pinte et al. 2016).
| BIC | |||||||
|---|---|---|---|---|---|---|---|
| [AU] | [Jy beam-1] | [AU] | |||||
| Sz 71 | Model 1 | - | - | - | 27.87 | 1071.2 | |
| Model 2 | 1.71 | -225.7 | |||||
| Sz 98 | Model 1 | - | - | - | 20.67 | 1306.8 | |
| Model 2 | 1.45 | -75.9 |
?appendixname? C SED fitting procedure
We attempted to closely reproduce the SEDs of both sources with our models, in order to find a dust density and temperature structure corresponding as closely as possible to the real (disk-averaged) properties of the disks, especially at mid-infrared down to mm wavelengths. Using the resulting parametrized disks as input for the DALI physical-chemical modeling code allows us to confirm if the CN rings we observe in the sources are the result of just the global properties of the disk (particularly, the interplay between gas density and UV radiation) or if they require underlying dust and/or gas substructures at the radius of the CN ring (neither of which would be revealed by the SED).
The disk model used is adapted from the model used in Andrews et al. (2011), but without an exponential taper at characteristic radius . Instead, the disk is truncated at , and the surface density slope is fixed at for all models. The parameter space of this model was explored in two phases. For the first phase, we used the RADMC3D-code222http://www.ita.uni-heidelberg.de/~dullemond/software/radmc-3d/ to globally constrain the flaring angle of the disk , its scale height , the disk mass , and the possibility of an inner cavity ().
Taking as a variable was motivated by our difficulty reproducing the near- and mid-IR parts of the SED when using the standard parametrization of . However, we only take a values of in a small interval, as radii beyond AU would lead to obviously different SEDs. The shape of the near- and mid-IR SED is also sensitive to the choice of parametrization of the inner region structure: a puffed-up inner rim extending to the sublimation radius, for instance, could lead to a similar SED. However, such changes would make a significant difference only at scales much smaller than our ALMA observations’ resolution.
The values of and in our models are taken from the 870 m CN and continuum images, respectively. For both disks, we take to be AU. We use a single grain population between 0.5 and 1000 m. Our opacities are based on the same abundances of amorphous and crystalline silicate and amorphous carbon grains as in Weingartner & Draine (2001).
The second phase - performed in DALI - uses the best-fit values from the RADMC3D models, but includes a population of small grains and settled large grains. The fraction of large grains, here, is , and the decreased scale height of the settled large grain population is equal to . We explore only and . Our small grain population is limited to a maximum size of 1 m. Including this small grain population means we have a better description of the silicate features in the NIR (especially for Sz 71, for which we have an IRS spectrum). Using DALI also allows us to make sure no gridding inconsistencies are present when we run the full thermo-chemical code to calculate the CN emission.
For the stellar luminosity, effective temperatures, and accretion luminosities we used the values given in Table 1. We corrected the data for extinction using , and mag and mag for Sz 71 and Sz 98 respectively (Alcalá et al. 2017). In the case of Sz 71, the X-shooter spectra have been rescaled by a factor of (within the instrument’s systematic error, c.f. Alcalá et al. (2014)) to agree with the 2MASS J, H, K-magnitudes. For Sz 98, we show the 2MASS and B and V-band photometry, but do not include them in our fit. This source is a known variable, and the X-shooter data have the largest amount of wavelength coverage in a single observation. Moreover, the most accurate determination of and is based on these data.
C.1 SED data
The disks’ SEDs were constructed on the basis of available literature data. For Sz 98, the dataset consists of data from the X-Shooter (from Alcalá et al. (2017)), WISE, and the Herschel PACS and SPIRE instruments (Bustamante et al. 2015), as well as 2MASS J, H, K and B and V-band fluxes (Cutri et al. 2003). The PACS data, however, were not used in the fit since it appears to be affected by a systematic offset possibly caused by the photometric calibration.
Sz 71 has not been observed by Herschel, and the behavior of its SED is therefore much less constrained at FIR wavelengths. However, B, V, R-band and X-Shooter (from Alcalá et al. (2014)) and 2MASS data do exist, as well as a Spitzer IRS spectrum between 10 and 36 m (Lebouteiller et al. 2015). The Sz 71 SED appears to be showing a significant contribution from amorphous carbonaceous grains, in the form of excess emission at wavelengths down to 1 micron. These opacities are not included in our models. However, since their primary effect is to heat the innermost part of the disk (outside our chemical region of interest) we do not expect to seriously underestimate the CN emission by excluding them in our full thermo-chemical models.
C.2 SED fitting results
Both disks appear to be non-flaring compared to e.g. the sample presented in van der Marel et al. (2016c) when fit with a similar methodology and disk model. This is significant, since the flaring angle has a large impact on the dust heating at radii where we expect CN to be present (Cazzoletti et al. 2018). However, there is still a significant difference between both disks’ flaring angles, meaning our results are stil representative of disks in general with a variety of flaring angles.
| Sz 71 | |||
|---|---|---|---|
| Parameter | minimum | maximum | used |
| 0.07 | 0.15 | 0.11 | |
| 0.1 | 0.3 | 0.14 | |
| 0.85 | 0.99 | 0.99 | |
| 0.2 | 1.0 | 0.2 | |
| (AU) | 0.04 | 1.5 | 1.0 |
| () | 0.01 | 0.09 | 0.03 |
| Sz 98 | |||
|---|---|---|---|
| Parameter | min | max | best |
| 0.07 | 0.15 | 0.1 | |
| 0.07 | 0.1 | 0.085 | |
| 0.85 | 0.99 | 0.99 | |
| 0.2 | 1.0 | 0.2 | |
| (AU) | 0.06 | 1.5 | 0.5 |
| () | 0.01 | 0.09 | 0.07 |
?appendixname? D CN channel maps and emission line spectra for two bright, resolved sources
?appendixname? E CN fluxes and upper limits for the Lupus sample
1]
| Source | Aperture | ||
|---|---|---|---|
| [Jy km s-1] | [Jy km s-1] | [arcsec] | |
| Sz 65 | |||
| Sz 66 | |||
| J15430131-3409153 | |||
| J15430227-3444059 | |||
| J15445789-3423392 | |||
| J15450634-3417378 | |||
| J15450887-3417333 | |||
| Sz 68 | |||
| Sz 69 | |||
| Sz 71 | |||
| Sz 72 | |||
| Sz 73 | |||
| Sz 74 | |||
| Sz 75 | |||
| Sz 76 | |||
| Sz 77 | |||
| Sz 81A | |||
| J15560210-3655282 | |||
| IM Lup 333CN flux scaled to the CN transition. | |||
| Sz 83 | |||
| Sz 84 | |||
| Sz 129 | |||
| J15592523-4235066 | |||
| RY Lup | |||
| J16000060-4221567 | |||
| J16000236-4222145 | |||
| J16002612-4153553 | |||
| Sz 130 | |||
| MY Lup | |||
| Sz 131 | |||
| J16011549-4152351 | |||
| EX Lup | |||
| Sz 133 | |||
| Sz 88A | |||
| Sz 88B | |||
| J16070384-3911113 | |||
| J16070854-3914075 | |||
| Sz 90 | |||
| Sz 91 | |||
| J16073773-3921388 | |||
| Sz 95 | |||
| J16075475-3915446 | |||
| J16080017-3902595 | |||
| J16080175-3912316 | |||
| Sz 96 | |||
| J16081497-3857145 | |||
| Sz 97 | |||
| Sz 98 | |||
| Sz 99 | |||
| Sz 100 | |||
| J160828.1-391310 | |||
| Sz 102 | |||
| Sz 103 | |||
| J16083070-3828268 | |||
| Sz 104 | |||
| J160831.1-385600 | |||
| V856 Sco | |||
| V1094 Sco 444Partly resolved-out and continuum-shielded | |||
| Sz 106 | |||
| Sz 108B | |||
| J16084940-3905393 | |||
| V1192 Sco | |||
| Sz 110 | |||
| J16085324-3914401 | |||
| J16085373-3914367 | |||
| Sz 111 | |||
| J16085529-3848481 | |||
| Sz 112 | |||
| Sz 113 | |||
| J16085828-3907355 | |||
| J16085834-3907491 | |||
| J16090141-3925119 | |||
| Sz 114 | |||
| Sz 115 | |||
| J16091644-3904438 | |||
| J16092032-3904015 | |||
| J16092317-3904074 | |||
| J16092697-3836269 | |||
| J160934.2-391513 | |||
| J16093928-3904316 | |||
| Sz 117 | |||
| Sz 118 | |||
| J16095628-3859518 | |||
| J16100133-3906449 | |||
| J16101307-3846165 | |||
| J16101857-3836125 | |||
| J16101984-3836065 | |||
| J16102741-3902299 | |||
| J16102955-3922144 | |||
| Sz 123B | |||
| Sz 123A | |||
| J16115979-3823383 | |||
| J16120445-3809589 | |||
| J16124373-3815031 | |||
| J16134410-3736462 |