Estimation of Relationship between
Stimulation Current and Force Exerted
during Isometric Contraction
Abstract
In this study, we developed a method to estimate the relationship between stimulation current and volatility during isometric contraction. In functional electrical stimulation (FES), joints are driven by applying voltage to muscles. This technology has been used for a long time in the field of rehabilitation, and recently application oriented research has been reported. However, estimation of the relationship between stimulus value and exercise capacity has not been discussed to a great extent. Therefore, in this study, a human muscle model was estimated using the transfer function estimation method with fast Fourier transform. It was found that the relationship between stimulation current and force exerted could be expressed by a first-order lag system. In verification of the force estimate, the ability of the proposed model to estimate the exerted force under steady state response was found to be good.
I Introduction
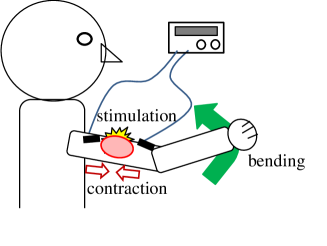
In functional electrical stimulation (FES), a person’s joints are driven by applying current to muscles [1] [2]. A schematic diagram of FES is shown in Fig. 1. In FES, muscle contraction is induced by applying a current to the muscle. The corresponding joint is driven accordingly. This technique has been used in the field of rehabilitation for a long time. Jaime et al. proposed a method of generating standing motion using FES by employing proportional-integral-derivative (PID) control [3]. Farhoud et al. proposed a pedaling operation based on an FES system composed of a sliding mode controller and a fuzzy mode controller [4]. Bouton et al. reported a method of generating desired actions read from electroencephalogram (EEG) by using FES [5].
In addition, research on application development for healthy subjects has been reported in recent years. Tamaki et al. reported hand control techniques based on FES [6]. Pedro et al. proposed a method for presenting the weight of virtual objects by using virtual reality (VR) goggles in conjunction with FES [7]. In addition, we proposed bilateral control based on FES [8] [9] [10] [11]. Bilateral control is a master slave system [12] [13] [14]. In bilateral control, the slave is controlled by FES to follow the movement of the master. In addition, the master can feel the reaction force at the slave. Therefore, the master can judge the state of the slave more clearly.
In general, force control is required when controlling a robot or the like. This makes it possible to construct a good position control method. However, there are few reports on the relationship between stimulus value (i.e. applied voltage or inflow current) and force exerted. This is because, in recent years, methods of the relationship between stimulus value and angles value by neural network (NN) or the like is mainstream [15] [16] [17]. In body control for rehabilitation, the objective can be achieved if position control is possible.
In extant research on force control, Ferrarin et al. proposed a method for approximating the relationship between the applied voltage and the force exerted by using a first-order lag system [18]. However, the basis for using the first-order lag system is not mentioned. Matsui et al. approximated the exiting torque from the inflow current by using a second-order lag system [19]. However, this method employs antagonistic muscle stimulation. Therefore, there is a possibility that characteristics different from those associated with simple muscle stimulation. In addition, the Hammerstein model [20], and a few subsequent improvement have been reported [21] [22]. For control using FES, a method using voltage control [6] [8] [18] and a method using current control [4] [15] [16] have been mixed, but it was not reported as to which value determines the exerted force.
In this paper, we examine the relationship between stimulus value and exerted force. Firstly, the relationship between applied voltage and inflow current is investigated. Secondly, we confirm that the force is determined by the inflow current value. Thirdly, the inflow current is gradually increased, and the threshold current to drive the joint is measured. Next, the transfer function of the current and force are estimated using the transfer function estimation method with fast Fourier transform (FFT). As a result, we could confirm that the relationship between current and force can be represented by a first-order lag system with dead time. Finally, parameters are fitted by multiple regression analysis, and the proposed model is validated.
The remainder of this paper is organized as follows. First, Section II describes FES. Section III describes the transfer function estimation method using FFT. Section IV describes the experimental procedure and its results. Specifically, regarding estimation of the relationship between the voltage and the current, it is demonstrated that the force exerted is determined by inflow current, and the method for estimating the relationship between the current and the force is described. Section V verifies the validity of the proposed method by using stimulus patterns that were not used for modeling. Section VI presents our concluding remarks.
II Functional Electrical Stimulation
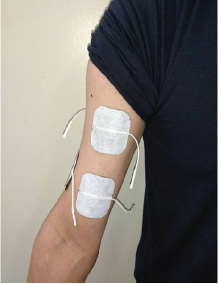
In this section, FES is described. In FES, the voltage is applied to an adhesive pad affixed to the skin surface to pass electric current into the muscle. Muscle contraction is caused by this current, and joints are driven. In this study, we stimulated the biceps brachii muscle and measured the force exerted by the elbow joint. Fig. 2 shows the pad locations. In terms of the stimulation position, the motor point was specified using Compex Performance (“Compex, USA”), and an adhesive pad (dimensions: 50 50 mm; AXELGAARD M MODEL 895220) was affixed at that position.
Human body control by means of FES can be achieved using voltage control or current control. In general, voltage control is safer, because the resistance increases when the pad is about to come off, and the flow of current decreases. When using current control, the current is concentrated in a small area when the pad is about to come off, which is dangerous. In addition, with the flow of current, pH changes to acidic on the anode side and alkaline on the cathode side. With normal electrical stimulation, pH is maintained constant by blood flow, but if condition that pH is different between anode and cathode continues, injuries such as burns may occur. Therefore, we must be aware of the direction of current flowing.
The experimental machine that used in this paper is introduced. In this paper, control was performed by adjusting the voltage within the maximum value of 35 V. The circuit was configured to conform to the Japanese Industrial Standard (JIS). Therefore, the current flowing through the human body was not allowed to exceed 20 mA.
III Estimation of Transfer Function using FFT
In this section, a transfer function estimation method using FFT is described. The Fourier transform is expressed by the following equation:
| (1) |
where represents the time domain, and represents the frequency domain. Discrete Fourier Transform (DFT) and FFT are generally used for Fourier transformation; in this paper, FFT, which can shorten calculation time, was adopted. The transfer function represents the relationship between the input and the output . In the frequency domain,
| (2) |
However, noise is included in the actual measurement. Therefore, we rewrite (2) as follows:
| (3) |
where the superscript represents the complex conjugate of the complex spectrum obtained using the Fourier transform. The denominator in (3) is called the auto power spectrum, and the numerator is called the cross spectrum. By using (3), the influence of noise on the output side can be reduced. By confirming the gain margin and the phase margin of the obtained , it is possible to estimate the transfer function.
IV Experimental Methods and Results
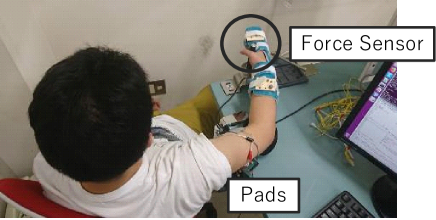
In this section, the procedures and the results of the experiment for modeling the current and the exerted force are described sequentially. Two healthy subjects (referred to as A and B) were used to test the proposed system. Informed consent was obtained from the participants, and the study was approved by Ethics Committee of Saitama University. The experimental setup is indicated in Fig. 3. Subjects sat on the chair so that their arms were level with the floor. The hands of the subjects are fixed with Gibbs. Therefore, the wrist joint cannot exert a force. The subjects were made to allow the hands to hit the force sensor. The force sensor was used by PFS055YA251U6 (“Leptrino, Japan”).
IV-A Relationship between Applied Voltage and Inflow Current
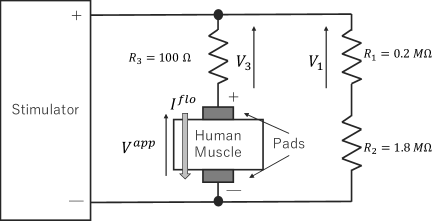
In the experiment conducted herein, the stimulators, pads, and resistors were placed as shown in Fig. 4. Assuming the voltage applied to a person is and the current flowing in the body is , the relationship with the voltage applied across the resistor can be written as follows:
| (4) |
In this paper, the resistances , , and were used. Therefore, (4) can be rewritten as follows:
| (5) |
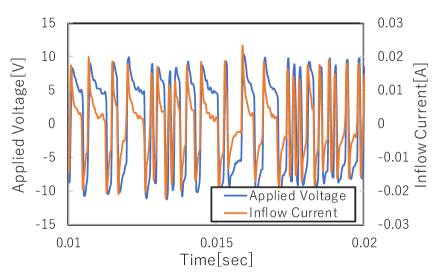
We measured and by using an oscilloscope with a sampling period of sec. Therefore, the sampling frequency was 1.0 MHz. The applied voltage and the actual inflow current in this experiment are shown in Fig. 5. As shown in Fig. 5, the input voltage is an M-series signal that changes randomly at +10 or -10 V at a carrier frequency of 10 kHz. We calculated the relationship between the applied voltage and the inflow current using multiple regression analysis. As a result, the mathematical formula represented by the (6) has the highest correlation value.
| (6) |
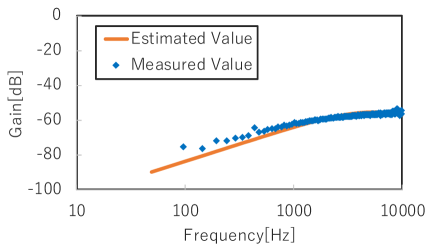
where, , and are constants. These three values were estimated using multiple regression analysis. The fixed values and resonance frequency of each subject are listed in Table I. In addition, the gain margin in the subject A is shown in Fig. 6. The results showed that the resonance frequency of is high frequency. Therefore, is represented by one differentiation in the low frequency range.
| Subject A | Subject B | |
| Resonance frequency [kHz] | 5.6 | 4.6 |
IV-B Stimulus with Long Pulse Width
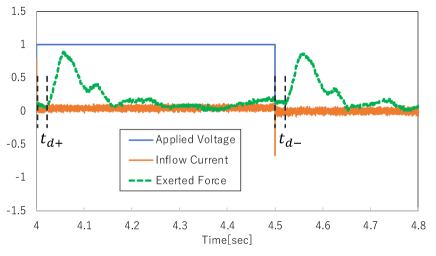
Next, we confirmed which of the applied voltages and the inflow currents are related to the exerted force. The subjects were given electrical stimulation with a pulse width of 500 msec and amplitude of 20 V. Fig. 7 shows the results of normalizing the maximum value, inflow current, and exerted force of the applied voltage of subject A with 1. Three points can be confirmed from the result.
-
•
A dead time of about 20 msec passed until the force was generated after the flow of current.
-
•
The exerted force was generated with a short dead time after the flow of current. In addition, no current flowed for about 100-400 msec, and no force is generated at the time of voltage application. Therefore, the force was determined by the inflow current.
-
•
Forces were generated by the positive current and the negative current, and the characteristics forces were different from each other.
The dead time of each subject was estimated from this experiment. The average of five experimental results was defined as the dead time of each subject. Table II shows the dead times of each subject. The subscripts + and – denote positive and negative currents.
| Subject A | Subject B | |
|---|---|---|
| 0.023 | 0.021 | |
| 0.025 | 0.028 |
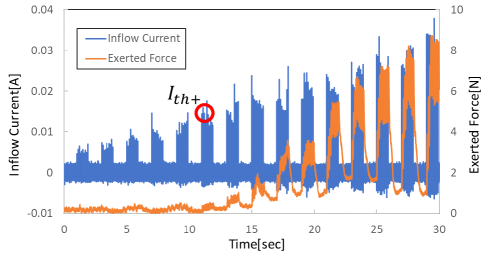
IV-C Measurement of Threshold Current
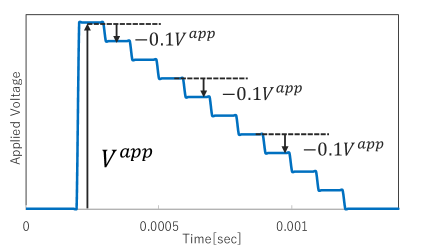
Next, we gradually increased the current flowing into the subject and measured the threshold current required to drive the joint. In the experiment, the voltage corresponding to the stimulation waveform shown in Fig. 8 was applied. The reason for using this shape is that the negative current can be reduced by the waveform shown in Fig. 8, and only the force generated by the positive current can be measured. In addition, by exchanging the positive and negative sides of the stimulation waveform of Fig. 8, only the force due to the negative current can be measured. The stimulation frequency was set to 10 pps (pulses per second), stimulation was performed for 1 sec, and a 1 sec break was set. The initial voltage was 6 V, and it was increased in steps of 2 V. The results of subject B are shown in Fig. 9. There exists a threshold current at which the subject’s joints exert their forces. When the direction of the current changed, the same result was obtained in the experiment, even with a different subject. The threshold current values of each subject are listed in Table III.
| Subject A | Subject B | |
|---|---|---|
| 14.4 | 15.1 | |
| 8.32 | 12.3 |
IV-D Relationship between Inflow Current and Exert Force
For the two subjects, an experiment was conducted in which the stimulation waveform shown in Fig. 8 was randomly applied at intervals of 1 msec. The timing of applying the stimulus was 1000 pps, but the probability of applying the stimulus was 1/2. Therefore, a pseudo M-sequence signal was generated. The maximum amplitude of the voltage was 20 V for both subjects. The inflow current and the exerted force were acquired with a sampling period of 0.1 msec. There after that, decimation was performed to limit the sampling period to 5.0 msec. We estimated the transfer function using the method described in Section III with the 512 pieces of data obtained. The current used in the verification is expressed as follows:
| (7) |
The gain margin in the case of a positive current applied to subject A and the gain margin in the case of a negative current applied to subject B are shown in Figs. 11, and 11, respectively. The results shows that the gain margin changes from a certain point at –20 dB/dec. Therefore, it is inferred that the inflow current and the exerted force constitute a first-order lag system. The transfer function is written with the constants :
| (8) |
These two values were estimated using multiple regression analysis. The fixed values of each subject are shown in Table IV.
| Subject A | Subject B | |
|---|---|---|
| 0.1889 | 0.5789 | |
| 32207 | 4888.2 | |
| 0.2476 | 0.4325 | |
| 13796 | 7331.5 |
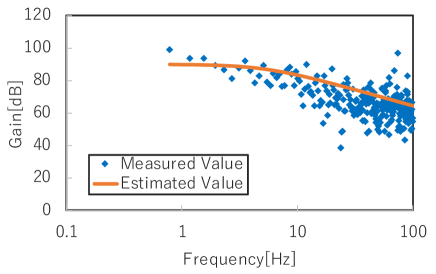
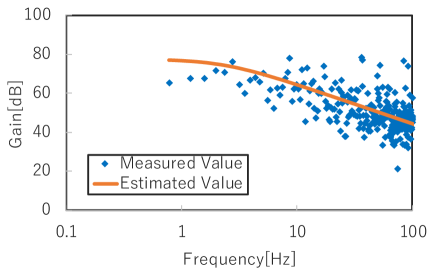
The outline of the transfer function obtained using the values listed in Table IV and (8) is shown by the solid line in Figs. 11, and 11. It was confirmed that the relationship between the inflow current and the exerted force agrees with the result obtained using FFT. From the results, it can be inferred that the relationship between the inflow current and the exerted force is a first-order lag system.
V Verification
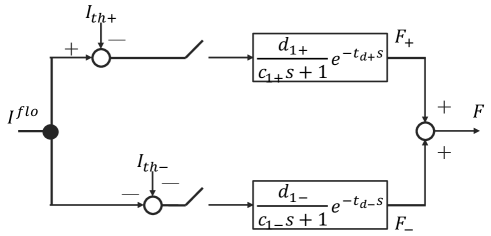
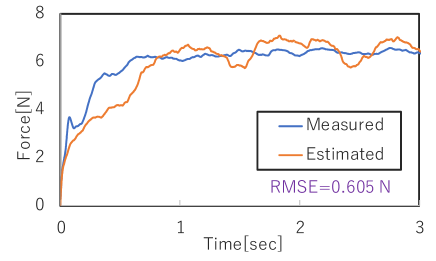
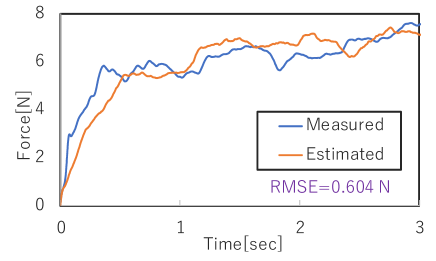
In this section, we verify the accuracy of the force-of-force estimation by employing a stimulation pattern different from the one used in the previous section. From the results in Fig. 7, the positive current and negative current exert power independently. Therefore, the model of human muscle (i.e, the relationship between current and force) is defined in Fig. 12. The stimulus pattern used for verification was an M-sequence signal that changed at +15 V and –15 V at 1000 pps.
The measured and estimated values of the exerted force are shown in Figs. 14, and 14. In addition, the current and the exerted force are passed through a low-pass filter with a cutoff frequency of 100 Hz.
From the results, it is clear that the error is large from the start to about 0.5 sec, but thereafter, the two values agree reasonably. One of the factors that caused errors after starting was incorrect modeling of the transient response. Because the data used to create the model in the proposed method were related to stationary response, there is a high possibility that the model cannot handle transient responses. The goal is to improve the estimation accuracy for transient response in the future.
VI Conclusion
In this paper, we proposed a method modeling the relationship between current and exerted force when using FES. First, we showed that the exerted force is determined by the inflow current. Next, we found that the relationship between the inflow current and exerted force can be formulated as a first-order lag system including dead time. As a result, we confirmed that the proposed method can be used to estimate the ability to exerted force under steady state response. In addition, this result suggests that the method using the conventional pulse width modulation (PWM) method [23] [24] can be applied. By adopting PWM method, performance improvement of control using FES is expected. In the future, we will improve the transient response of the model and improve the overall musculoskeletal system.
Acknowledgement
This work was entrusted by the KDDI Foundation and JST, PRESTO Grant Number JPMJPR1755, Japan.
References
- [1] C. L. Lynch, and M. R. Popovic: “Functional Electrical Stimulation,” IEEE control systems, vol. 28, no. 2, pp. 40–50, 2008.
- [2] E. B. Marsolais, and R. Kobetic: “Functional Walking in Paralyzed Patients by Means of Electrical Stimulation,” Clinical Orthopaedics, and Related Research, vol. 175, pp. 30–36, 1983.
- [3] R. P. Jaime, Z. Matjacic, and K. J. Hunt: “Paraplegic standing supported by FES-controlled ankle stiffness,” IEEE Transactions on Neural Systems and Rehabilitation Engineering, vol. 10, pp. 239–248, 2002.
- [4] A. Farhoud, and A. Erfanian: “Fully Automatic Control of Paraplegic FES Pedaling Using Higher-Order Sliding Mode and Fuzzy Logic Control,” IEEE Transactions on Neural Systems and Rehabilitation Engineering, Vol. 22, No. 3, pp. 533–542, 2014.
- [5] C. E. Bouton, A. Shaikhouni, N. V. Annetta, M. A. Bockbrader, D. A. Friedenberg, et al. “Restoring cortical control of functional movement in a human with quadriplegia.” Nature, vol. 533, no.7602 pp. 247–250, 2016.
- [6] E. Tamaki, T. Miyaki, and J. Rekimoto: “Possessed Hand: Techniques for Controlling Human Hands Using Electrical Muscles Stimuli,” CHI2011, 2010.
- [7] P. Lopes, S. You, L. P. Cheng, S. Marwecki, and P. Baudisch: “Functional Walking in Paralyzed Patients by Means of Electrical Stimulation,” Proceedings of the 2017 CHI Conference on Human Factors in Computing Systems, pp. 1471–1482, 2017.
- [8] T. Kitamura, N. Mizukami, H. Mizoguchi, S. Sakaino, and T. Tsuji: “Bilateral Control in the Vertical Direction Using Functional Electrical Stimulation,” IEEJ Journal of Industry Applications, Vol. 5, No. 5, pp. 398–404, 2016.
- [9] H. Mizoguchi, T. Kitamura, S. Sakaino, and T. Tsuji: “Bilateral Control Using Functional Electrical Stimulation Considering Muscle Length,” The IEEJ International Workshop on Sensing, Actuation, Motion Control, and Optimization, TT8-6, 2016.
- [10] T. Kitamura, N. Mizukami, S. Sakaino, and T. Tsuji: “Bilateral Control of Two-Link Human Arms Using Antagonist Muscle Stimulation,” The IEEJ International Workshop on Sensing, Actuation, Motion Control, and Optimization, 2017.
- [11] T. Kitamura, S. Sakaino, and T. Tsuji: “Bilateral Control Using Functional Electrical Stimulation,” In Proceedings of the 41th Annual Conference of the IEEE Industrial Electronics Society, pp. 2336–2341, 2015.
- [12] D. Yashiro, K. Yubai, and S. Komada: “Fast Estimation of Environment’s Stiffness for Bilateral Control Systems with Communication Delay,” IEEJ Journal of Industry Applications, Vol. 5, No. 6, pp. 422–428, 2015.
- [13] S. Hyodo, and K. Ohnishi: “A Bilateral Control System to Synchronize with Haptic and Visual Sense for Teleoperation over Network,” IEEJ Journal of Industry Applications, Vol. 5, No. 5, pp. 370–377, 2016.
- [14] S. Hyodo, and K. Ohnishi: “An Allocation Method of High Pass Filter for Bilateral Teleoperation System Over Network Considering Stability and Performance,” IEEJ Journal of Industry Applications, Vol. 5, No. 3, pp. 199–205, 2016.
- [15] K. Kurosawa, R. Futami, T. Watanabe, and N. Hoshimiya: “Joint Angle Control by FES Using a Feedback Error Learning Controller,” IEEE Transactions on Neural Systems and Rehabilitation Engineering, vol. 13, no. 3, pp. 359–371, 2005.
- [16] A. Ajoudani, and A. Erfanian: “A neuro-sliding-mode control with adaptive modeling of uncertainty for control of movement in paralyzed limbs using functional electrical stimulation,” IEEE Transactions on Biomedical Engineering, vol. 56, no. 7, pp. 1771–1780, 2009.
- [17] V. Nekoukar, and A. Erfanian: “Adaptive fuzzy terminal sliding mode control for a class of MIMO uncertain nonlinear systems,” Fuzzy Sets and Systems, vol. 179, no. 1, pp. 34–49, 2011.
- [18] M. Ferrarin, and A. Pedotti: “The relationship between electrical stimulus and joint torque: A dynamic model.” IEEE Transactions on Rehabilitation Engineering vol. 8, no. 3 pp. 342–352, 2000.
- [19] K. Matsui, Y. Hishi, K. Maegaki, Y. Yamashita, M. Uemura, H. Hirai, and F. Miyazaki: “Equilibrium-point control of human elbow-joint movement under isometric environment by using multichannel functional electrical stimulation.” Frontiers in Neuroscience vol. 8, no. 164, 2014.
- [20] E. Henneman and C. Olson, “Relations between structure and function in the design of skeletal muscles.” J. Neurophysiol., vol. 28, pp. 581–598, 1965.
- [21] K. J. Hunt, M. Munih, N. de. N. Donaldson, and F. M. D. Barr: “Investigation of the Hammerstein hypothesis in the modeling of electrically stimulated muscle.” IEEE Transactions on Biomedical Engineering, vol. 45, no. 8, pp. 998–1009, 1998.
- [22] T. Schauer, N. O. Negard, F. Previdi, K. J. Hunt, M. H. Fraser, E. Ferchland, and J. Raisch: “Online identification and nonlinear control of the electrically stimulated quadriceps muscle.” Control Engineering Practice vol. 13, no. 9, pp. 1207–1219, 2005.
- [23] M. B. Shamseh, T. Yoshino and A. Kawamura: “Load Current Distribution between Parallel Inverters based on Capacitor Voltage Control for UPS Applications,” IEEJ Journal of Industry Applications, Vol. 6, No. 4, pp. 258–267, 2017.
- [24] H. Hirahara, A. Tanaka, S. Yamamoto, and T. Ara: “Systematic Design of Two-Degree-of-Freedom PID Controller for Positioning and Tracking Drives of Linear Servo Motors,” IEEJ Journal of Industry Applications, Vol. 6, No. 6, pp. 443–448, 2017.