Optical vs electronic gap of hafnia by ab initio Bethe-Salpeter equation
Abstract
We present first-principles many-body perturbation theory calculations of the quasiparticle electronic structure and of the optical response of HfO2 polymorphs. We use the approximation including core electrons by the projector augmented wave (PAW) method and performing a quasiparticle self-consistency also on wavefunctions (QS). In addition, we solve the Bethe-Salpeter equation on top of to calculate optical properties including excitonic effects. For monoclinic HfO2 we find a fundamental band gap of eV (with the direct band gap at eV), and an exciton binding energy of 0.57 eV, which situates the optical gap at eV. The latter is in the range of spectroscopic ellipsometry (SE) experimental estimates (5.5-6 eV), whereas our electronic band gap is well beyond experimental photoemission (PE) estimates ( eV) and previous works. Our calculated density of states and optical absorption spectra compare well to raw PE and SE spectra. This suggests that our predictions of both optical and electronic gaps are close to, or at least lower bounds of, the real values.
Introduction
Hafnia (HfO2) is a transition metal oxide having attracted much attention due to its numerous technological applications, mainly related to its optical and electrical insulating properties. It is used for optical coatingsGilo and Croitoru (1999) in the near-ultraviolet (UV) to infrared (IR) wavelengths range, or as a high permittivity dielectricRobertson (2006) in submicrometer silicon-based technologies. More recently, it is gaining interest as an insulating layer in resistive random access memories (ReRAM)Wong et al. (2012); Bersuker et al. (2011) which are a promising candidate for the next-generation nonvolatile memories.
At ambient pressure, bulk HfO2 exists in three thermodynamically stable crystalline polymorphs. At low temperature, the most stable phase exhibits a monoclinic symmetry (m-HfO2), and transforms into a tetragonal phase (t-HfO2) around 2000 K.Wolten (1963) At higher temperature, the tetragonal structure undergoes another phase transition to a cubic fluorite symmetry (c-HfO2). In contrast to bulk samples, as-deposited HfO2 thin films are typically amorphous but crystallize after anneal.Ho et al. (2003) After crystallization, the lowest-energy monoclinic phase is prevalent, but the presence of tetragonal and metastable orthorhombic phases have also been observed.Ho et al. (2003); Nguyen et al. (2005); Park et al. (2008); Hill et al. (2008) The monoclinic is therefore the reference phase and we will mainly focus on it, except when the other phases are explicitly mentioned.
Several experimental techniques have been employed to characterize HfO2 thin films. On the one hand, both X-ray (XPS) and ultraviolet (UPS) photoemission spectroscopy (PES), and inverse photoemission (IPS) have been used to study the electronic structure. Sayan et al. (2004); Bersch et al. (2008) On the other hand, X-ray or optical absorption, Balog et al. (1977); Toyoda et al. (2004) spectroscopic ellipsometry (SE),Zhu et al. (2002); Edwards (2003); Modreanu et al. (2003); Nguyen et al. (2005); Park et al. (2008); Hill et al. (2008) and electron energy-loss spectroscopy (EELS) Yu et al. (2002); Puthenkovilakam and Chang (2004); Cheynet et al. (2007); Ikarashi and Manabe (2003); Guedj et al. (2014); Hung et al. (2016) have been used to study the optical and dielectric properties. By using linearization and extrapolation techniques over measured spectra, these experiments extracted gap values ranging from 5.1Toyoda et al. (2004) to 5.95 eVModreanu et al. (2003). Surprisingly, the ranges for optical (5.1–5.95 eV) and electronic gaps (5.7–5.86 eV)Sayan et al. (2004); Bersch et al. (2008) overlap, making unclear the distinction between them.
The electronic structure of HfO2 polymorphs has also been studied theoretically. First works on m-HfO2 de Boeri and de Groot (1998); Demkov (2001); Peacock and Robertson (2002); Zhao and Vanderbilt (2002); Fiorentini and Gulleri (2002), by using density functional theory (DFT) in the local density (LDA) or generalized gradient approximation (GGA)Perdew, Burke, and Ernzerhof (1996), found band gaps (3.8–4.0 eV) underestimated by 30% with respect to experimental data. Most recent works, by using advanced semi-empirical functionals like TBmBJOndračka et al. (2016) or many-body perturbation theory (MBPT) in the approximation Grüning, Shaltaf, and Rignanese (2010); Jiang et al. (2010); Van Der Geest, Blaise, and Richard (2012), found band gaps in the range 5.7–5.9 eV and reconciled a good agreement with experimental data. These studies do not account for excitonic effects but agree well with optical gaps derived from SE and EELS.
In this work we revisit the situation. We calculate the electronic structure in the framework of MBPT within the approximation,Hedin (1965); Strinati, Mattausch, and Hanke (1980, 1982) also including core electrons by the projector-augmented wave (PAW) method Blöchl (1994) and applying self-consistency on wavefunctions (QS).Faleev, van Schilfgaarde, and Kotani (2004) On top of QS, we perform Bethe-Salpeter equation (BSE) calculations Salpeter and Bethe (1951); Hanke and Sham (1974, 1979) of the optical gap and spectra including electron-hole interaction (excitonic effects). Furthermore, we perform a careful convergence study of our results (See supplementary material). Finally, instead of comparing our gaps with experimental values, we compare our DOS and optical absorption directly with the raw measured spectra. Our results indicate 5.85 eV (the energy of the first exciton) as a lower bound for the the m-HfO2 optical gap. This is still in the range of the experimentally derived optical gaps. On the other hand, the comparison of our DOS with PES spectra clearly indicate 6.33 eV as a lower bound for the m-HfO2 electronic band gap. Our BSE calculation indicates the first peak of optical absorption as due to an exciton whose binding energy is 0.57 eV.

Computational details
Ab initio calculations based on density functional theoryHohenberg and Kohn (1964); Kohn and Sham (1965) in the LDA or PBEPerdew, Burke, and Ernzerhof (1996) approximations are carried out using the vasp code.Kresse and Furthmüller (1996); Kresse and Joubert (1999) The core-valence interaction are described with PAW datasets including the semicore and states for Hf. Electron wave functions are expanded in a plane waves basis set with kinetic energy cutoff of 500 eV, and the Brillouin zone is sampled using , and -centered Monkhorst-Pack meshes for monoclinic, tetragonal and cubic HfO2 phases, respectively. Many-body effects are accounted for by computing the quasiparticle (QP) energies at the , (self-consistency only on the eigenvalues) and QS level on top of DFT but fixing at . Indeed, fixing has been shown to improve the agreement with experimental band gaps than using self-consistent .Shishkin and Kresse (2007) In contrast to and , QS allows to reduce the influence of the DFT starting point (LDA vs. PBE) on the electronic structure. The cutoff for response function is taken to be 333 eV and about 500 empty bands per formula unit and 100 frequency grid points are needed to obtain converged band gaps within 0.1 eV (see supplementary material for details). QP band structures are interpolated using maximally localized Wannier functions (MLWF) with the Wannier90 code.Mostofi et al. (2014) To determine the optical properties, the Bethe-Salpeter equation (BSE) is solved on top of using the Tamm-Dancoff approximation.Sander, Maggio, and Kresse (2015)
Band gap and electronic structure
In Fig. 1 we report the electronic band structure of m-HfO2, as calculated within DFT in the PBE approximation and within QS. In the monoclinic crystal structure HfO2 presents a direct band gap at , whereas the fundamental minimum band gap is indirect at . Between DFT and the approximation there is some rearrangement of the bands, but the most important effect is a shift of both valence and conduction bands which increases band gaps. This is also what we found for the cubic and tetragonal phases.
| method | cubic | tetragonal | monoclinic |
|---|---|---|---|
| This work | |||
| DFT-LDA | 3.68 | 4.41 | 3.93 |
| LDA+ | 5.63 | 6.40 | 5.95 |
| LDA+ | 6.01 | 6.79 | 6.36 |
| LDA+QS | 6.14 | 6.89 | 6.37 |
| DFT-PBE | 3.76 | 4.64 | 4.01 |
| PBE+ | 5.41 | 6.34 | 5.77 |
| PBE+ | 5.78 | 6.72 | 6.18 |
| PBE+QS | 6.03 | 6.93 | 6.33 |
| Other theoretical works | |||
| DFT-LDAGrüning, Shaltaf, and Rignanese (2010) | 3.5 | 4.1 | 3.8 |
| LDA+Grüning, Shaltaf, and Rignanese (2010, 2018) | 5.2 | 5.8 | 5.7 |
| LDA+Grüning, Shaltaf, and Rignanese (2010) | 5.5 | 6.0 | 5.9 |
| DFT-LDAJiang et al. (2010) | 3.55 | 4.36 | 3.95 |
| LDA+Jiang et al. (2010) | 4.91 | 5.78 | 5.45 |
| LDA+Jiang et al. (2010) | 5.20 | 6.11 | 5.78 |
| DFT-PBEOndračka et al. (2016) | 3.77 | 4.79 | 4.08 |
| TB-mBJ origOndračka et al. (2016) | 5.88 | 6.54 | 5.76 |
| TB-mBJ impOndračka et al. (2016) | 6.17 | 6.81 | 6.01 |
| TB-mBJ semiOndračka et al. (2016) | 6.74 | 7.35 | 6.54 |
| Experimental works | |||
| UPS+IPS (straight line extrapolation)Bersch et al. (2008) | 5.7 | ||
| XPS+IPS (straight line extrapolation)Sayan et al. (2004) | 5.86 | ||
| XPS+IPS (comparison with shifted DFT)Sayan et al. (2004) | 6.7 | ||
In Table 1 we report the fundamental minimum gaps for all phases and approximations considered in this work, and we compare them to previous theoretical works and to experiments. Regarding DFT results, our PAW LDA and PBE gaps are more in agreement with the FP-LAPW (full potential linearized augmented plane wave) LDA and PBE gaps of, respectively, Ref. Jiang et al., 2010 and Ondračka et al., 2016 (both are all-electron calculations), than with the norm-conserving pseudopotentials plane waves (NCPP PW) LDA gap of Ref. Grüning, Shaltaf, and Rignanese, 2010.
On the other hand, both our and band gaps are systematically larger than the ones of Refs. Grüning, Shaltaf, and Rignanese, 2010; Jiang et al., 2010. We remark however that our PAW corrections, , are closer to the NCPP PW onesGrüning, Shaltaf, and Rignanese (2010) than to the FP-LAPWJiang et al. (2010) ones, which are 0.3 to 0.6 eV lower. Differences between Ref. Grüning, Shaltaf, and Rignanese, 2010 and our gaps could then be explained by the different starting DFT gap. Application of self-consistency only on eigenvalues, using the approach, further increases the gap by 0.4 eV in our study and by 0.20.3 eV in Refs. Grüning, Shaltaf, and Rignanese, 2010; Jiang et al., 2010. Full self-consistency also on the wavefunctions,Rangel et al. (2011) using the QS approach,Faleev, van Schilfgaarde, and Kotani (2004) removes any influence of the LDA or PBE starting point in our study, reducing the gap difference to less than 0.1 eV, a residual due to the use of different relaxed LDA and PBE atomic structures.
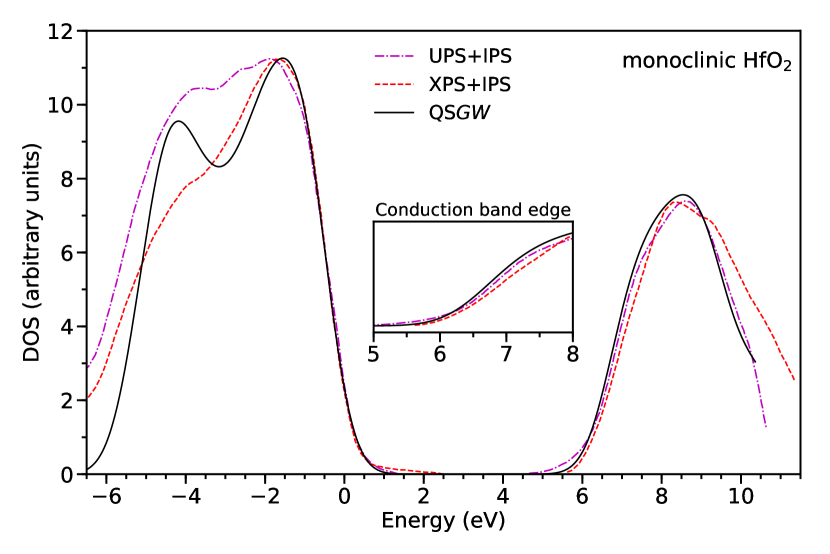
In the following we consider only PBE relaxed atomic structure, the closest to the experiment. Our and QS calculations systematically yield larger band gaps than previous theoretical studies. For the monoclinic phase, our values are 0.40.5 eV larger than the highest estimates of Refs. Jiang et al., 2010; Grüning, Shaltaf, and Rignanese, 2010 and the TB-mBJ-orig of Ref. Ondračka et al., 2016. The latter are in very good agreement with the 5.7 and 5.86 eV band gap values determined from photoemission experiments,Bersch et al. (2008); Sayan et al. (2004) whereas our QS gap of 6.33 eV appears as a large overestimation. However, as discussed in Secs III.C and F of Ref. Sayan et al., 2004, there is some uncertainty in this determination of band gaps by the conventional method of linear extrapolation of photoemission band edges to the background intensity, due to the presence of band-tail and defects in the vicinity of the valence band maximum and conduction band minimum. For this reason we prefer to directly compare the experimental PES+IPS spectra to our calculated DOS (Fig. 2). This comparison was already suggested in the same Ref. Sayan et al., 2004 to provide a safer estimate of the real band gap. By using a DFT-LDA DOS and evaluating the scissor operator shift to make theoretical and experimental DOS coincide, they arrived to an estimate of 6.7 eV for the m-HfO2 band gapSayan et al. (2004). Our QS DOS favorably compares with photoemission spectra, especially on the shape, even though we have not taken into account extrinsic and finite state effects which are evident when comparing XPS with UPS shapes. As it can be estimated by the deviation of theory and experiment in the conduction edge (Fig. 2 inset), our QS band gap of 6.33 eV is still an underestimation of about 0.2 eV of the real band gap. Our more prudent conclusion is that the real band gap of monoclinic HfO2 is eV, and probably eV. This is also what Ondračka et al.Ondračka et al. (2016) found when modifying the TB-mBJ functional (“semi” version in Table 1) to target the experimental DOS. The QS approximation has been reported to systematically overestimate band gaps in all studied materials. Bruneval and Gatti (2014) In our case, for m-HfO2, the close agreement between QS and experimental spectra may be due to fortuitous error cancellation with other effects not taken into account, such as electron-phonon,Poncé et al. (2014) and both single-particle (e.g. spin-orbit) or many-body (e.g. Breit interaction) relativistic corrections.
| method | cubic | tetragonal | monoclinic |
|---|---|---|---|
| This work | |||
| DFT-LDA | 3.68 | 4.58 | 4.03 |
| LDA+ | 5.63 | 6.57 | 6.05 |
| LDA+ | 6.01 | 6.96 | 6.46 |
| LDA+QS | 6.14 | 7.04 | 6.47 |
| DFT-PBE | 3.76 | 4.71 | 4.09 |
| PBE+ | 5.41 | 6.43 | 5.86 |
| PBE+ | 5.78 | 6.81 | 6.27 |
| PBE+QS | 6.03 | 7.01 | 6.41 |
| PBE+QS+BSE | 5.57 | 6.53 | 5.85 |
| 0.46 | 0.48 | 0.57 | |
| Experimental works (optical gap) | |||
| SENguyen et al. (2005) | 5.6–5.8 | ||
| SEHill et al. (2008) | 5.5–6.0 | ||
Optical gap and spectra
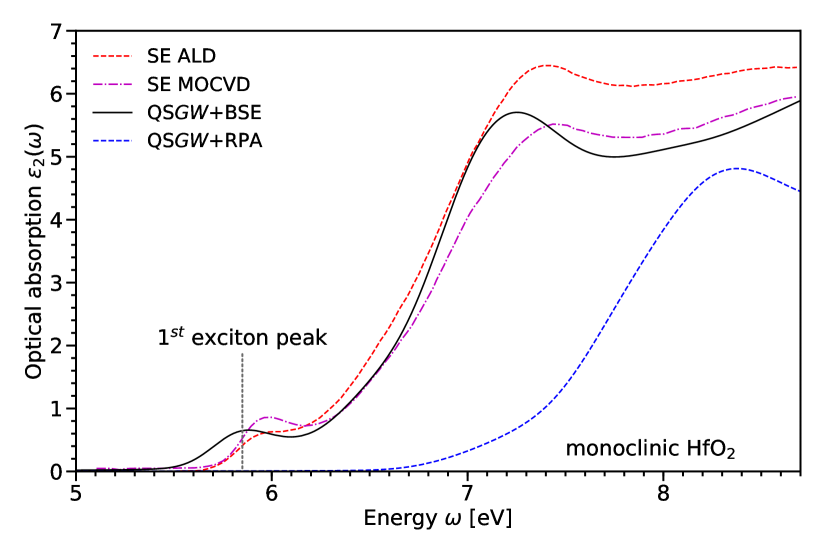
In Table 2 we report all the DFT and direct band gaps, and we add the optical gaps calculated by solving the BSE on top of QS. We also report the first exciton binding energy, defined as the difference between the direct band gap energy and the energy of the first exciton, , found to be 0.57 eV for m-HfO2. Direct band gap and optical gap are significantly different in m-HfO2. The simulated optical gap can now be compared with the measured one, e.g., in optical or X-ray absorption, spectroscopic ellipsometry (SE), or energy-loss (EELS). Refs. Nguyen et al., 2005; Hill et al., 2008 reported values derived from SE spectra of 5.6-5.8 eV and 5.5-6.0 eV, respectively. The uncertainty is due, as for the band edges in the density of states, to the method (e.g. Tauc-Lorentz) used to linearly extrapolate to the background. However, with respect to photoemission, optical experiments are less affected by defect, surface, interface or substrate effects and more sensitive to the bulk. We remark that now our QS+BSE optical gap is in the range of the experimental reports. Nevertheless, we againWeissker et al. (2010) prefer to compare the raw SE spectra to our calculated optical absorption, (see Fig. 3). The QS+BSE dielectric function significantly improves the lower level of approximation QS+RPA, and achieves a very good agreement with SE spectra. BSE introduces electron-hole interaction effects and gives rise to the exciton which is to be identified with the first peak of the BSE spectrum, absent in the RPA. Nevertheless we remark a 0.10.2 eV red shift of the exciton peak with respect to its position in SE spectra. Part of this red shift could be corrected by -point sampling extrapolation to zeroFuchs et al. (2008). Nevertheless, like the band gap, also our optical gap suffer an underestimation, so that they have both to be regarded as lower bounds of the real values.
The nature of this small peak at the optical onset observed in SE spectraNguyen et al. (2005); Park et al. (2008); Hill et al. (2008) of crystalline samples has been attributed to different causes. By combining X-ray absorption (XAS), X-ray diffraction (XRD) and SE techniques, Hill et al.Hill et al. (2008) found that this feature could be intrinsic to the monoclinic phase. According to our analysis, this is a real boundSottile et al. (2007) exciton peak, as correctly interpreted in Refs. Edwards, 2003; Ondračka et al., 2016, and not a defect state, as interpreted by Nguyen et al.Nguyen et al. (2005). The exciton is present only in the polarization (see Fig. 4), confirming the unusual anisotropy in the dielectric properties of m-HfO2Guedj et al. (2014); Hung et al. (2016); Botti et al. (2002). We found an exciton also in c-HfO2 and t-HfO2, but their oscillator strength is zero or almost, so that they are dark excitons not detectable in SE spectra. Hence SE spectra can be used to characterize the HfO2 monoclinic phase with respect to all other phases by simply detecting the presence or absence of the 5.85 eV exciton peak.

Conclusions
In this work we combine QS calculations to compute the electronic structure of HfO2 with BSE to compute optical spectra. We compare our calculated DOS and optical absorption with raw, as-acquired, experimental spectra measured for the monoclinic phase. Our calculated electronic band gap ( eV) is significantly larger than the values obtained in previous theoretical and experimental studies. However the direct comparison between QS DOS and experimental spectra shows a good agreement and even indicates that our band gap value slightly underestimates by eV the real value. In contrast, we obtain an optical gap of 5.85 eV, in agreement with SE estimates. We find that the difference is due to the presence of a bound exciton with a large binding energy of 0.57 eV.
Supplementary Material
See supplementary material for information about the relaxed structures and convergence studies of and BSE calculations.
Acknowledgements
Part of the calculations were run on TGCC/Curie using allocations from GENCI.
| cubic | tetragonal | monoclinic | ||||
|---|---|---|---|---|---|---|
| PBE | LDA | PBE | LDA | PBE | LDA | |
| a (Å) | 5.082 | 4.994 | 3.594 | 3.533 | 5.145 | 5.048 |
| b (Å) | – | – | – | – | 5.206 | 5.142 |
| c (Å) | – | – | 5.225 | 5.076 | 5.326 | 5.206 |
| (∘) | – | – | – | – | 99.63 | 99.53 |
Appendix A Supplementary material
Structural parameters
All our calculations are based on density functional theory within local density approximation (LDA) or generalized gradient approximation (GGA) with the parametrization of Perdew-Burke-Ernzerhof (PBE) in the framework of plane wave projector-augmented wave (PAW) method as implemented in the vasp code.Kresse and Furthmüller (1996); Kresse and Joubert (1999) The DFT calculations are performed using the version 5.4 of LDA and PBE PAW potentials of vasp (Hf_sv_GW and O_GW for Hf and O, respectively).
We study cubic (spacegroup ), tetragonal (spacegroup ) and monoclinic (spacegroup ) phases of HfO2. Each structure is relaxed until the maximum residual forces are less than eV/Å. For the relaxation we use a fine mesh of , and for cubic, tetragonal and monoclinic phases, respectively. Calculated structural parameters are summarized in Table 3.
One-shot convergence
We carefully examine the convergence of our calculations in order to achieve QP band gap values converged within 0.1 eV. Indeed, to calculate the response function and the correlation part of self-energy, a summation over empty states is required and quasi particle (QP) energies exhibit a very slow convergence with respect to the number of virtual orbitals.

| DFT | Convergence parameters | QP energies | ||||||
|---|---|---|---|---|---|---|---|---|
| xc functional | core elect. | mesh | Nb | Dyn. Scr. | (eV) | (eV) | ||
| This work | PBE | PAW | 2000 | Full Freq. | 5.77 | 1.76 | ||
| LDA | 5.95 | 2.02 | ||||||
| PBE | PAW | 2000 | Full Freq. | 6.18 | 2.17 | |||
| LDA | 6.36 | 2.43 | ||||||
| Ref. Grüning, Shaltaf, and Rignanese,2010, 2018 | LDA | NCPP | 600 | GN-PPM | 5.7 | 1.9 | ||
| 5.9 | 2.1 | |||||||
| Ref. Jiang et al.,2010 | LDA | FP-LAPW | — | Analytical cont. | 5.45 | 1.50 | ||
| 5.78 | 1.83 | |||||||
Furthermore, the number of empty bands Nb, the corresponding orbital basis set N (controlled by the plane waves cutoff E) and the size of the response function basis set N (controlled by the plane waves cutoff E) have to be increased simultaneously Klimeš, Kaltak, and Kresse (2014). Therefore, in our convergence study we fix and use the complete plane waves basis set (i.e. Nb = N) for each considered E. We consider the monoclinic phase of HfO2 with ranging from 350 eV to 700 eV. A frequency grid with 100 frequency points is used to represent the polarizability and a -centered k-mesh is used to sample the Brillouin zone. Fig. 5 shows the QP corrections () of the Kohn-Sham eigenvalues as a function of 1/Nb (which equals 1/N) for a calculation on top of PBE (a similar behavior is observed for an LDA starting point). The dotted lines show the linear extrapolation of QP corrections () where only the values corresponding to eV are included in the fit. The extrapolated QP corrections of the valence band maximum (VBM) at and conduction band minimum (CBM) at are respectively -1.33 eV and 0.51 eV giving an extrapolated band gap of 5.85 eV. Our convergence study suggests that a 500 eV plane waves cutoff (3603 plane waves) allows to achieve a band gap converged within 80 meV. For this basis set, the number of empty bands can be decreased to 2000 without deteriorating the convergence (see bottom right panel of Fig. 1 in the main text).
We also check the influence of the number of frequency points and k mesh. We find that increasing the frequency grid from 100 to 200 points only changes the QP band gap by 15 meV but tend to compensate the error done due to incompleteness of the plane waves basis set. When using a finer k-point sampling of , change in the QP band gap is below 1 meV.
Our convergence study shows that the numerical convergence of our calculated QP band gaps is below 80 meV. In table 4, we summarize the convergence parameters used in our work with those from previous theoretical studies.
Self-consistent convergence
Self-consistent calculations are carried out with the same parameters as for . For and QS calculations, we include respectively 256 and 512 QP energies in the self-consistent procedure for monoclinic HfO2. In the case of , 4 self-consistent iterations are enough to get converged band gap. For QS, 8 self-consistent iterations allowed to get converged QP energies and band gaps within 5 meV as shown in Fig. 6.
Bethe-Salpeter equation (BSE) convergence
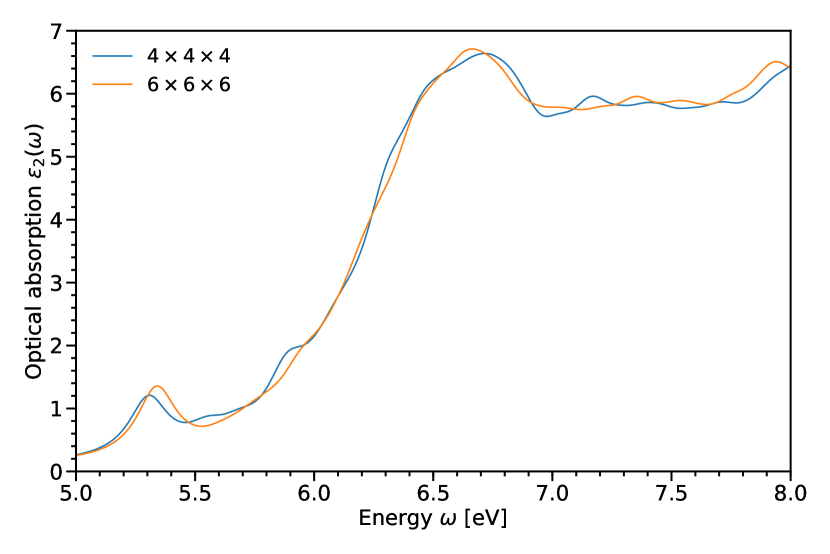
The excitonic properties are determined by solving the Bethe-Salpeter equation (BSE) within the Tamm-Dancoff approximation on top of the quasiparticle band structure. BSE calculations usually require fine k-point sampling to converge exciton spectra. However such calculations are computationally very expensive for both and BSE. In the case of monoclinic HfO2 we test the k-point convergence of the BSE calculation on top of using and grids. Fig. 7 shows the imaginary part of the dielectric function (we ignore the polarization dependence and assume ). A simple visual inspection suggests that the two k-meshes give very similar spectra. More quantitatively, the exciton binding energies of and meshes are 0.56 eV and 0.52 eV, respectively.
A more complete convergence study with respect to k-mesh could be carried out using a model BSE (mBSE) scheme or interpolation techniques but have not been considered in this work.
DOS
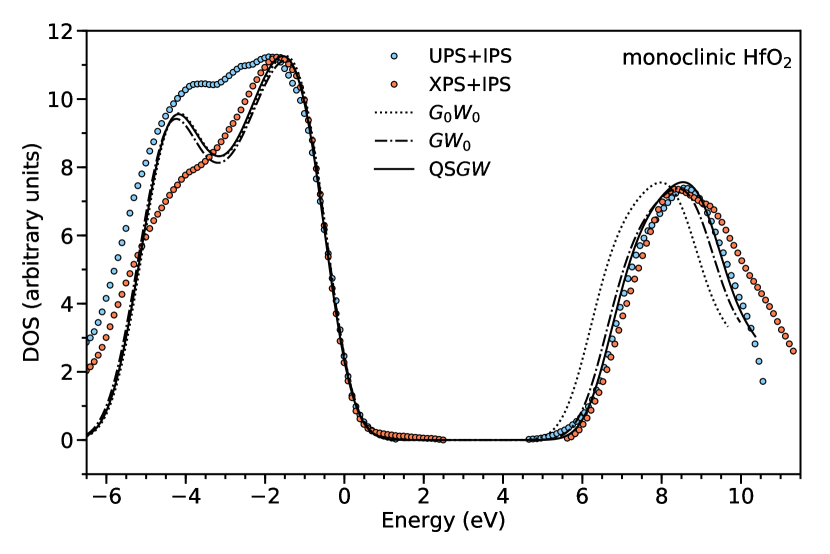
For monoclinic HfO2, we present in Fig. 8 the density of states (DOS) calculated in the , , and QS approximations compared to the experimental UPS+IPSBersch et al. (2008) and XPS+IPSSayan et al. (2004) spectra. The figure shows that the theoretical underestimation of the band gap decreases from , passing by , to QS.
References
- Gilo and Croitoru (1999) M. Gilo and N. Croitoru, Thin Solid Films 350, 203 (1999).
- Robertson (2006) J. Robertson, Rep. Prog. Phys. 69, 327 (2006).
- Wong et al. (2012) H.-S. Wong, H.-Y. Lee, S. Yu, Y.-S. Chen, Y. Wu, P.-S. Chen, B. Lee, F. Chen, , and M.-J. Tsai, Proceedings of the IEEE 100, 1951 (2012).
- Bersuker et al. (2011) G. Bersuker, D. C. Gilmer, D. Veksler, P. Kirsch, L. Vandelli, A. Padovani, L. Larcher, K. McKenna, A. Shluger, V. Iglesias, M. Porti, and M. Nafría, J. Appl. Phys. 110, 124518 (2011).
- Wolten (1963) G. M. Wolten, J. Am. Ceram. Soc. 46, 418 (1963).
- Ho et al. (2003) M.-Y. Ho, H. Gong, G. D. Wilk, B. W. Busch, M. L. Green, P. M. Voyles, D. A. Muller, M. Bude, W. H. Lin, A. See, M. E. Loomans, S. K. Lahiri, and P. I. Räisänen, J. Appl. Phys. 93, 1477 (2003).
- Nguyen et al. (2005) N. V. Nguyen, A. V. Davydov, D. Chandler-Horowitz, and M. M. Frank, Appl. Phys. Lett. 87, 192903 (2005).
- Park et al. (2008) J.-W. Park, D.-K. Lee, D. Lim, H. Lee, and S.-H. Choi, J. Appl. Phys. 104, 033521 (2008).
- Hill et al. (2008) D. H. Hill, R. A. Bartynski, N. V. Nguyen, A. C. Davydov, D. Chandler-Horowitz, and M. M. Frank, J. Appl. Phys. 103, 093712 (2008).
- Sayan et al. (2004) S. Sayan, T. Emge, E. Garfunkel, X. Zhao, L. Wielunski, R. A. Bartynski, D. Vanderbilt, J. S. Suehle, S. Suzer, and M. Banaszak-Holl, J. Appl. Phys. 96, 7485 (2004).
- Bersch et al. (2008) E. Bersch, S. Rangan, R. A. Bartynski, E. Garfunkel, and E. Vescovo, Phys. Rev. B 78, 085114 (2008).
- Balog et al. (1977) M. Balog, M. Schieber, M. Michman, and S. Patai, Thin Solid Films 41, 247 (1977).
- Toyoda et al. (2004) S. Toyoda, J. Okabayashi, H. Kumigashira, M. Oshima, K. Ono, M. Niwa, K. Usuda, and N. Hirashita, J. Electron. Spectrosc. Relat. Phenom. 137-140, 141 (2004).
- Zhu et al. (2002) W. J. Zhu, T. Tamagawa, M. Gibson, T. Furukawa, and T. P. Ma, IEEE Electron Device Lett. 23, 649 (2002).
- Edwards (2003) N. V. Edwards, AIP Conf. Proc. 683, 723 (2003).
- Modreanu et al. (2003) M. Modreanu, P. K. Hurley, B. J. OŚullivan, B. OĹooney, J.-P. Senateur, H. Rousell, F. Rousell, M. Audier, C. Dubourdieu, I. W. Boyd, Q. Fang, T. L. Leedham, S. A. Rushworth, A. C. Jones, H. O. Davies, and C. Jimenez, Proc. SPIE 4876, 1236 (2003).
- Yu et al. (2002) H. Y. Yu, M. F. Li, B. J. Cho, C. C. Yeo, M. S. Joo, D.-L. Kwong, J. S. Pan, C. H. Ang, J. Z. Zheng, and S. Ramanathan, Appl. Phys. Lett. 81, 376 (2002).
- Puthenkovilakam and Chang (2004) R. Puthenkovilakam and J. P. Chang, J. Appl. Phys. 96, 2701 (2004).
- Cheynet et al. (2007) M. C. Cheynet, S. Pokrant, F. D. Tichelaar, and J.-L. Rouvière, J. Appl. Phys. 101, 054101 (2007).
- Ikarashi and Manabe (2003) N. Ikarashi and K. Manabe, J. Appl. Phys. 94, 480 (2003).
- Guedj et al. (2014) C. Guedj, L. Hung, A. Zobelli, P. Blaise, F. Sottile, and V. Olevano, Appl. Phys. Lett. 105, 222904 (2014).
- Hung et al. (2016) L. Hung, C. Guedj, N. Bernier, P. Blaise, V. Olevano, and F. Sottile, Phys. Rev. B 93, 165105 (2016).
- de Boeri and de Groot (1998) P. K. de Boeri and R. A. de Groot, J. Phys. Cond. Matt. 10, 10241 (1998).
- Demkov (2001) A. A. Demkov, Phys. Stat. Sol. (b) 226, 57 (2001).
- Peacock and Robertson (2002) P. W. Peacock and J. Robertson, J. Appl. Phys. 92, 4712 (2002).
- Zhao and Vanderbilt (2002) X. Zhao and D. Vanderbilt, Phys. Rev. B 65, 233106 (2002).
- Fiorentini and Gulleri (2002) V. Fiorentini and G. Gulleri, Phys. Rev. Lett 89, 266101 (2002).
- Perdew, Burke, and Ernzerhof (1996) J. P. Perdew, K. Burke, and M. Ernzerhof, Phys. Rev. Lett. 77, 3865 (1996).
- Ondračka et al. (2016) P. Ondračka, D. Holec, D. Nečas, and L. Zajíčková, J. Phys. D: Appl. Phys. 49, 395301 (2016).
- Grüning, Shaltaf, and Rignanese (2010) M. Grüning, R. Shaltaf, and G.-M. Rignanese, Phys. Rev. B 81, 035330 (2010).
- Jiang et al. (2010) H. Jiang, R. I. Gomez-Abal, P. Rinke, and M. Scheffler, Phys. Rev. B 81, 085119 (2010).
- Van Der Geest, Blaise, and Richard (2012) A. G. Van Der Geest, P. Blaise, and N. Richard, Phys. Rev. B 86, 085320 (2012).
- Hedin (1965) L. Hedin, Phys. Rev. 139, A796 (1965).
- Strinati, Mattausch, and Hanke (1980) G. Strinati, H. J. Mattausch, and W. Hanke, Phys. Rev. Lett. 45, 290 (1980).
- Strinati, Mattausch, and Hanke (1982) G. Strinati, H. J. Mattausch, and W. Hanke, Phys. Rev. B 25, 2867 (1982).
- Blöchl (1994) P. E. Blöchl, Phys. Rev. B 50, 17953 (1994).
- Faleev, van Schilfgaarde, and Kotani (2004) S. V. Faleev, M. van Schilfgaarde, and T. Kotani, Phys. Rev. Lett. 93, 126406 (2004).
- Salpeter and Bethe (1951) E. E. Salpeter and H. A. Bethe, Phys. Rev. 84, 1232 (1951).
- Hanke and Sham (1974) W. Hanke and L. J. Sham, Phys. Rev. Lett. 33, 582 (1974).
- Hanke and Sham (1979) W. Hanke and L. J. Sham, Phys. Rev. Lett. 43, 387 (1979).
- Hohenberg and Kohn (1964) P. Hohenberg and W. Kohn, Phys. Rev. 136, B864 (1964).
- Kohn and Sham (1965) W. Kohn and L. J. Sham, Phys. Rev. 140, A1133 (1965).
- Kresse and Furthmüller (1996) G. Kresse and J. Furthmüller, Phys. Rev. B 54, 11169 (1996).
- Kresse and Joubert (1999) G. Kresse and D. Joubert, Phys. Rev. B 59, 1758 (1999).
- Shishkin and Kresse (2007) M. Shishkin and G. Kresse, Phys. Rev. B 75, 235102 (2007).
- Mostofi et al. (2014) A. A. Mostofi, J. R. Yates, G. Pizzi, Y.-S. Lee, I. Souza, D. Vanderbilt, and N. Marzari, Comput. Phys. Commun. 185, 2309 (2014).
- Sander, Maggio, and Kresse (2015) T. Sander, E. Maggio, and G. Kresse, Phys. Rev. B 92, 045209 (2015).
- Grüning, Shaltaf, and Rignanese (2018) M. Grüning, R. Shaltaf, and G.-M. Rignanese, private communication (2018).
- Rangel et al. (2011) T. Rangel, A. Ferretti, P. E. Trevisanutto, V. Olevano, and G.-M. Rignanese, Phys. Rev. B 84, 045426 (2011).
- Bruneval and Gatti (2014) F. Bruneval and M. Gatti, “Quasiparticle self-consistent GW method for the spectral properties of complex materials,” in First Principles Approaches to Spectroscopic Properties of Complex Materials (Springer Berlin Heidelberg, Berlin, Heidelberg, 2014) pp. 99–135.
- Poncé et al. (2014) S. Poncé, G. Antonius, P. Boulanger, E. Cannuccia, A. Marini, M. Côté, and X. Gonze, Comp. Mat. Science 83, 341 (2014).
- Weissker et al. (2010) H.-C. Weissker, J. Serrano, S. Huotari, E. Luppi, M. Cazzaniga, F. Bruneval, F. Sottile, G. Monaco, V. Olevano, and L. Reining, Phys. Rev. B 81, 085104 (2010).
- Fuchs et al. (2008) F. Fuchs, C. Rödl, A. Schleife, and F. Bechstedt, Phys. Rev. B 78, 085103 (2008).
- Sottile et al. (2007) F. Sottile, M. Marsili, V. Olevano, and L. Reining, Phys. Rev. B 76, 161103 (2007).
- Botti et al. (2002) S. Botti, N. Vast, L. Reining, V. Olevano, and L. C. Andreani, Phys. Rev. Lett. 89, 216803 (2002).
- Klimeš, Kaltak, and Kresse (2014) J. Klimeš, M. Kaltak, and G. Kresse, Phys. Rev. B 90, 075125 (2014).