Expansion and Age of the X-ray Synchrotron-dominated Supernova Remnant G330.2+1.0
Abstract
We report new Chandra observations of one of the few Galactic supernova remnants whose X-ray spectrum is dominated by nonthermal synchrotron radiation, G330.2+1.0. We find that between 2006 and 2017, some parts of the shell have expanded by about 1%, giving a free-expansion (undecelerated) age of about 1000 yr, and implying shock velocities there of 9000 km s-1 for a distance of 5 kpc. Somewhat slower expansion is seen elsewhere around the remnant periphery, in particular in compact knots. Because some deceleration must have taken place, we infer that G330.2+1.0 is less than about 1000 yr old. Thus, G330.2+1.0 is one of only four Galactic core-collapse remnants of the last millennium. The large size, low brightness, and young age require a very low ambient density, suggesting expansion in a stellar-wind bubble. We suggest that in the east, where some thermal emission is seen and expansion velocities are much slower, the shock has reached the edge of the cavity. The high shock velocities can easily accelerate relativistic electrons to X-ray-emitting energies. A few small regions show highly significant brightness changes by – , both brightening and fading, a phenomenon previously observed in only two supernova remnants, indicating strong and/or turbulent magnetic fields.
The Astrophysical Journal Letters, 2018, 868, L21
1 Introduction
The fast shocks in young supernova remnants (SNRs) accelerate particles to high enough energies to emit synchrotron radiation from radio to X-ray wavelengths. Studying such remnants can provide information on the detailed physics of the acceleration process. In a few remnants, synchrotron X-rays are not only present, but dominate the spectrum (see Reynolds 2008 for a review). While several are quite well known, one lesser-known object has received recent attention, with a dominant synchrotron spectrum, thermal emission in a few locations, and a compact central object (CCO), presumably a neutron star: G330.2+1.0 (Park et al., 2006, 2009; Torii et al., 2006).
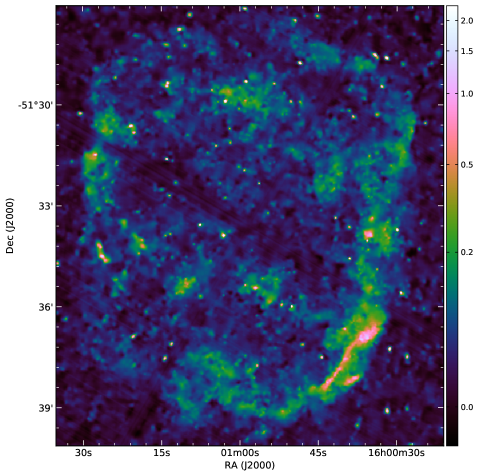
At radio wavelengths, G330.2+1.0 has a distorted shell morphology with a much brighter, confused region to the east (Caswell et al., 1983). In X-rays (Figure 1), the shell is clearer, coinciding fairly well with much of the faint radio shell.
G330.2+1.0 was observed with Chandra (Park et al., 2009) for 50 ks in 2006, and with XMM-Newton in 2008 (Park et al., 2009, with an effective exposure 33 ks) and 2015 (Williams et al., 2018, hereafter W18, with effective exposure of about 90 ks). Line emission is virtually absent except in a region in the east (E) near the radio maximum. For the rest of the remnant, the X-ray spectrum between 1 and 7 keV can be well described by a single power law of photon index (Park et al. 2009; W18), with little variation across the remnant, including not only the clear shell, but emission from the faint interior (W18). These values are typical for power-law components seen in other SNRs with nonthermal X-ray emission (e.g., RX J1713.73946; Katsuda et al., 2015). However, the spectrum could also be well described with a simple model of synchrotron emission from a power-law energy distribution of electrons with an exponential cutoff at some energy (model srcut in XSPEC; Reynolds & Keohane, 1999). The photon frequency corresponding to was found to be around Hz, which is quite a high value; only the youngest Galactic SNR G1.9+0.3 has a higher one, of about Hz (Reynolds et al., 2009).
H I absorption observations give a minimum distance of 4.9 kpc (McClure-Griffiths et al., 2001), the distance to some H I emission regions with which it might be interacting. While a distance as large as 10 kpc cannot be ruled out, it would imply unlikely properties such as an age of 4000 yr for a synchrotron-dominated SNR, and a -distance of 200 pc above the Galactic plane for a core-collapse SNR. So we take a distance of kpc, at which the mean angular radius of about corresponds to a linear radius of pc. W18 use the thermal fits to the east region to obtain an emission measure and an estimate of the preshock density in that region of about cm-3, but the absence of thermal emission elsewhere suggests that this value is higher than typical for the remnant environment. W18 find an electron temperature keV for a shock velocity of order 650 km s-1; again, this is unlikely to typify the remnant as a whole.
2 Observations and Expansion Measurement Methods
Chandra observed G330.2+1.0 again in two 74.1 ks exposures with the Advanced Charge-coupled Device (CCD) Imaging Spectrometer (ACIS) I array on 2017 May 2 and 5, in Very Faint mode. We used CIAO version 4.9 and CALDB version 4.7.8 to reprocess these observations, align them using the centrally located CCO, and finally merge them together. No particle flares were found. The total exposure time is 148.3 ks. A smoothed X-ray image, extracted from merged and smoothed Chandra datacubes, is shown in Figure 1. The remnant’s faintness forces us to select only those emission features that are bright and sharp enough to measure expansion reliably (see Figures 2 and 3 for their location within the remnant).
The first-epoch Chandra observations of G330.2+1.0 in 2006, also using the ACIS-I array in the Very Faint mode, were reprocessed in the same way as the second epoch observations. The exposure time is much shorter (50 ks), so the uncertainties in our expansion measurements are almost entirely due to the poor signal-to-noise ratio (S/N) of the first-epoch observations. The CCO was used for inter-epoch alignment, but a point source reference frame was also examined, in both cases using the same techniques as in our expansion measurements of the 500 yr old pulsar wind nebula in the SNR Kes 75 (Reynolds et al., 2018, hereafter R18). There are 18 sources with off-axis angle , encompassing our selected emission features, that are suitable for the astrometric alignment. Our null hypothesis is that their displacements between the two epochs, measured after alignment to the CCO and normalized by errors estimated as in R18, satisfy the Rayleigh distribution that is expected if the alignment were perfect. The Kolmogorov–Smirnov test fails to reject this hypothesis with confidence. The CCO and point source reference frames are displaced by only 77 mas when measured using point sources with where our source position measurements are most reliable. The estimated (as in R18, ) positional uncertainties for the CCO are only slightly smaller, about 60 mas (at confidence) for each pointing. Therefore, we find no evidence for misalignment of point sources or a discernible CCO motion.
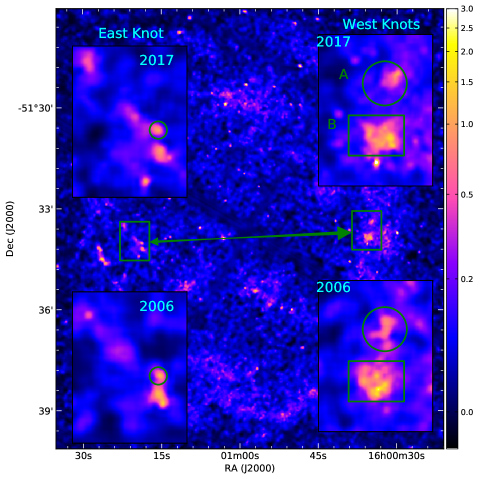
The time baseline between the 2006 and 2017 observations is 10.95 yr, long enough to reliably measure expansion of most of the selected emission features with a variation of the method used by R18. First, we extracted a datacube from the merged 2017 data, with image pixels and 16 spectral channels, in the energy range from to keV. The spatial pixel size is (slightly more than of an ACIS pixel). We smoothed this datacube with the multiscale partitioning method of Krishnamurthy et al. (2010), and then extracted smoothed images. Three relatively high-surface-brightness emission knots (Figure 2), one in the east and two in the west, are significantly more compact than more diffuse rims and filaments in north-northwest, west-northwest, and southwest (Figure 3). The East Knot is the most compact (FWHM of ). In order to avoid oversmoothing this and the other two knots, the penalty parameter that controls smoothing was set to in this case (the smoothed image is shown in Figure 2) vs. for the rest of G330.2+1.0 (Figures 1 and 3). (Oversmoothing of the knots using the penalty parameter of simply degrades our measurements; e.g., the expansion variance for the East Knot increases by over without any significant change in the measured expansion.) After particle background subtraction and normalization by a monochromatic ( keV) exposure map, these smoothed images are used as models for the brightness distribution of the selected emission features of interest.
The smoothed 2017 models are fit to the unsmoothed – keV image from 2006 using Markov chain Monte Carlo (MCMC) methods as implemented in the PyMC software package (Patil et al., 2010). (But we show parts of a smoothed 2006 image in Figures 2 and 3 instead of the unsmoothed image – the penalty parameter was set to in smoothing the 2006 datacube from which this smoothed image was extracted.) Poisson statistics are assumed. In our MCMC simulations, we allow for changes in the physical image scale and in the surface-brightness scale factor . Expansion is centered on the CCO. Spatial variations in the effective exposure time are accounted for by the monochromatic ( keV) exposure map. The particle background is modeled as described in Bartalucci et al. (2014). A uniform prior is assumed for expansion, reflecting our prior (lack of) knowledge about the age and dynamics of G330.2+1.0.
Approximately, the scale factor can be considered as a proxy for the (scaled) photon flux within each of our regions. We use a Gaussian prior for with mean of unity and variance . The lower bound to is (where and are the total number of source and background counts within each of our regions in 2017). We conservatively assume the variance to be twice as large, equal to . But for three regions in the southwest that unexpectedly showed evidence for apparent flux variations between the two epochs, Southwest Rims A and B, and Southwest Outer Rim, we further relaxed the prior for by setting to . We list estimated in this way in the second column of Table 1.
For each region, our MCMC simulations involved about 15 chains, each 4000 iterations in length. We list chain-averaged means for expansion (and expansion rate) and in Table 1. Approximate radial distances measured from images, together with radial proper motions and velocities, are also listed there. Two sets of credible intervals are provided, corresponding to and quantiles from MCMC draws. Unless noted otherwise, we refer to the first set (corresponding to errors) when quoting errors on expansion, , and on other derived quantities.
3 Results and Discussion
| Region | aaWidth of Gaussian prior for the surface brightness scaling factor (its mean was set to unity). | bbSurface brightness scaling factor. | Expansion | Expansion Rate | Distance | ccRadial proper motion. | ddExpansion velocity is , with the distance in units of 5 kpc. |
|---|---|---|---|---|---|---|---|
| (%) | (% yr-1) | (arcsec) | (arcsec yr-1) | (km s-1) | |||
| North-northwest Rim | |||||||
| West-northwest Rim | |||||||
| West Knot A | |||||||
| West Knot B | |||||||
| Southwest Rim A | |||||||
| Southwest Rim B | |||||||
| Southwest Rim C | |||||||
| Southwest Rim D | |||||||
| Southwest Rim E | |||||||
| Southwest Outer Rim | |||||||
| East Knot | |||||||
Note. — Credible intervals are two sets of and quantiles from MCMC draws.
G330.2+1.0 shows a highly irregular blast wave and a number of compact emission knots to the east and west of the CCO (Figure 1). We highlight three such emission knots in Figure 2, West Knots A and B, and the East Knot. They have contrasting spectral properties, with West Knots having hard spectra typical of emission in the western part of G330.2+1.0, thus being most prominent in the hard (– keV) energy band in Figure 1 of W18 (see their region ). The East Knot is in the inner part of a region labeled as “therm” in this Figure, within the most distinct knot of thermal emission there that is very prominent in the – keV band, so its spectrum is presumably thermal. All three knots are moving away from the CCO with comparable expansion rates: yr-1 and yr-1 for the West Knots A and B, and yr-1 for the East Knot (Table 1). We identify the East Knot with a dense clump of supernova (SN) ejecta because of its compactness, soft spectrum, and high transverse motion of km s-1. The West Knots might also be associated with fast-moving ejecta clumps, although their densities are probably much lower. Because their velocities are much higher, km s-1 for the West Knot B and possibly even more for the West Knot A, nonthermal emission is likely to be more efficiently produced, perhaps accounting for the profound differences in X-ray spectral properties between the East and West Knots.
The East and West Knots are located on opposite sides of the CCO. This allows us to relax our approximation that the CCO has not moved away from the SN explosion site, by allowing these knots to expand uniformly around a common expansion center that may not coincide with the CCO. A 2D Gaussian prior with the FWHM of centered on the CCO was used for the expansion center. Its width was chosen to exclude unrealistically large () displacements produced by a hypothetical neutron star with age longer than 1500 yr that is moving with the transverse velocity of km s-1 or more. We obtain an expansion rate of yr-1, virtually identical to yr-1 obtained with the expansion centered on the CCO. Allowing for the CCO motion results in only a modest loss in precision, and a statistically insignificant increase in expansion.
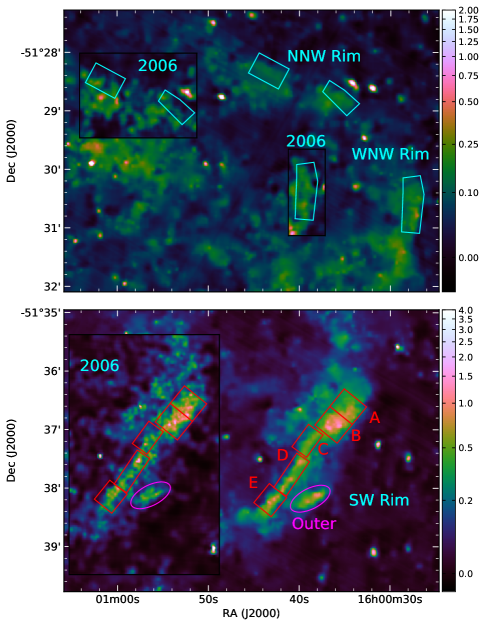
The strongly nonspherical blast wave extends farthest away from the CCO toward the northwest, with sharp rims visible in the north-northwest and west-northwest (upper panel in Figure 3). While a chip gap divides the north-northwest rim, expansion was measured by combining the two apparently noncontiguous rim sections. We find expansion rates of yr-1 and yr-1 in north-northwest and west-northwest, virtually identical within errors (the weighted expansion rate is yr-1), and also comparable to the expansion found for the ejecta knots in the east and west (Figure 4). But the blast wave velocities of km s-1 in west-northwest and km s-1 in north-northwest are much larger than velocities of the compact knots.
The bright rim in the southwest of G330.2+1.0 has a complex morphology, with an inward-facing rim and a detached outer section that is perhaps not physically related. Figure 3 (lower panel) shows five regions spanning the entire bright inward-facing rim and an additional outer region where we measured radial expansion. We found no measurable motions near the apex of the Southwest Rim closest to the CCO, but a significant expansion is detected on either side of it (Table 1 and Figure 4). The fastest expansion is found at the northwest and southeast tips of the Sothwest Rim (labeled A and E in Figure 3): yr-1 and yr-1, respectively. This is still less than in the northwest or for the ejecta knots, but the radial velocity of km s-1 at its southeast tip is still impressive.
The scale factor is significantly above unity in the Southwest Rim northwest of its apex, and below unity for the Southwest Outer Rim (Table 1). The former includes the brightest part of G330.2+1.0, the Southwest Rim B, that faded by . Even more pronounced () fading is found for the adjacent Southwest Rim A, while the Southwest Outer Rim brightened by a comparable () amount. Such large flux variations cannot be accounted for by either statistical errors (see Table 1) or by systematic calibration errors that can reach only about 111http://cxc.harvard.edu/cal/summary/Calibration_Status_Report.html#ACIS_EA for a highly absorbed source such as G330.2+1.0. X-ray flux variations of any kind are rare in shell SNRs. Small-scale variations have been reported in the synchrotron-dominated shell remnant G347.30.5 (RX J1713.73946; Uchiyama et al., 2007) while SN 1006, also synchrotron-dominated, shows no such variations (Katsuda et al., 2010). Such variations seem to require magnetic fields strongly amplified in the shock waves (Uchiyama et al., 2007), but turbulent fields need not be as large on average (Bykov et al., 2008).
The very fast blast wave propagating through a low-density medium such as encountered in the northwest must have hit a dense obstacle in the southwest some time ago. The blast wave first arrived near the apex of the Southwest Rim, slowed down there, then started to wrap around this obstacle. Qualitatively, the observed expansion pattern and the overall geometry of the Southwest Rim are consistent with this scenario. Rapid brightness variations might also be expected for a relatively recent interaction.

Our expansion rates in the north and west of order 0.1% yr-1 give an undecelerated age of 1000 yr (800 yr for the fastest knot, West Knot A). As some deceleration has almost certainly occurred, these are upper limits. Evidently G330.2+1.0 is one of the youngest SNRs in the Galaxy, probably younger even than the synchrotron-X-ray-dominated Type Ia remnant SN 1006. Along with Cas A, Kes 75 (R18), and the Crab, G330.2+1.0 is one of the four youngest Galactic core-collapse remnants known. Even with the uncertain distance, the shock speeds that we measure are among the fastest ever measured for an SNR. Only G1.9+0.3, with speeds of order 14,000 km s-1 (Carlton et al., 2011), has significantly faster shocks.
The large average size ( pc), the young age of less than 1000 yr, very high shock speeds up to 9000 km s-1, and very low flux imply a very low mean density of ambient material that is typical of wind-blown bubbles around massive stars. However, the presence of thermal emission in the east quadrant indicates a considerably higher density there (W18). We suggest that G330.2+1.0 is expanding in an asymmetric cavity, likely produced by pre-supernova mass loss, but that in the east, the blast wave has reached the cavity wall and is expanding into much denser material. Then G330.2+1.0 is the first core-collapse SNR for which the interaction with a cavity wall has begun but is not complete, similar to the (probable) Type Ia remnant RCW 86 (Williams et al., 2011). A number of small-scale emission features are found in the east (Figure 1), suggesting a considerable amount of clumpiness within or near the cavity wall.
The high shock velocities that we find can easily account for the high rolloff frequencies of the synchrotron emission. If electron acceleration is limited by radiative losses, that frequency is independent of magnetic field: Hz, where is the shock velocity in units of cm s-1, is the scattering mean free path of a relativistic electron in units of its gyroradius (the “gyrofactor”), and is a factor accounting for obliquity-dependence of shock acceleration (Reynolds, 1998). For a strong, turbulent shock we expect . The observed values of rolloff frequency, about Hz, then require only lower than most of the velocities that we measure. The shock velocities are so high that the age-limited maximum electron energy, which varies as , is much higher than the loss-limited energy and hence not relevant.
W18 find no appreciable variation in rolloff frequencies among 14 positions around the rim, with uncertainties of order (60 – 80)%, suggesting that unlike SN 1006, where systematic variations with azimuth of an order of magnitude are seen (Miceli et al., 2009) and attributed to systematic variations in shock obliquity, the upstream magnetic-field direction outside G330.2+1.0 is far from uniform.
4 Conclusions
We have measured the expansion of the X-ray-synchrotron-dominated SNR G330.2+1.0 between 2006 and 2017. We find expansion rates of up to 0.12% yr-1, for an undecelerated age of less than 1000 yr. Because some deceleration is certain to have occurred, the true age is even less. G330.2+1.0 is thus among the youngest core-collapse SNRs in the Galaxy, and has shock velocities faster than all known SNRs except the youngest Galactic SNR G1.9+0.3, thought to be Type Ia, whose X-rays are also dominated by synchrotron emission. The shock velocities in G330.2+1.0 range up to 9000 km s-1, in regions somewhat farther from the center than the average radius, where we presume the central neutron star to be the expansion center. Some distinct blobs have somewhat slower expansion rates, corresponding to speeds of about 3000 – 5000 km s-1, and softer spectra, suggestive of clumps of ejecta. Complex motions are seen in the southwest, where some regions have varied in brightness by 10% – 20%. The presence of thermal emission in one region in the east suggests interaction with much denser material there. We propose that G330.2+1.0 is expanding into a stellar-wind cavity and has reached the cavity wall in the east some time ago. A more recent impact with the cavity wall might have also occurred in the southwest in view of the strong blast wave deceleration and the presence of significant brightness changes there. Our age of order 1000 yr or less may be significant for the cooling of the neutron star, which is evidently the youngest CCO after the CCO in Cas A.
References
- Bartalucci et al. (2014) Bartalucci, I., Mazzotta, P., Bourdin, H., & Vikhlinin, A. 2014, A&A, 566, A25, doi: 10.1051/0004-6361/201423443
- Bykov et al. (2008) Bykov, A. M., Uvarov, Y. A., & Ellison, D. C. 2008, ApJL, 689, L133, doi: 10.1086/595868
- Carlton et al. (2011) Carlton, A. K., Borkowski, K. J., Reynolds, S. P., et al. 2011, ApJL, 737, L22, doi: 10.1088/2041-8205/737/1/L22
- Caswell et al. (1983) Caswell, J. L., Haynes, R. F., Milne, D. K., & Wellington, K. J. 1983, MNRAS, 204, 915, doi: 10.1093/mnras/204.3.915
- Green (2011) Green, D. A. 2011, BASI, 39, 289
- Katsuda et al. (2015) Katsuda, S., Acero, F., Tominaga, N., et al. 2015, ApJ, 814, 29, doi: 10.1088/0004-637X/814/1/29
- Katsuda et al. (2010) Katsuda, S., Petre, R., Mori, K., et al. 2010, ApJ, 723, 383, doi: 10.1088/0004-637X/723/1/383
- Krishnamurthy et al. (2010) Krishnamurthy, K., Raginsky, M., & Willett, R. 2010, SIAM J. Imaging Sci., 3, 619, doi: 10.1137/090756259
- McClure-Griffiths et al. (2001) McClure-Griffiths, N. M., Green, A. J., Dickey, J. M., et al. 2001, ApJ, 551, 394, doi: 10.1086/320095
- Miceli et al. (2009) Miceli, M., Bocchino, F., Iakubovskyi, D., et al. 2009, A&A, 501, 239, doi: 10.1051/0004-6361/200811505
- Park et al. (2009) Park, S., Kargaltsev, O., Pavlov, G. G., et al. 2009, ApJ, 695, 431, doi: 10.1088/0004-637X/695/1/431
- Park et al. (2006) Park, S., Mori, K., Kargaltsev, O., et al. 2006, ApJL, 653, L37, doi: 10.1086/510366
- Patil et al. (2010) Patil, A., Huard, D. & Fonnesbeck, C. J. 2010, J. Stat. Software, 35, 4, doi: 10.18637/jss.v035.i04
- Reynolds (1998) Reynolds, S. P. 1998, ApJ, 493, 375, doi: 10.1086/305103
- Reynolds (2008) —. 2008, ARA&A, 46, 89, doi: 10.1146/annurev.astro.46.060407.145237
- Reynolds et al. (2009) Reynolds, S. P., Borkowski, K. J., Green, D. A., et al. 2009, ApJL, 695, L149, doi: 10.1088/0004-637X/695/2/L149
- Reynolds et al. (2018) Reynolds, S. P., Borkowski, K. J., & Gwynne, P. H. 2018, ApJ, 856, 133, doi: 10.3847/1538-4357/aab3d3
- Reynolds & Keohane (1999) Reynolds, S. P., & Keohane, J. W. 1999, ApJ, 525, 368, doi: 10.1086/307880
- Torii et al. (2006) Torii, K., Uchida, H., Hasuike, K., et al. 2006, PASJ, 58, L11, doi: 10.1093/pasj/58.1.L11
- Uchiyama et al. (2007) Uchiyama, Y., Aharonian, F. A., Tanaka, T., et al. 2007, Nature, 449, 576, doi: 10.1038/nature06210
- Williams et al. (2011) Williams, B. J., Blair, W. P., Blondin, J. M., et al. 2011, ApJ, 741, 96, doi: 10.1088/0004-637X/741/2/96
- Williams et al. (2018) Williams, B. J., Hewitt, J. W., Petre, R., & Temim, T. 2018, ApJ, 855, 118, doi: 10.3847/1538-4357/aaadb6