Spatially Offset Active Galactic Nuclei III: Discovery of Late-Stage Galaxy Mergers with The Hubble Space Telescope
Abstract
Galaxy pairs with separations of only a few kpc represent important stages in the merger-driven growth of supermassive black holes (SMBHs). However, such mergers are difficult to identify observationally due to the correspondingly small angular scales. In Paper I we presented a method of finding candidate kpc-scale galaxy mergers that is leveraged on the selection of X-ray sources spatially offset from the centers of host galaxies. In this paper we analyze new Hubble Space Telescope (HST) WFC3 imaging for six of these sources to search for signatures of galaxy mergers. The HST imaging reveals that four of the six systems are on-going galaxy mergers with separations of kpc (offset AGN). The nature of the remaining two spatially offset X-ray sources is ambiguous and may be associated with super-Eddington accretion in X-ray binaries. The ability of this sample to probe small galaxy separations and minor mergers makes it uniquely suited for testing the role of galaxy mergers for AGN triggering. We find that galaxy mergers with only one AGN are predominantly minor mergers with mass ratios similar to the overall population of galaxy mergers. By comparison, galaxy mergers with two AGN are biased toward major mergers and larger nuclear gas masses. Finally, we find that the level of SMBH accretion increases toward smaller mass ratios (major mergers). This result suggests the mass ratio effects not only the frequency of AGN triggering but also the rate of SMBH growth in mergers.
Subject headings:
galaxies: active - galaxies: nuclei - galaxies: interactions - galaxies: Seyfert - galaxies: evolution2Department of Astrophysical Sciences, Princeton University, Princeton, NJ 08544, USA
1. Introduction
The growth of supermassive black holes (SMBHs) in galaxy nuclei occurs primarily via the accretion of baryonic matter from the interstellar medium (ISM). During this process, a fraction of the energy generated in accretion disks is dissipated in the form of electromagnetic radiation and results in the observational phenomenon of active galactic nuclei (AGN). A long history of numerical simulations predicts that mergers between galaxies are an effective means of transporting mass into accretion disks and triggering AGN (Hernquist, 1989; Mihos & Hernquist, 1996; Di Matteo et al., 2005; Springel et al., 2005; Hopkins et al., 2008; Capelo et al., 2015).
Indeed, observations of AGN in on-going galaxy mergers support the hypothesis of merger-driven SMBH growth (Sanders et al., 1988a, b; Canalizo & Stockton, 2001). However, the relevance of mergers among the overall AGN population is unclear (Georgakakis et al., 2009; Kocevski et al., 2012; Simmons et al., 2012; Villforth et al., 2014; Mechtley et al., 2015; Villforth et al., 2016). Hence, uniform and reliable samples of galaxy mergers are necessary to test this hypothesis. Moreover, fully understanding how AGN evolve throughout mergers requires the ability to trace the SMBHs down to small pair separations and to identify which are actively accreting.
At large physical separations, most AGN selection methods can suffice. For example, when the galaxy pair separation is larger than the fiber collision limit (Blanton et al., 2001), optical emission line diagnostics (Baldwin et al., 1981; Kewley et al., 2006) from the Sloan Digital Sky Survey (SDSS) have provided AGN identifications for individual galaxies in many pair samples (Ellison et al., 2008, 2011; Scudder et al., 2012; Patton et al., 2013). More recently, infrared selections of AGN from the Wide-field Infrared Survey Explorer (Wright et al., 2010) based on magnitude dependent color cuts (Stern et al., 2012; Assef et al., 2013) can be used to associate luminous AGN with galaxies in pairs resolvable by the resolution limit. Unfortunately, these spatial limitations effectively reject most advanced mergers. However, theory predicts that the efficiency of AGN triggering in mergers peaks at separations of kpc (Van Wassenhove et al., 2012; Blecha et al., 2013; Capelo et al., 2015; Steinborn et al., 2016). While radio observations can probe these merger phases, only of AGN are radio loud and deep observations are required to detect others (Müller-Sánchez et al., 2015).
To overcome this observational hurdle, we previously developed a procedure for identifying candidate late-stage galaxy mergers hosting a single AGN (offset AGN) based on spatially offset X-ray sources (Barrows et al., 2016, hereafter Paper I). Utilizing the spatial resolution of the Chandra X-ray Observatory, we constrained the positions of X-ray sources within galaxies so that they can be detected as offset from galactic nuclei and potentially from other discrete X-ray sources within the same galaxy. Detection of a spatially offset AGN signifies a galaxy merger, and in Paper I we posited that spatially offset X-ray sources may represent kpc-scale galaxy mergers. Due to the small physical separations probed by offset AGN, they are ideally suited for studying the specific conditions under which galaxy mergers can drive SMBH growth. For example, we recently used this sample to track, for the first time, evolution of the AGN merger fraction below separations of kpc (Barrows et al., 2017a). This result echoes and extends that from samples of larger separation pairs (Ellison et al., 2008, 2011; Koss et al., 2012; Satyapal et al., 2014) and implies that the probability of observing AGN in mergers is higher under the conditions encountered at late merger stages when the nuclei are heavily enshrouded by gas and dust.
However, to form a comprehensive picture of SMBH growth in mergers, one must understand the physical mechanisms within the merging galaxies that actually drive accretion onto the SMBHs at small separations. Doing so requires testing if properties of the galaxies themselves are connected with SMBH growth, and if they affect the accretion rates or simply increase the probability of AGN triggering. In particular, some studies have hinted that the strongest enhancements in merger-driven AGN triggering occur among galaxy mergers where mass ratios between the more and less massive galaxy are close to unity (major mergers) and most efficiently drive ISM material to the galaxy nuclei (Ellison et al., 2008; Comerford et al., 2015; Barrows et al., 2017a). Moreover, numerical simulations predict that galaxy mergers with only a single AGN (offset AGN) preferentially have large mass ratios between the more and less massive galaxy (minor mergers) while galaxy mergers with two AGN (dual AGN) are preferentially associated with major mergers (Steinborn et al., 2016).
Simulations also predict that increases in the galaxies’ overall supply of gas correspond to a higher probability of AGN triggering (Capelo et al., 2015) and potentially a distinction between offset AGN and dual AGN (Steinborn et al., 2016; Rosas-Guevara et al., 2018). The supply of nuclear material for accretion may also depend on the location of each SMBH within the merging system itself. However, theory has yet to converge on a clear picture, with theoretical work suggesting that the more luminous AGN will most frequently be associated with the more massive galaxy (Yu et al., 2011) or the less massive galaxy (Capelo et al., 2015), and that it may depend on the total gas mass (Steinborn et al., 2016). Overall, these predictions suggest that the galaxy masses and merger morphologies may play an important role in the triggering of AGN in mergers.
To confirm the merger scenario for host galaxies of spatially offset X-ray sources and to test the above predictions for how merger-driven AGN triggering is linked to host galaxy properties in small separation pairs, sub-arcsecond resolution imaging at multiple wavelengths is necessary. Therefore, we obtained Hubble Space Telescope (HST) imaging for six galaxies identified using the method from Paper I. This paper is structured as follows: in Section 2 we describe the HST targets and observations; in Section 3 we put constraints on the merger scenarios for each galaxy; in Section 4 we discuss spatially offset X-ray sources as a selector of galaxy mergers hosting AGN; in Section 5 we discuss offset AGN in the context of galaxy-SMBH co-evolution; and in Section 6 we present our conclusions. Throughout we assume a cosmology defined by km s-1 Mpc-1, , and .
| Target Name | Redshift | |||
|---|---|---|---|---|
| (s) | (s) | (s) | ||
| (1) | (2) | (3) | (4) | (5) |
| SDSS J081330.15541844.4 | 0.041 | 147 | 918 | 1092 |
| SDSS J094032.25311328.5 | 0.170 | 147 | 618 | 1329 |
| SDSS J102141.89130550.4 | 0.077 | 147 | 618 | 1302 |
| SDSS J111458.01403611.4 | 0.076 | 147 | 618 | 1329 |
| SDSS J123420.12475155.7 | 0.183 | 147 | 918 | 1041 |
| SDSS J212512.48071329.9 | 0.064 | 147 | 918 | 999 |
Note. — Column 1: Target galaxy name; Column 2: SDSS spectroscopic redshift; Column 3: -band image exposure time; Column 4: -band image exposure time; and Column 5: -band image exposure time.
2. The HST Target Sample
The main sample analyzed in this paper consists of six galaxies identified using the method from Paper I that were observed by HST (Program: GO 14068, PI: Barrows). Full details of the sample selection are provided in Paper I, but here we provide the basic properties: each galaxy was originally observed by the SDSS Data Release 7 spectroscopic fiber survey and has optical emission line flux ratios of [O III]/H and [N II]/H that place them in the AGN region of a typical Baldwin-Phillips-Terlevich (BPT) diagram (Baldwin et al., 1981) as defined in Kewley et al. (2006). This diagnostic suggests that an AGN is present within the fiber radius centered on the galaxy. Furthermore, an X-ray source with a rest-frame, unabsorbed keV luminosity () or hardness ratio consistent with the presence of an AGN is also detected and has a error ellipse that spatially overlaps with the SDSS fiber. We then selected galaxies where the X-ray source is spatially offset from the galaxy centroid based on SDSS imaging. Since AGN are expected to reside in the nuclei of galaxies, the spatial offsets mark these sources as galaxy merger candidates. Due to the selection requirement that the X-ray sources overlap with the fiber radius, the resolution of the SDSS imaging (FWHM ) is not sufficient to detect secondary stellar cores associated with the offset X-ray sources.
Each target was imaged with three HST/WFC3 wide band filters: (F160W; µm), (F814W; Å), and (F438W; Å). The -band filter was chosen to provide a continuum map of the older stars typically found in galaxy bulges hosting SMBHs. The - and -band filters were chosen to provide continuum maps of younger stars and to trace optical emission lines and scattered light from star formation or AGN. The target names, SDSS spectroscopic redshifts, and observation details (filter and exposure time) are listed in Table 1. The targets were chosen because they had not previously been observed by HST.
3. Galaxy Mergers Revealed by HST
While our selection of spatially offset X-ray sources can reach down to physical separations of kpc, these sizes correspond to angular scales of in some cases. Hence, HST imaging is vital for understanding if the offset X-ray sources are related to galaxy mergers. Figure 1 shows the color composite images of the six HST targets. While the SDSS images used in the original selection provide no explicit evidence of mergers, the HST imaging reveals signatures of on-going galaxy mergers in the form of secondary stellar cores that are spatially offset from the primary (i.e. more massive) galaxy in four of the targets (J09403113, J11144036, J12344751, and J21250713). We emphasize that each secondary stellar core was previously undetected in the SDSS imaging. The other two galaxies (J08135418 and J10211305) do not show evidence of secondary stellar cores or merger related morphological disturbances. Thus, the HST imaging reveals that systems are on-going galaxy mergers. In two of those systems (J11144036 and J12344751) an offset X-ray source is spatially coincident with the secondary stellar core and hence the merger selection is a direct result of the spatially offset X-ray source detection. In the other two systems (J09403113 and J21250713) the X-ray source is most likely associated with the primary stellar core detected in the HST imaging. The implications of these results are discussed in Section 4.
3.1. Detecting Stellar Cores
We use the -band images to detect stellar cores associated with the primary galaxy and potential companion galaxies in each of the six targets. The -band images are dominated by light from near-infrared (NIR) stellar continuum emission that corresponds to relatively old stars in galaxy bulges (Mannucci et al., 2001). Therefore, we fit each system with a combination of multiple two-dimensional Sersic functions (Sersic, 1968) that have been empirically demonstrated to be reliable descriptions of galaxy stellar bulges (Graham & Driver, 2005). Moreover, in Comerford et al. (2015) we showed that the Sersic centroid fit to the individual stellar cores of a galaxy merger is a robust tracer of the peak -band brightness, regardless of the residuals at large radii from the centroid.
The full procedure is described in Barrows et al. (2017b) though here we provide a basic description. First, we run Source Extractor (Bertin & Arnouts, 1996) on the -band images to generate a base list of all the significantly detected () sources. From this list, we use Galfit (version 3.0.5; Peng et al., 2010) to fit Sersic components to all of the detected sources within a 2525 kpc field-of-view (FOV) centered on the SDSS J2000 right ascension (RA) and declination (DEC) of the galaxy, plus a uniform sky component. The FOV is chosen to allow all nearby contaminating sources to be included in the -band fitting box and modeled for all six galaxies. Since the SDSS fiber spectra classify each system as a Type 2 AGN, the NIR AGN contribution is expected to be weak. Indeed, we find that PSF components are not statistically warranted in any cases. However, in some cases Sersic components did not converge on the Source Extractor detections. In these instances we manually fit the sources with two-dimensional Gaussian functions.
3.2. Four Galaxy Mergers
Figure 2 shows the -band images zoomed in on the SDSS fiber position. The brightest model component is considered to be the primary stellar core, and in all cases it is the component nearest the centroid of the target galaxy from SDSS imaging. To reveal fainter stellar core detections, Figure 2 also shows the residuals after subtracting the model component associated with the primary galaxy from each image. In four of the six systems (J09403113, J11144036, J12344751, and J21250713) the modeling procedure detects a secondary stellar core that is kpc from the primary galaxy and physically interacting with it based on proximity and/or visually apparent connecting stellar features.
The locations of the primary and secondary stellar cores are marked in Figure 2. The physical separations of the stellar cores () have a range of kpc and are listed in Table 2. In the following sections we use the HST imaging to estimate stellar masses (Section 3.2.1), determine whether the X-ray sources are in the more or less massive galaxy (Section 3.2.2), and examine the colors for evidence of nuclear obscuration or additional AGN that are undetected in X-rays (Section 3.2.3).
3.2.1 One Major Merger and Three Minor Mergers
Since the -band fluxes of the primary and secondary stellar cores trace continuum emission from bulge stars, they are assumed to be proportional to the stellar masses ( and , respectively). Therefore, we use the -band flux ratios between the primary and secondary stellar cores as proxies for the mass ratios (). The mass ratios have a range of and are listed in Table 2. When adopting a mass ratio of as the division between major mergers ( ) and minor mergers ( ), J12344751 is classified as a major merger while J09403113, J11144036, and J21250713 are classified as minor mergers.
The values of and are estimated from the mass ratios and the total galaxy stellar masses (). is measured from the mass-to-light ratio function of Bell et al. (2003) based on the SDSS - colors, the flux from the SDSS filter (SDSS filter that most closely traces the continua of older stars that reside in galaxy bulges), and the filter correction. The values of and are listed in Table 2. The secondary stellar cores have masses that range from . Assuming that the secondary stellar cores are the remnant bulges of galaxies, the estimated black hole (BH) masses () range from using the empirical relation between BH mass and bulge mass from Marconi & Hunt (2003). These BH mass estimates are within the range of values typically measured for the SMBHs of galaxy nuclei ( ).
Since the galaxy mass estimates are based on the image modeling components, they do not account for deviations from Sersic or Gaussian profiles at large radii or for mass exchange during the merger. In particular, the host galaxies of the secondary stellar cores may have experienced significant tidal stripping. Therefore, the original masses of the secondary galaxies were likely higher.
3.2.2 Locations of the X-ray Sources
We register the -band images with the Chandra images of the X-ray sources (Figure 2) to determine where the AGN are located within the merging systems. The registration procedure is based on Paper I and further described with respect to HST imaging in Comerford et al. (2017a, b). The X-ray source positions are measured using the image modeling procedure described in Paper I and are marked in Figure 2. The X-ray sources are detected at significance in four of the galaxies (J08135418, J11144036, J12344751, and J21250713) and significance in the remaining two (J09403113 and J10211305). We consider X-ray sources to be associated with stellar cores if they are spatially coincident within when accounting for the centroid errors and relative astrometric uncertainties. Three of the galaxy mergers have only one X-ray source (offset AGN), and in two of those systems (J09403113 and J21250713) the X-ray source is associated with the primary galaxy, while in the other system (J12344751) the X-ray source is associated with the secondary stellar core.
The Chandra image of the fourth system (J11144036) is best fit by a model that consists of two X-ray sources. Both sources are consistent with accretion onto massive BHs based on their rest-frame hard X-ray luminosities ( erg s-1). While the centroid errors of each source are relatively large, one of the X-ray sources is statistically consistent with the primary galaxy nucleus while the other is consistent with the secondary stellar core based on the uncertainties. When considering that two erg s-1 X-ray sources are likely present, and that they are each spatially coincident with a stellar core, we consider this system to be a dual AGN candidate. The X-ray source positions, source counts (computed using the Bayesian Estimation of Hardness Ratios procedure; Park et al., 2006), model detection significances, and values are listed in Table 3 for all six HST targets. The X-ray source spatial offsets from each stellar core (including the offset position angles) are listed in Table 4 for all six HST targets.
| Name | ||||||||||
|---|---|---|---|---|---|---|---|---|---|---|
| (kpc) | (log[/]) | (log[/]) | ||||||||
| (1) | (2) | (3) | (4) | (5) | (6) | (7) | (8) | (9) | (10) | (11) |
| J08135418 | ||||||||||
| J09403113 | ||||||||||
| J10211305 | ||||||||||
| J11144036 | ||||||||||
| J12344751 | ||||||||||
| J21250713 |
Note. — Column 1: Galaxy name; Column 2: projected nuclear physical separation between the primary galaxy and secondary stellar core; Column 3: mass ratio of the primary galaxy to the secondary stellar core; Column 4: mass of the primary galaxy; Column 5: mass of the secondary stellar core; Columns 6-7: primary and secondary colors; Columns 8-9: primary and secondary colors; and Columns 10-11: primary and secondary colors.
3.2.3 Nuclear Obscuration
Gas and dust in the nuclei of galaxies can simultaneously fuel AGN while suppressing their optical and X-ray signatures through attenuation. Therefore, we use the three HST filters to examine the photometry of each stellar core in search of excessive red colors that may indicate nuclear dust or excessive blue colors that may originate from AGN emission.
As shown in Barrows et al. (2017b), - and -band contributions from AGN continuum emission scattered off of gas or AGN-photoionized emission line gas is not negligible. The dynamics of on-going or past mergers likely subjects the gas to asymmetric kinematic motion. Therefore, we do not model the - and -band images with Galfit since the model components are empirically derived to model stars in virialized motion or well-ordered rotation. Instead, to measure the - and -band magnitudes of each stellar core we extract fluxes from apertures centered on the RA and DEC of the primary and secondary stellar cores as determined in Section 3.1 after first registering them with the -band images. The aperture radii are designed to be three times the -band image FWHM (). Aperture fluxes are then summed after subtracting an average local background measured from directly adjacent annuli of width equal to one times the -band image FWHM. Aperture detections of - and -band counterparts to the stellar cores are present at significances of in all four mergers. We also extract fluxes from apertures with offsets chosen randomly from a uniform distribution of radii within two times the stellar core spatial offsets but excluding the primary and secondary aperture positions. In all four mergers each random aperture detection is in significance, further suggesting that the - and -band detections are associated with the stellar cores rather than unrelated features associated with hot gas or star formation.
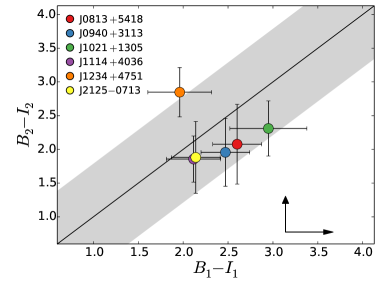
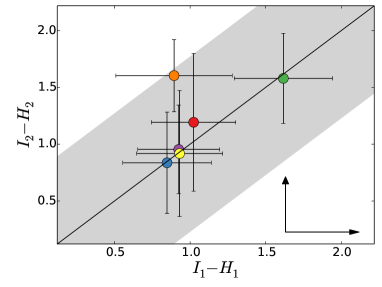
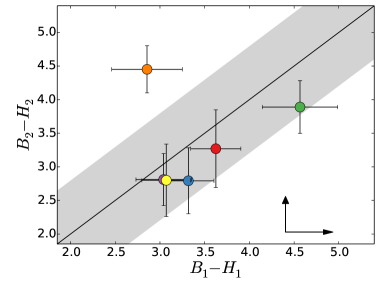
Figure 3 shows the - and -band images zoomed in on the SDSS fiber position and with the apertures used for source extraction marked. For consistency, the -band fluxes are measured from apertures based on the same procedure (marked in Figure 2). The , , and colors for the primary galaxy and secondary stellar cores are listed in Table 2 and plotted against each other in Figure 4.
Among the four mergers, only one stellar core (the secondary stellar core of J12344751) is significantly reddened compared to the other galaxy stellar cores in the sample. The reddening is most pronounced in the color (offset by from the sample mean) which is most sensitive to dust. These colors suggest the presence of nuclear dust that is qualitatively consistent with the potential dust lanes observed in the color composite image (Figure 1). As shown by the extinction arrows (Figure 4), the AGN in the secondary stellar core of J12344751 may be obscured by a column of cm-2 compared to nuclei in the rest of the sample. While the red colors may in principle be due to relatively older stellar populations, we see no evidence for this scenario since the star formation rates and times since the most recent burst of star formation (obtained from the SDSS spectra; Thomas et al., 2013) are within one standard deviation of the sample mean. The presence of enhanced nuclear dust compared to the rest of the sample is also reinforced by the fact that it has the largest extragalactic column density of hydrogen (nH cm-2), measured from X-ray spectral modeling, among the sample.
The other three mergers (J09403113, J11144036, and J21250713) have similar colors in the primary and secondary stellar cores (agreement within ). While we do not know the relative contributions of dust, stellar continua, and photo-ionized gas from stars or AGN in these systems, the colors do not present any evidence for one of the nuclei being more obscured than the other. Therefore, no evidence is found for heavily reddened nuclei without X-ray detections in the four mergers.
The primary stellar core in J12344751 is the bluest of the primary stellar cores in the sample. The blue colors may suggest that it hosts enhanced star formation. The blue colors may also indicate that it hosts an AGN, as further suggested by the presence of two emission line systems in the SDSS fiber spectrum that are both consistent with AGN photo-ionization (Ge et al., 2012). While the origin of the double-peaked signature is unknown since the spatial information is destroyed by the fiber, each emission line system may be associated with one of the stellar cores. The absence of an X-ray detection associated with the hypothetical AGN in the primary stellar core would be explained by a radiatively inefficient accretion flow and a correspondingly low Eddington ratio (Ho, 2009; Abramowicz et al., 2002). However, in this inefficient accretion state the AGN would likely not produce an optical emission line system, leaving the double-peaked spectral feature unexplained. Therefore, the AGN in the secondary stellar core may be photoionizing the NLR in the primary galaxy, thereby producing the blue colors. As another alternative, the AGN in the secondary stellar core may be just outside of the SDSS fiber so that its optical signature is not present in the spectrum. In this case, an X-ray faint AGN could be present in the primary stellar core and producing an outflow responsible for the double-peaked emission line signature and the spatially extended - and -band emission (Figure 3). We consider the dual AGN hypothesis for J12344751 when discussing these galaxy mergers in the context of galaxy-SMBH co-evolution (Section 5).
| Name | RAX-ray | DECX-ray | Det. Sig. | ||||
|---|---|---|---|---|---|---|---|
| (-) | (hh:mm:ss.sss) | (dd:mm:ss.ss) | (counts) | (counts) | (counts) | () | (log[erg s-1]) |
| (1) | (2) | (3) | (4) | (5) | (6) | (7) | (8) |
| J08135418 | 08:13:30.415 | 54:18:44.71 | |||||
| J09403113 | 09:40:32.176 | 31:13:29.51 | |||||
| J10211305 | 10:21:41.940 | 13:05:50.19 | |||||
| J11144036 | 11:14:58.084 | 40:36:12.26 | |||||
| 11:14:57.952 | 40:36:11.25 | ||||||
| J12344751 | 12:34:20.247 | 47:51:55.84 | |||||
| J21250713 | 21:25:12.470 | 07:13:29.88 |
Note. — Column 1: Galaxy name; Columns 2-3: RA and DEC of the X-ray source (in the -band reference frame); Columns 4-6: soft ( keV), hard ( keV), and total ( keV) source counts; Column 7: source detection significance; and Column 8: unabsorbed, rest-frame hard X-ray luminosity.
| Name | PA1 | PA2 | ||||
|---|---|---|---|---|---|---|
| (-) | (′′) | (kpc) | (∘) | (′′) | (kpc) | (∘) |
| (1) | (2) | (3) | (4) | (5) | (6) | (7) |
| J08135418 | 87 | 353 | ||||
| J09403113 | 310 | 299 | ||||
| J10211305 | 97 | 138 | ||||
| J11144036 | 53 | 41 | ||||
| 238 | 319 | |||||
| J12344751 | 93 | 332 | ||||
| J21250713 | 122 | 286 |
Note. — Column 1: Galaxy name; Columns 2-4: angular separation, physical separation, and position angle (East of North) between the primary stellar core and X-ray source; and Columns 5-7: same as Columns 2-4 but between the secondary stellar core and the X-ray source.
3.3. Two Ambiguous Systems
In the remaining two systems (J08135418 and J10211305), no secondary stellar cores are detected that are interacting with the primary galaxy based on proximity or visual evidence of merger-related morphological disturbances in either the images or the model residuals. Moreover, the offset X-ray sources are not associated with any stellar core detections (Figure 2). To put upper limits on the presence of -band counterparts to the X-ray sources, we add a two-dimensional Gaussian function to the models with a peak that is constrained to be within the X-ray source centroid confidence interval. This puts upper limits of and on the masses of secondary stellar cores associated with the X-ray sources in J08135418 and J10211305, respectively. Applying these upper limits to the relation from Marconi & Hunt (2003) yields BH mass upper limits of and for J08135418 and J10211305, respectively. We consider the following explanations for the lack of stellar core detections associated with the X-ray sources:
Association with the Primary Galaxy Nucleus. The lack of any merger signatures in these systems suggests that the optically detected AGN are located in the primary galaxy nuclei in both cases. Therefore, since no firm stellar counterparts to the X-ray sources are detected, we first acknowledge the possibility that they are associated with the optical AGN in the primary galaxy nuclei. In this case, the errors on the X-ray source positions, relative to the -band primary galaxy nuclei, are larger than estimated. If the angular offsets of (J08135418) and (J10211305) are due to uncertainty, then they would be relatively large compared to the typical Chandra absolute astrometry within of the observation aimpoint (selection criteria for our sources; see Paper I) and therefore imply underestimated uncertainties in the X-ray source model centroids. In the specific case of J10211305, the relatively lower detection significance of the X-ray source may also suggest a spurious detection, in which case no offset X-ray source would be present.
Background AGN. The spatially offset X-ray sources may be associated with background AGN. This scenario would naturally explain the lack of detected stellar counterparts to the X-ray sources. We use the SDSS MPA-JHU galaxy catalogue (Kauffmann et al., 2003; Brinchmann et al., 2004) and the Chandra Source Catalogue (Evans et al., 2010) to estimate surface densities and simulate the occurrence of chance projections of unrelated sources. We find that, in the redshift and flux ranges of the six targets, the probability of a chance alignment between an SDSS galaxy and a Chandra source within is , corresponding to a high probability that the sources are physically related.
IMBHs or Tidal Stripping. The BH mass upper limits of J08135418 and J10211305 are plausibly consistent with IMBHs of mass . These X-ray sources may be in the remnant stellar cores of tidally stripped low mass galaxies as suggested for HLX1 (Farrell et al., 2009) and other IMBH candidates (King & Dehnen, 2005; Wolter et al., 2006; Feng & Kaaret, 2009; Jonker et al., 2010; Mezcua et al., 2015). However, no morphological features suggestive of past mergers are apparent in either galaxy.
Super-Eddington Accretion and X-ray Binaries. The luminosities of the offset X-ray sources in J08135418 and J10211305 are slightly above the threshold for ultra-luminous X-ray sources (ULXs; erg s-1) and consistent with the class of hyper-luminous X-ray sources (HLXs; erg s-1). A possible explanation for ULXs and HLXs is super-Eddington accretion in X-ray binaries (XRBs) (Colbert & Mushotzky, 1999; Begelman, 2002), in which case they are predicted to occur more often in star-forming regions (Madau et al., 1998; Ghosh & White, 2001; Swartz et al., 2009). Indeed, the X-ray source positions for both J08135418 and J10211305 are coincident with detections in the - and -band images based on the same aperture extraction used in Section 3.2.3. These detections may be associated with stars or photo-ionized gas in star-forming regions. Moreover, their relatively red colors (Figure 4) may be associated with dust that is responsible for obscuring the X-ray signature of the central AGN. Therefore, if the X-ray sources are not associated with the optical AGN in the primary galaxy nucleus, we consider the XRB interpretation to be the most likely explanation.
4. Spatially Offset X-Ray Sources as a Selector of AGN in Galaxy Mergers
Selection of galaxy mergers hosting AGN is vital for thorough studies of galaxy-SMBH co-evolution. While large scale galaxy pairs in early merger stages are easily identifiable, angular resolution limits make more advanced mergers particularly difficult to find. However, late-stage galaxy mergers can, in principle, be identified based on signatures of spatially offset X-ray sources. Moreover, since the selection is not based on visual inspection or asymmetries, it is not biased toward major mergers with large morphological disturbances.
The HST imaging presented in Section 3 indicates that of the spatially offset X-ray sources are direct signatures of mergers since they are associated with secondary galaxies that are interacting with the primary galaxy. Furthermore, one of them is a minor merger with no discernible morphological disturbances in the SDSS imaging and therefore would likely be missed by selections based on visual or asymmetry signatures. Another of the spatially offset X-ray sources are in mergers but the most likely NIR counterparts are the primary stellar cores. Therefore, the spatially offset X-ray selection may be related to discrepancies in the astrometric solutions between the Chandra-SDSS registrations and the Chandra-HST registrations. However, we also note that few sources are available for matching within the HST/F160W FOV and hence the astrometric uncertainties are larger in both cases compared to the original selection.
Previous methods of selecting late-stage galaxy merger candidates based on spectroscopic evidence in the form of double-peaked emission lines yielded a merger selection rate of (Shen et al., 2011; Fu et al., 2012; Müller-Sánchez et al., 2015; Nevin et al., 2016). More recent selection based on velocity offset emission lines (Comerford & Greene, 2014) may yield an even lower merger selection rate (Comerford et al., 2017a). While the sample size of six galaxies here is small, the direct merger selection of may indicate that spatially offset AGN are a more efficient merger selector and could be attributed to the focus on hard X-ray signatures that are produced near the SMBH accretion disk, thereby removing the effects of spatially extended features related to inflows or outflows. Furthermore, the merger selection efficiency of spatially offset AGN may be even higher when restricted to the most luminous X-ray AGN. In particular, when excluding the two sources with the lowest hard X-ray luminosities (J08135418 and J10211305), the fraction of directly selected mergers increases to ().
Selection of spatially offset X-ray sources can be readily applied to vast samples of archival data to yield large numbers of AGN in candidate galaxy mergers. Offset X-ray sources can also reveal candidate recoiling SMBHs that are the eventual products of some galaxy mergers (Kim et al., 2017). In addition to the use of Chandra data, recent studies have utilized archival radio imaging to find several offset AGN (Condon et al., 2017) or candidate offset AGN (Makarov et al., 2017; Skipper & Browne, 2018).
Finally, as demonstrated by our sample, this technique allows for the selection of spatially offset X-ray sources out to intermediate redshifts. This can aid in the search for ULX and HLX candidates (which in previous studies has been mainly focused on nearby galaxies) by significantly increasing ULX/HLX sample sizes and permitting tests of how their environments evolve. Moreover, this technique will be even more effective when used in conjunction with the increased sensitivity of future next generation X-ray observatories such as Lynx.
5. Offset AGN in the Context of Galaxy-SMBH Co-Evolution
The mergers that we identify have physical separations of kpc, with the smallest separation being just over kpc. Moreover, three-fourths of the systems are minor mergers that are difficult to find by most merger selection techniques. Therefore, we use the merger sample for comparisons between AGN in minor and major mergers and to provide unique insight about merger-driven triggering of AGN at small separations where theory predicts it will peak.
We augment the sample with the full subset of three offset AGN from Paper I without HST imaging for which we are able to resolve the individual stellar cores associated with the merger using SDSS imaging. In these cases, the X-ray AGN is consistent with being at the galaxy central stellar core and offset from a secondary stellar core that is present outside of the fiber but within kpc in projected separation and at a similar redshift (see Paper I for details). For the three offset AGN with only SDSS imaging, the mass ratios are calculated using the same procedure used for the offset AGN with HST imaging.
5.1. Formation of Offset AGN Versus Dual AGN
The mechanisms that drive fuel to the nuclear regions of galaxies during mergers can also determine whether or not one AGN (offset AGN) or two AGN (dual AGN) are triggered. In particular, a basic prediction is that the more efficiently gas and dust is transported to the nuclear regions the more likely a dual AGN will form rather than an offset AGN. An increasing body of theoretical work now shows that the parameters most strongly in control of offset AGN and dual AGN triggering are the merger mass ratio, nuclear separation, and overall gas mass or gas fraction (Van Wassenhove et al., 2012; Blecha et al., 2013; Capelo et al., 2015; Steinborn et al., 2016; Rosas-Guevara et al., 2018; Steinborn et al., 2018). Understanding the scenarios leading to the formation of offset AGN versus dual AGN will put constraints on the physical mechanisms that build up SMBH mass in galaxy mergers and will inform cosmological models of hierarchical galaxy-SMBH co-evolution. Therefore, we test these predictions by comparing properties of the offset AGN to those of a comparison dual AGN sample.
The dual AGN sample consists of nine galaxy mergers hosting AGN. Of these nine dual AGN, six are from Comerford et al. (2015), while the remaining three are the mergers from Liu et al. (2013) for which mass ratios have been measured (Shangguan et al., 2016). Similar to the offset AGN, these systems were originally selected from the SDSS to have optical emission lines consistent with AGN photo-ionization (Kewley et al., 2006). Moreover, each has also been imaged by HST in a WFC3 NIR filter and observed by Chandra. However, an important distinction is that the emission lines of the dual AGN were selected to have double-peaked profiles that suggest the possible orbital motion of two AGN within a galaxy merger. Follow-up optical longslit spectroscopy at orthogonal position angles reveals that each emission line system is a spatially distinct AGN-photoionized narrow line region (NLR). Both NLRs of each galaxy merger are spatially coincident with an HST NIR stellar core hosting a SMBH, suggesting the presence of a dual AGN. From here on we also include J11144036 in the dual AGN sample since our analysis finds it to be a candidate dual AGN (Section 3.2.2). This leaves final samples of six offset AGN and ten dual AGN used in the following analyses.
5.1.1 The Role of Merger Morphology
Simulations of SMBHs in evolving galaxy mergers generally predict that dual activation is more frequent in major mergers (Van Wassenhove et al., 2012; Blecha et al., 2013; Capelo et al., 2015). Indeed, the observational results from Comerford et al. (2018) have recently shown that dual AGN are predominately in major mergers. Additionally, recent simulations have specifically predicted that offset AGN are more often found in minor mergers (Steinborn et al., 2016). We test these predictions of offset AGN morphology by comparing the mass ratio distribution of the offset AGN versus that of the dual AGN in the left panel of Figure 5.
The offset AGN have a mean value of , while the dual AGN have a mean value of . The difference between these mean values is at the level, and a Kolmogorov-Smirnov (KS) test yields a statistic of and null hypothesis probability of that the two samples are drawn from different distributions. When applying the major versus minor merger threshold of , we find that of the offset AGN are in minor mergers while only of the dual AGN are in minor mergers. This difference between the minor merger fractions of the offset AGN and dual AGN is strengthened if J12344751 is also considered to be a dual AGN (see Section 3.2.3), with major mergers and minor mergers in the offset AGN sample compared to major mergers and minor mergers in the dual AGN sample. Thus, the offset AGN are preferentially found in minor mergers whereas the dual AGN show weaker evidence for a preference (though with the majority of mass ratios corresponding to major mergers).
To understand the offset AGN and dual AGN mass ratios in the overall context of galaxy mergers, we compare our results to estimates of minor and major merger fractions for galaxies selected independently of AGN signatures. Using the Lotz et al. (2011) redshift-dependent merger fraction function and averaging over the redshift range of our sample, we find minor and major merger fractions in the general galaxy population of and , respectively. This comparison shows that the offset AGN minor and major merger fractions are consistent with those of galaxies without AGN. By implication, selection of galaxy mergers with a single AGN does not preferentially target major mergers when compared to the general population of galaxy mergers at the same redshifts. Since minor mergers are far more common than major mergers, offset AGN may therefore represent an important component of SMBH growth that occurs in mergers. On the other hand, the dual AGN minor (major) merger fractions are (lower) higher than those of non-AGN galaxies. This implies that selection of systems with dual AGN does preferentially target major mergers when compared to the general population of galaxy mergers at the same redshifts.
We also compare the asymmetries between the offset AGN and dual AGN in the right panel of Figure 5. Asymmetries are measured as described in Barrows et al. (2017b) and based on the procedure outlined in Conselice et al. (2000). The measurements are made by first creating a galaxy image that is rotated about the center (chosen to be the primary stellar core location). Then the rotated image is subtracted from the original image and the difference is normalized by the original image sum to yield the source asymmetry parameter. The sky asymmetry is then measured and subtracted from the source asymmetry to produce the final asymmetry value, . The images used for the asymmetry measurements are the same as those used for the mass ratio measurements. We find no evidence that the two samples are drawn from different distributions (KS statistic of and null hypothesis probability of ). This result may suggest that the overall morphological disturbance at large radii has little effect on whether or not one or two AGN are triggered in a merger. Rather, the more important effect is the gravitational force exerted by the compact stellar cores on the surrounding gas and dust.
5.1.2 The Combined Effects of Mass Ratio, Physical Separation, and Gas Mass
The results from Section 5.1.1 show that mass ratio may play a significant role in the triggering of one versus two AGN in a merger. However, numerical simulations also find a strong dependence on merger stage. In particular, they predict that the frequency of offset AGN exceeds that of dual AGN at large pair separations, but that dual AGN become more common at increasingly smaller pair separations (Van Wassenhove et al., 2012; Blecha et al., 2013; Capelo et al., 2015; Steinborn et al., 2016). This suggests an evolutionary transition from offset AGN to dual AGN as a merger progresses toward later stages. However, the relative importance of mass ratio and merger stage on the formation of offset AGN versus dual AGN has not yet been tested observationally.
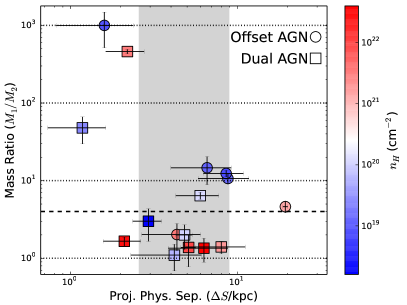
Therefore, in Figure 6 we use our sample to show the bivariate distributions of mass ratios and nuclear separations and to examine their combined effects on offset AGN versus dual AGN triggering. Interestingly, Figure 6 shows that the dual AGN with the largest mass ratios ( ) are also among the pairs with the smallest physical separations of the merger sample (offset by relative to the mean). While this result is small in significance, it may suggest that triggering dual AGN in mergers with large mass ratios (and hence in less morphologically disturbed systems) requires advanced merger stages when a sufficient amount of fuel has migrated to the nuclei.
To further test the dependence on the fuel supply, we have color coded each point by the value of its extragalactic column density (nH) measured from X-ray spectral fits (Paper I). Values of nH are a measure of hydrogen in the host galaxy along the line of sight to the X-ray source and can be used to assess the level of gas near the AGN. Among the largest mass ratios of the sample, the dual AGN with the largest mass ratio ( ) has the largest extragalactic column density, particularly when compared to offset AGN with similar mass ratios. A possible interpretation is that, for large mass ratios and small separations, triggering a dual AGN versus an offset AGN may require high gas masses. This result is qualitatively consistent with numerical results from Steinborn et al. (2016) who find that, compared to offset AGN, dual AGN are generally in more gas rich systems that will lead to triggered accretion onto both SMBHs. This expectation is corroborated by the more than order-of-magnitude difference in the mean nH for the dual AGN ( cm-2) compared to the offset AGN ( cm-2).
While the statistical significance of these combined results is small, they are consistent with the theoretical picture in which offset AGN and dual AGN formation is tied to mass ratio, physical separation, and nuclear gas mass. Moreover, these hints point to the potential power of large offset and dual AGN samples for understanding the detailed physical mechanisms of SMBH growth in mergers.
5.2. Merger-Driven SMBH Growth
A long history of numerical simulations predicts that major galaxy mergers can be efficient mechanisms for driving gas and dust to the nuclear regions of galaxies and hence for fueling AGN (Barnes & Hernquist, 1991; Hopkins & Hernquist, 2009). Indeed, the results from Section 5.1.2 demonstrate that the merger parameters of mass ratio and nuclear separation may play roles in driving fuel to both SMBHs versus only one. However, whether mergers can significantly elevate the accretion rates onto SMBHs or if the triggered accretion rates are instead similar to those of AGN in non-mergers is unclear. For example, the recent analytical results from Weigel et al. (2018) suggest that the observed AGN major merger fraction can be satisfactorily produced by a distribution of Eddington ratios with the same shape as the general AGN population. Their result implies that, while major mergers build more gas-rich systems, the rate at which gas falls to the nuclear regions is similar to non-mergers.
On the other hand, the generally larger column densities of the dual AGN, compared to the offset AGN, seen in Section 5.1.2 suggest that major mergers may actually supply the SMBHs with enhanced fuel supplies relative to minor mergers. However, few studies have investigated the role of minor mergers for AGN triggering and the effect of mass ratio on SMBH growth has not yet been investigated down to the minor merger regime and kpc separations. Therefore, we use our sample of offset and dual AGN to examine how AGN bolometric luminosity evolves over three orders of magnitude in mass ratio during late-stage mergers.
We calculate bolometric luminosities () from the extinction-corrected, integrated [O III] luminosities measured in the SDSS fiber spectra and the bolometric correction from Trump et al. (2015) based on the sample of Lamastra et al. (2009). We note that, while hard X-ray luminosities are in principle a more direct tracer of AGN radiative output, the samples from Comerford et al. (2015) and Liu et al. (2013) both suggest that nuclear obscuration may introduce significant uncertainties in the X-ray spectral modeling.
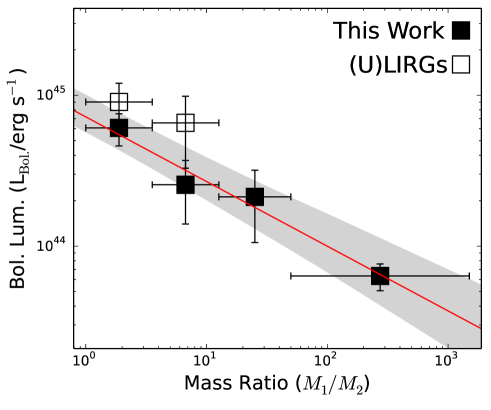
Figure 7 shows as a function of . The data points have been binned by mass ratio and each bin includes sources. The confidence intervals around the best-fitting power-law functions are determined by adding simulated random uncertainties (assuming the errors follow a normal distribution) and refitting until the upper and lower uncertainties converge. The best-fit power-law function relating and has a negative slope that is offset from zero at a significance of . This result indicates that more quickly growing SMBHs are in galaxy mergers with mass ratios close to unity and that the effect of mass ratio persists down to small pair separations. Furthermore, a correlation between mass ratio and bolometric luminosity suggests that information about the merger dynamics is preserved in the gas that is ultimately accreted onto the SMBHs. Indeed, the bolometric luminosities of our sample are quantitatively consistent with the simulations from Steinborn et al. (2016) who predict that the merger mass ratio does have a strong effect on accretion rates of merger-driven SMBH growth.
We acknowledge that these results only apply to AGN that are optically selected and detected at X-ray energies of keV, thereby introducing a bias toward relatively unobscured systems. Therefore, for comparison we also show in Figure 7 a sample of (Ultra-)Luminous Infrared Galaxies, or (U)LIRGs, hosting AGN with column densities often approaching Compton-thick levels (Komossa et al., 2003; Bianchi et al., 2008; Piconcelli et al., 2010). These (U)LIRGs each host an AGN detected by the Swift Burst Alert Telescope (BAT) survey, and they are a subset of the mergers from Koss et al. (2012) with pair separations of kpc as in our sample. The bolometric luminosities are determined from the BAT ultra-hard ( keV) X-ray luminosities and the bolometric correction of Vasudevan et al. (2009).
Figure 7 shows that the (U)LIRGs are dominated by mass ratios of and with average bolometric luminosities that are larger than for our optically selected and X-ray detected sample. Since (U)LIRGs are extremely gas rich and dusty (Sanders et al., 1988b, a; Canalizo & Stockton, 2001), this comparison is consistent with the expectation that enhancements in merger-driven AGN triggering are coincident with large reservoirs of material for accretion. However, the bolometric luminosities of the (U)LIRGs are only larger than our sample by . This small enhancement suggests that, while the presence of gas and dust is a requirement for AGN triggering in any context, the rate at which gas and dust is transported to the nuclei in mergers is sensitive to the mass ratio and highest in major mergers.
6. Conclusions
We analyze new HST imaging for a sample of six galaxies selected to host X-ray sources that are spatially offset from the galaxy nucleus. We use the HST imaging to constrain the merger scenario for each host galaxy and determine the likely nature of the X-ray sources. This analysis yields the following conclusions:
-
•
Four out of the six X-ray sources are in galaxy mergers, and the nuclear separations are kpc in all cases. In two of these mergers the X-ray source is associated with the primary galaxy, and in the other two mergers it is associated with a spatially offset smaller, companion galaxy.
-
•
The host galaxies for two of the six X-ray sources do not show any evidence of mergers. These X-ray sources may be associated with the optically selected AGN in the primary galaxy nucleus or may be ULXs/HLXs produced by super-Eddington accretion in XRBs. The second possibility suggests the potential for systematic searches of offset X-ray sources to identify large populations of ULXs and HLXs out to intermediate redshifts.
After combining this sample with three additional offset AGN from our selection procedure for which the merger mass ratios are known, we specifically compare the properties of offset AGN to those of dual AGN. The dual AGN have similar selection criteria to the offset AGN and known mass ratios. Our aim is to understand the physics of single AGN triggering versus dual AGN triggering and how galaxy properties relate to merger-driven SMBH growth. The dynamic range of mass ratios ( ) and small physical separations ( kpc) make this sample ideal for examining these connections over a wide range of tidal disturbances and during advanced merger stages when SMBH growth is predicted to peak. Our conclusions are as follows:
-
•
Galaxy mergers with only a single AGN are predominantly found in minor mergers. This observation corroborates predictions from simulations that mergers with only one AGN are preferentially those with large mass ratios. Moreover, the mass ratios among single AGN are similar to the overall population of galaxy mergers, implying that mergers triggering only one AGN are not preferentially found in more disturbed galaxies compared to mergers without AGN.
-
•
Relative to offset AGN, dual AGN show a preference toward major mergers and larger nuclear gas masses. This result suggests that the merger mass ratio, and corresponding tidal forces, has a strong effect on the number of AGN triggered in a merger while also supporting the hypothesis that dual AGN triggering requires enhanced supplies of nuclear fuel for accretion.
-
•
The AGN bolometric luminosities increase toward smaller mass ratios (major mergers). This result suggests that merger morphology affects the level of SMBH accretion. Moreover, for small mass ratios our sample has accretion levels that are statistically consistent with a comparison sample of gas-rich (U)LIRGs, an indication that even mergers with enhanced reservoirs of fuel require significant tidal disturbances to drive SMBH accretion.
Finally, our results suggest that spatially offset X-ray sources may be an effective method for identifying AGN in late-stage galaxy mergers and ULXs/HLXs at intermediate redshifts from archival imaging data alone. The same principle technique can also be applied to radio imaging since it can achieve the requisite spatial resolution and is sensitive to radio loud AGN. With large volumes of archival X-ray and radio imaging becoming increasingly more available, offset AGN are a potentially promising means of studying AGN triggering in galaxy mergers.
The authors thank an anonymous referee for a detailed and constructive report that greatly improved the quality of the paper. The results reported here are based on observations made with the NASA/ESA Hubble Space Telescope, obtained at the Space Telescope Science Institute, which is operated by the Association of Universities for Research in Astronomy, Inc., under NASA contract NAS 5-26555. These observations are associated with program number GO-14068. Support for this work was also provided by NASA through Chandra Award Number AR5-16010A issued by the Chandra X-ray Observatory Center, which is operated by the Smithsonian Astrophysical Observatory for and on behalf of NASA under contract NAS8-03060. The scientific results reported in this article are based in part on observations made by the Chandra X-ray Observatory, and this research has made use of software provided by the Chandra X-ray Center in the application packages CIAO and Sherpa.
References
- Abramowicz et al. (2002) Abramowicz, M. A., Igumenshchev, I. V., Quataert, E., & Narayan, R. 2002, The Astrophysical Journal, 565, 1101
- Assef et al. (2013) Assef, R. J., et al. 2013, ApJ, 772, 26
- Baldwin et al. (1981) Baldwin, J. A., Phillips, M. M., & Terlevich, R. 1981, PASP, 93, 5
- Barnes & Hernquist (1991) Barnes, J. E., & Hernquist, L. E. 1991, ApJ, 370, L65
- Barrows et al. (2016) Barrows, R. S., Comerford, J. M., Greene, J. E., & Pooley, D. 2016, ApJ, 829, 37
- Barrows et al. (2017a) —. 2017a, ApJ, 838, 129
- Barrows et al. (2017b) Barrows, R. S., Comerford, J. M., Zakamska, N. L., & Cooper, M. C. 2017b, ApJ, 850, 27
- Begelman (2002) Begelman, M. C. 2002, ApJ, 568, L97
- Bell et al. (2003) Bell, E. F., McIntosh, D. H., Katz, N., & Weinberg, M. D. 2003, ApJS, 149, 289
- Bertin & Arnouts (1996) Bertin, E., & Arnouts, S. 1996, A&AS, 117, 393
- Bianchi et al. (2008) Bianchi, S., Chiaberge, M., Piconcelli, E., Guainazzi, M., & Matt, G. 2008, MNRAS, 386, 105
- Blanton et al. (2001) Blanton, M. R., Lupton, R. H., Maley, F. M., Young, N., Zehavi, I., & Loveday, J. 2001, arXiv preprint astro-ph/0105535
- Blecha et al. (2013) Blecha, L., Loeb, A., & Narayan, R. 2013, MNRAS, 429, 2594
- Brinchmann et al. (2004) Brinchmann, J., Charlot, S., White, S. D. M., Tremonti, C., Kauffmann, G., Heckman, T., & Brinkmann, J. 2004, MNRAS, 351, 1151
- Canalizo & Stockton (2001) Canalizo, G., & Stockton, A. 2001, ApJ, 555, 719
- Capelo et al. (2015) Capelo, P. R., Volonteri, M., Dotti, M., Bellovary, J. M., Mayer, L., & Governato, F. 2015, MNRAS, 447, 2123
- Cardelli et al. (1989) Cardelli, J. A., Clayton, G. C., & Mathis, J. S. 1989, ApJ, 345, 245
- Colbert & Mushotzky (1999) Colbert, E. J. M., & Mushotzky, R. F. 1999, ApJ, 519, 89
- Comerford et al. (2017a) Comerford, J. M., Barrows, R. S., Greene, J. E., & Pooley, D. 2017a, ApJ, 847, 41
- Comerford et al. (2017b) Comerford, J. M., Barrows, R. S., Müller-Sánchez, F., Nevin, R., Greene, J. E., Pooley, D., Stern, D., & Harrison, F. A. 2017b, ApJ, 849, 102
- Comerford & Greene (2014) Comerford, J. M., & Greene, J. E. 2014, ApJ, 789, 112
- Comerford et al. (2018) Comerford, J. M., Nevin, R., Stemo, A., Müller-Sánchez, F., Barrows, R. S., Cooper, M. C., & Newman, J. A. 2018, ApJ, 867, 66
- Comerford et al. (2015) Comerford, J. M., Pooley, D., Barrows, R. S., Greene, J. E., Zakamska, N. L., Madejski, G. M., & Cooper, M. C. 2015, ApJ, 806, 219
- Condon et al. (2017) Condon, J. J., Darling, J., Kovalev, Y. Y., & Petrov, L. 2017, ApJ, 834, 184
- Conselice et al. (2000) Conselice, C. J., Bershady, M. A., & Jangren, A. 2000, ApJ, 529, 886
- Di Matteo et al. (2005) Di Matteo, T., Springel, V., & Hernquist, L. 2005, Nature, 433, 604
- Ellison et al. (2011) Ellison, S. L., Patton, D. R., Mendel, J. T., & Scudder, J. M. 2011, MNRAS, 418, 2043
- Ellison et al. (2008) Ellison, S. L., Patton, D. R., Simard, L., & McConnachie, A. W. 2008, AJ, 135, 1877
- Evans et al. (2010) Evans, I. N., et al. 2010, The Astrophysical Journal Supplement Series, 189, 37
- Farrell et al. (2009) Farrell, S. A., Webb, N. A., Barret, D., Godet, O., & Rodrigues, J. M. 2009, Nature, 460, 73
- Feng & Kaaret (2009) Feng, H., & Kaaret, P. 2009, ApJ, 696, 1712
- Fu et al. (2012) Fu, H., Yan, L., Myers, A. D., Stockton, A., Djorgovski, S. G., Aldering, G., & Rich, J. A. 2012, ApJ, 745, 67
- Ge et al. (2012) Ge, J.-Q., Hu, C., Wang, J.-M., Bai, J.-M., & Zhang, S. 2012, ApJS, 201, 31
- Georgakakis et al. (2009) Georgakakis, A., et al. 2009, MNRAS, 397, 623
- Ghosh & White (2001) Ghosh, P., & White, N. E. 2001, ApJ, 559, L97
- Graham & Driver (2005) Graham, A. W., & Driver, S. P. 2005, PASA, 22, 118
- Hernquist (1989) Hernquist, L. 1989, Nature, 340, 687
- Ho (2009) Ho, L. C. 2009, The Astrophysical Journal, 699, 626
- Hopkins & Hernquist (2009) Hopkins, P. F., & Hernquist, L. 2009, ApJ, 694, 599
- Hopkins et al. (2008) Hopkins, P. F., Hernquist, L., Cox, T. J., & Kereš, D. 2008, ApJS, 175, 356
- Jonker et al. (2010) Jonker, P. G., Torres, M. A. P., Fabian, A. C., Heida, M., Miniutti, G., & Pooley, D. 2010, MNRAS, 407, 645
- Kauffmann et al. (2003) Kauffmann, G., et al. 2003, MNRAS, 346, 1055
- Kewley et al. (2006) Kewley, L. J., Groves, B., Kauffmann, G., & Heckman, T. 2006, MNRAS, 372, 961
- Kim et al. (2017) Kim, D.-C., Yoon, I., Privon, G. C., Evans, A. S., Harvey, D., Stierwalt, S., & Kim, J. H. 2017, ApJ, 840, 71
- King & Dehnen (2005) King, A. R., & Dehnen, W. 2005, MNRAS, 357, 275
- Kocevski et al. (2012) Kocevski, D. D., et al. 2012, ApJ, 744, 148
- Komossa et al. (2003) Komossa, S., Burwitz, V., Hasinger, G., Predehl, P., Kaastra, J. S., & Ikebe, Y. 2003, ApJ, 582, L15
- Koss et al. (2012) Koss, M., Mushotzky, R., Treister, E., Veilleux, S., Vasudevan, R., & Trippe, M. 2012, ApJ, 746, L22
- Lamastra et al. (2009) Lamastra, A., Bianchi, S., Matt, G., Perola, G. C., Barcons, X., & Carrera, F. J. 2009, A&A, 504, 73
- Liu et al. (2013) Liu, X., Civano, F., Shen, Y., Green, P., Greene, J. E., & Strauss, M. A. 2013, ApJ, 762, 110
- Lotz et al. (2011) Lotz, J. M., Jonsson, P., Cox, T. J., Croton, D., Primack, J. R., Somerville, R. S., & Stewart, K. 2011, ApJ, 742, 103
- Madau et al. (1998) Madau, P., Pozzetti, L., & Dickinson, M. 1998, ApJ, 498, 106
- Maiolino et al. (2001) Maiolino, R., Marconi, A., Salvati, M., Risaliti, G., Severgnini, P., Oliva, E., La Franca, F., & Vanzi, L. 2001, A&A, 365, 28
- Makarov et al. (2017) Makarov, V. V., Frouard, J., Berghea, C. T., Rest, A., Chambers, K. C., Kaiser, N., Kudritzki, R.-P., & Magnier, E. A. 2017, ApJ, 835, L30
- Mannucci et al. (2001) Mannucci, F., Basile, F., Poggianti, B. M., Cimatti, A., Daddi, E., Pozzetti, L., & Vanzi, L. 2001, MNRAS, 326, 745
- Marconi & Hunt (2003) Marconi, A., & Hunt, L. K. 2003, ApJ, 589, L21
- Mechtley et al. (2015) Mechtley, M., et al. 2015, ArXiv e-prints
- Mezcua et al. (2015) Mezcua, M., Roberts, T. P., Lobanov, A. P., & Sutton, A. D. 2015, MNRAS, 448, 1893
- Mihos & Hernquist (1996) Mihos, J. C., & Hernquist, L. 1996, ApJ, 464, 641
- Müller-Sánchez et al. (2015) Müller-Sánchez, F., Comerford, J. M., Nevin, R., Barrows, R. S., Cooper, M. C., & Greene, J. E. 2015, ApJ, 813, 103
- Nevin et al. (2016) Nevin, R., Comerford, J., Müller-Sánchez, F., Barrows, R., & Cooper, M. 2016, ApJ, 832, 67
- Park et al. (2006) Park, T., Kashyap, V. L., Siemiginowska, A., van Dyk, D. A., Zezas, A., Heinke, C., & Wargelin, B. J. 2006, ApJ, 652, 610
- Patton et al. (2013) Patton, D. R., Torrey, P., Ellison, S. L., Mendel, J. T., & Scudder, J. M. 2013, MNRAS, 433, L59
- Peng et al. (2010) Peng, C. Y., Ho, L. C., Impey, C. D., & Rix, H.-W. 2010, AJ, 139, 2097
- Piconcelli et al. (2010) Piconcelli, E., et al. 2010, ApJ, 722, L147
- Rosas-Guevara et al. (2018) Rosas-Guevara, Y., Bower, R., McAlpine, S., Bonoli, S., & Tissera, P. 2018, ArXiv e-prints
- Sanders et al. (1988a) Sanders, D. B., Soifer, B. T., Elias, J. H., Madore, B. F., Matthews, K., Neugebauer, G., & Scoville, N. Z. 1988a, ApJ, 325, 74
- Sanders et al. (1988b) Sanders, D. B., Soifer, B. T., Elias, J. H., Neugebauer, G., & Matthews, K. 1988b, ApJ, 328, L35
- Satyapal et al. (2014) Satyapal, S., Ellison, S. L., McAlpine, W., Hickox, R. C., Patton, D. R., & Mendel, J. T. 2014, MNRAS, 441, 1297
- Scudder et al. (2012) Scudder, J. M., Ellison, S. L., Torrey, P., Patton, D. R., & Mendel, J. T. 2012, MNRAS, 426, 549
- Sersic (1968) Sersic, J. L. 1968, Atlas de galaxias australes
- Shangguan et al. (2016) Shangguan, J., Liu, X., Ho, L. C., Shen, Y., Peng, C. Y., Greene, J. E., & Strauss, M. A. 2016, ApJ, 823, 50
- Shen et al. (2011) Shen, Y., Liu, X., Greene, J. E., & Strauss, M. A. 2011, ApJ, 735, 48
- Simmons et al. (2012) Simmons, B. D., Urry, C. M., Schawinski, K., Cardamone, C., & Glikman, E. 2012, ApJ, 761, 75
- Skipper & Browne (2018) Skipper, C. J., & Browne, I. W. A. 2018, MNRAS, 475, 5179
- Springel et al. (2005) Springel, V., Di Matteo, T., & Hernquist, L. 2005, ApJ, 620, L79
- Steinborn et al. (2016) Steinborn, L. K., Dolag, K., Comerford, J. M., Hirschmann, M., Remus, R.-S., & Teklu, A. F. 2016, MNRAS, 458, 1013
- Steinborn et al. (2018) Steinborn, L. K., Hirschmann, M., Dolag, K., Shankar, F., Juneau, S., Krumpe, M., Remus, R.-S., & Teklu, A. F. 2018, MNRAS, 481, 341
- Stern et al. (2012) Stern, D., et al. 2012, ApJ, 753, 30
- Swartz et al. (2009) Swartz, D. A., Tennant, A. F., & Soria, R. 2009, ApJ, 703, 159
- Thomas et al. (2013) Thomas, D., et al. 2013, MNRAS, 431, 1383
- Trump et al. (2015) Trump, J. R., et al. 2015, ApJ, 811, 26
- Van Wassenhove et al. (2012) Van Wassenhove, S., Volonteri, M., Mayer, L., Dotti, M., Bellovary, J., & Callegari, S. 2012, ApJ, 748, L7
- Vasudevan et al. (2009) Vasudevan, R. V., Mushotzky, R. F., Winter, L. M., & Fabian, A. C. 2009, MNRAS, 399, 1553
- Villforth et al. (2014) Villforth, C., et al. 2014, MNRAS, 439, 3342
- Villforth et al. (2016) —. 2016, ArXiv e-prints
- Weigel et al. (2018) Weigel, A. K., Schawinski, K., Treister, E., Trakhtenbrot, B., & Sanders, D. B. 2018, MNRAS
- Wolter et al. (2006) Wolter, A., Trinchieri, G., & Colpi, M. 2006, MNRAS, 373, 1627
- Wright et al. (2010) Wright, E. L., et al. 2010, AJ, 140, 1868
- Yu et al. (2011) Yu, Q., Lu, Y., Mohayaee, R., & Colin, J. 2011, ApJ, 738, 92