New Galactic Star Clusters Discovered in the Disk Area of the VVVX Survey.
Abstract
The “VISTA Variables in the Vía Láctea eXtended (VVVX)” ESO Public Survey is a near-infrared photometric sky survey that covers nearly 1700 deg2 towards the Galactic disk and bulge. It is well-suited to search for new open clusters, hidden behind dust and gas. The pipeline processed and calibrated -band tile images of 40% of the disk area covered by VVVX was visually inspected for stellar over-densities. Then, we identified cluster candidates by examination of the composite color images. The color-magnitude diagrams of the cluster candidates are constructed. Whenever possible the Gaia DR2 parameters are used to calculate the mean proper motions, radial velocities, reddening and distances. We report the discovery of 120 new infrared clusters and stellar groups. Approximately, half of them (47%) are faint, compact, highly reddened, and they seem to be associated with other indicators of recent star formation, such as nearby Young Stellar Objects, Masers, H ii regions or bubbles. The preliminary distance determinations allow us to trace the clusters up to 4.5 kpc, but most of the cluster candidates are centered at 2.2 kpc. The mean proper motions of the clusters, show that in general, they follow the disk motion of the Galaxy.
keywords:
Galaxy: open clusters and associations – Galaxy: disk –Infrared: stars1 Introduction
The Milky Way environment provides a unique place to test the predictions of cosmological models and the theories of galaxy formation. Moreover, our location within our own Galaxy gives us a close-up look at star clusters which in turn has implications on extragalactic star clusters studies with the next generation facilities like the NASA’s James Webb Space Telescope (JWST) and the ESO’s European Extremely Large Telescope (E-ELT). In preparation for these we have to complete the census of star clusters in the Galaxy, as well as to create template samples of well understood benchmark star clusters. This has motivated the renewed interest in star clusters, made possible by the new all-sky infrared (IR) surveys, such as 2MASS (Two Micron All Sky Survey; Skrutskie et al., 2006), GLIMPSE (Galactic Legacy Infrared Mid-Plane Survey Extraordinaire; Benjamin et al., 2003), WISE (Wide-field Infrared Survey Explorer; Wright et al., 2010), VVV (VISTA Variables in the Vía Láctea; Minniti et al., 2010) and UKIDSS GPS (The Galactic Plane Survey; Lucas et al., 2008). These new IR surveys added many new objects to the traditional optical catalogs (e.g. WEBDA Dias et al. (2002); MWSC or Milky Way global survey of Star Clusters database - Kharchenko et al. 2013, Schmeja et al. 2014), including some heavily obscured star clusters visible only in the infrared (hereafter, IR clusters; see for example Morales et al., 2013; Zasowski et al., 2013; Camargo, Bica, & Bonatto, 2016). Taking into account the resent work of Ryu & Lee (2018), the total number of known infrared clusters has know exceeded 6300 objects.
Many of these new IR clusters are based on the ESO Large Public Survey VISTA Variables in the Vía Láctea – VVV111P.I. D. Minniti, https://vvvsurvey.org, because it delivered deep sub-arcsec seeing images and photometry (Minniti et al., 2010; Saito et al., 2012). The VVV survey mapped the IR variability of the Milky Way bulge and southern mid-plane over a period of six years (2010-2016). The VVV footprint contained about 300 known clusters, but more than 750 new clusters and candidate clusters were added in VVV-based works (e.g., Borissova et al., 2011, 2014; Solin et al., 2014; Barbá el al., 2015; Ivanov et al., 2017; Froebrich et al., 2017). Follow-up spectroscopy of some new candidates confirmed their cluster nature, improving the census of young massive clusters in the Galaxy: seven new ones were added and they contain at least one newly discovered WR star (Chené et al., 2013, 2015; Hervé et al., 2016). We have reported a new, massive WR star (>100 solar mass, Chené et al., 2015), a new, massive cluster in the far edge of the Galactic bar (Ramírez Alegría et al., 2014), etc. The multi-epoch VVV observations also made it possible to investigate the IR variability of the cluster members (Borissova et al., 2014, 2016; Navarro Molina et al., 2016; Medina et al., 2018).
The existence of these previously undiscovered open clusters was predicted by Portegies Zwart et al. (2010), but the VVV survey has also improved the census of globular clusters in the Galactic bulge and disk. The number of globular clusters in our Galaxy was estimated to be not more than 160 (see Ivanov et al., 2005, for an empirical approach to the missing globular clusters). But recent discoveries in the VVV area reveal about 100 new globular cluster candidates (Minniti et al., 2011; Moni Bidin et al., 2011; Borissova et al., 2014; Minniti et al., 2017a, b, c). If confirmed, this will drastically change the landscape of the old cluster population in our Galaxy.
A new project, “VISTA Variables in the Vía Láctea eXtended” (VVVX) survey, was launched in 2016 as an extension of the complied VVV survey in order to enhance its legacy value. The VVVX will spend a total of 2000 hr of VISTA time over 3 years to extend the VVV time-baseline and to nearly double the VVV spatial coverage up to 1700 deg2 from =230∘ to =20∘ (7h 19h). Based on the VVV experience, our predictions are that VVVX will also significantly increase the number of star clusters in our Galaxy. Many are expected near the tangent point of the Carina arm region, which harbors very massive young clusters such as Westerlund 2, NGC 3603 and the Carina Nebula Complex. The extension of VVVX towards the third Galactic quadrant is fundamental to unveil new clusters along the Perseus arm and to trace the proposed Outer arm, reaching the edge of the Galactic disk.
Thus, following Borissova et al. (2011) we expanded our investigation of the Milky Way cluster population to include the new areas covered by VVVX, aiming to improve the star cluster census and to continue building a statistically significant sample of clusters, with homogeneously derived parameters. We concentrate on objects that are practically invisible in the optical bands. The improved catalog of star clusters in the Galaxy can help to constrain theoretical models of cluster formation (e.g., Pfalzner et al., 2016) and to determine some fundamental relations between basic cluster parameters.
Two and half years after the start of the VVVX survey we have at our disposal only a part of the VVVX footprint. In this paper, we report the first results of our visual search for new star cluster candidates in the VVVX disk area. More specifically by April, 2018, appox. 55% of the new VVVX area was observed. From this, we have searched 74%, excluding only the extension of the VVVX bulge, which we plan to examine by automated tools. With respect to the whole new VVVX area the total area searched in this paper is 40%.
2 Observations and Data Reduction
The VVV and VVVX data were obtained with the 4.1-meter ESO VISTA telescope (Visual and Infrared Survey Telescope for Astronomy; Emerson, McPherson & Sutherland, 2006) located at Cerro Paranal, Chile, with the 16-detector VIRCAM (VISTA Infrared CAMera; Dalton et al., 2006). It has a 1 1.5 deg2 field of view and works in the 0.9-2.5 m wavelength range and a pixel scale of 0.34 arcsec px-1. The data are reduced with the VISTA Data Flow System (VDFS; Irwin et al., 2004; Emerson et al., 2004) at the Cambridge Astronomical Survey Unit222http://casu.ast.cam.ac.uk/ (CASU). Processed images and photometric catalogs are available from the ESO Science Archive333http://archive.eso.org/ and from the VISTA Science Archive444http://horus.roe.ac.uk/vsa/ (VSA; Cross et al., 2012). A single VIRCAM image, called paw, contains large gaps; six paws taken in a spatial offset pattern must be combined to fill them in, obtaining a contiguous image, called tile. The VVVX paws and tiles are aligned along and . The total exposure time of the tiles are: 8 sec in (for a single epoch), 24 sec in and 60 in band. The tiles overlap by a few arc minutes in Galactic latitude and longitude – just like with the VVV – to ensure homogeneous coverage, spatial continuity and overall photometric and astrometric consistency. The tile overlaps result in a small fraction of duplicate sources, which is advantageous for variable stars, but that must be taken into account when analyzing maps or star counts that span wider areas than that of a single tile. Importantly, these tile overlaps allow to test the intrinsic accuracy of the photometry and astrometry. Therefore, the VVVX followed the same observing strategy as the VVV.
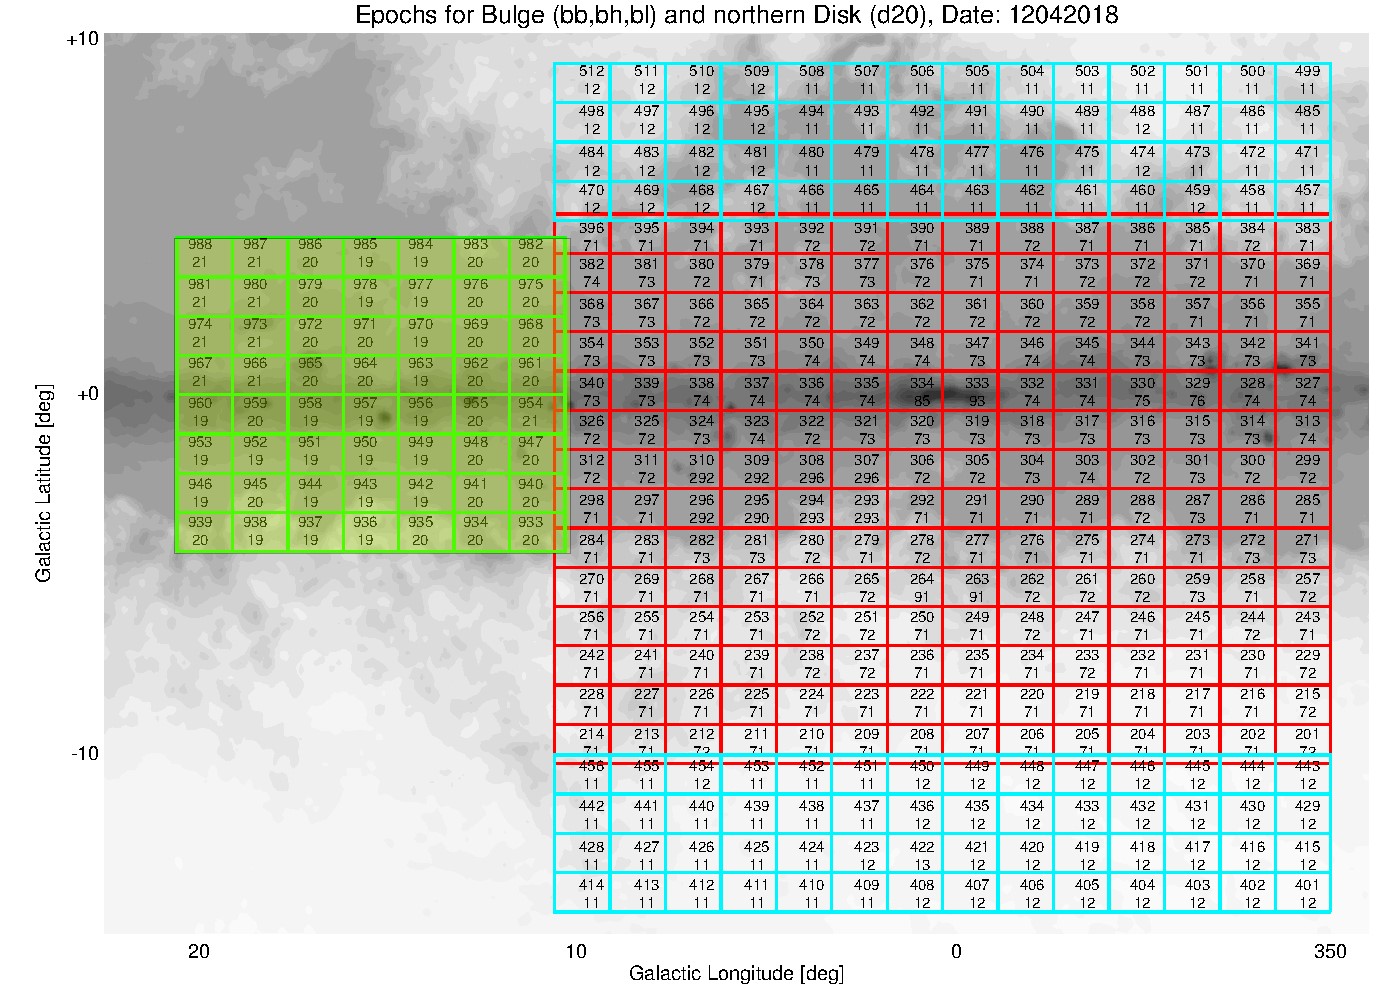
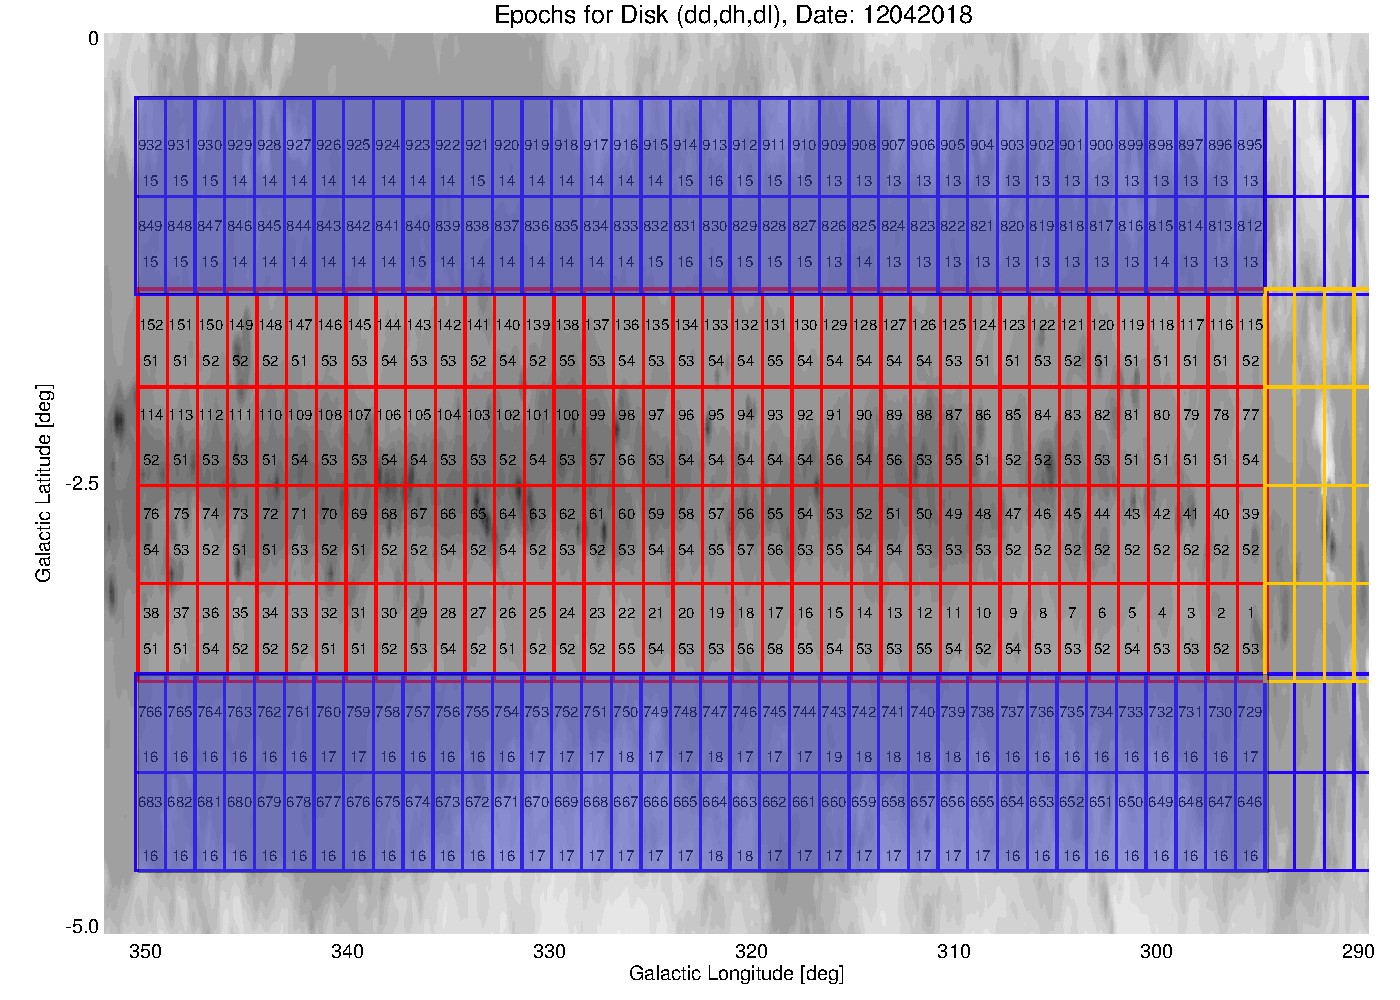
Figure 1 shows the VVV and VVVX footprints. In the bulge this corresponds to 20∘ 24∘ (14 22 tiles). These are shown in Fig. 1 in red for the former VVV tiles (b201 to b396), in cyan for the new southern bulge extension from tiles b401 to b456, and for the new northern bulge extension from tiles b457 to b512. The new northern disk area covers a 10∘ 9∘ patch (7 8 tiles). These are shown in green in Fig. 1, from tiles e933 to e988. The new southern disk area covers 120∘ 9∘, split into two stripes of 83 2 tiles each (Fig. 1; tiles e601 to e766, and e767 to e932 are marked in blue) and an extension along the Galactic mid-plane region by 65∘ 4∘, (Fig. 1, tiles e1001 to e1180 are shown in yellow). The original VVV-disk area is also shown in red in Fig. 1, consisting of tiles d001 to d152. During its first two and half years (2016 to 2018), the VVVX survey covered in the bands the southern bulge extension from tiles b401 to b456; e601 to e766, and e767 to e932. The northern disk tiles are from e933 to e988.

3 Cluster Search and Validation
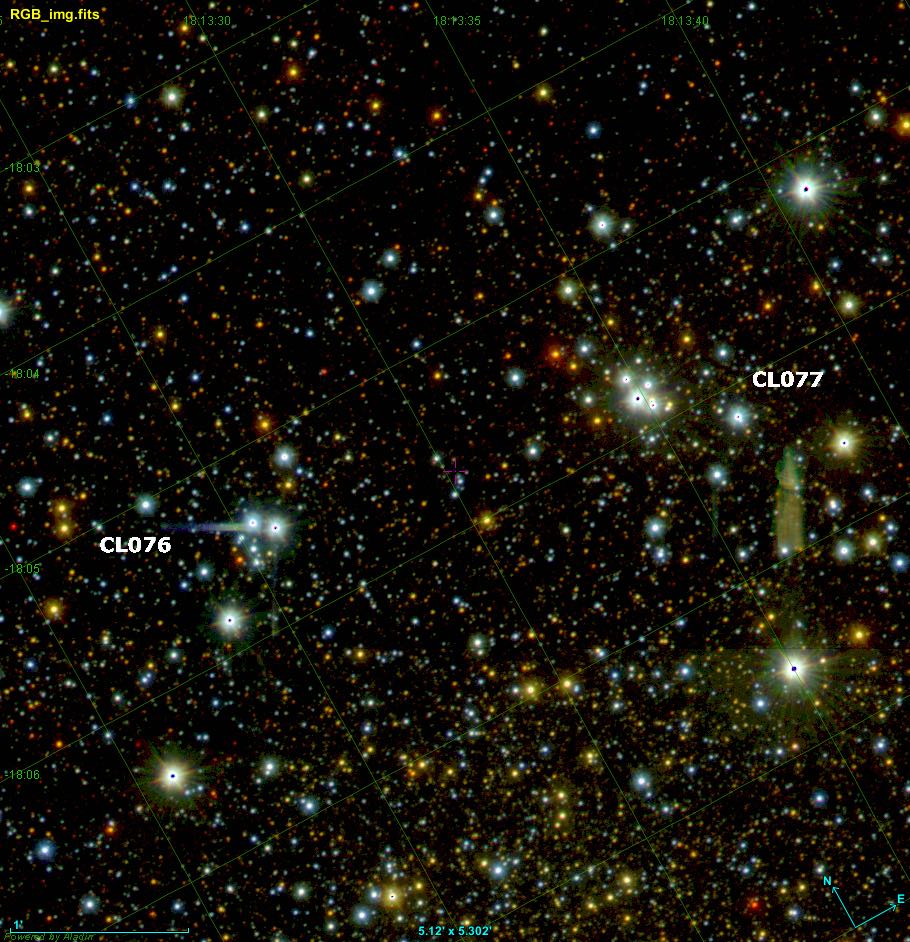
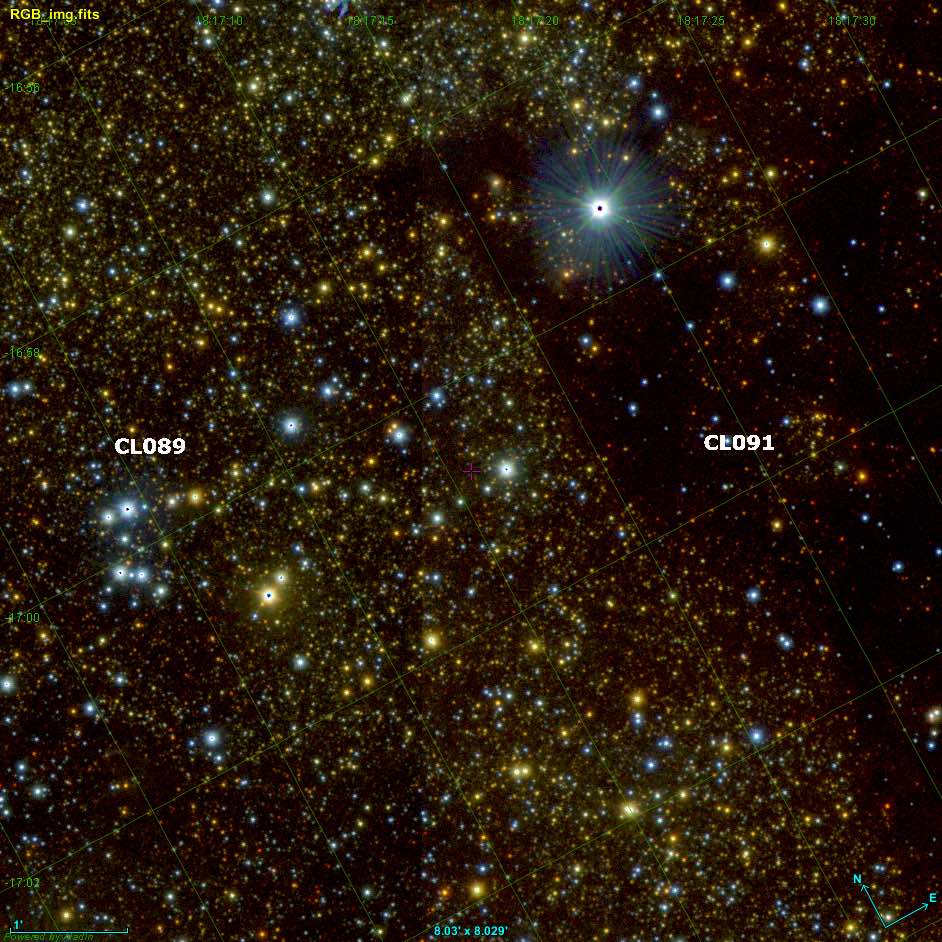
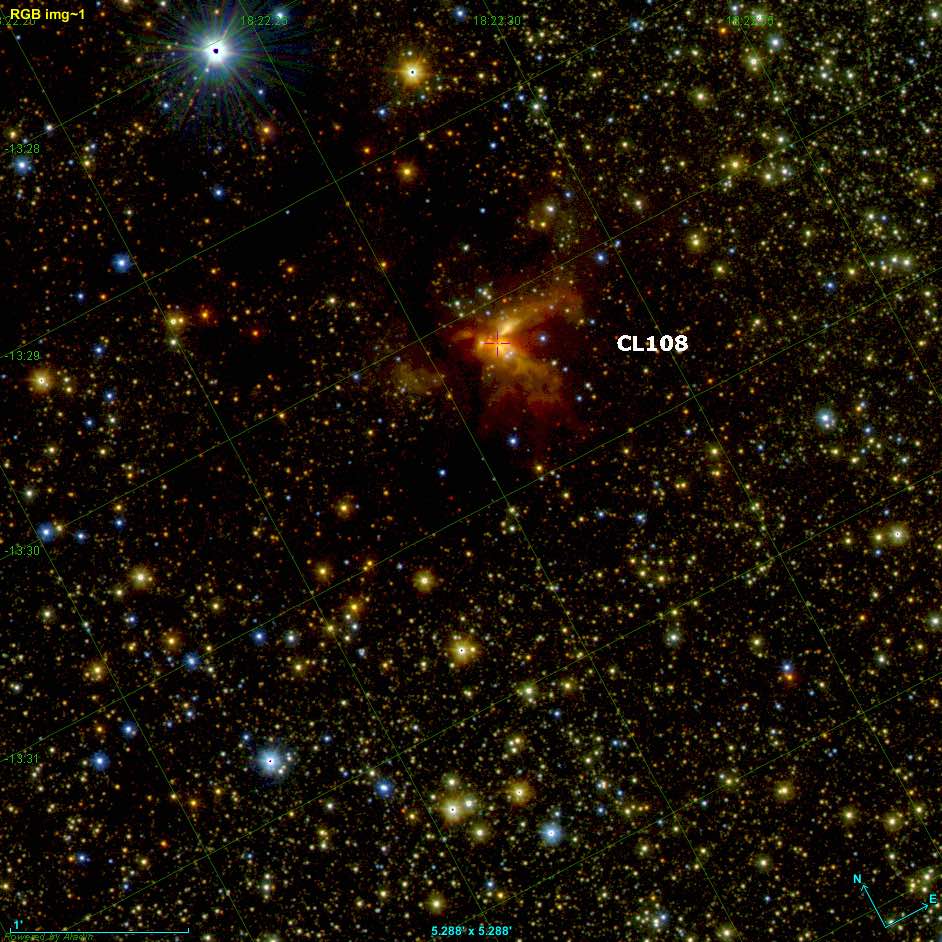
Our previous experience has shown that the number densities used by automated cluster searches (Ivanov et al., 2002; Borissova et al., 2003) tend to yield a large number of spurious cluster candidates in the inner Milky Way, because of the uneven distribution of the obscuring dust. They require time-consuming manual follow up at different, e.g. mid-IR wavelengths, and at the end they are not much more effective than simple visual searches. Furthermore, here we are aiming at relatively faint and heavily reddened clusters, undiscovered in the 2MASS, DENIS and GLIMPSE surveys. Therefore, we adopted the visual inspection as our search method. All observed images were retrieved from the CASU database and initially the tile images were visually inspected. The preliminary list of candidates was created on the basis of the detected local overdensity of the number of stars with respect to the surrounding area. Then, the composite color images were created and we verified the compact appearance, distinctive from the surrounding field and containing at least 5-6 stars with similar colors concentrated towards the objects’ center. Figure 2 shows the composite color images of some newly discovered cluster candidates and stellar groups for illustration. The color images of the whole sample are given in the Appendix C.
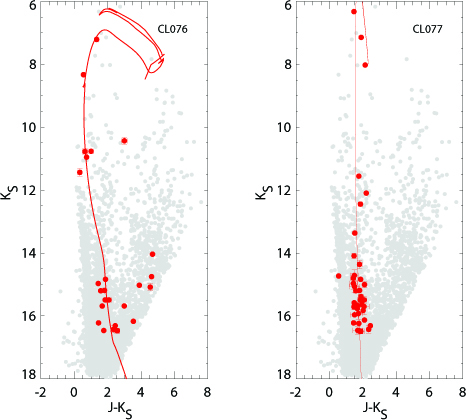
The next step in our validation process was the analysis of the color-magnitude diagrams. To construct them, we performed PSF photometry of a arcmin area in the , , and bands surrounding the selected candidate. We used the Dophot photometric routine following Alonso-García et al. (2017). The instrumental magnitudes were transformed to the standard system, and the saturated stars (usually mag, depending on crowding) were replaced by 2 MASS stars (2MASS PSC; Skrutskie et al., 2006). This procedure is described in detail by Alonso-García et al. (2017) and Borissova et al. (2011, 2014). Figure 3 shows two examples of color-magnitude diagrams for VVVX CL076 and VVVX CL077, both classified as open clusters. The most probable cluster members are selected by statistical decontamination procedure (for more details see Borissova et al. 2011) and Gaia DR2 proper motion diagrams (see next paragraph). Following Zasowski et al. (2013), we then fit the Padova theoretical isochrones with solar metallicity (Bressan et al., 2012) (http://stev.oapd.inaf.it/cgi-bin/cmd). The best fit for VVVX CL076 is 32 Myr, while VVVX CL077 is most probably 10 Myr old. We used the Gaia RD2 parallaxes as initial values for the distances (see Table 5), while the mean reddening is determined in the interactive process of the fitting as and , respectively. The color-magnitude diagrams of the whole sample, excluding very faint and compact candidates, are given in Appendix D. The ages of the cluster candidates however will be a subject of follow-up paper, together with up-coming spectroscopic data.
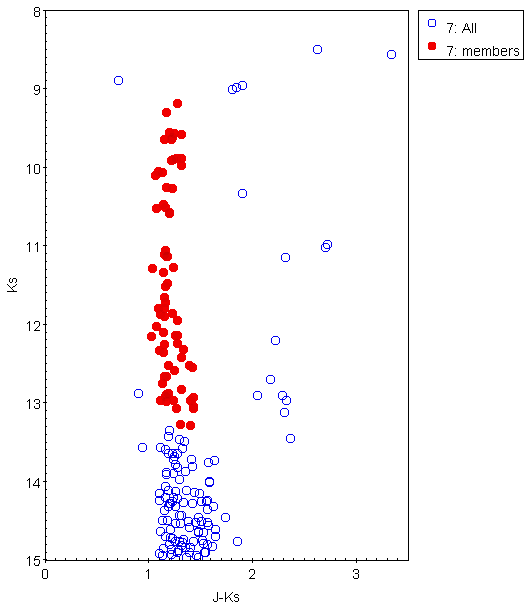
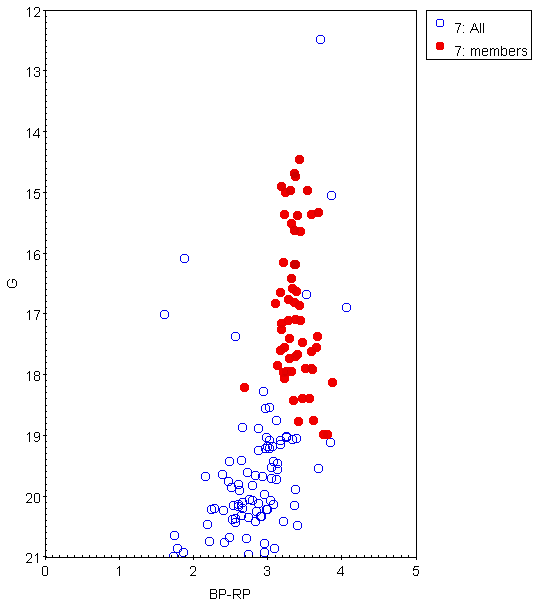
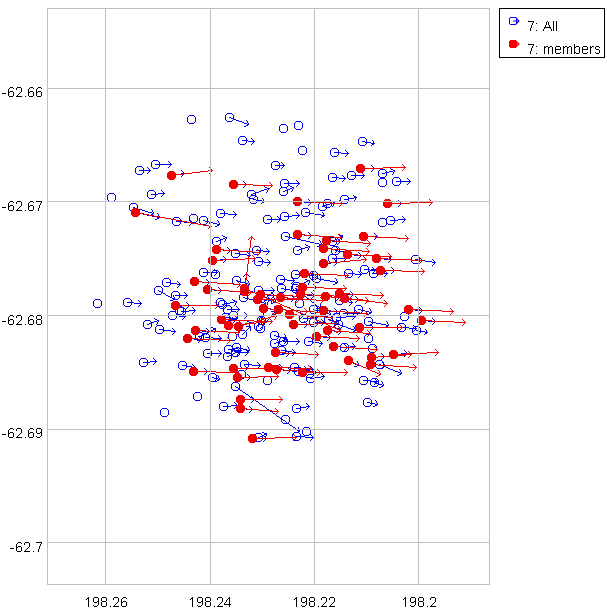
The Gaia astrometric mission was launched in December 2013 (Gaia Collaboration et al., 2016) to measure positions, parallaxes, proper motions and photometry for over sources as well as to obtain physical parameters and radial velocities for millions of stars. Its recent Data Release 2 (Gaia DR2), has covered the initial 22 months of data taking (Gaia Collaboration et al., 2018). As pointed out by Gaia Collaboration et al. (2018b), it is expected that the members of the clusters span small range of distances and their members follow a common space motion which is, in general, different from the bulk of the field stars in the same region. This is illustrated in Fig. 4 (lower panel) for the massive open cluster Danks 2. Thus, we can select the stars with common proper motion and their mean parallax can give us the distance to the cluster. In our case, only small number of probable cluster members have Gaia DR2 counterparts, because we are covering the infrared bands and fainter stars. Moreover, the cluster members are moving with the disk and it is hard to distinguish between both motions.
Therefore, we adopted the following procedure: the most probable cluster members from the statistically decontaminated vs diagrams (Fig. 4, upper, red solid circles) are cross-matched with Gaia DR2 catalog (middle, red solid circles). The proper motion vector diagrams vs are created and the stars with obviously different proper motion are rejected. Whenever possible, the histograms of radial velocities are also examined and the outliers are rejected. For such “cleaned” sample of probable cluster members we calculated the median value and the standard deviation of and (Col: 4 to 7 of Table 5), which we consider as the proper motion of the cluster. Then, only the parallaxes with errors less than 20% are selected and used to calculate the median parallax and its standard deviation (Col: 8 and 9 of Table 5). No correction of parallax zero-point is performed (Lindegren et al., 2018). Using the TOPCAT implementation of Bailer-Jones (2015); Astraatmadja & Bailer-Jones (2016) and Luri et al. (2018) method we calculated “the best estimate of distance using the Exponentially Decreasing Space Density prior” and “the 5th and 95th percentile confidence intervals”. The “best estimate” value is consider as the distance to the cluster, while the standard deviation of the 5th and 95th values is taken as the error of the determination.
It is hard to compare the obtained distances, because there is no data in the literature for our objects. Indirectly, we can compare some kinematic distance estimates when the cluster candidate is projected close to an H ii region. For example, the calculated Gaia distance of 2385 pc for VVVX CL038 is in reasonable agreement with the kinematic distance of 2024 pc of the associated H ii region WRAY16-205 (Stanghellini et al., 2008). Nevertheless, we caution that such calculated distances should be taken as preliminary.
We have also collected -band spectra of 3 and 2 stars for VVVX CL010 and CL011, respectively, using the IR spectrograph and imaging camera SofI in long-slit mode, mounted on the ESO New Technology Telescope (NTT) 555Based on observations gathered with ESO program 0101.C-0519(A).. The instrument set-up give a resolution of R=2200, and the total exposure times were 900 and 1200 s. The reduction procedure for the spectra is described in Chené et al. (2012). The equivalent widths (EWs) were measured from the continuum-normalized spectra using the iraf666IRAF is distributed by the National Optical Astronomy Observatory, which is operated by the Association of Universities for Research in Astronomy (AURA) under cooperative agreement with the National Science Foundation. task splot.
Fig. 5 shows the continuum-normalized spectra, all clearly exhibited characteristic features of cool stars, such as Na i (2.21 m); Ca i (2.26 m) atomic line blends, and the first band-head of CO (2.29 m). Following Borissova et al. (2014) and using the EWs of these three lines and (Frogel et al., 2001) calibration we calculated the mean metallicity of for CL010 and for CL011.
Some parameters of these stars are measured in the Gaia DR2 catalog and are tabulated in Table 1. To test as a proxy of distance, we obtained the spectral types for every star by comparing the Gaia temperature with the Straizys et al. (1981) Sp. Type vs Temperature calibration, and then the individual extinctions and distance moduli are calculated by spectroscopic parallaxes using the intrinsic colors and luminosities, again from Straizys et al. (1981). Thus, the distance moduli to CL010 and Cl011, calculated as a mean value of the individual measurements are (3.43 kpc) and (2.56 kpc), respectively. A comparison with the Gaia distances given in Table 5 shows good agreement. Therefore, in some cases, when we have poorly measured Gaia parallaxes, but individual Gaia temperatures, it is still possible to estimate the distances using spectroscopic parallaxes.
| Name | Gmag | Sp type | Distance | ||||||||||
| ∘ | ∘ | mas | mas | mas | mag | K | mag | mag | mag | mag | kpc | ||
| CL010 | |||||||||||||
| Obj1 | 192.66456 | -64.91643 | 0.00920.056 | -6.2020.076 | 0.1440.070 | 13.470.001 | 3849.86 | M0 | 9.790.03 | 8.700.05 | 8.240.03 | 0.92 | 2.31 |
| Obj2 | 192.66222 | -64.91845 | 0.14280.109 | -5.8320.151 | 0.2330.136 | 12.930.003 | 3296.00 | M5 | 8.730.03 | 7.600.02 | 7.100.02 | 0.99 | 3.99 |
| Obj3 | 192.65980 | -64.92115 | 0.06240.056 | -6.2800.076 | -0.7070.070 | 14.380.001 | 3823.60 | M1 | 10.690.03 | 9.560.04 | 9.140.02 | 0.88 | 3.98 |
| CL011 | |||||||||||||
| Obj1 | 192.81099 | -60.59321 | 0.46240.037 | -14.3100.045 | -1.7300.048 | 11.800.000 | 4048.41 | K6 | 9.610.03 | 8.890.03 | 8.700.02 | 0.31 | 3.00 |
| Obj2 | 192.80710 | -60.59457 | 0.36580.062 | -6.7400.080 | -0.2600.082 | 11.520.002 | 3669.00 | M3 | 8.290.02 | 7.280.04 | 6.940.02 | 0.68 | 2.14 |

4 The Catalog
We identified 120 new candidate star clusters or stellar groups, listed in Table 2. The first column gives the identification, followed by the equatorial coordinates of the center determined by eye, eye-ball measured apparent cluster radius in arcsec, the name of the corresponding VVVX tile and some comments about the nature of the object such as: presence or absence of nebulosity or H ii region around the cluster, known nearby infrared, radio and X-ray sources, young stellar objects (YSO), outflow candidates and masers, taken from the SIMBAD database (http://simbad.u-strasbg.fr/simbad/).
During the visual inspection we recovered 69 known star clusters, mainly from the lists of Bica at al. (2003), Mercer et al. (2005) and Solin et al. (2012), as well as some clusters from WEBDA777http://www.univie.ac.at/webda/ (Dias et al., 2002) database. These are not all known clusters in the VVVX area, many of optically visible clusters (for examples those from Kharchenko et al. (2013)) are not taken in consideration. Another thirteen, previously unknown candidates are in common with Lucas et al. (2018) catalog. All these objects are removed from the catalog presented here. Finally, Ryu & Lee (2018) published a WISE catalog of 923 new star cluster candidates. Comparison shows that we have 7 common candidates. The VVVX cluster candidates CL065; CL070; CL073; CL074; CL084; CL097 and CL120 are matched within 20 arcsec radius with Ryu670; Ryu657; Ryu687; Ryu664; Ryu715; Ryu711; Ryu796, respectively. Since the Ryu & Lee (2018) catalog was published after this paper was submitted to the journal, we consider these objects simultaneously discovered and didn’t remove them from our list, as in the case of previous catalogs.
The preliminary analysis, based only on the appearance on the VVVX images shows two general groups: 53% (64 objects) have the typical appearance of open clusters, the rest of the sample (56 objects) are projected on H II regions, bubbles, nebulosity or around some early OB stars, YSOs and IR sources.
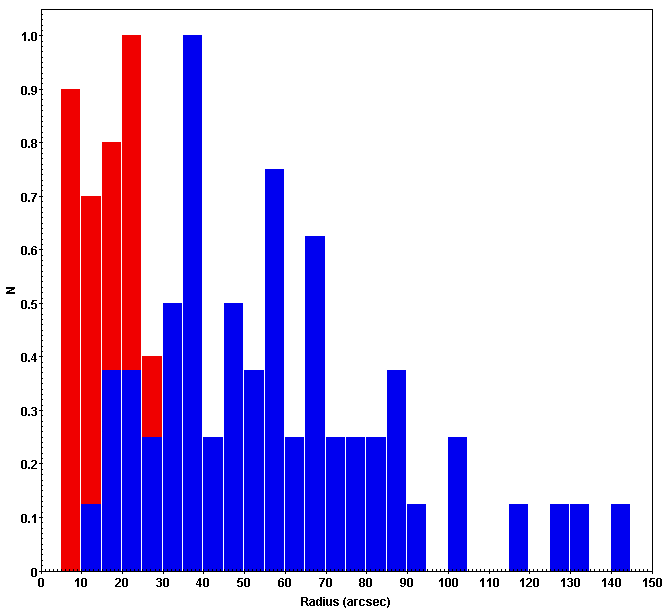
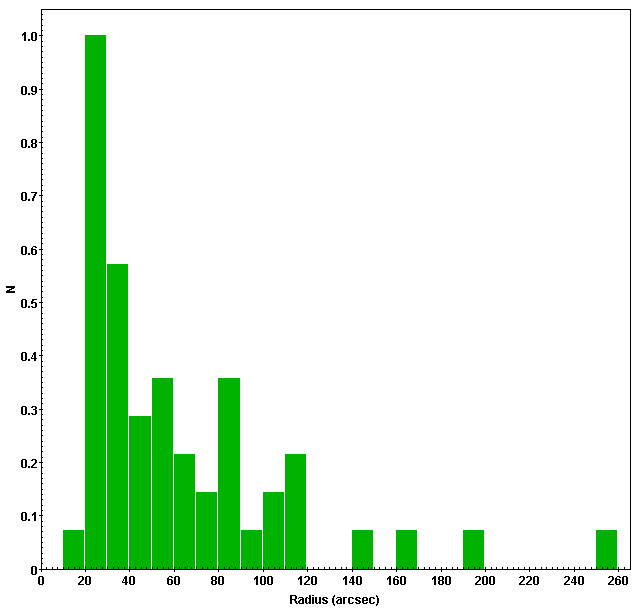
The cluster radii were measured by eye on the VVVX tiles. This method was preferred over automated algorithms, in order to include objects that are not resolved into stars. The area around cluster candidates is smoothed and the density contours are over-plotted with the lower limit of the contour equal to the density of comparison field. The normalized histogram of the Number of star clusters vs Radius is shown in Fig. 6. The sample was divided by two: embedded/young clusters (red color) and open cluster candidates (blue color). The Gaussian distribution gives the mean radius of the young clusters sample of arcsec, while the open cluster sample is centered on arcsec. For comparison, the Gaussian distribution of the known infrared clusters in the investigated VVVX area (see previous paragraph) is centered on arcsec. Thus, in this study, we are adding the fainter and compact (with small angular sizes) new candidates. This looks very similar to the size distribution plot for the clusters found by visual inspection of the GPS/VVV area (Froebrich et al., 2017). The small sizes suggest that the clusters are distant, but the sample could be biased and further investigation is necessary to confirm or reject such suggestion.
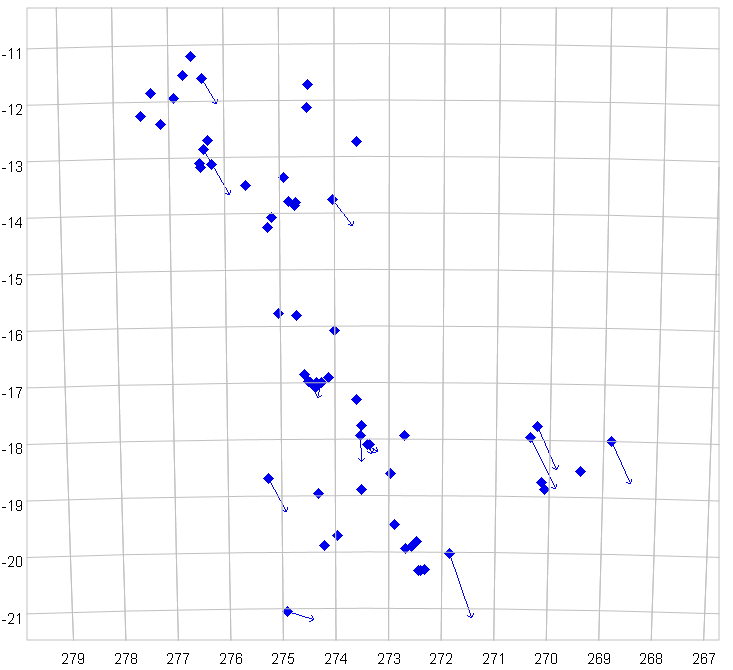
Using the information from Table 1 (see previous paragraph) we can derive some preliminary relations from the new sample of cluster candidates. In Fig. 7, left and middle part, we overplot the sky proper motion vectors, while the right panel shows the proper motion diagram. The blue squares and red circles represent the cluster candidates projected on the North and South VVVX disk area. As can be seen from the figure, in general the clusters follow the disk motion (with exception of CL049, 056, 080, 089 and 103). This is more notable in the South disk area, at higher Galactic latitudes, where the distribution seems more homogeneous. The last panel shows a clear concentration of the candidates towards the lower left part, where the galactic disk stars are projected.
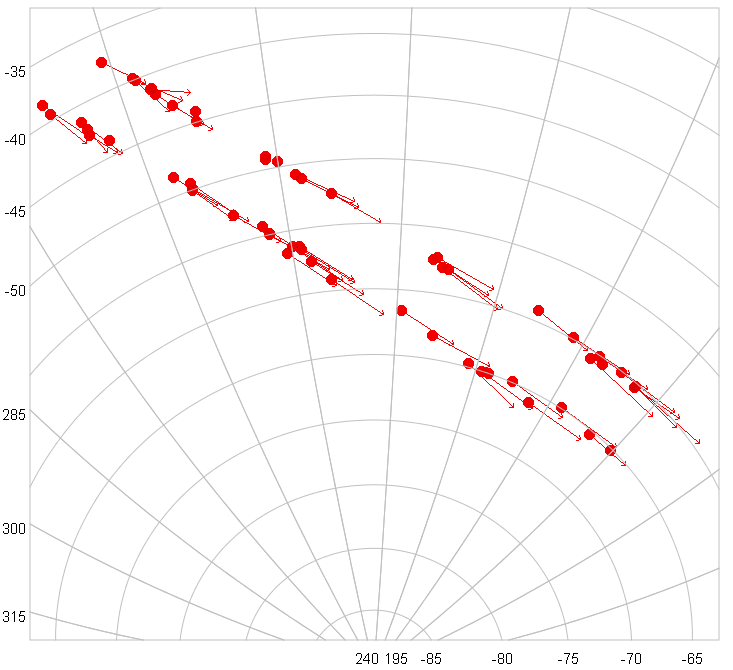
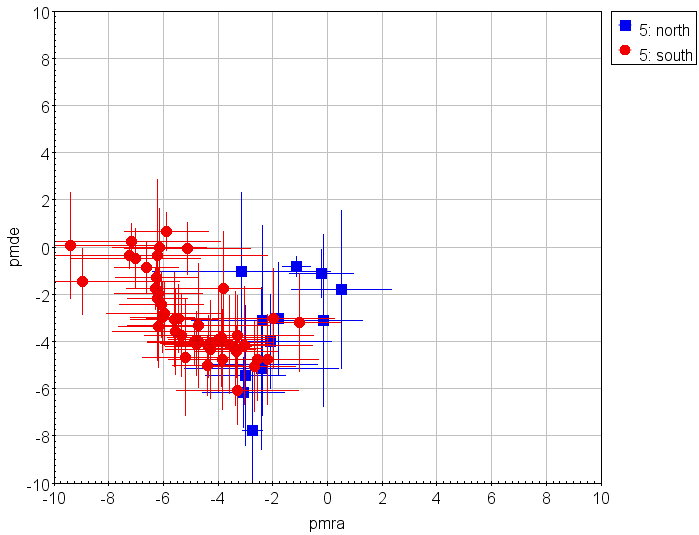
.
Figure 8 illustrates the mean normalized distances and radial velocities of the cluster candidates, taking in consideration the corresponding errors. The distance distribution seems complex, with several groups around 1.3; 2.3 and 3.1 kpc. The mean value of the sample is kpc, calculated as a peak of the Gaussian distribution. Thus, Gaia DR2 distances can be used up to 3.5-4 kpc, but most of the clusters are closer than 2 kpc. The radial velocities are distributed around km/s. A very week correlation (9%) between radial velocities and distances is found, but this could be selection, small sample effect. Again, these values should be taken as preliminary and used with caution.

5 Summary
In this work we report a catalog of 120 new infrared clusters and stellar groups projected in the disk area covered by the ongoing “VISTA Variables in the Vía Láctea eXtended (VVVX)” ESO Public Survey. The search is performed by visual inspection on the pipeline processed and calibrated -band tile images. The initial list of candidates is then validated using the composite color images, vs color-magnitude diagrams and Gaia DR2 proper motions. A smaller proportion of embedded candidates is detected in comparison with previous VVV searches, as would be expected given that much of the area searched is slightly further from the Galactic equator. The smaller number density of candidates is explained by the fact that the area covered by this new search (the outer part of the Galactic disc) is significantly less crowded and reddened than that of the previous search. In general, the clusters follow the disk motion. The Gaia DR2 distances are estimated up to 3.5-4 kpc, but most of the clusters are closer than 2 kpc.
Acknowledgements
We gratefully acknowledge data from the ESO Public Survey program ID 198.B-2004 taken with the VISTA telescope, and products from the Cambridge Astronomical Survey Unit (CASU). This work has made use of data from the European Space Agency (ESA) mission Gaia (https://www.cosmos.esa.int/gaia), processed by the Gaia Data Processing and Analysis Consortium (DPAC, https://www.cosmos.esa.int/web/gaia/dpac/consortium). Funding for the DPAC has been provided by national institutions, in particular the institutions participating in the Gaia Multilateral Agreement. Support is provided by the Ministry for the Economy, Development and Tourism, Programa Iniciativa Cientica Milenio grant IC120009, awarded to the Millennium Institute of Astrophysics (MAS). JB and RK thank ESO for the financial support during their Jan 2018 visit. ANC’s work is supported by the Gemini Observatory, which is operated by the Association of Universities for Research in Astronomy, Inc., on behalf of the international Gemini partnership of Argentina, Brazil, Canada, Chile, and the United States of America. SRA thanks the support by the FONDECYT Iniciación project No. 11171025 and the CONICYT + PAI “Concurso Nacional Inserción de Capital Humano Avanzado en la Academia 2017” project PAI 79170089. J.A-G. also acknowledges support by FONDECYT Iniciación 11150916. MH acknowledges support by the BASAL Center for Astrophysics and Associated Technologies (CATA) through grant PFB-06. We thank anonymous referee for useful comments and suggestions.
References
- Alonso-García et al. (2017) Alonso-García J., et al., 2017, ApJ, 849, L13
- Astraatmadja & Bailer-Jones (2016) Astraatmadja, T. L., & Bailer-Jones, C. A. L. 2016, ApJ, 832, 137
- Bailer-Jones (2015) Bailer-Jones, C. A. L. 2015, PASP, 127, 994
- Barbá el al. (2015) Barbá, R., Roman-Lopes, A., Nilo Castellón, J.L., el al. 2015, A&A, 581,120;
- Benjamin et al. (2003) Benjamin, R. A., Churchwell, E., Babler, B. L., et al. 2003, PASP, 115, 953
- Bica at al. (2003) Bica E., Dutra, C.M., Soares, J., at al. 2003, A&A, 404, 223;
- Borissova et al. (2003) Borissova J., Pessev, P., Ivanov, V.D., et al. 2003, A&A, 411, 83
- Borissova et al. (2011) Borissova, J., Bonatto, C., Kurtev, R., et al. 2011, A&A, 532, 131;
- Borissova et al. (2014) Borissova, J., Chené, A.-N., Ramírez Alegría, S., et al. 2014, A&A, 569, 24;
- Borissova et al. (2016) Borissova, J., Ramírez Alegría, S., Alonso, J., et al. 2016, AJ, 152, 74
- Bressan et al. (2012) Bressan A., Marigo P., Girardi L., Salasnich B., Dal Cero C., Rubele S., Nanni A., 2012, MNRAS, 427, 127
- Camargo, Bica, & Bonatto (2016) Camargo D., Bica E., Bonatto C., 2016, A&A, 593, A95
- Chené et al. (2012) Chené, A.-N., Borissova, J., Clarke, J. R. A., et al. 2012, A&A, 545, A54
- Chené et al. (2013) Chené, A.-N., Borissova, J., Bonatto, C., et al. 2013, A&A, 549, 98
- Chené et al. (2015) Chené, A.-N., Ramírez Alegría, S., Borissova, J., et al. 2015, A&A, 584, 31
- Cross et al. (2012) Cross, N. J. G., Collins, R. S., Mann, R. G., et al. 2012, A&A, 548, A119
- Dalton et al. (2006) Dalton, G. B., Caldwell, M., Ward, A. K., et al. 2006, in SPIE Conf. Ser., 6269, 30
- Dias et al. (2002) Dias, W.S., Alessi, B.S., Moitinho, A., et al. 2002, A&A 389, 871
- Emerson, McPherson & Sutherland (2006) Emerson, J., McPherson, A., & Sutherland, W. 2006, The Messenger, 126, 41
- Emerson et al. (2004) Emerson, J. P., Irwin, M. J., Lewis, J., et al. 2004, in SPIE Conf. Ser., 5493, 401
- Froebrich et al. (2017) Froebrich el al. 2017, MNRAS, 469, 1545
- Frogel et al. (2001) Frogel, J. A., Stephens, A., Ramírez, S., & DePoy, D. L. 2001, AJ, 122, 1896
- Gaia Collaboration et al. (2016) Gaia Collaboration, Prusti, T., de Bruijne, J. H. J., et al. 2016, A&A, 595, A1
- Gaia Collaboration et al. (2018) Gaia Collaboration, Brown, A. G. A., Vallenari, A., et al. 2018, ArXiv e-prints, arXiv:1804.09365
- Gaia Collaboration et al. (2018b) Gaia Collaboration, Helmi, A., van Leeuwen, F., et al. 2018, arXiv:1804.09381
- Hervé et al. (2016) Hervé A., Martins F., Chené A.-N., Bouret J.-C., Borissova J., 2016, NewA, 45, 84
- Irwin et al. (2004) Irwin, M. J., Lewis, J., Hodgkin, S., et al. 2004, in SPIE Conf. Ser., 5493, 411
- Ivanov et al. (2002) Ivanov, V.D., Borissova, J., Pessev, P., et al. 2002, A&A, 394, L1
- Ivanov et al. (2005) Ivanov, V. D., Kurtev, R., Borissova, J. 2005, A&A, 442, 195
- Ivanov et al. (2017) Ivanov, V.D., Piatti, A.E., Beamín, J.C., et al. 2017, A&A 600, 112;
- Kharchenko et al. (2013) Kharchenko, N.V., Piskunov, A.E., Schilbach, E., et al. 2013, A&A, 558, 53
- Lindegren et al. (2018) Lindegren, L., Hernandez, J., Bombrun, A., et al. 2018, arXiv:1804.09366
- Lucas et al. (2008) Lucas, P. W., Hoare, M. G., Longmore, A., et al. 2008, MNRAS, 391, 136
- Lucas et al. (2018) Lucas, P. W. et al. (2018, in preparation)
- Luri et al. (2018) Luri X., et al., 2018, A&A in press, arXiv, arXiv:1804.09376
- Mercer et al. (2005) Mercer, E.P., Clemens, D.P., Meade, M.R., et al. 2005, ApJ, 635, 560
- Minniti et al. (2010) Minniti, D., Lucas, P.W., Emerson, J.P., et al. 2010, NewA, 15, 433
- Minniti et al. (2011) Minniti, D., Saito, R.K., Alonso-García, J., et al. 2011, A&A, 527, 81
- Minniti et al. (2017a) Minniti, D., Geisler, D., Alonso-García, J., et al. 2017a, ApJ, 849, 24
- Minniti et al. (2017b) Minniti, D., Alonso-García, J., Braga, V., et al. 2017b, RNAAS, 1, 16
- Minniti et al. (2017c) Minniti, D., Alonso-García, J., Pullen, J. 2017c, RNAAS, 1, 54
- Medina et al. (2018) Medina N., Borissova, J. et al., 2018, ApJ, 864, 11
- Moni Bidin et al. (2011) Moni-Bidin, C., Mauro, F., Geisler, D., et al. 2011, A&A, 535, 33
- Morales et al. (2013) Morales, E.F.E., Wyrowski, F., Schuller, F., et al. 2013, A&A, 560, 76
- Navarro Molina et al. (2016) Navarro Molina, C., Borissova, J., Catelan, M., et al. 2016, MNRAS, 462, 1180
- Pfalzner et al. (2016) Pfalzner, S., Kirk, H., Sills, A., et al. 2016, A&A, 586, 68
- Portegies Zwart et al. (2010) Portegies Zwart, S.F., McMillan, S.L.W., Gieles, M. 2010, ARA&A, 48, 431
- Ramírez Alegría et al. (2014) Ramírez Alegría, S., Borissova, J., Chené, A.-N., et al. 2014, A&A, 564, 9
- Ryu & Lee (2018) Ryu J., Lee M. G., 2018, ApJ, 856, 152
- Saito et al. (2012) Saito, R.K., Hempel, M., Minniti, D., et al. 2012, A&A, 537, 107
- Schmeja et al. (2014) Schmeja, S., Kharchenko, N.V., Piskunov, A.E., et al. 2014, A&A, 568, 51
- Skrutskie et al. (2006) Skrutskie, M.F., Cutri, R.M., Stiening, R., et al. 2006, AJ, 131, 1163
- Solin et al. (2012) Solin, O., Ukkonen, E., Haikala, L. 2012 A&A, 542, 3
- Solin et al. (2014) Solin, O., Haikala, L., Ukkonen, E. 2014, A&A, 562, 115
- Stanghellini et al. (2008) Stanghellini, L., Shaw, R. A., & Villaver, E. 2008, ApJ, 689, 194
- Straizys & Kuriliene (1981) Straizys, V., & Kuriliene, G. 1981, Ap&SS, 80, 353
- Wright et al. (2010) Wright, E.L., Eisenhardt, P.R.M., Mainzer, A.K., et al. 2010, AJ, 140, 1868
- Zasowski et al. (2013) Zasowski, G., Beaton, R. L., Hamm, K. K., et al. 2013, AJ, 146, 64
Appendix A VVVX Cluster Candidates: Catalog
In Table 2 are tabulated 120 new candidate star clusters or stellar groups. The first column gives the identification, followed by the equatorial coordinates of the center determined by eye, eye-ball measured apparent cluster radius in arcsec, the name of the corresponding VVVX tile and some comments about the nature of the object.
| Name | Radius | VVVX tile | Comments | ||
|---|---|---|---|---|---|
| ∘ | ∘ | arcsec | |||
| VVVX CL001 | 180.380770 | -65.137202 | 18 | e0730 | very faint, embedded group of stars |
| VVVX CL002 | 180.397080 | -65.126113 | 20 | e0730 | very faint, embedded group of stars |
| VVVX CL003 | 184.276940 | -60.220145 | 29 | e0814 | small open cluster |
| VVVX CL004 | 184.307420 | -60.303649 | 55 | e0814 | open cluster |
| VVVX CL005 | 184.324520 | -60.242285 | 45 | e0814 | small reddened open cluster |
| VVVX CL006 | 185.437370 | -65.356478 | 55 | e0732 | O9 star+group of bright stars |
| VVVX CL007 | 187.473880 | -60.114671 | 120 | e0815 | open cluster |
| VVVX CL008 | 190.768300 | -60.437844 | 34 | e0816 | faint, embedded group of stars |
| VVVX CL009 | 191.765130 | -60.072564 | 66 | e0816 | several bright stars, open cluster, IRAS 12441-5947 |
| VVVX CL010 | 192.658350 | -64.916684 | 38 | e0734 | concentrated open cluster? |
| VVVX CL011 | 192.800920 | -60.592911 | 55 | e0817 | several bright stars, open cluster |
| VVVX CL012 | 196.764630 | -59.841214 | 62 | e0818 | several bright stars, open cluster |
| VVVX CL013 | 198.576150 | -65.840076 | 50 | e0735 | several bright stars, open cluster |
| VVVX CL014 | 202.949120 | -64.935656 | 55 | e0737 | open cluster |
| VVVX CL015 | 203.442400 | -59.141331 | 31 | e0821 | several bright stars, open cluster |
| VVVX CL016 | 207.530690 | -65.007603 | 12 | e0738 | very faint, weak nebula, group of stars |
| VVVX CL017 | 208.820520 | -65.056893 | 66 | e0738 | open cluster |
| VVVX CL018 | 211.590200 | -64.731412 | 23 | e0739 | small group, dissolved? |
| VVVX CL019 | 217.911420 | -58.051811 | 145 | e0826 | open cluster |
| VVVX CL020 | 218.723750 | -63.222653 | 36 | e0742 | open cluster |
| VVVX CL021 | 218.823650 | -57.981169 | 40 | e0826 | several bright stars, open cluster |
| VVVX CL022 | 219.642140 | -57.257272 | 80 | e0826 | open cluster |
| VVVX CL023 | 220.166310 | -57.441524 | 105 | e0827 | open cluster |
| VVVX CL024 | 224.245480 | -61.592499 | 28 | e0744 | open cluster |
| VVVX CL025 | 234.033390 | -52.575296 | 59 | e0833 | open cluster |
| VVVX CL026 | 234.949620 | -59.136058 | 68 | e0748 | B8Ib+group |
| VVVX CL027 | 237.487450 | -57.608643 | 70 | e0749 | group of stars |
| VVVX CL028 | 237.510440 | -51.179911 | 85 | e0835 | open cluster |
| VVVX CL029 | 238.130460 | -50.768071 | 125 | e0835 | open cluster |
| VVVX CL030 | 238.709700 | -56.558402 | 67 | e0750 | open cluster |
| VVVX CL031 | 238.944100 | -56.279803 | 140 | e0750 | OB star+group of stars |
| VVVX CL032 | 239.836430 | -56.233403 | 51 | e0750 | B9 star + group of stars |
| VVVX CL033 | 240.062400 | -49.524395 | 13 | e0836 | faint, weak nebula, group of stars, 2MASX J16001524-4931255 |
| VVVX CL034 | 240.695290 | -56.720018 | 37 | e0750 | open cluster |
| VVVX CL035 | 241.357520 | -48.991222 | 38 | e0837 | very red group of stars, radio source [CAB2011] G332.40+2.46 |
| VVVX CL036 | 241.423240 | -49.191992 | 17 | e0837 | embedded group+ Maser: Caswell OH 332.295+02.280?+YSO: 2MASS J16054183-4911294 |
| VVVX CL037 | 242.630320 | -54.937447 | 8 | e0752 | embedded faint group + YSO [MHL2007] G328.9716-02.4664 1 |
| VVVX CL038 | 242.670130 | -54.961111 | 21 | e0752 | group in H ii region: WRAY 16-205 |
| VVVX CL039 | 243.306690 | -54.287039 | 22 | e0752 | open cluster, concentrated |
| VVVX CL040 | 246.636880 | -52.874636 | 60 | e0754 | compact group of 2MASS variable stars |
| VVVX CL041 | 247.898680 | -44.174854 | 33 | e0841 | open cluster |
| VVVX CL042 | 248.132730 | -44.924463 | 64 | e0841 | embedded +Variable Star of FU Ori type: V* V346 Nor |
| VVVX CL043 | 250.190380 | -43.120268 | 89 | e0843 | open cluster |
| VVVX CL044 | 250.562580 | -49.889192 | 72 | e0756 | open cluster |
VVVX Cluster Candidates: Catalog Name Radius VVVX tile Comments ∘ ∘ arcsec VVVX CL045 250.705140 -50.061132 75 e0756 open cluster VVVX CL046 250.706130 -49.467184 50 e0757 GC? VVVX CL047 251.500630 -41.766043 59 e0844 open cluster VVVX CL048 251.723100 -41.233356 10 e0844 small group in cloud: MSX6C G343.0500+02.6094 VVVX CL049 251.860180 -41.244139 15 e0844 group around Emission-line Star: [OSP2002] BRC 82 11 VVVX CL050 252.328640 -48.592074 17 e0758 concentrated group around Object of unknown nature: XZLJ Nor 111 VVVX CL051 253.042590 -40.065037 81 e0845 open cluster VVVX CL052 253.294640 -39.836432 31 e0846 open cluster VVVX CL053 255.785070 -37.520748 43 e0848 open cluster VVVX CL054 257.723300 -43.705101 30 e0762 embedded group VVVX CL055 259.483430 -42.657861 38 e0763 open cluster VVVX CL056 259.499020 -42.094804 86 e0764 open cluster VVVX CL057 259.780310 -41.405093 12 e0764 concentrated group VVVX CL058 262.414960 -39.466213 94 e0766 open cluster VVVX CL059 262.844920 -38.469595 100 e0766 open cluster VVVX CL060 268.852770 -18.000075 55 e0982 open cluster VVVX CL061 269.430960 -18.542233 31 e0975 group of stars in Interstellar matter: [GMG2004] 85 VVVX CL062 270.094130 -18.869869 18 e0975 embedded cluster? Too big to be single YSO: [MJR2015] 113 VVVX CL063 270.144320 -18.754833 29 e0975 group in H ii region: MSX6C G010.5067+02.2285 VVVX CL064 270.249460 -17.749453 69 e0975 open cluster VVVX CL065 270.369110 -17.946281 65 e0975 open cluster VVVX CL066 271.856700 -20.028048 36 e0961 open cluster VVVX CL067 272.318750 -20.312052 47 e0954 young cluster part of W31? VVVX CL068 272.405310 -20.320490 21 e0954 small group in Bubble [CWP2007] CN 145 VVVX CL069 272.436630 -20.336289 53 e0954 group in H ii region: [L89b] 10.190-00.426 VVVX CL070 272.482890 -19.806053 24 e0954 group in Bubble: [SPK2012] MWP1G010670-002100S VVVX CL071 272.579460 -19.902798 22 e0954 small group in H ii region: [AAJ2015] G010.630-00.338 VVVX CL072 272.678330 -19.942037 14 e0954 group in H ii region: HRDS G010.638-00.434 VVVX CL073 272.713320 -17.931154 28 e0962 group in H ii region: GAL 012.42+00.50 VVVX CL074 272.884650 -19.510605 28 e0954 small group around YSO: IRAS 18085-1931 VVVX CL075 272.971860 -18.605660 10 e0955 small group in H ii region: [KC97c] G011.9+00.0 VVVX CL076 273.354540 -18.092123 17 e0955 concentrated group VVVX CL077 273.396040 -18.096607 53 e0955 concentrated group close to CL076+WR, binary cluster? VVVX CL078 273.504900 -18.891444 22 e0955 young cluster in H ii region GRS G011.94 -00.62 VVVX CL079 273.510870 -17.758839 20 e0955 group in Bubble: [SPK2012] MWP1G012930-000811 VVVX CL080 273.527110 -17.934716 19 e0955 small group around B0V star [MCF2015] 13, neb, concentrated VVVX CL081 273.587430 -12.742477 20 e0973 small group around YSO: MSX6C G017.3765+02.2512 VVVX CL082 273.601520 -17.293137 18 e0956 group in Bubble: [SPK2012] MWP1G013382+000659 VVVX CL083 273.955800 -19.703903 23 e0947 small very red group, neb. VVVX CL084 274.006270 -16.085923 15 e0964 neb, IR: IRAS 18131-1606 VVVX CL085 274.006350 -16.085481 17 e0964 group of stars, neb., IR source VVVX CL086 274.040020 -13.755454 49 e0972 open cluster VVVX CL087 274.111360 -16.913282 35 e0956 open cluster VVVX CL088 274.208750 -19.889306 10 e0947 small group around YSO: MSX6C G011.3757-01.6770
VVVX Cluster Candidates: Catalog Name Radius VVVX tile Comments ∘ ∘ arcsec VVVX CL089 274.247920 -16.999377 48 e0956 open cluster VVVX CL090 274.312720 -18.954494 132 e0948 open cluster VVVX CL091 274.342440 -16.999377 25 e0956 young cluster or dust window VVVX CL092 274.361490 -17.092749 10 e0956 embedded group around YSO:[PW2010] 48 VVVX CL093 274.461220 -16.999192 10 e0956 embedded, compact group in H ii region: MSX6C G014.0329-00.5155 VVVX CL094 274.477580 -11.725361 13 e0973 second small group of stars close to BDS9, sub-cluster? VVVX CL095 274.481180 -16.975518 10 e0956 small group around YSO: SSTGLMA G014.0632-00.5199 VVVX CL096 274.492270 -12.123610 16 e0973 small group around YSO: IRAS 18151-1208 VVVX CL097 274.561750 -16.851552 34 e0956 neb, YSOs, bubbles, IR VVVX CL098 274.696620 -15.814823 20 e0957 group in H ii region: IRAS 18159-1550 VVVX CL099 274.709510 -13.815189 15 e0965 small group in H ii region: MSX6C G016.9512+00.7806, close to M16, sub-cluster? VVVX CL100 274.717510 -13.859019 16 e0965 4 bright stars, very compact, part of M16, RSG? VVVX CL101 274.827630 -13.794123 78 e0965 group in M16 (NGC6611) region, sub-cluster? VVVX CL102 274.916667 -13.362500 11 e0966 group in H ii region: MSX6C G017.4507+00.8118 VVVX CL103 274.923010 -21.059604 32 e0940 group VVVX CL104 275.026400 -15.778958 10 e0957 small group in H ii region: [SPE2008b] IRAS 18171-1548 VLA 1 VVVX CL105 275.147920 -14.070781 13 e0965 embedded source in H ii region: MSX6C G016.9261+00.2854 VVVX CL106 275.230480 -14.258462 10 e0965 small group around YSO: 2MASS J18205529-1415306 VVVX CL107 275.250670 -18.696785 48 e0948 open cluster VVVX CL108 275.611970 -13.504312 45 e0966 young cluster in SFR: RAFGL 2136 VVVX CL109 276.228570 -13.120082 35 e0950 GC? VVVX CL110 276.294290 -12.704624 18 e0959 small group in H ii region: [ABB2014] WISE G018.657-00.057 VVVX CL111 276.365960 -12.853166 77 e0959 open cluster VVVX CL112 276.389290 -11.588813 20 e0967 open cluster VVVX CL113 276.427310 -13.172107 52 e0950 group in H ii region: [CKW87] 182253.2-131203 VVVX CL114 276.451510 -13.108666 11 e0959 small group around YSO: IRAS 18229-1308 VVVX CL115 276.594240 -11.202625 20 e0967 group around emission line stars: LS IV -11 19 VVVX CL116 276.738040 -11.535798 10 e0967 compact group around YSO: IRAS 18241-1134 VVVX CL117 276.910160 -11.945382 12 e0960 compact group in H ii region: [WBH2005] G019.608-0.237 VVVX CL118 277.149220 -12.407517 10 e0960 compact group in H ii region: IRAS 18257-1226 VVVX CL119 277.312510 -11.839633 10 e0960 group in H ii region: MSX6C G019.8817-00.5347 VVVX CL120 277.511290 -12.257561 20 e0960 group in bubble: [SPK2012] MWP1G019605-009038
Appendix B VVVX Cluster Candidates: Parameters.
In Table 5 are tabulated the candidate star clusters with reliable Gaia DR2 parameters. The first column gives the identification, followed by the equatorial coordinates of the center, median proper motion and parallax, as well as the calculated distance and radial velocity, with corresponding errors.
| Name | Err | Err | Err | Dis | Dis 5% | Dis 95% | RV | Err RV | E(BP-RP) | Err E(BP-RP) | |||||
|---|---|---|---|---|---|---|---|---|---|---|---|---|---|---|---|
| ∘ | ∘ | mas | mas | mas | mas | mas | mas | kpc | kpc | kpc | km s-1 | km s-1 | mag | mag | |
| VVVX CL003 | 184.276940 | -60.220145 | -6.2048 | 4.0251 | -0.3767 | 3.2011 | 0.4006 | 0.2471 | 1568 | 1142 | 2838 | -35.24 | 3.26 | 0.63 | 0.40 |
| VVVX CL004 | 184.307420 | -60.303649 | -5.8743 | 1.5290 | 0.6543 | 0.8239 | 0.2025 | 0.0713 | 3166 | 2543 | 4465 | -27.99 | 6.44 | 0.80 | 0.21 |
| VVVX CL005 | 184.324520 | -60.242285 | -9.3827 | 3.2809 | 0.0499 | 2.2410 | 0.4337 | 0.1749 | 1710 | 1299 | 2855 | 0.78 | 0.43 | ||
| VVVX CL006 | 185.437370 | -65.356478 | -5.1240 | 2.3100 | -0.0600 | 1.1000 | 0.3605 | 0.0772 | 2346 | 1921 | 3266 | -34.39 | 0.52 | 0.64 | 0.40 |
| VVVX CL007 | 187.473880 | -60.114671 | -7.1671 | 3.2500 | 0.2260 | 0.7475 | 0.1850 | 0.0530 | 3670 | 3010 | 4958 | -30.71 | 19.12 | 0.82 | 0.26 |
| VVVX CL009 | 191.765130 | -60.072564 | -6.1444 | 1.7354 | -0.0144 | 1.6379 | 0.5445 | 0.2224 | 1439 | 1077 | 2555 | -4.85 | 2.20 | 0.98 | 0.63 |
| VVVX CL010 | 192.658350 | -64.916684 | -7.2231 | 1.2559 | -0.3623 | 0.5297 | 0.2183 | 0.0534 | 3409 | 2811 | 4584 | 0.65 | 0.36 | ||
| VVVX CL011 | 192.800920 | -60.592911 | -8.9430 | 3.5489 | -1.4580 | 1.3995 | 0.4141 | 0.0683 | 2186 | 1832 | 2907 | -36.81 | 18.53 | 0.63 | 0.38 |
| VVVX CL012 | 196.764630 | -59.841214 | -7.0325 | 2.3901 | -0.4942 | 1.2560 | 0.2470 | 0.0646 | 3024 | 2466 | 4174 | 59.38 | 34.84 | 1.01 | 0.21 |
| VVVX CL013 | 198.576150 | -65.840076 | -6.6136 | 1.1734 | -0.8688 | 1.1200 | 0.1952 | 0.0303 | 4257 | 3656 | 5297 | 0.63 | 0.13 | ||
| VVVX CL014 | 202.949120 | -64.935656 | -6.2479 | 1.4922 | -1.3088 | 0.8171 | 0.2526 | 0.1972 | 1933 | 1425 | 3282 | 0.79 | 0.18 | ||
| VVVX CL015 | 203.442400 | -59.141331 | -6.2920 | 1.0532 | -1.7710 | 0.8923 | 0.2979 | 0.0193 | 3260 | 2980 | 3651 | -21.63 | 3.85 | 0.75 | 0.20 |
| VVVX CL017 | 208.820520 | -65.056893 | -6.1841 | 1.5941 | -1.9572 | 1.0552 | 0.2501 | 0.0589 | 3092 | 2544 | 4199 | 95.32 | 1.10 | 0.69 | 0.21 |
| VVVX CL018 | 211.590200 | -64.731412 | -5.6120 | 1.6243 | -3.0585 | 1.9840 | 0.2964 | 0.0315 | 3143 | 2763 | 3768 | -29.33 | 0.89 | 0.64 | 0.06 |
| VVVX CL019 | 217.911420 | -58.051811 | -6.0215 | 1.1670 | -2.9814 | 1.4978 | 0.2657 | 0.0456 | 3195 | 2697 | 4131 | 1.25 | 0.39 | ||
| VVVX CL020 | 218.723750 | -63.222653 | -6.2019 | 1.0804 | -2.1719 | 2.6371 | 0.9905 | 1.1153 | 795 | 480 | 2224 | 1.07 | 0.16 | ||
| VVVX CL021 | 218.823650 | -57.981169 | -6.1757 | 1.4781 | -3.3479 | 1.7196 | 0.3039 | 0.0834 | 2527 | 2034 | 3621 | 1.35 | 0.11 | ||
| VVVX CL022 | 219.642140 | -57.257272 | -6.0517 | 1.5384 | -2.4212 | 1.4175 | 0.8489 | 0.0980 | 1158 | 998 | 1458 | -41.37 | 32.49 | 1.12 | 0.22 |
| VVVX CL023 | 220.166310 | -57.441524 | -5.9583 | 2.1346 | -2.8311 | 1.3637 | 0.3710 | 0.1483 | 1925 | 1477 | 3096 | -21.68 | 10.59 | 1.15 | 0.25 |
| VVVX CL024 | 224.245480 | -61.592499 | -5.4323 | 1.1612 | -3.0226 | 1.4221 | 0.2279 | 0.0997 | 2660 | 2083 | 3962 | 0.87 | 0.21 | ||
| VVVX CL025 | 234.033390 | -52.575296 | -4.7031 | 2.5805 | -3.3457 | 2.6372 | 0.1983 | 0.0446 | 3781 | 3151 | 4969 | 0.94 | 0.17 | ||
| VVVX CL026 | 234.949620 | -59.136058 | -4.8548 | 1.7112 | -4.0185 | 0.9792 | 0.4375 | 0.3185 | 1394 | 989 | 2693 | 8.72 | 0.34 | 0.97 | 0.38 |
| VVVX CL027 | 237.487450 | -57.608643 | -4.7041 | 1.3876 | -3.9946 | 1.3720 | 0.2847 | 0.1872 | 1923 | 1428 | 3240 | -62.72 | 13.12 | 0.94 | 0.24 |
| VVVX CL028 | 237.510440 | -51.179911 | -5.3555 | 1.3411 | -3.7328 | 1.7328 | -64.80 | 1.58 | 1.11 | 0.38 | |||||
| VVVX CL029 | 238.130460 | -50.768071 | -5.5530 | 2.2960 | -3.5770 | 1.8099 | 0.3526 | 0.1424 | 1993 | 1532 | 3176 | 1.37 | 0.07 | ||
| VVVX CL030 | 238.709700 | -56.558402 | -4.7720 | 1.3078 | -4.0830 | 1.3743 | 0.2294 | 0.1996 | 1960 | 1441 | 3328 | -87.11 | 6.31 | 0.87 | 0.26 |
| VVVX CL031 | 238.944100 | -56.279803 | -4.7880 | 1.2216 | -4.1505 | 1.1470 | 0.3110 | 0.0526 | 2798 | 2356 | 3655 | -49.13 | 0.27 | 0.98 | 0.20 |
| VVVX CL032 | 239.836430 | -56.233403 | -4.3580 | 1.5724 | -4.2170 | 1.3106 | 0.3185 | 0.1039 | 2309 | 1823 | 3451 | -38.27 | 23.88 | 0.99 | 0.32 |
| VVVX CL034 | 240.695290 | -56.720018 | -4.2690 | 2.2917 | -4.0300 | 1.6007 | 0.2762 | 0.0611 | 2903 | 2393 | 3944 | -95.56 | 23.94 | 0.93 | 0.03 |
| VVVX CL038 | 242.670130 | -54.961111 | -5.1820 | 1.5626 | -4.6810 | 2.4419 | 0.2286 | 0.1289 | 2385 | 1827 | 3720 | 0.72 | 0.08 | ||
| VVVX CL039 | 243.306690 | -54.287039 | -4.2715 | 1.6418 | -4.3275 | 2.0885 | 0.4372 | 0.1931 | 1653 | 1242 | 2827 | ||||
| VVVX CL040 | 246.636880 | -52.874636 | -3.8840 | 1.9633 | -3.8520 | 2.0800 | -48.65 | 3.54 | 1.12 | 0.29 | |||||
| VVVX CL043 | 250.190380 | -43.120268 | -3.2785 | 2.7690 | -3.7650 | 1.6912 | -59.46 | 0.24 | 1.43 | 0.28 | |||||
| VVVX CL044 | 250.562580 | -49.889192 | -4.3970 | 1.2967 | -5.0395 | 1.2528 | 1.24 | 0.10 | |||||||
| VVVX CL045 | 250.705140 | -50.061132 | -3.0395 | 2.4861 | -4.1620 | 2.5077 | 0.5739 | 0.1870 | 1460 | 1120 | 2462 | 1.46 | 0.01 | ||
| VVVX CL046 | 250.706130 | -49.467184 | -3.3370 | 1.5034 | -4.4080 | 1.1117 | 1.45 | 0.14 | |||||||
| VVVX CL047 | 251.500630 | -41.766043 | -3.8320 | 1.9812 | -4.7850 | 2.1367 | 0.2699 | 0.0540 | 3038 | 2529 | 4043 | -111.89 | 0.51 | 1.23 | 0.28 |
| VVVX CL049 | 251.860180 | -41.244139 | -3.7890 | 1.4063 | -1.7590 | 2.4079 | 1.1548 | 1.0419 | 765 | 471 | 2173 | 0.93 | 0.10 | ||
| VVVX CL050 | 252.328640 | -48.592074 | -3.3730 | 0.9842 | -4.3005 | 2.4106 | 0.3585 | 0.4223 | 1309 | 894 | 2680 | 1.25 | 0.14 | ||
| VVVX CL051 | 253.042590 | -40.065037 | -3.9830 | 1.8397 | -3.9330 | 2.1836 | -87.12 | 24.18 | 1.23 | 0.31 |
VVVX Cluster Candidates: Parameters Name Err Err Err Dis Dis 5% Dis 95% RV Err RV E(BP-RP) Err E(BP-RP) ∘ ∘ mas mas mas mas mas mas kpc kpc kpc km s-1 km s-1 mag mag VVVX CL052 253.294640 -39.836432 -2.5690 2.2240 -4.7870 1.7466 0.4713 0.0485 2042 1791 2468 1.44 0.03 VVVX CL053 255.785070 -37.520748 -3.5670 1.5156 -4.1120 2.0580 -118.28 4.16 1.32 0.14 VVVX CL055 259.483430 -42.657861 -1.9610 2.2399 -3.0390 2.1161 1.41 0.10 VVVX CL056 259.499020 -42.094804 -1.0270 1.4837 -3.1790 2.0557 0.2695 0.0773 2740 2209 3891 -21.96 6.59 1.30 0.19 VVVX CL057 259.780310 -41.405093 -2.6640 1.5039 -5.0680 1.8897 0.7533 0.0419 1320 1217 2811 VVVX CL058 262.414960 -39.466213 -2.1975 1.7054 -4.7495 1.9031 0.4497 0.1134 1882 1503 2810 1.33 0.39 VVVX CL059 262.844920 -38.469595 -3.3055 2.2459 -6.0655 1.4374 1.22 0.29 VVVX CL060 268.852770 -18.000075 -2.3860 2.0186 -4.9815 1.5989 0.2806 0.1362 2198 1684 3471 1.08 0.17 VVVX CL064 270.249460 -17.749453 -2.4080 2.8298 -5.1290 3.4491 1.15 0.35 VVVX CL065 270.369110 -17.946281 -3.0780 1.5112 -6.1625 1.4636 1.32 0.27 VVVX CL066 271.856700 -20.028048 -2.7450 0.3543 -7.7680 2.9813 VVVX CL076 273.354540 -18.092123 -0.2315 1.1797 -1.1350 1.0050 0.7011 0.3490 1141 819 2322 1.43 0.26 VVVX CL077 273.396040 -18.096607 -1.1500 0.5148 -0.8470 0.4311 1.36 0.10 VVVX CL080 273.527110 -17.934716 -0.1565 1.4374 -3.1130 3.6308 0.5336 0.4174 1201 829 2514 0.97 0.21 VVVX CL086 274.040020 -13.755454 -2.3780 2.5917 -3.1320 4.0305 0.5628 0.0620 1718 1494 2116 1.35 0.10 VVVX CL089 274.247920 -16.999377 0.5210 1.8414 -1.7870 3.3595 0.6742 0.2940 1210 886 2335 1.05 0.53 VVVX CL102 274.916667 -13.362500 1.47 0.10 VVVX CL103 274.923010 -21.059604 -3.1400 3.2674 -1.0220 3.3342 0.8086 0.1970 1154 907 1894 VVVX CL107 275.250670 -18.696785 -2.0890 2.2319 -4.0075 1.9944 1.09 0.13 VVVX CL111 276.365960 -12.853166 -3.0080 1.4469 -5.4595 2.9577 VVVX CL112 276.389290 -11.588813 -1.7930 1.4948 -3.0460 2.3819 0.3824 0.2343 1621 1186 2895 1.45 0.31
Appendix C Composite color images of VVVX open cluster candidates
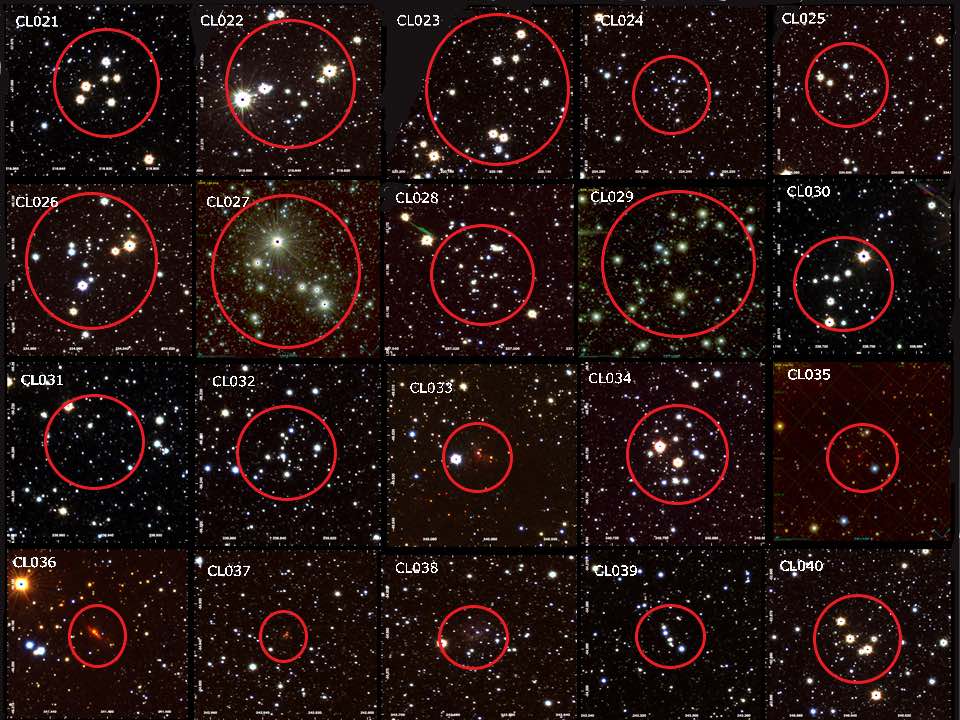
Figure 9 shows the composite color images of VVVX open cluster candidates. The field of view is 2.5 2.5 arcmin, north is up, east to the left (unless specified in the image). The clusters are shown in order corresponding of the Table A1. The red large circles indicate the cluster candidate approximated boundaries and are given to assist the reader to easy identification.
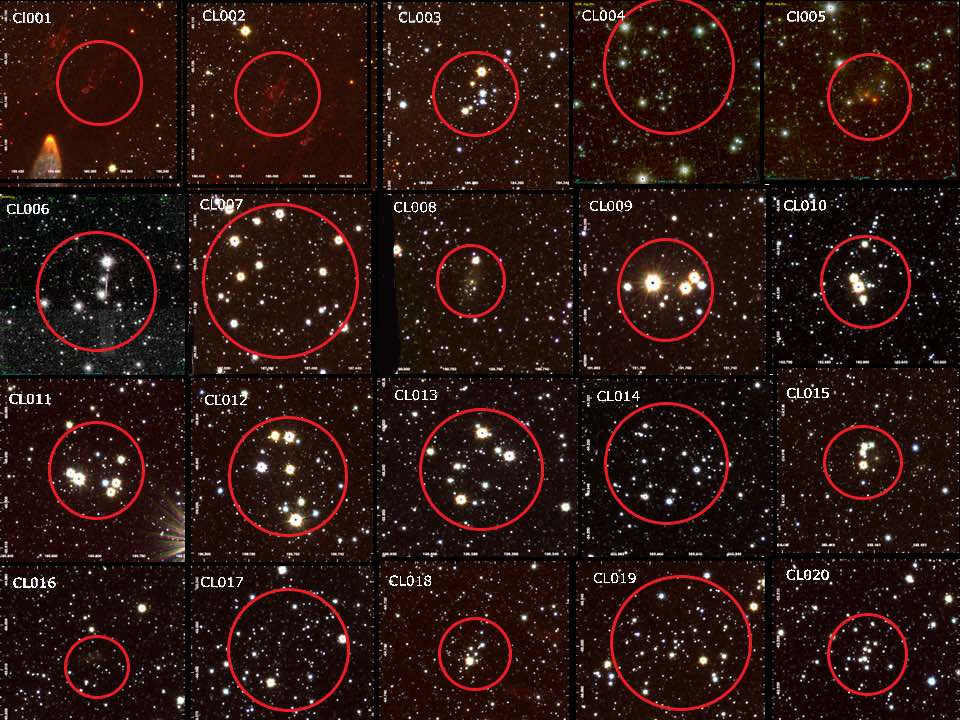
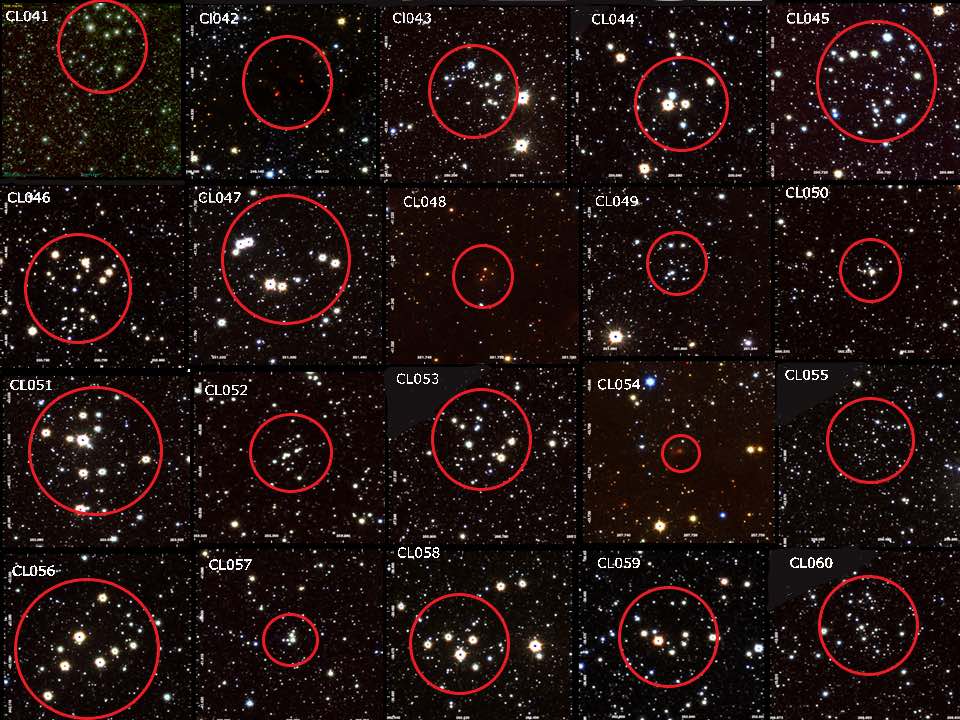
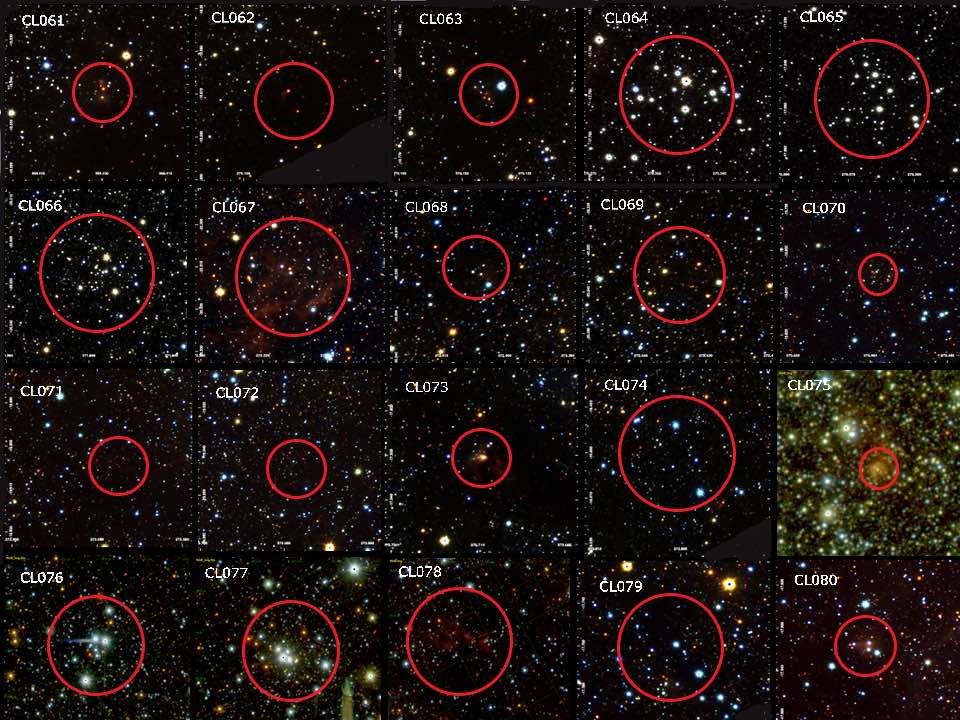
VVVX composite color images of the open cluster candidates.
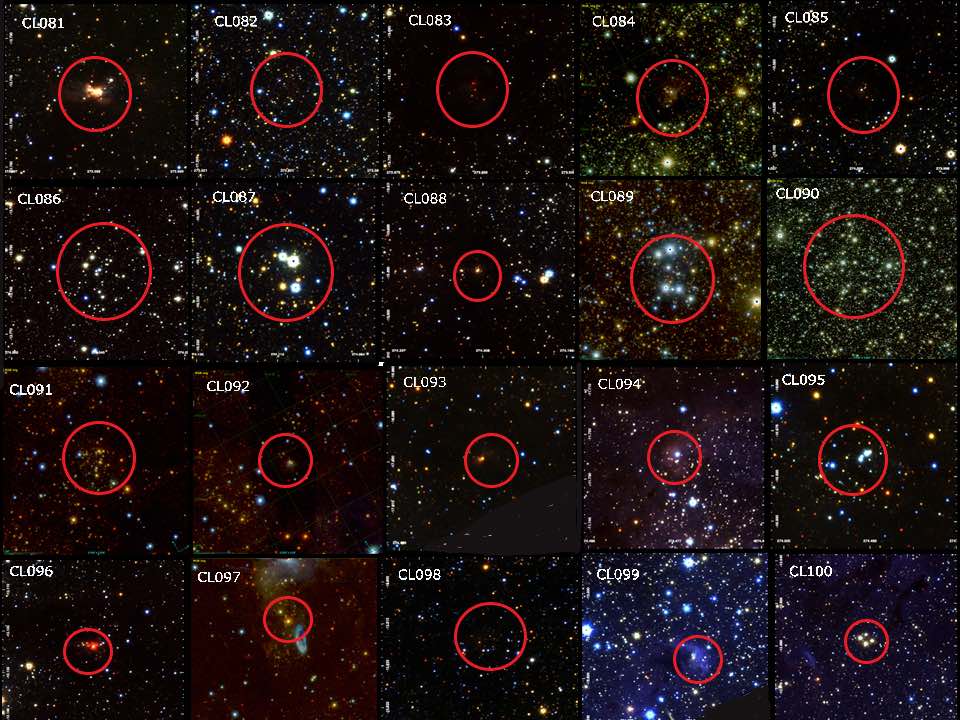
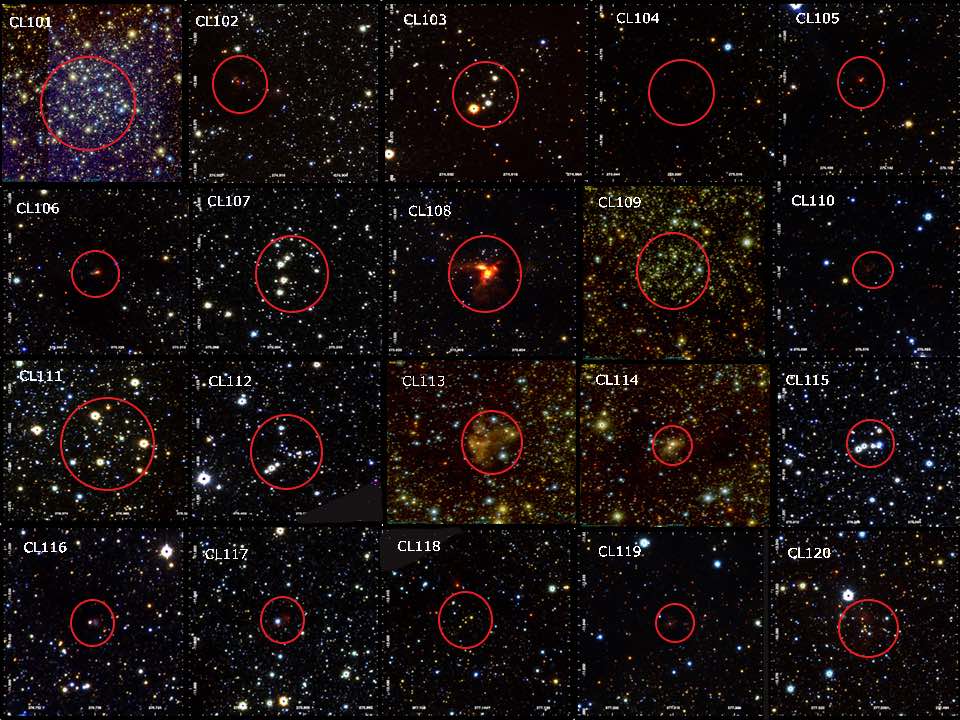
VVVX composite color images of the open cluster candidates.
Appendix D Color magnitude diagrams of some of the VVVX open cluster candidates.
The color magnitude diagrams of some of the new open cluster candidates are plotted in Fig. 12.


VVVX vs color-magnitude diagrams of the new open cluster candidates.

VVVX vs color-magnitude diagrams of the new open cluster candidates.