SMA line observations of the CH3OH-maser outflow in DR21(OH)
Abstract
We present a (sub)millimeter line survey of the methanol maser outflow located in the massive star-forming region DR21(OH) carried out with the Submillimeter Array (SMA) at 217/227 GHz and 337/347 GHz. We find transitions from several molecules towards the maser outflow such as CH3OH, H2CS, C17O, H13CO+ and C34S. However, with the present observations, we cannot discard the possibility that some of the observed species such as C17O, C34S, and H2CS, might be instead associated with the compact and dusty continuum sources located in the MM2 region. Given that most of transitions correspond to methanol lines, we have computed a rotational diagram with CASSIS and a LTE synthetic spectra with XCLASS for the detected methanol lines in order to estimate the rotational temperature and column density in small solid angle of the outflow where enough lines are present. We obtain a rotational temperature of K and a column density of cm-2. These values are comparable to those column densities/rotational temperatures reported in outflows emanating from low-mass stars. Extreme and moderate physical conditions to excite the maser and thermal emission coexist within the CH3OH flow. Finally, we do not detect any complex molecules associated with the flow, e.g., CH3OCHO, (CH3)2CO, and CH3CH2CN.
Subject headings:
circumstellar matter – ISM: molecules – ISM: outflows – individual objects: DR21(OH)1. Introduction
DR21(OH) (also known as W75S) is a prominent high-mass star forming region with a bolometric luminosity
of about 1.5 104 L⊙ and with a total mass of about 1104 M⊙ (Harvey et al., 1977; Chandler et al., 1993)
located about north of DR21 in the Cygnus X molecular cloud complex
(Downes & Rinehart, 1966; Motte et al., 2007; Jakob et al., 2007; Reipurth & Schneider, 2008; Zapata et al., 2013). From DR21 emanates
an energetic molecular outflow, but its nature seems to be different from the typical flows excited mediate disks (Zapata et al., 2013, 2017).
DR21(OH) and DR21 is embedded in a 4 pc long and massive filamentary ridge that extends in a north-south orientation
(Harvey et al., 1986; Vallée & Fiege, 2006; Csengeri et al., 2011; Schneider et al., 2010; Hennemann et al., 2012).
The distance to DR21(OH) has been accurately determined recently by trigonometric
parallax of its associated methanol masers as 1.50 0.08 kpc (Rygl et al., 2012).
This region has been extensively studied at infrared, millimeter and submillimeter wavelengths
(Lai et al., 2003; Davis et al., 2007; Kumar et al., 2007; Araya et al., 2009; Minh et al., 2011; Zapata et al., 2012; Minh et al., 2012; Girart et al., 2013).
DR21(OH) contains two main dusty condensations MM1 and MM2 that are warm 50 and 30 K and massive 350 and 570 M⊙, respectively, see e.g. Mangum et al. (1991). Recently, nine compact millimeter sources were revealed within both condensations, and with masses in a range of M⊙ see e.g. Zapata et al. (2012); Girart et al. (2013). Five of the compact sources are associated with the extended millimeter source MM1 (SMA ) and four with MM2 (SMA ). These sources are likely to be large dusty disks/envelopes around high mass protostars. Two of the compact sources associated with MM1 (SMA6 and SMA7) have spectral features consistent with hot molecular cores, see e.g. Minh et al. (2011), Minh et al. (2012), and Zapata et al. (2012).
Several dense molecular outflows have been reported to emanate from within the MM1 and MM2 cores, traced by CO, SiO, H2CO, H2CS and CH3OH emission (Lai et al., 2003; Minh et al., 2011; Zapata et al., 2012; Girart et al., 2013). In particular, a well-collimated east–west bipolar maser and thermal CH3OH flow driven from within the SMA4 has been reported and discussed by Plambeck & Menten (1990), Kogan & Slysh (1998), Kurtz et al. (2004), Araya et al. (2009), Fish et al. (2011), and Zapata et al. (2012). The LSR radial velocity of CH3OH flow is nearly ambient (10 to 5 km s-1) and is elongated in an east-west direction. This might suggest that this outflow is close to the plane of the sky. The outflow in DR21(OH) has also been detected in formaldehyde transitions at millimeter wavelengths (Zapata et al., 2012).
It is thought that the molecular outflows provide a chemical enrichment to the surroundings of the young stellar objects through shocks, which can then destroy and/or release complex molecules trapped in the grains into the gas phase. This process is done by compressing and then heating the interstellar medium (Garay et al., 1998; Bachiller et al., 2001; Jørgensen et al., 2007; Arce et al., 2008). The molecular outflows that present an overabundance of species such as SiO, CH3OH, H2CO, HCO+, HCN, and H2O, or even complex molecules (with six or more atoms) are classified as “chemically active outflows” (Bachiller et al., 2001). Therefore, the E-W outflow in DR21(OH) could be considered as chemically active. However, as we will see in the next sections no complex molecules are detected in the DR21(OH) outflow (e.g., CH3OCHO, (CH3)2CO, and CH3CH2CN.
There are only a few cases where “chemically active outflows” have been reported in the literature. The list includes the L1157, B1-b, SMM4-W, BHR71, HH 114 MMS and IRAS 20126+4104 outflows (Arce et al., 2008; Öberg et al., 2011; Tafalla & Hacar, 2013; Palau et al., 2017). These flows are ejected from low- and high-mass young stars. In particular, in these outflows complex molecules have been detected, for example the HCOOCH3 or the C2H5OH. Chemical models indicate that complex molecules can form on grain surfaces (Garrod & Herbst, 2006; Herbst & van Dishoeck, 2009), present probably in the outflows.
Here, we have carried out a molecular line survey toward the CH3OH outflow in DR21(OH), aiming to determinate its physical conditions, and to find evidence of complex organic molecules present in the flow.
2. Observations
The observations of DR21(OH) were made with the SMA (Ho et al., 2004) in May 2006 at 217/227 GHz and in August 2006 at 337/347 GHz in its extended and compact configuration, respectively. The total observing time on-source with the SMA at 337/347 GHz was about 1.38 hrs., while for the 217/227 GHz band was around 2.22 hrs. The pointing center for both datasets was , and . The Full Width Half Maximum (FWHM) is and at 230 and 345 GHz, respectively. The molecular emission arising from the outflow, and the emission from the continuum condensations fall well within both FWHMs.
The SMA digital correlator was configured to cover 4 GHz of bandwidth, 2 GHz in the Upper Sideband (USB) and 2 GHz in the Lower Sideband (LSB). Each 2 GHz sidebands was covered by 24 chunks with a width of 104 MHz each and divided by 128 resolution channels. This correlator configuration provided a spectral resolution of about 0.8125 MHz (i.e., km s-1 at 345 GHz and km s-1 at 230 GHz). Heterodyne SIS receivers were used and system temperatures ranged between 120 to 240 K for the different antennas at both frequencies.
The zenith opacity (), measured with the NRAO tipping radiometer located at the Caltech Submillimeter Observatory, was between 0.1 and 0.25 at both frequencies, indicating reasonable weather conditions during the observations. Uranus and Callisto provided the absolute scale for the flux density calibration. The phase-gain calibrators were the quasars BL Lac and MCW349. The bandpass calibration was done using the quasar 3C454.3. The uncertainty in the flux scale is estimated to be about , based on SMA monitoring of quasars111http://sma1.sma.hawaii.edu/callist/callist.html.
The initial data calibration and reduction were made using the IDL superset MIR222http://cfa-www.harvard.edu/cqi/mircook.html. The spectra, molecular lines maps and the image analysis were made using the MIRIAD and KARMA softwares (Sault et al., 1995; Gooch, 1996). The robust weighting parameter was set to 2 giving a synthesized beam for 230 GHz of (PA = ) and for the 345 GHz (PA = ). The resulting image r.m.s. noise for the line images were 20 mJy beam-1 for each velocity channel at 230 GHz, and 50 mJy beam-1 at 345 GHz.
| Frequency | Species | Transition | Eu | Spot(∗) | Range of Velocities(∗∗) | Gaussian Fit | |
|---|---|---|---|---|---|---|---|
| (MHz) | (K) | () | km s-1 | Center and FWHM [km ] | |||
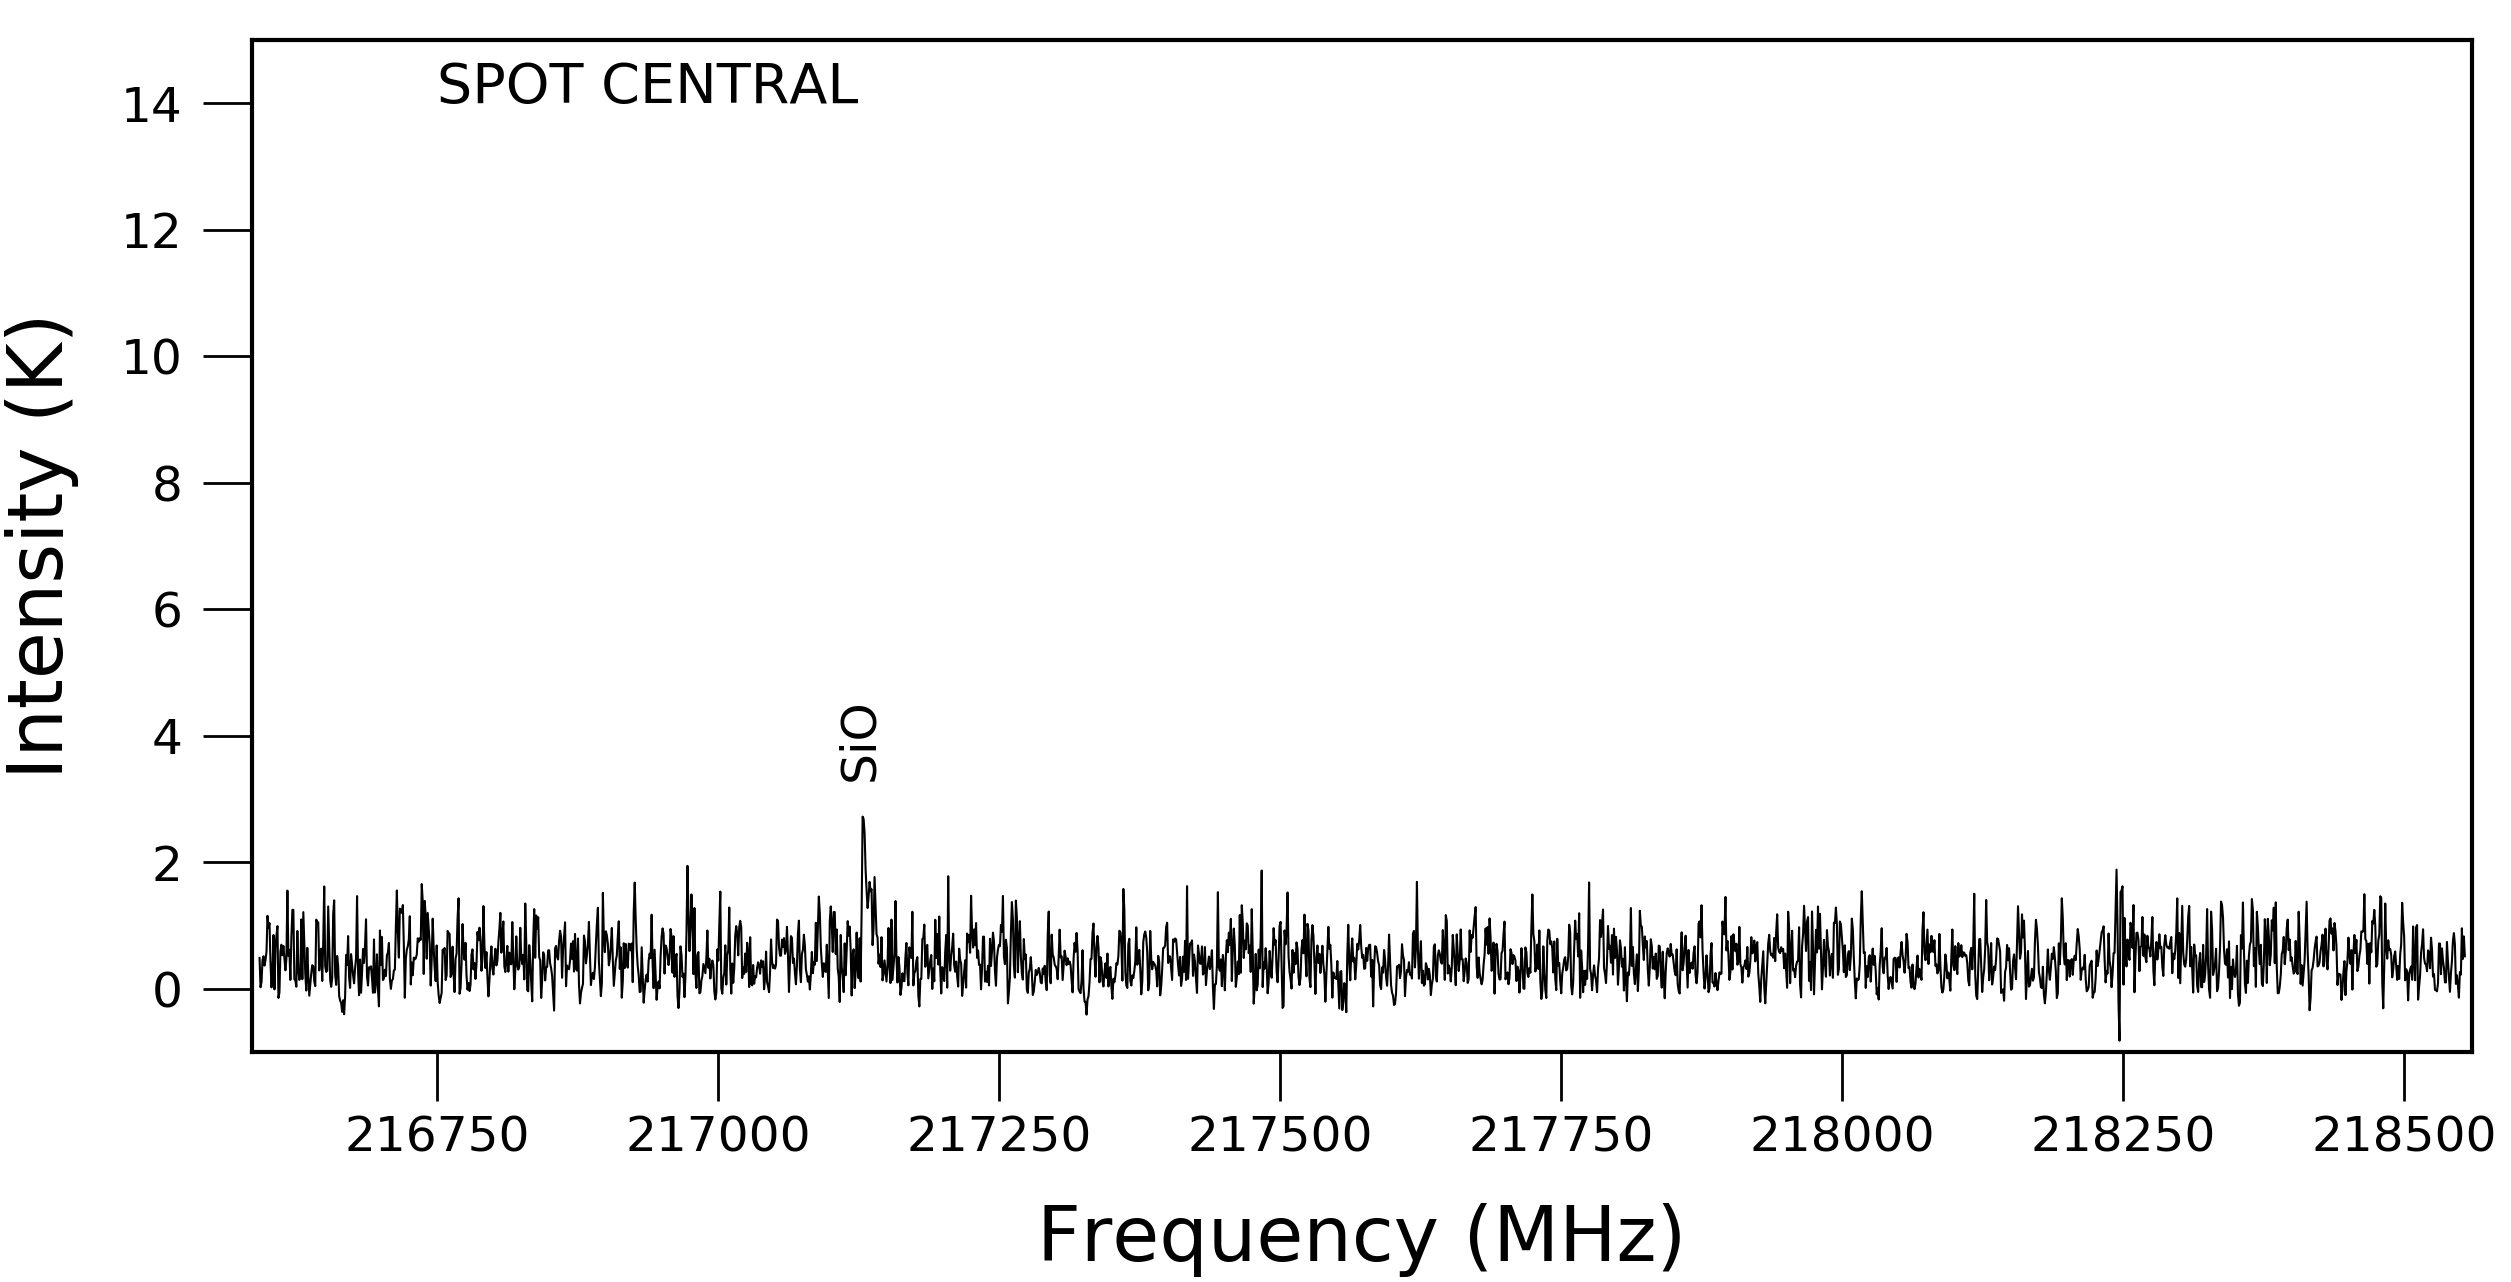
| 217104.919 | SiO(∗∗∗) | 31.26 | 5.20 | C | -22, +8 | -6.10.5; 20.04.0 | |
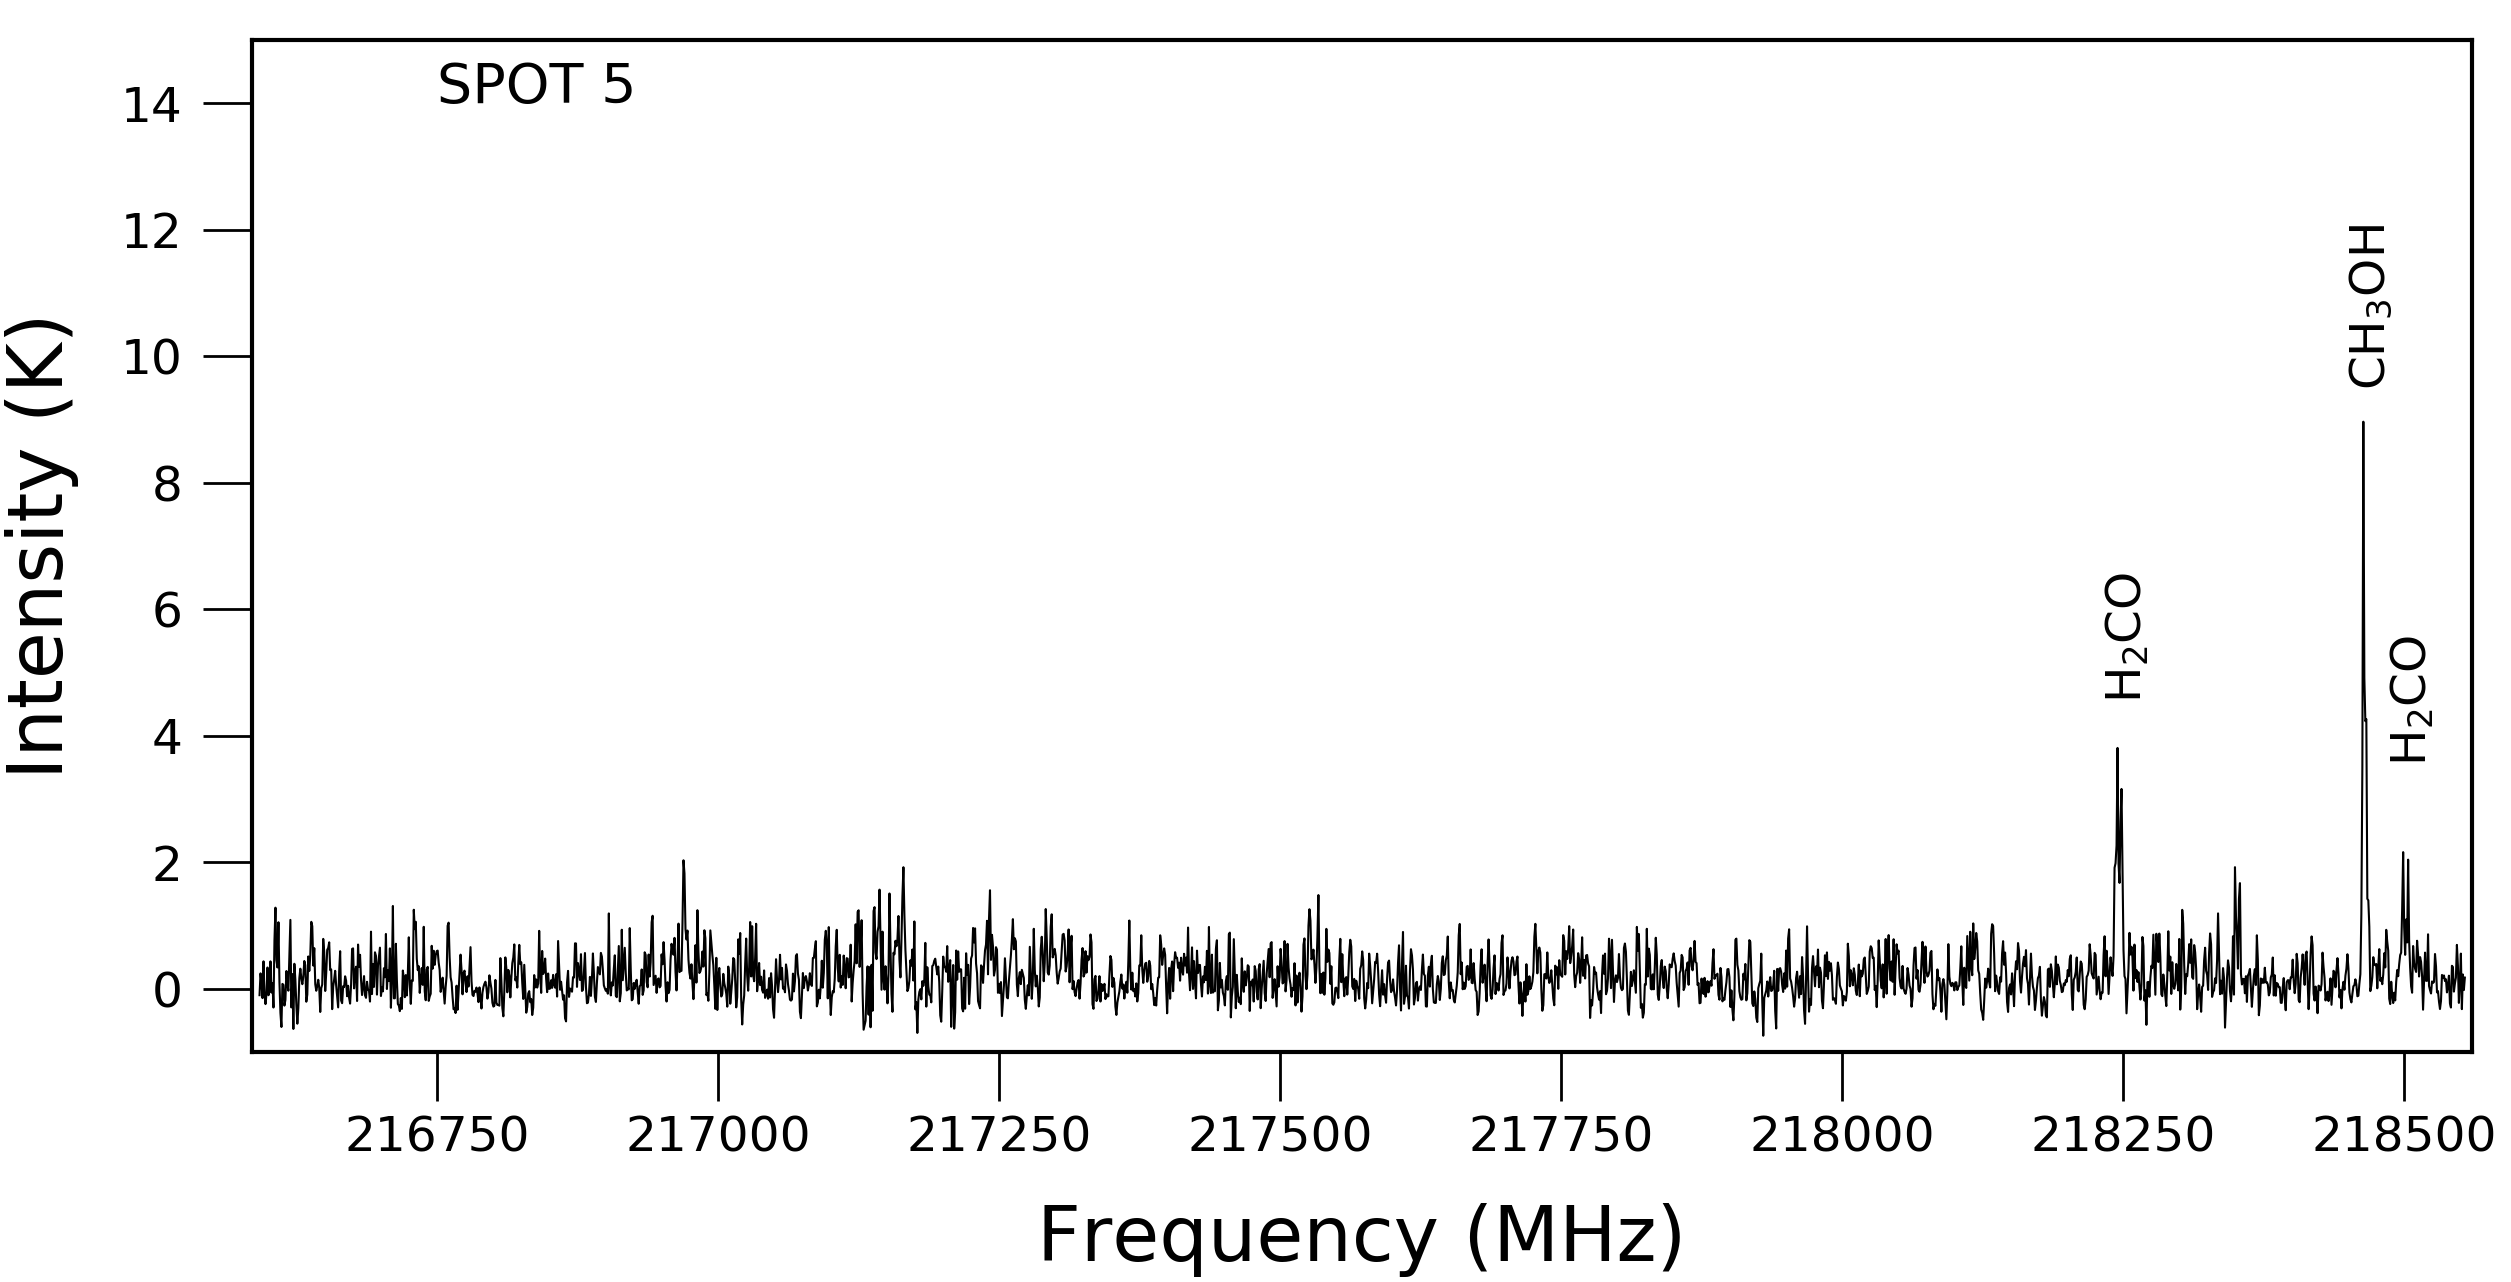
| 218222.192 | H2CO(∗∗∗) | 20.96 | 2.82 | 1,2,3,4,5 | -10, +6 | -2.50.6 ; 14.52.0 | |
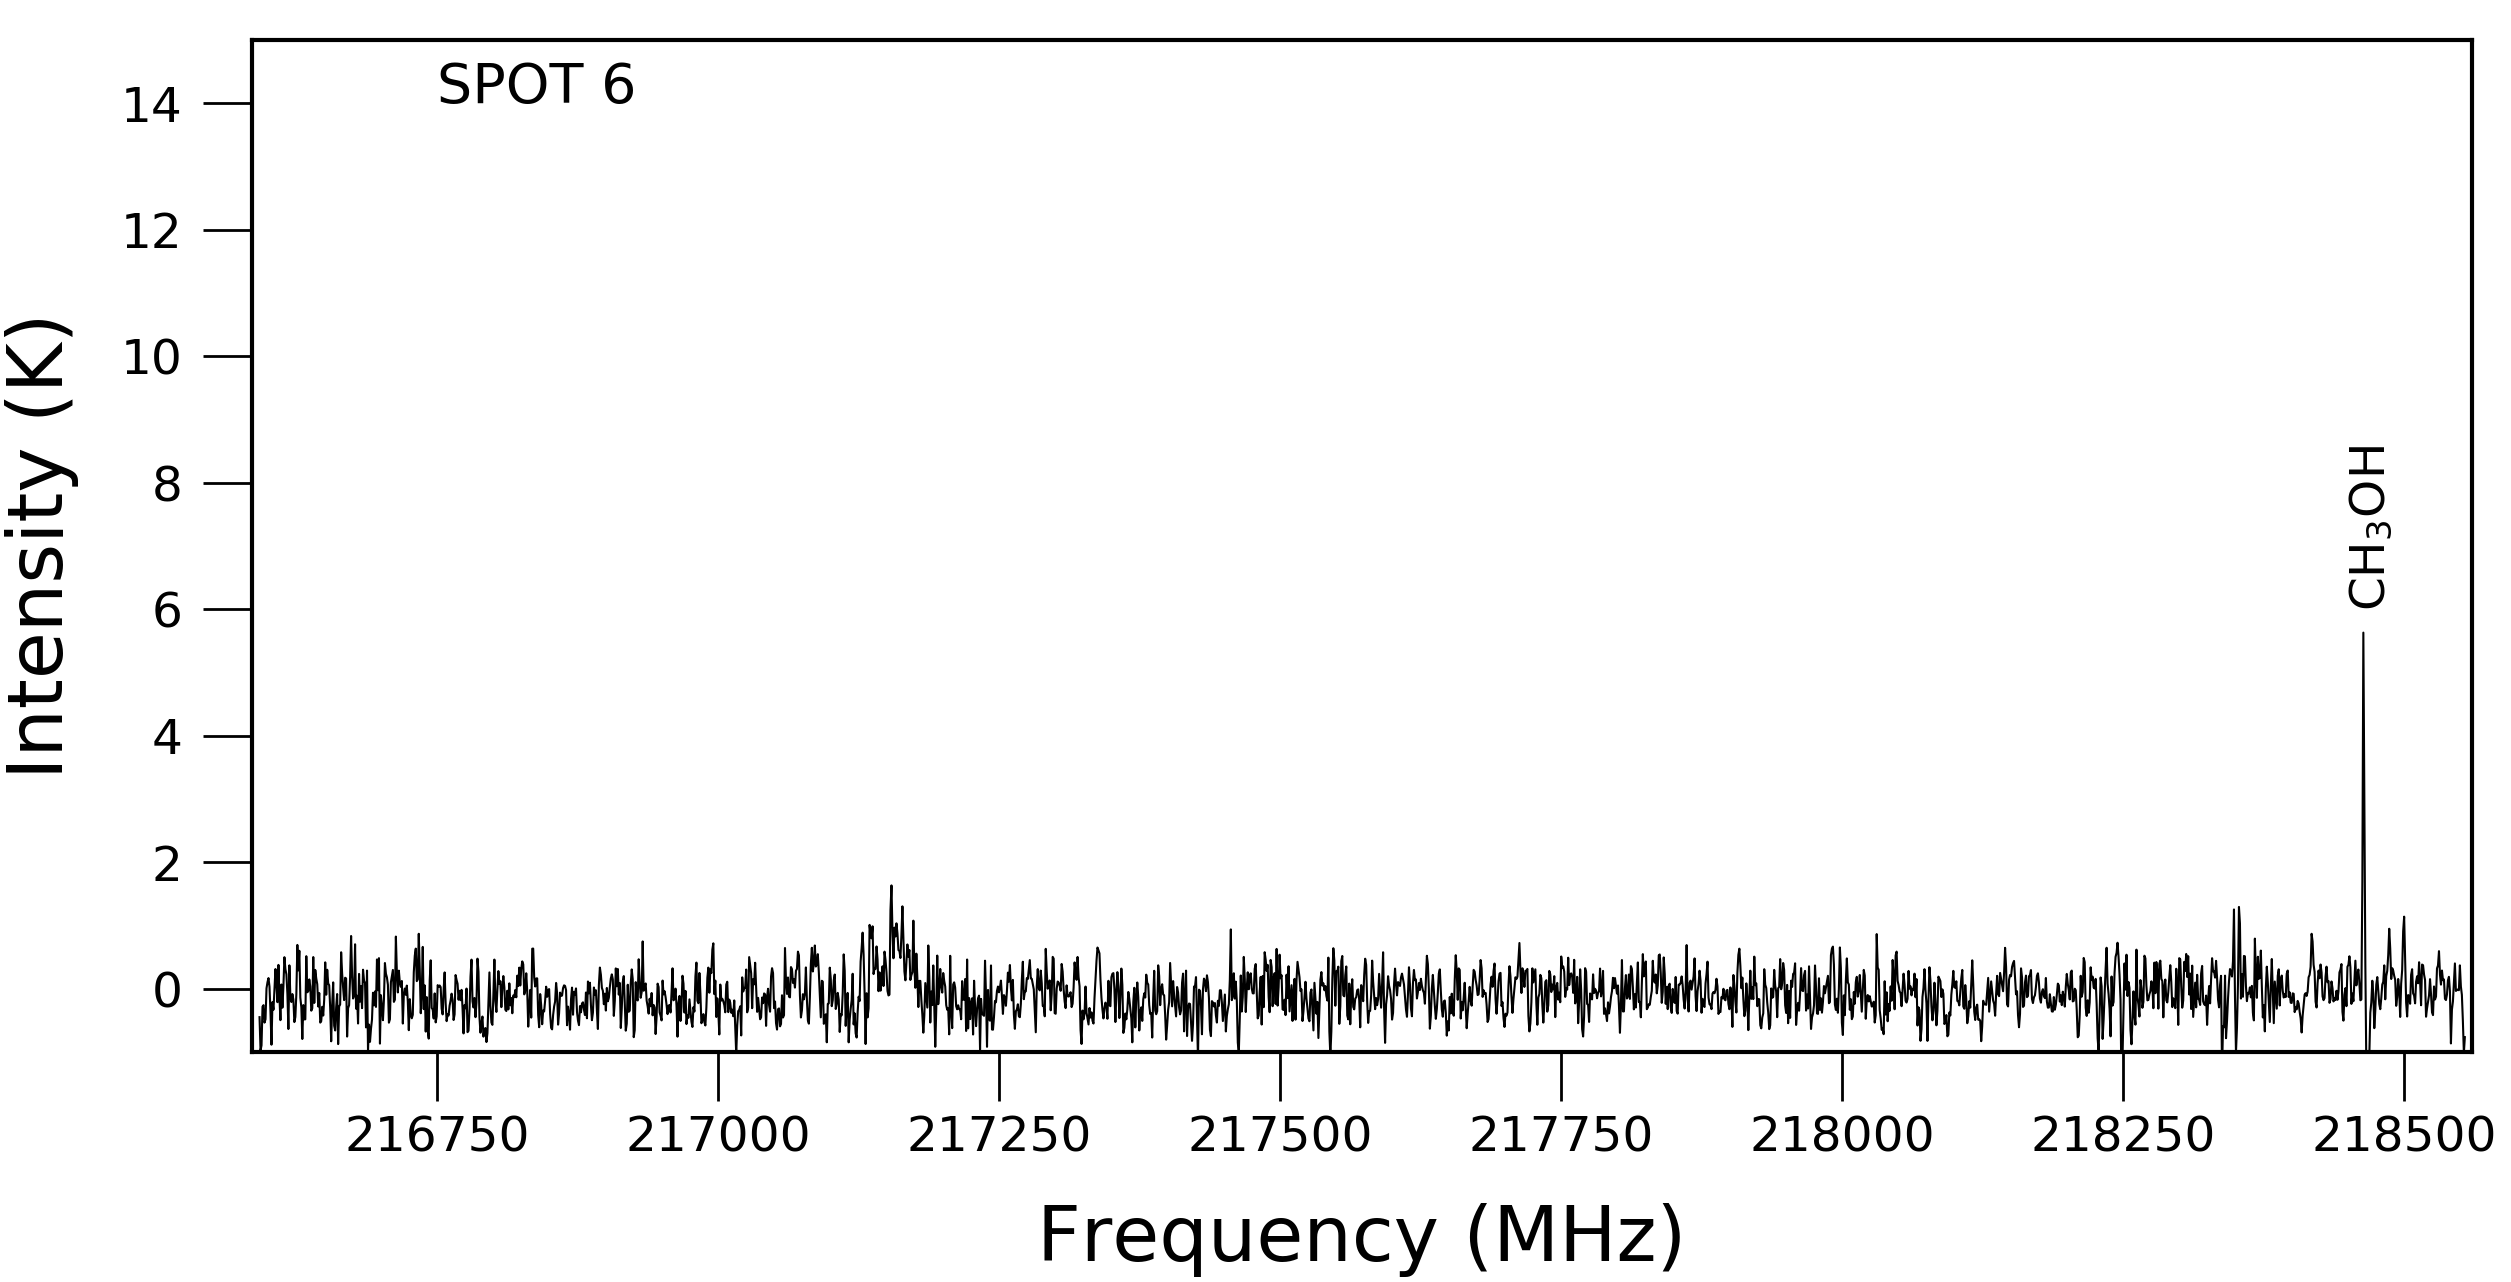
| 218440.050 | E-CH3OH(∗∗∗) | 4 | 45.46 | 4.69 | 1,2,3,4,5,6 | -9, +4 | -2.70.5 ; 10.51.0 |
| 218475.632 | H2CO(∗∗∗) | 68.09 | 1.57 | 1,2,3,4,5 | -10, +3 | -3.30.3 ; 13.51.0 | |
| 336865.110 | A-CH3OH | 197.07 | 4.07 | 1,4,C | -6, +6 | -0.50.2 ; 11.30.8 | |
| 337061.471 | C17O | 32.35 | 1.11 | 4,C | -4, +5 | -0.30.2 ; 4.60.5 | |
| 337396.459 | C34S | 64.77 | 8.0 | C | -8, +2 | -1.40.5 ; 9.60.7 | |
| 338083.195 | H2CS | 102.43 | 5.77 | C | -8, +2 | -1.50.5 ; 9.20.7 | |
| 338124.502 | E-CH3OH | 78.08 | 1.70 | 1,2,3,4,C | -8, +4 | -1.80.5 ; 8.40.5 | |
| 338344.628 | E-CH3OH | 70.55 | 1.67 | 1,2,3,4,5,6,C | -8, +4 | -2.80.5 ; 8.50.4 | |
| 338404.580(a) | E-CH3OH | 243.79 | 4.48 | 1,2,3,4,5,6,C | -8, +6 | -1.90.2 ; 10.50.5 | |
| 338512.627(b) | A-CH3OH | 145.33 | 1.15 | 2,3,4,C | -8, +5 | -1.40.2 ; 9.50.6 | |
| 338540.795(c) | A-CH3OH | 114.79 | 1.39 | 4,C | -9, +4 | -1.90.2 ; 9.00.7 | |
| 338559.928 | E-CH3OH | 127.71 | 1.40 | 4,C | -8, +2 | -2.10.4 ; 9.40.7 | |
| 338583.195(d) | E-CH3OH | 112.71 | 1.39 | 4,C | -7, +5 | -0.80.6 ; 9.00.5 | |
| 338614.999(e) | E-CH3OH | 86.05 | 1.71 | 1,2,3,4,C | -9, +4 | -2.20.5 ; 10.50.6 | |
| 338639.939(f) | A-CH3OH | 102.72 | 1.57 | 4,C | -8, +4 | -1.60.3 ; 9.80.3 | |
| 338721.693(g) | E-CH3OH | 87.26 | 1.55 | 1,2,3,4,5,6,C | -8, +6 | -3.10.3 ; 8.70.4 | |
| 346998.344 | H13CO+ | 41.63 | 3.29 | 4,C | -8, +2 | -1.50.2 ; 4.70.3 | |
| 347330.578 | SiO | 75.01 | 2.20 | C | -10, +6 | -3.10.5 ; 12.54.0 | |
| 348534.364 | H2CS | 105.19 | 6.32 | C | -6, +2 | -1.00.4 ; 10.70.7 |
Note. — Columns are frequency, quantum numbers, upper level energy, Aij Einstein coefficient, spot where the transition was identified and the range of velocities for the molecule. These values are based on CDMS database. (a) Line blended with CH3OH at 338408.698 MHz. (b) Line blended with CH3OH at 338512.856 MHz. (c) Line blended with 33SO at 338541.265 MHz and CH3OH at 338543.204 MHz. (d) Line blended with 33SO at 338591.071 MHz. (e) Line blended with SO2 at 338611.807 MHz.(f) Line blended with 33SO at 338639.671 MHz. (g) Line blended with CH3OH at 338722.898 MHz. (∗) The numbers correspond to the spots described in Figure 1. (∗∗) The velocity range is approximate since the exact values are complicated to determine. These values were obtained from gaussian fittings to the spectra data. (∗∗∗) These lines were already reported in Zapata et al. (2012).
3. Results and Discussion
In Figure 1, we present the millimeter CH3OH thermal emission from the maser outflow in DR21(OH). This image was adapted from Zapata et al. (2012), and shows the integrated intensity map (or the zero moment) of the E-CH3OH [4(2,2)-3(1,2)] molecule at 218.44005 GHz, and the 1.4 mm continuum emission from objects present in DR21(OH). The millimeter methanol emission is tracing the bipolar low-velocity east–west maser outflow revealed for the first time by Plambeck & Menten (1990) at centimeter wavelengths. The emission appears to be concentrated into compact bow-shock structures along the bipolar outflow. Overall, the methanol millimeter emission follows a morphology very similar to that seen in the 36 and 44 GHz methanol maser lines (Araya et al., 2009; Kogan & Slysh, 1998; Plambeck & Menten, 1990), with the millimeter source (SMA4) being well in the middle of the flow. Zapata et al. (2012) proposed SMA4 as its excitation source (see Figure 1). However, an infrared source (IRAC1) that is prominent at 8 m was also proposed by Araya et al. (2009) as a possible candidate for its exciting source.
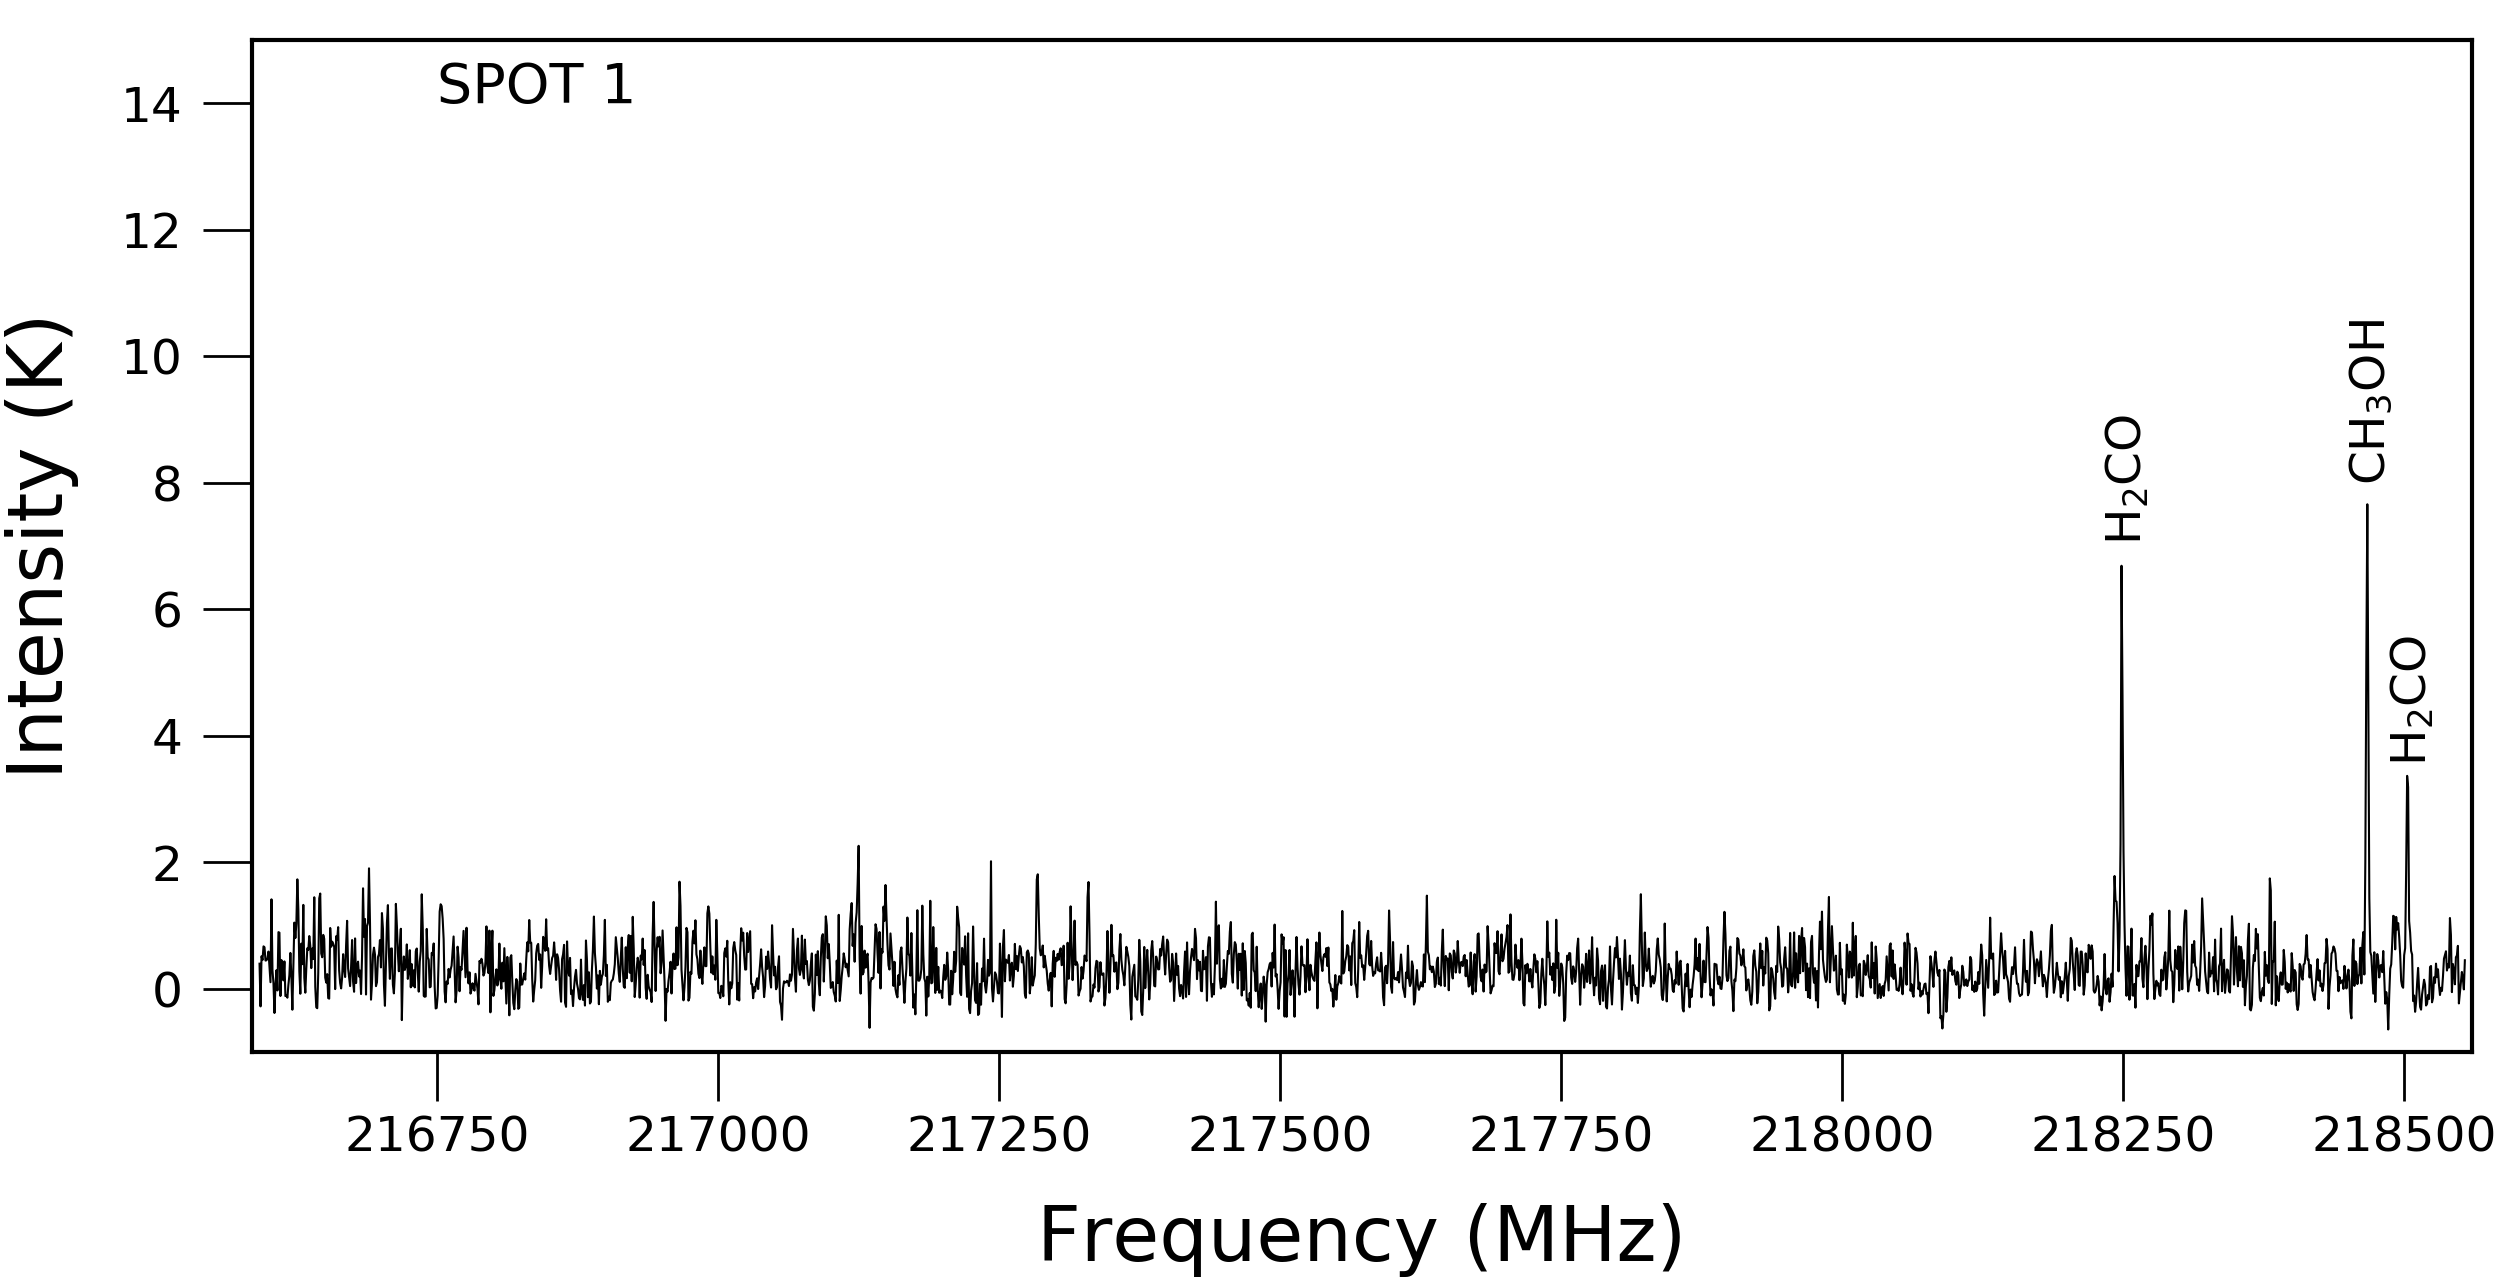
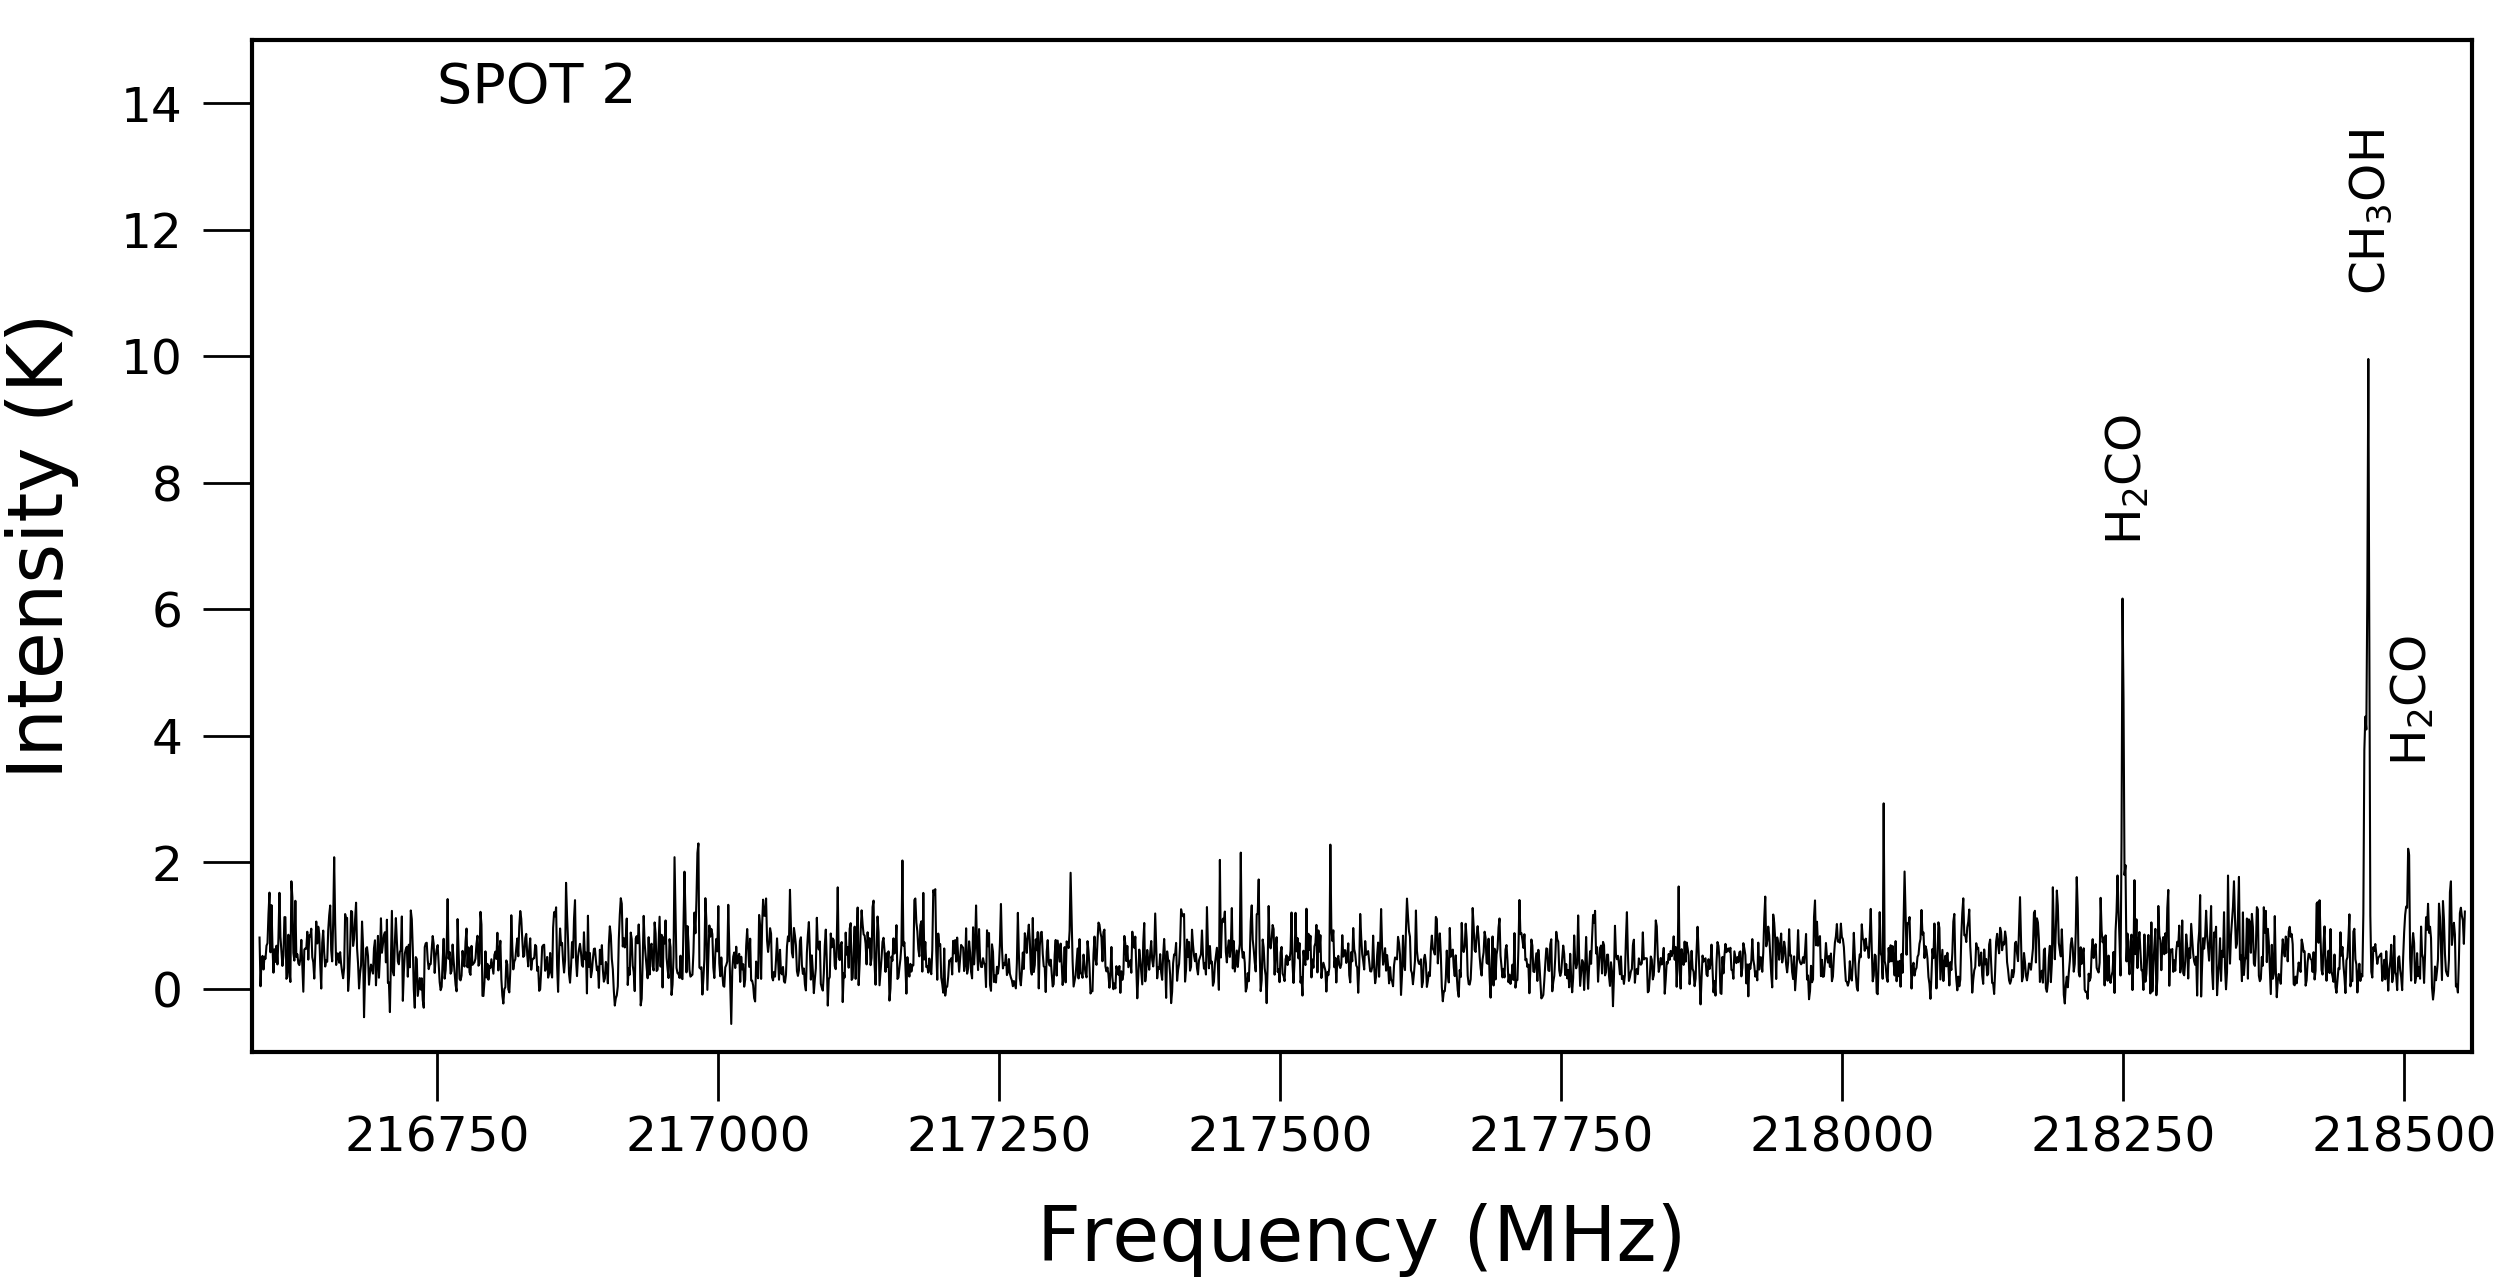
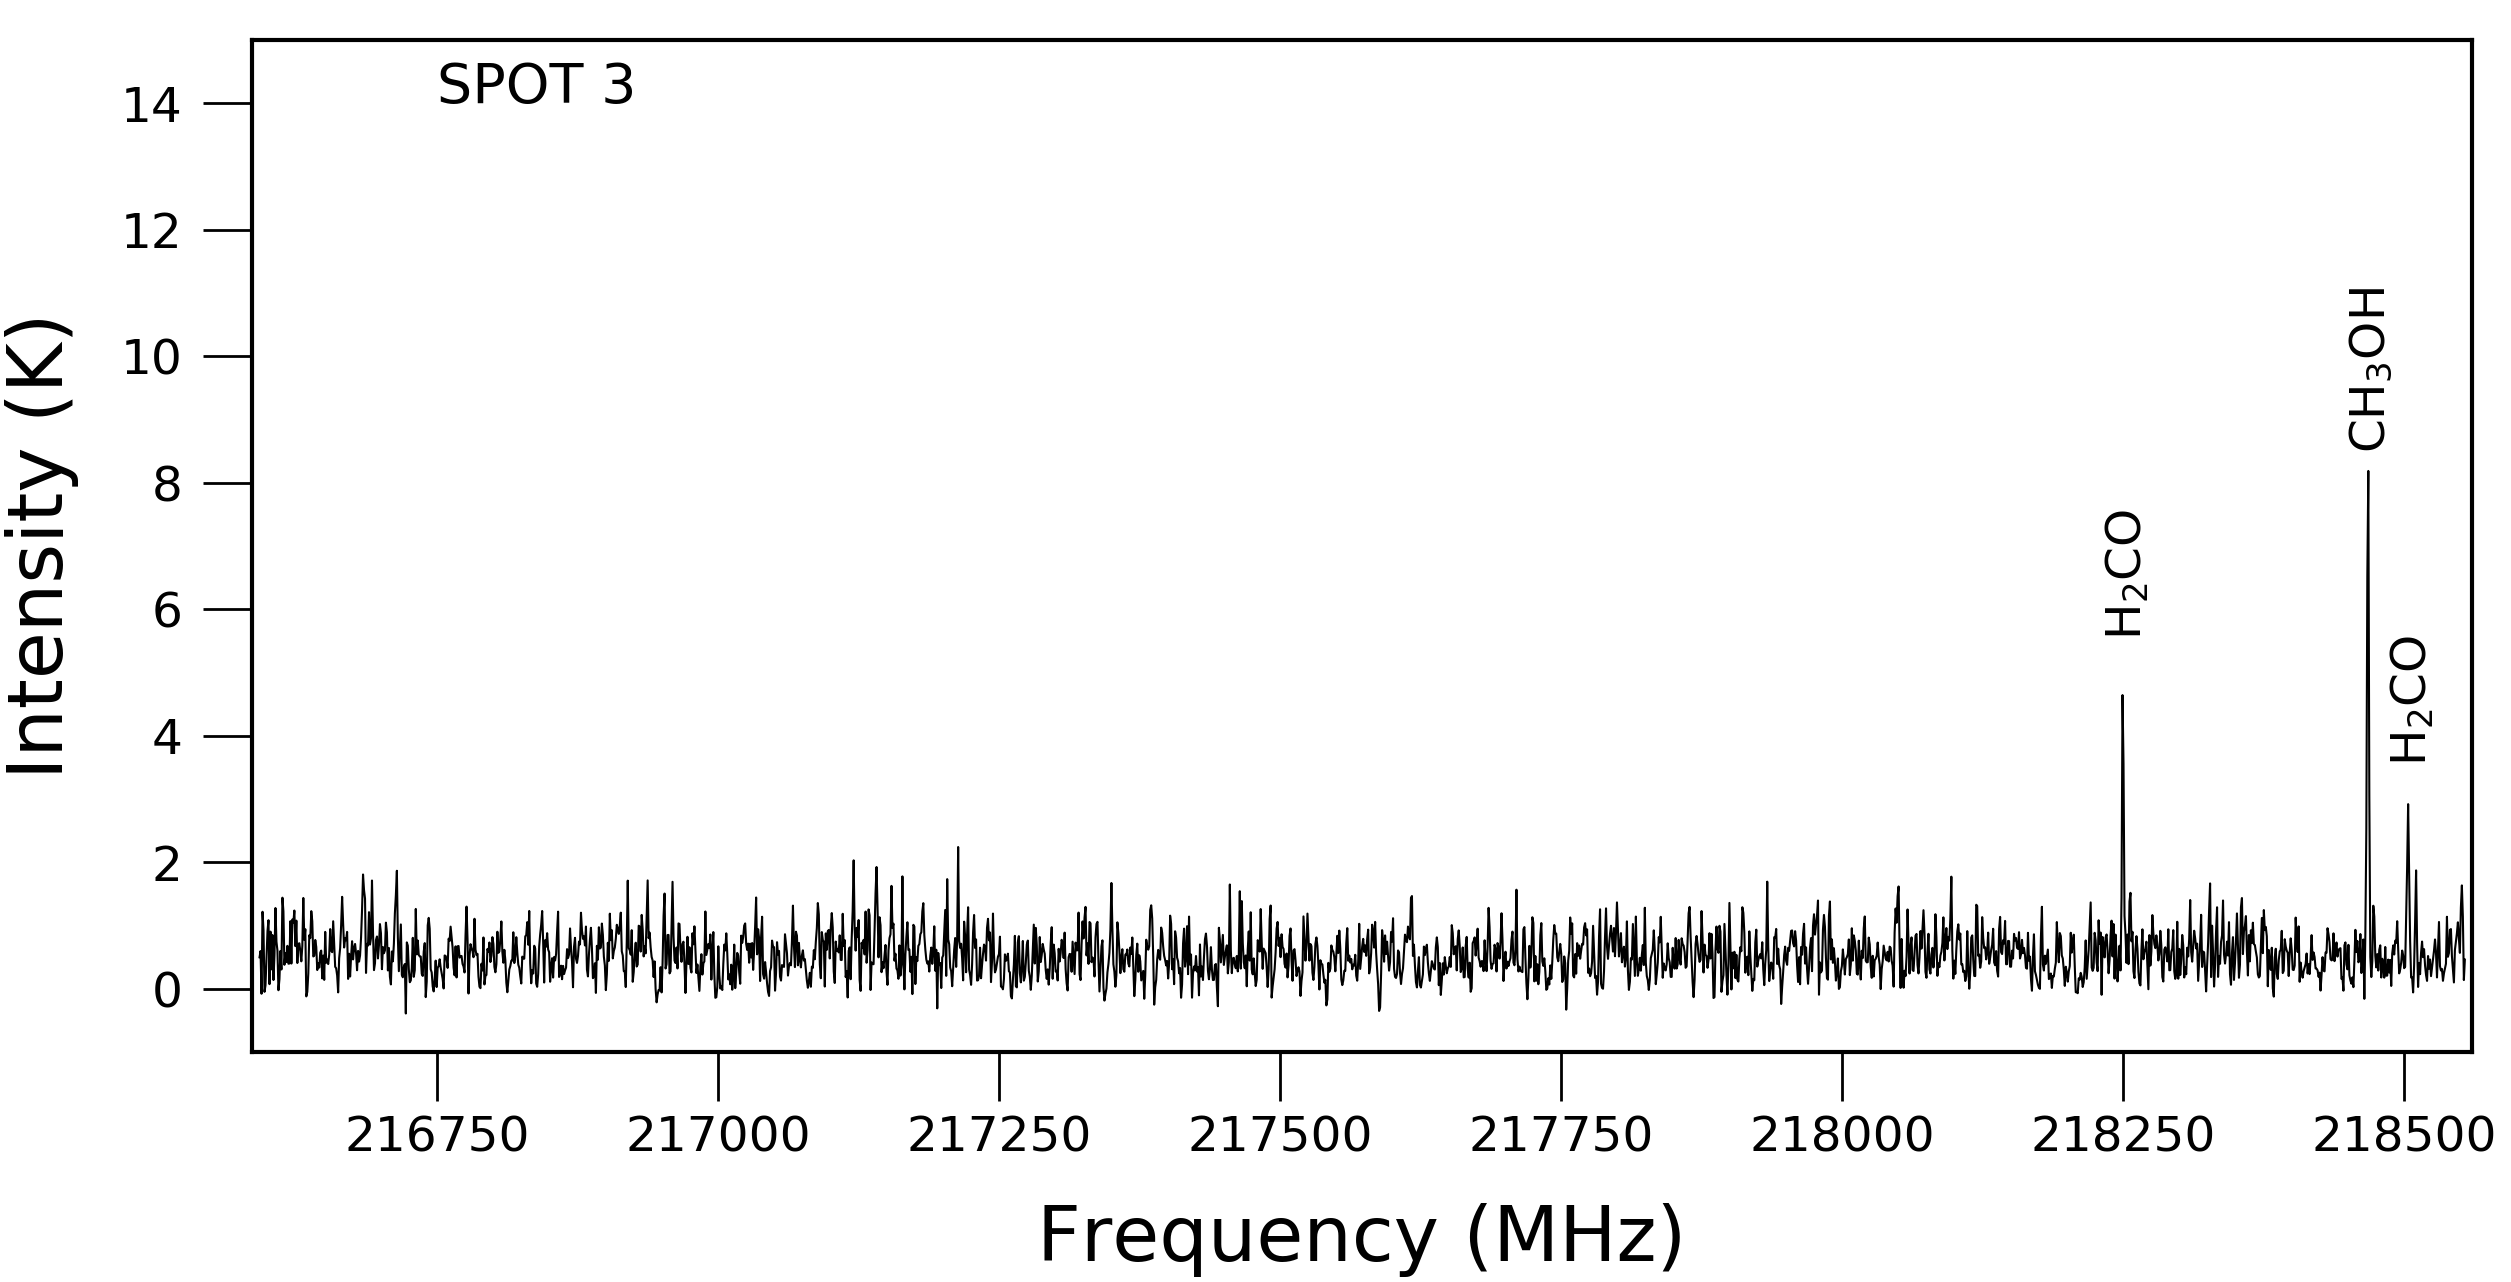
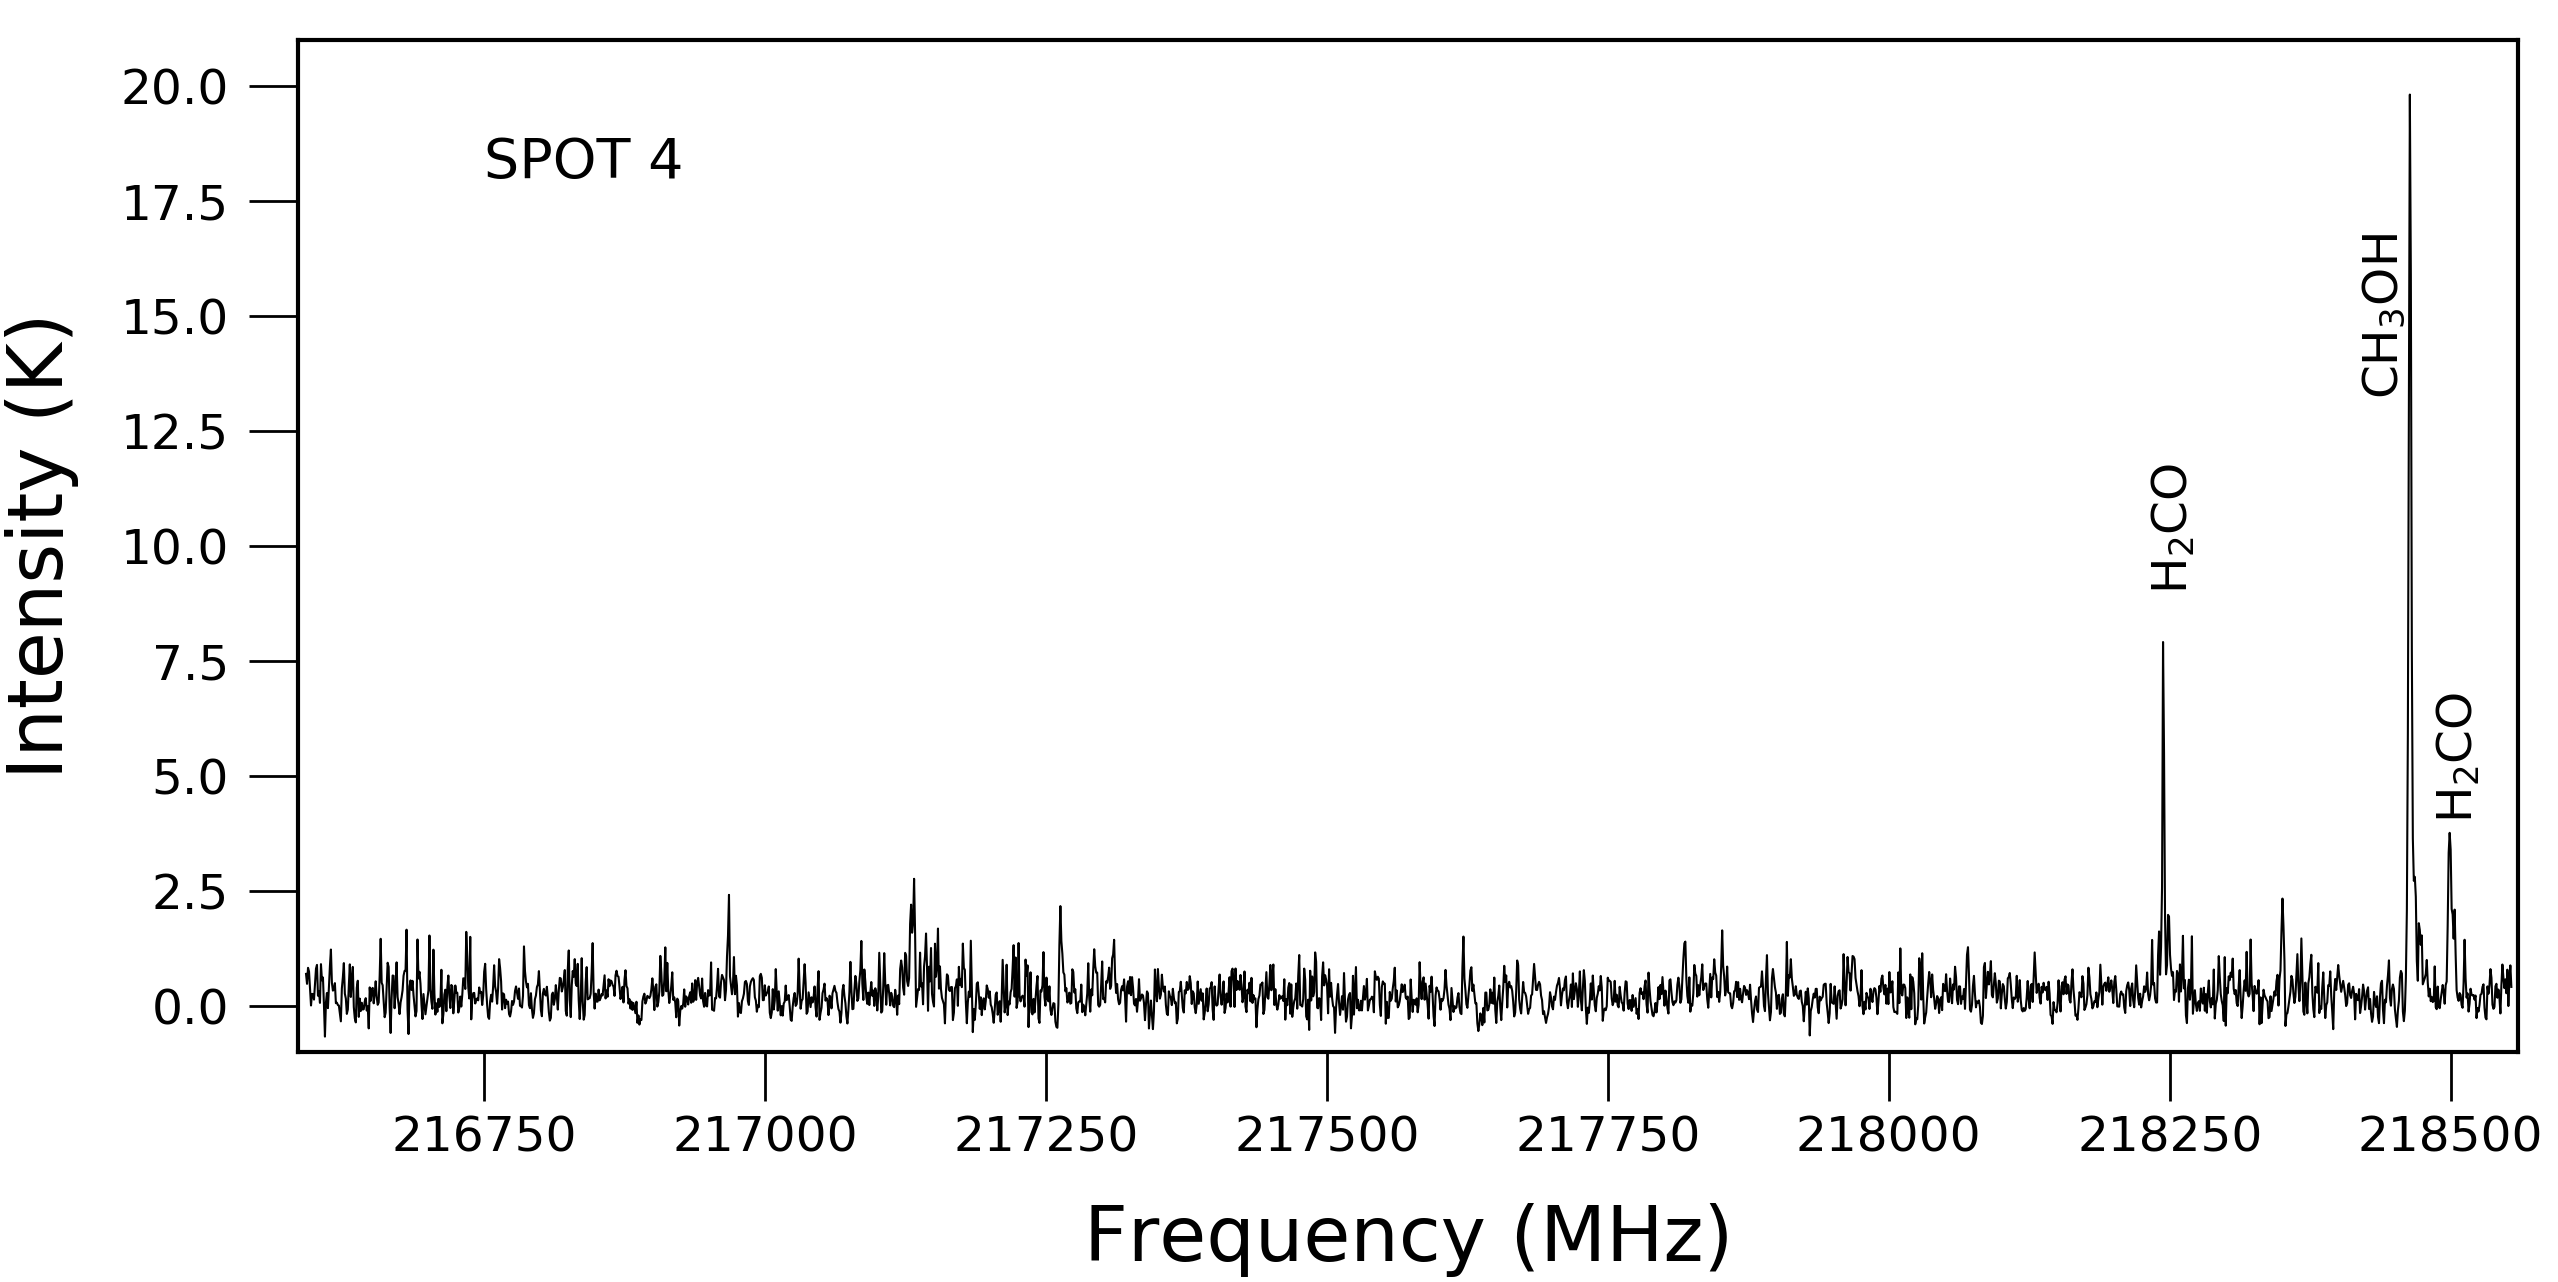
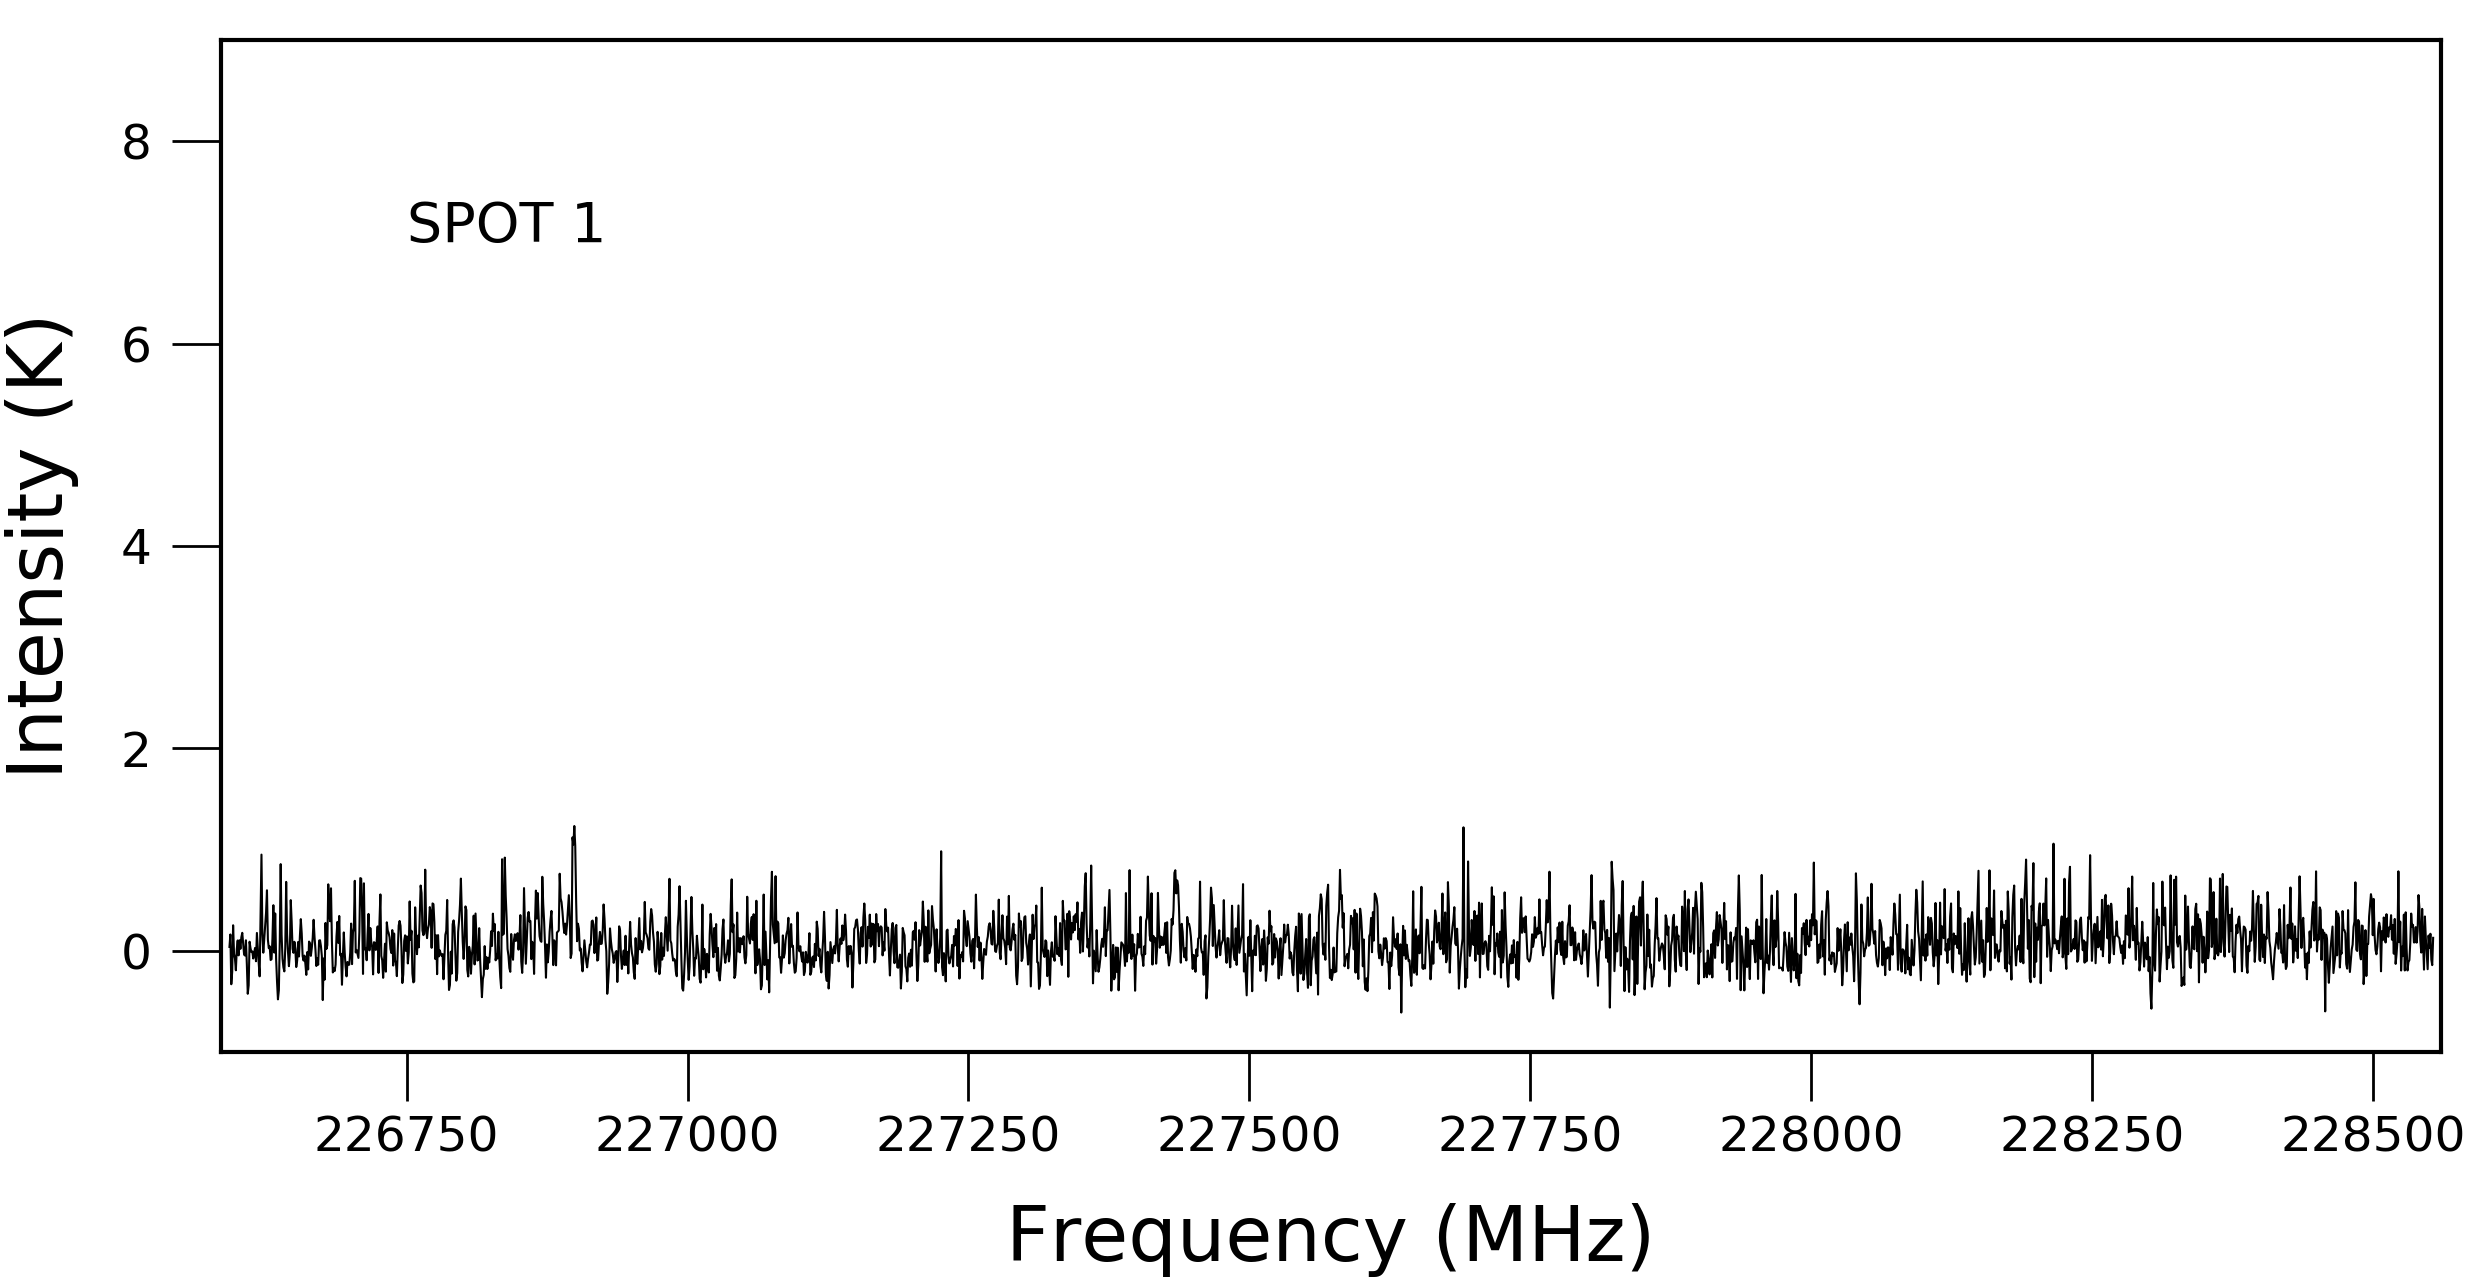
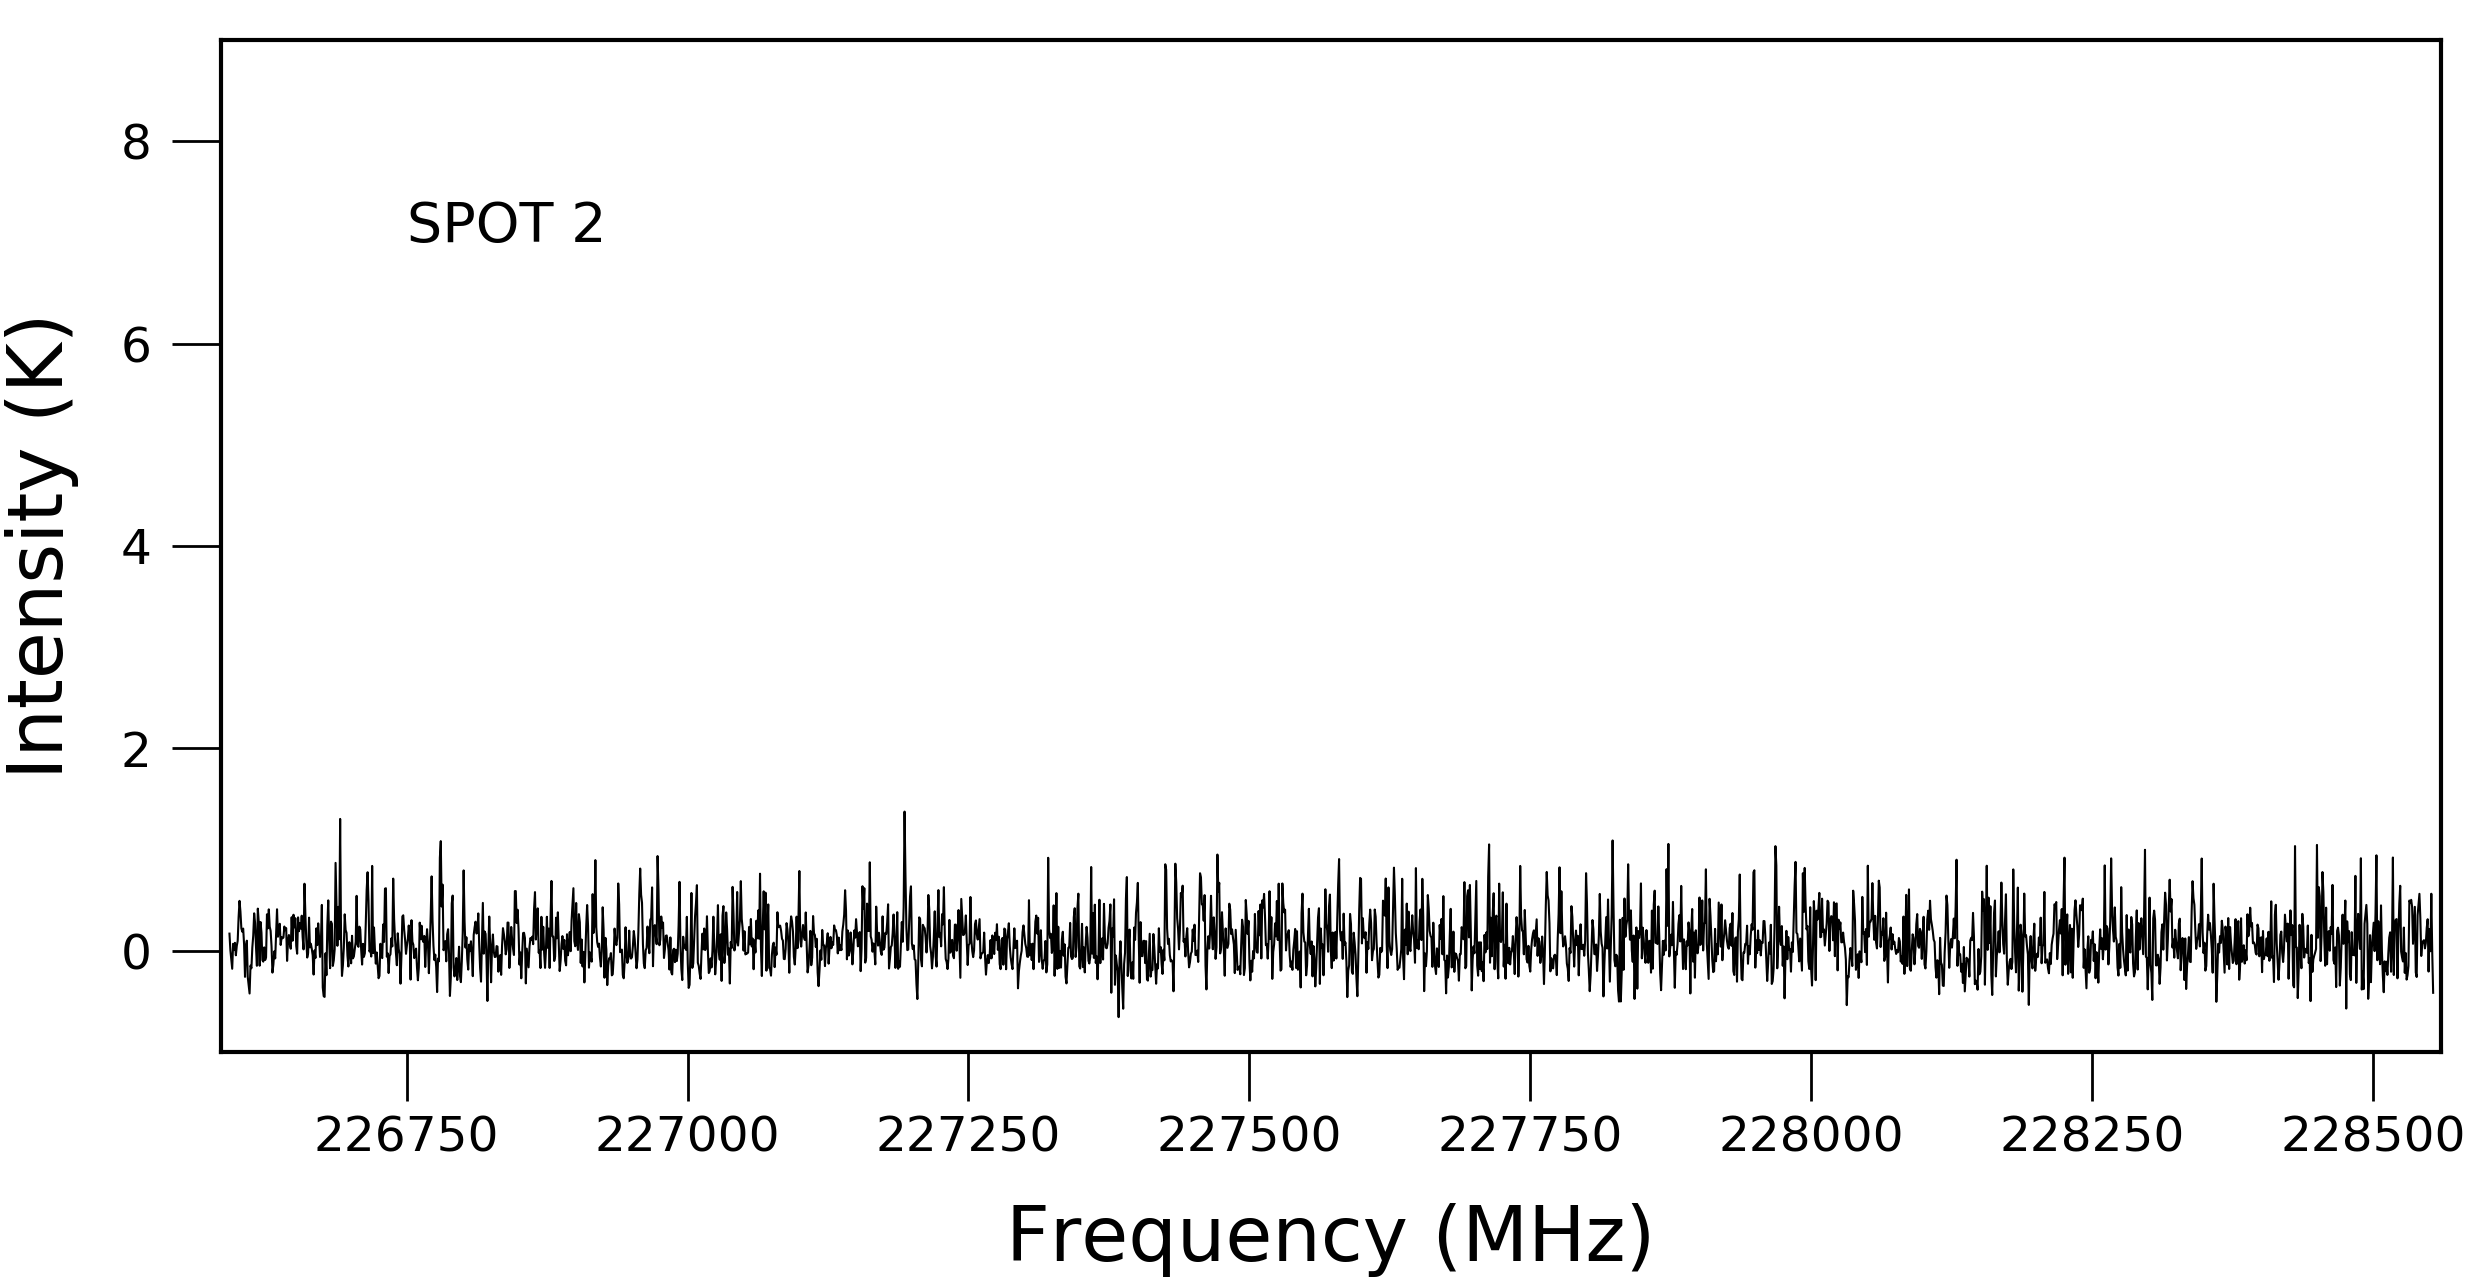
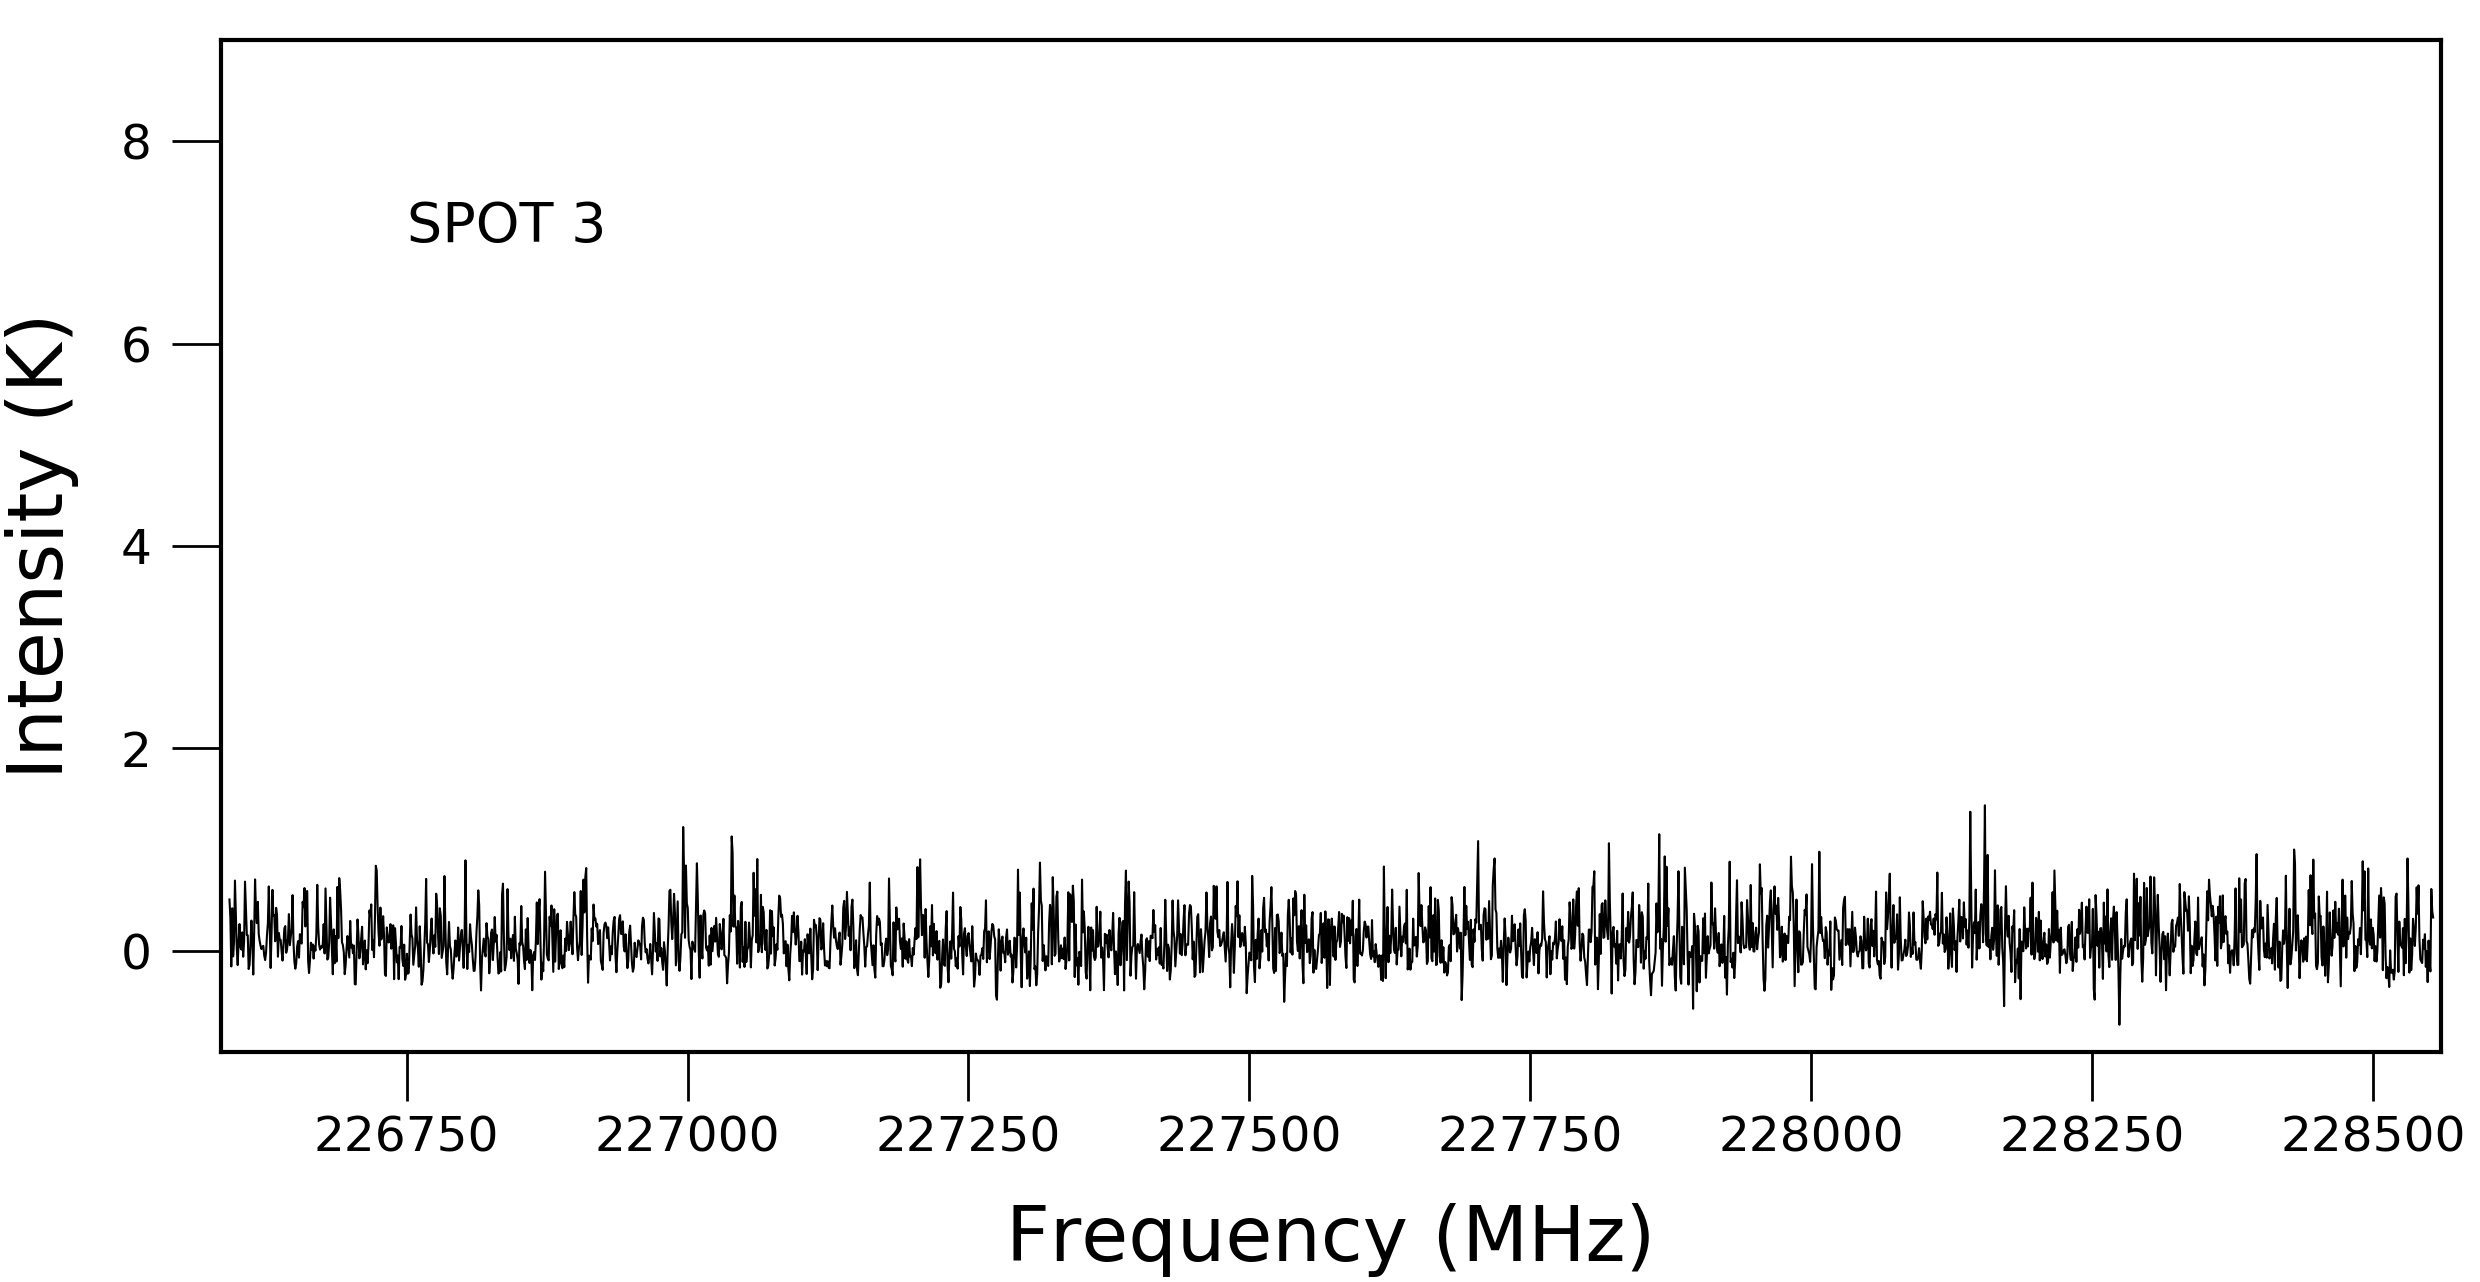
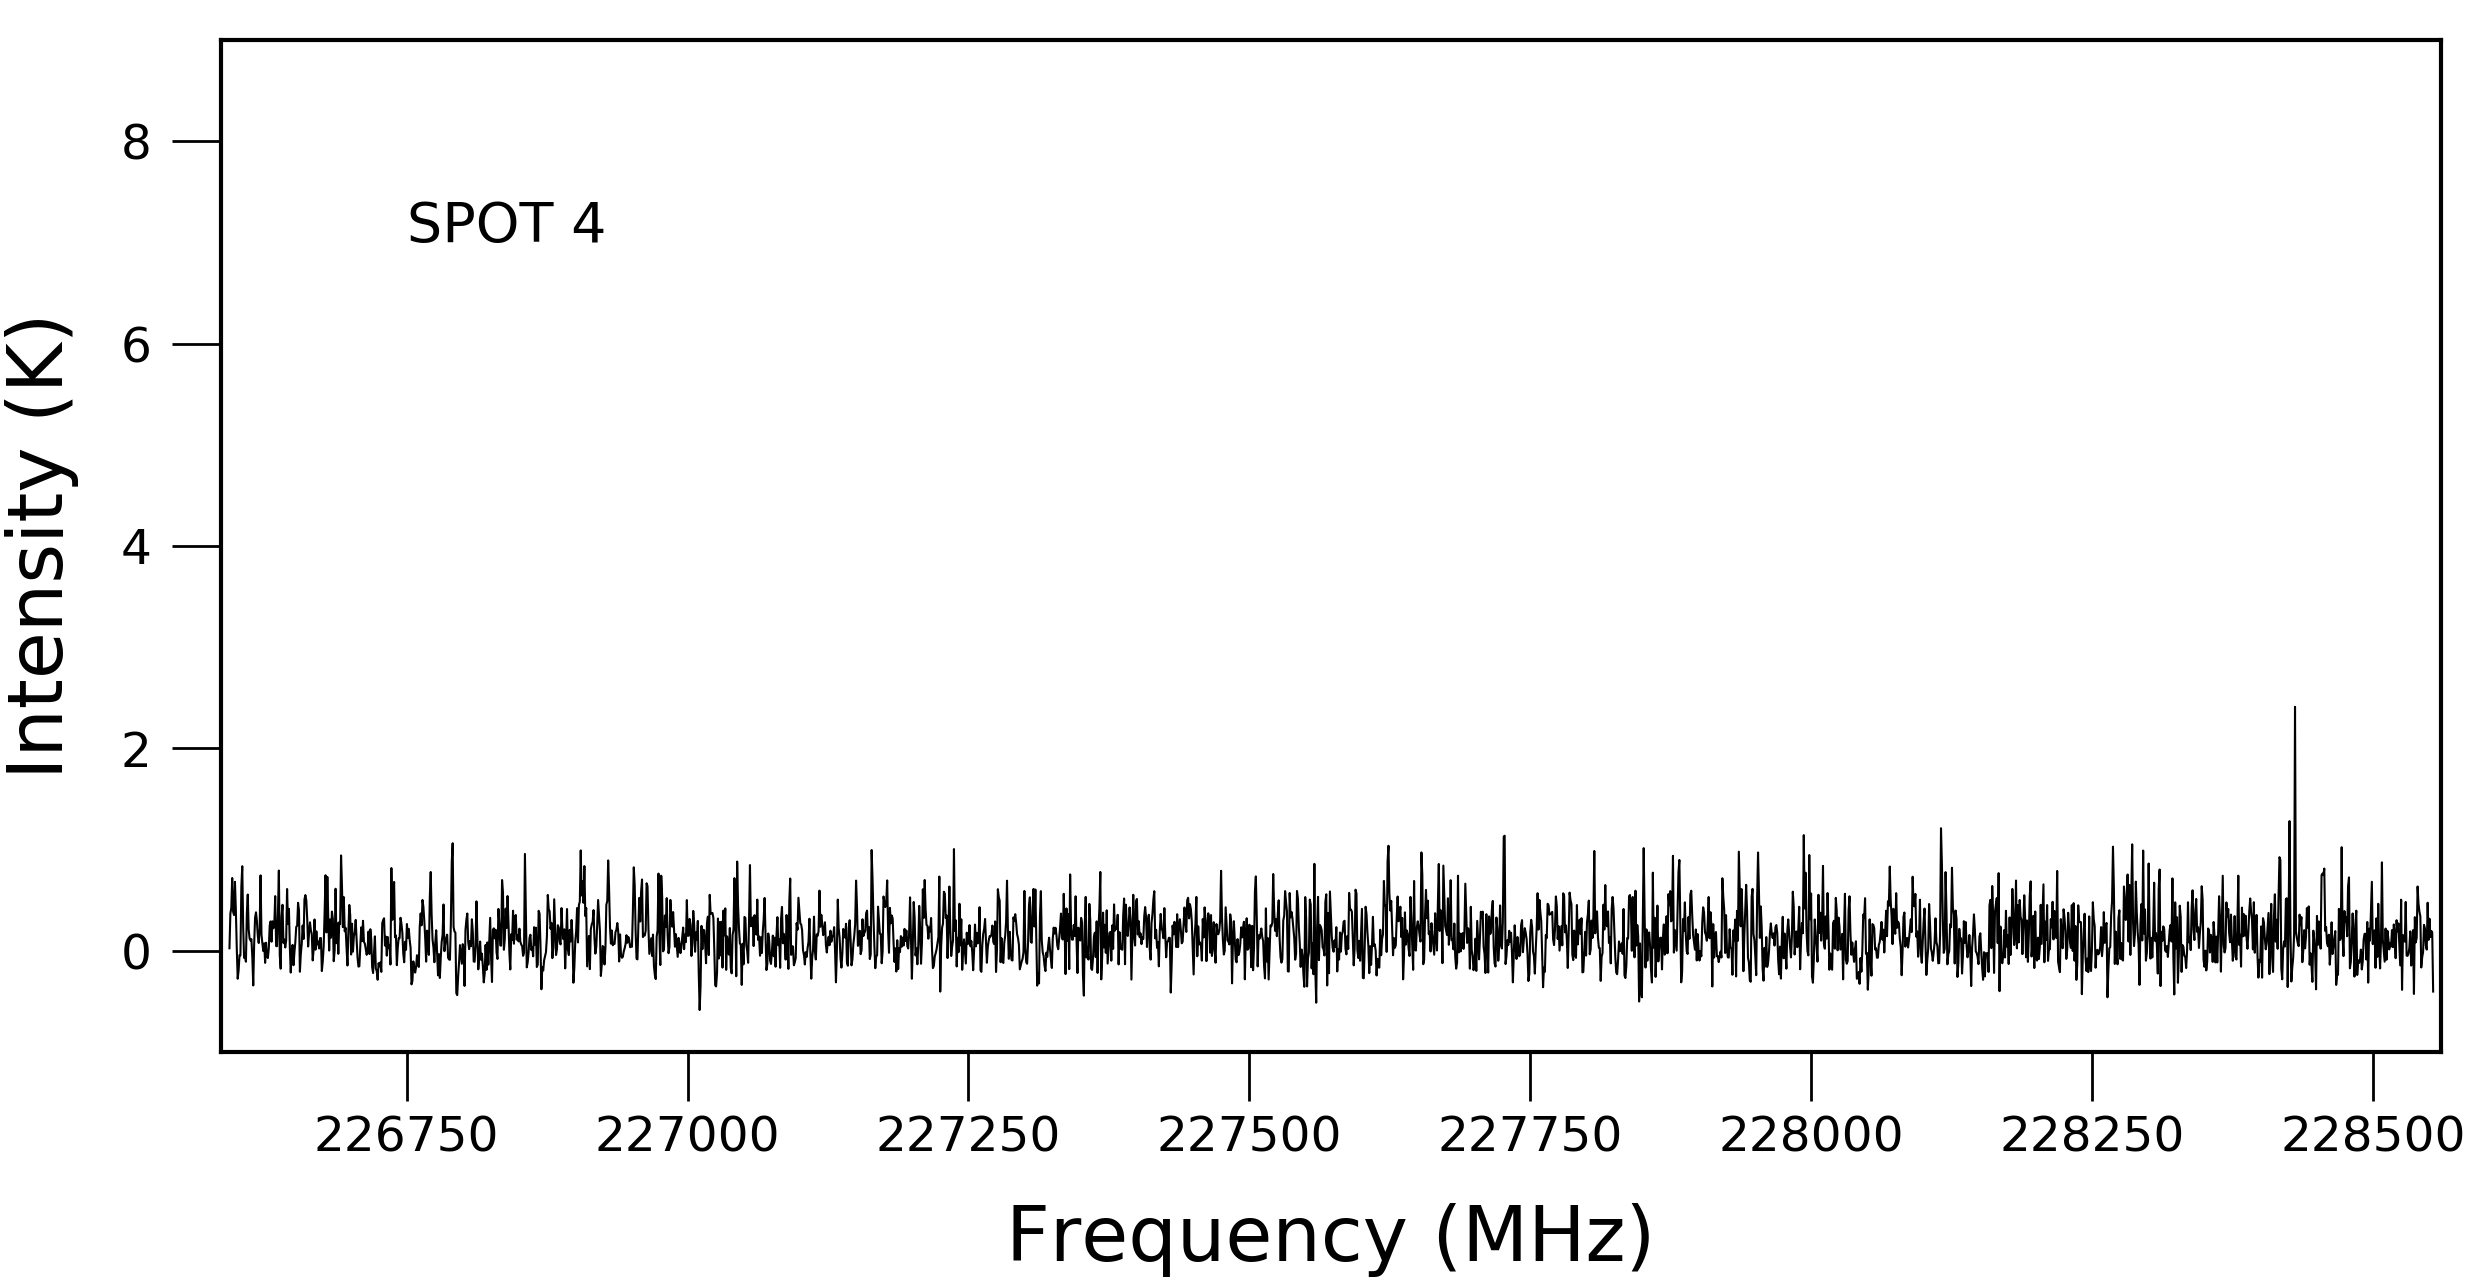
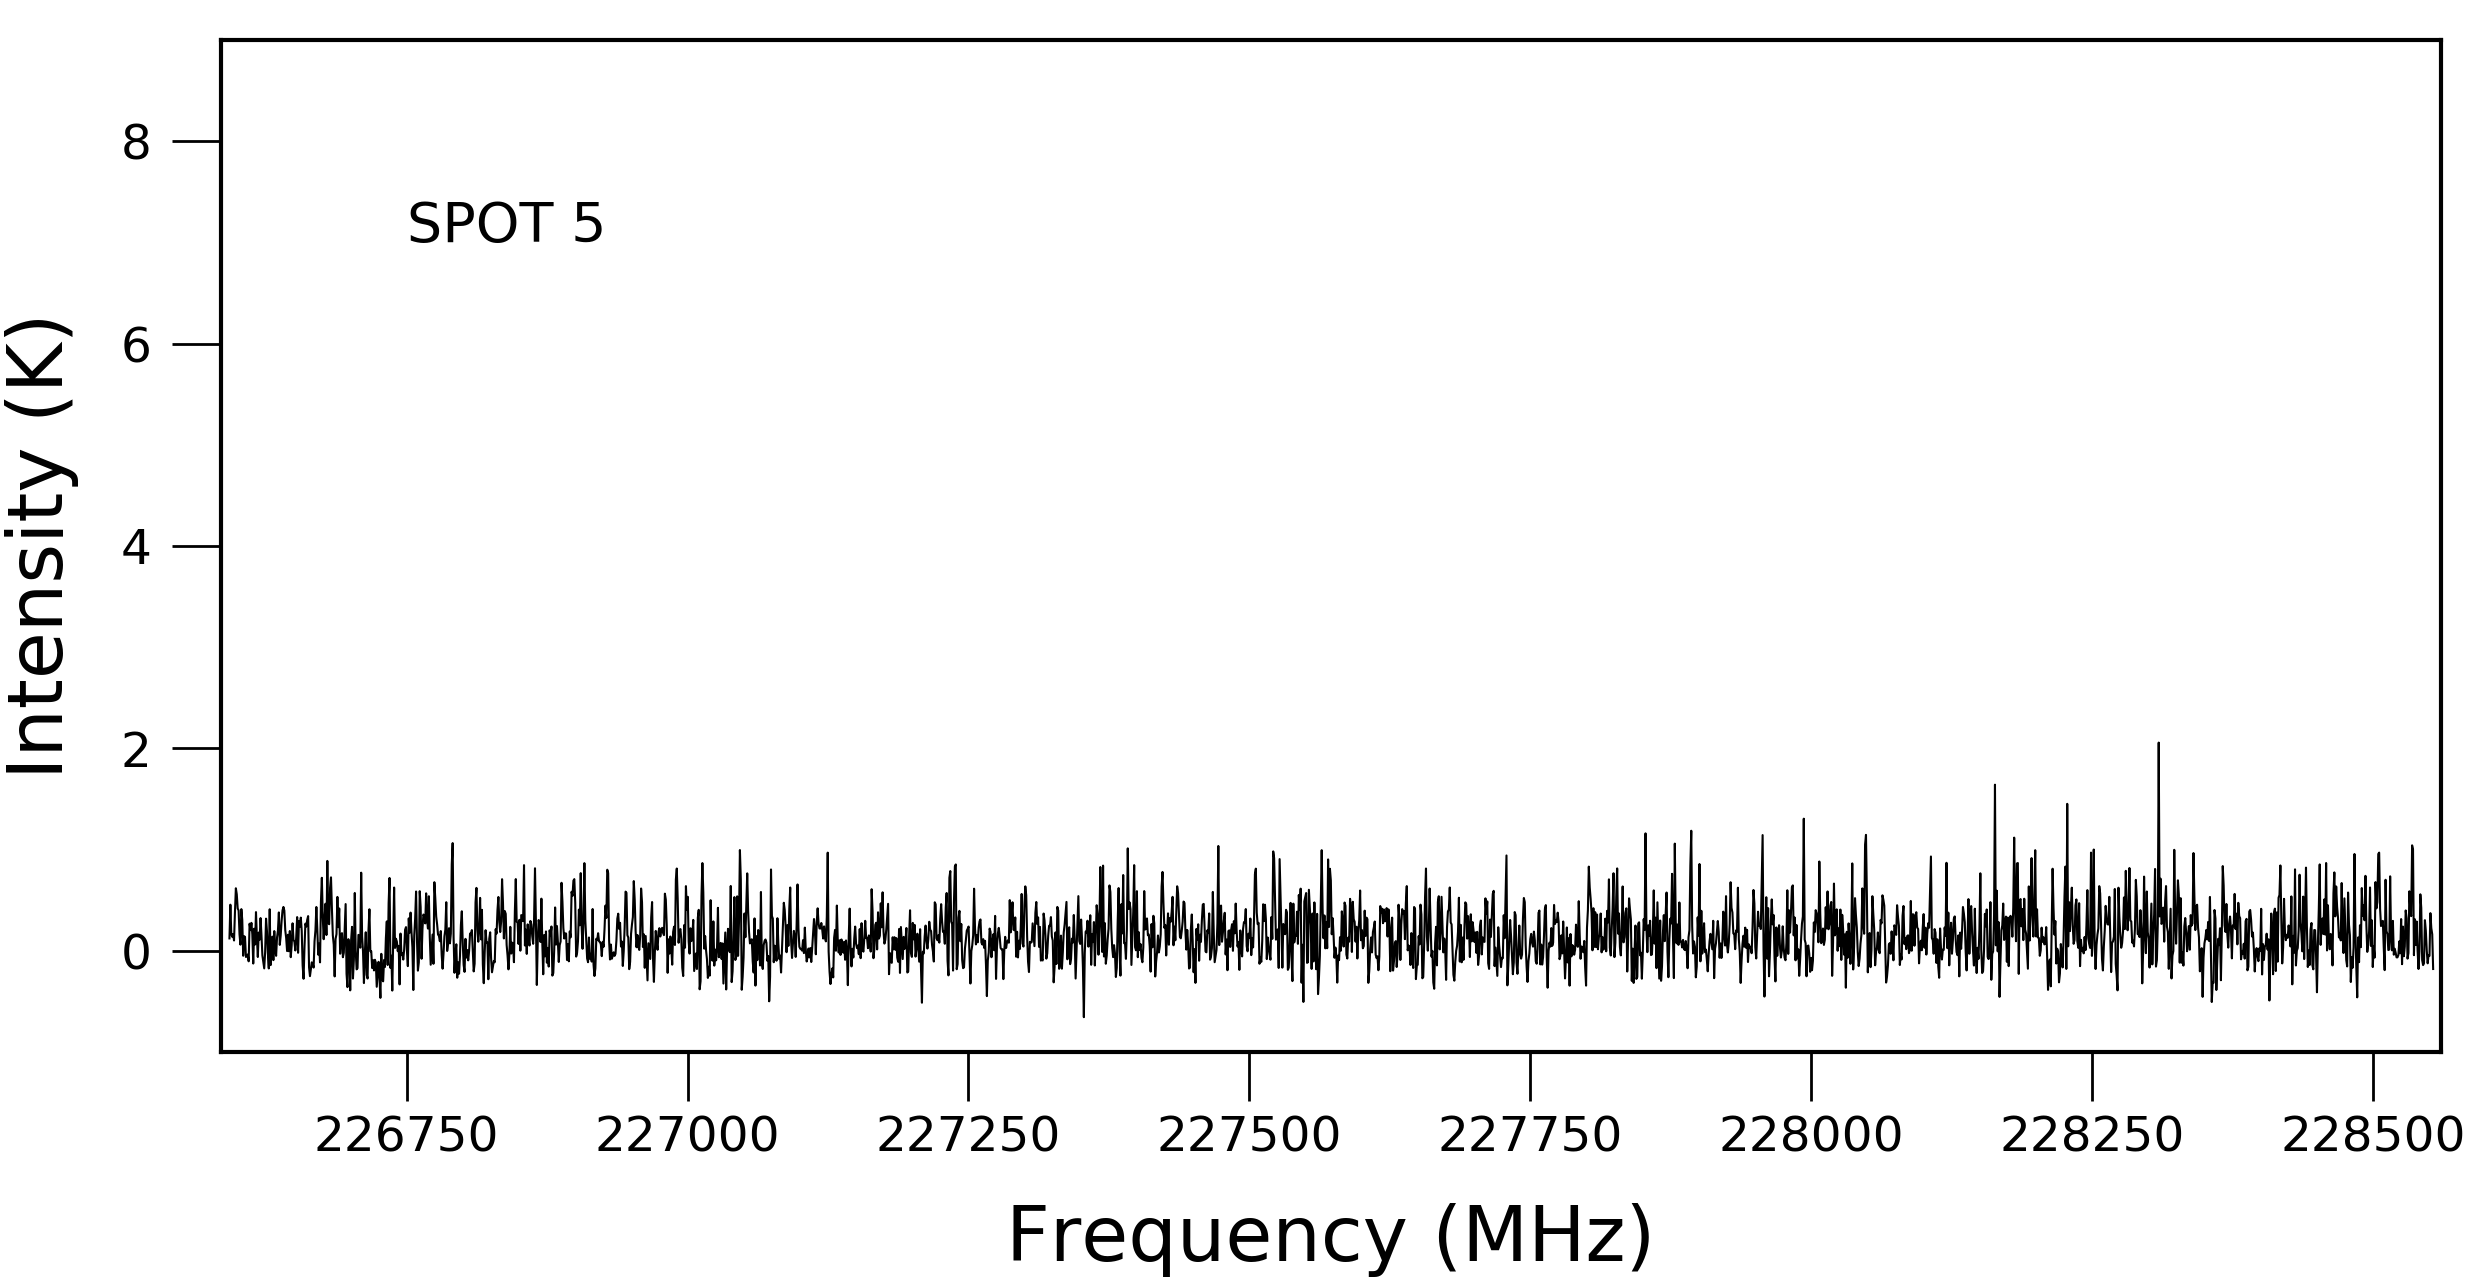
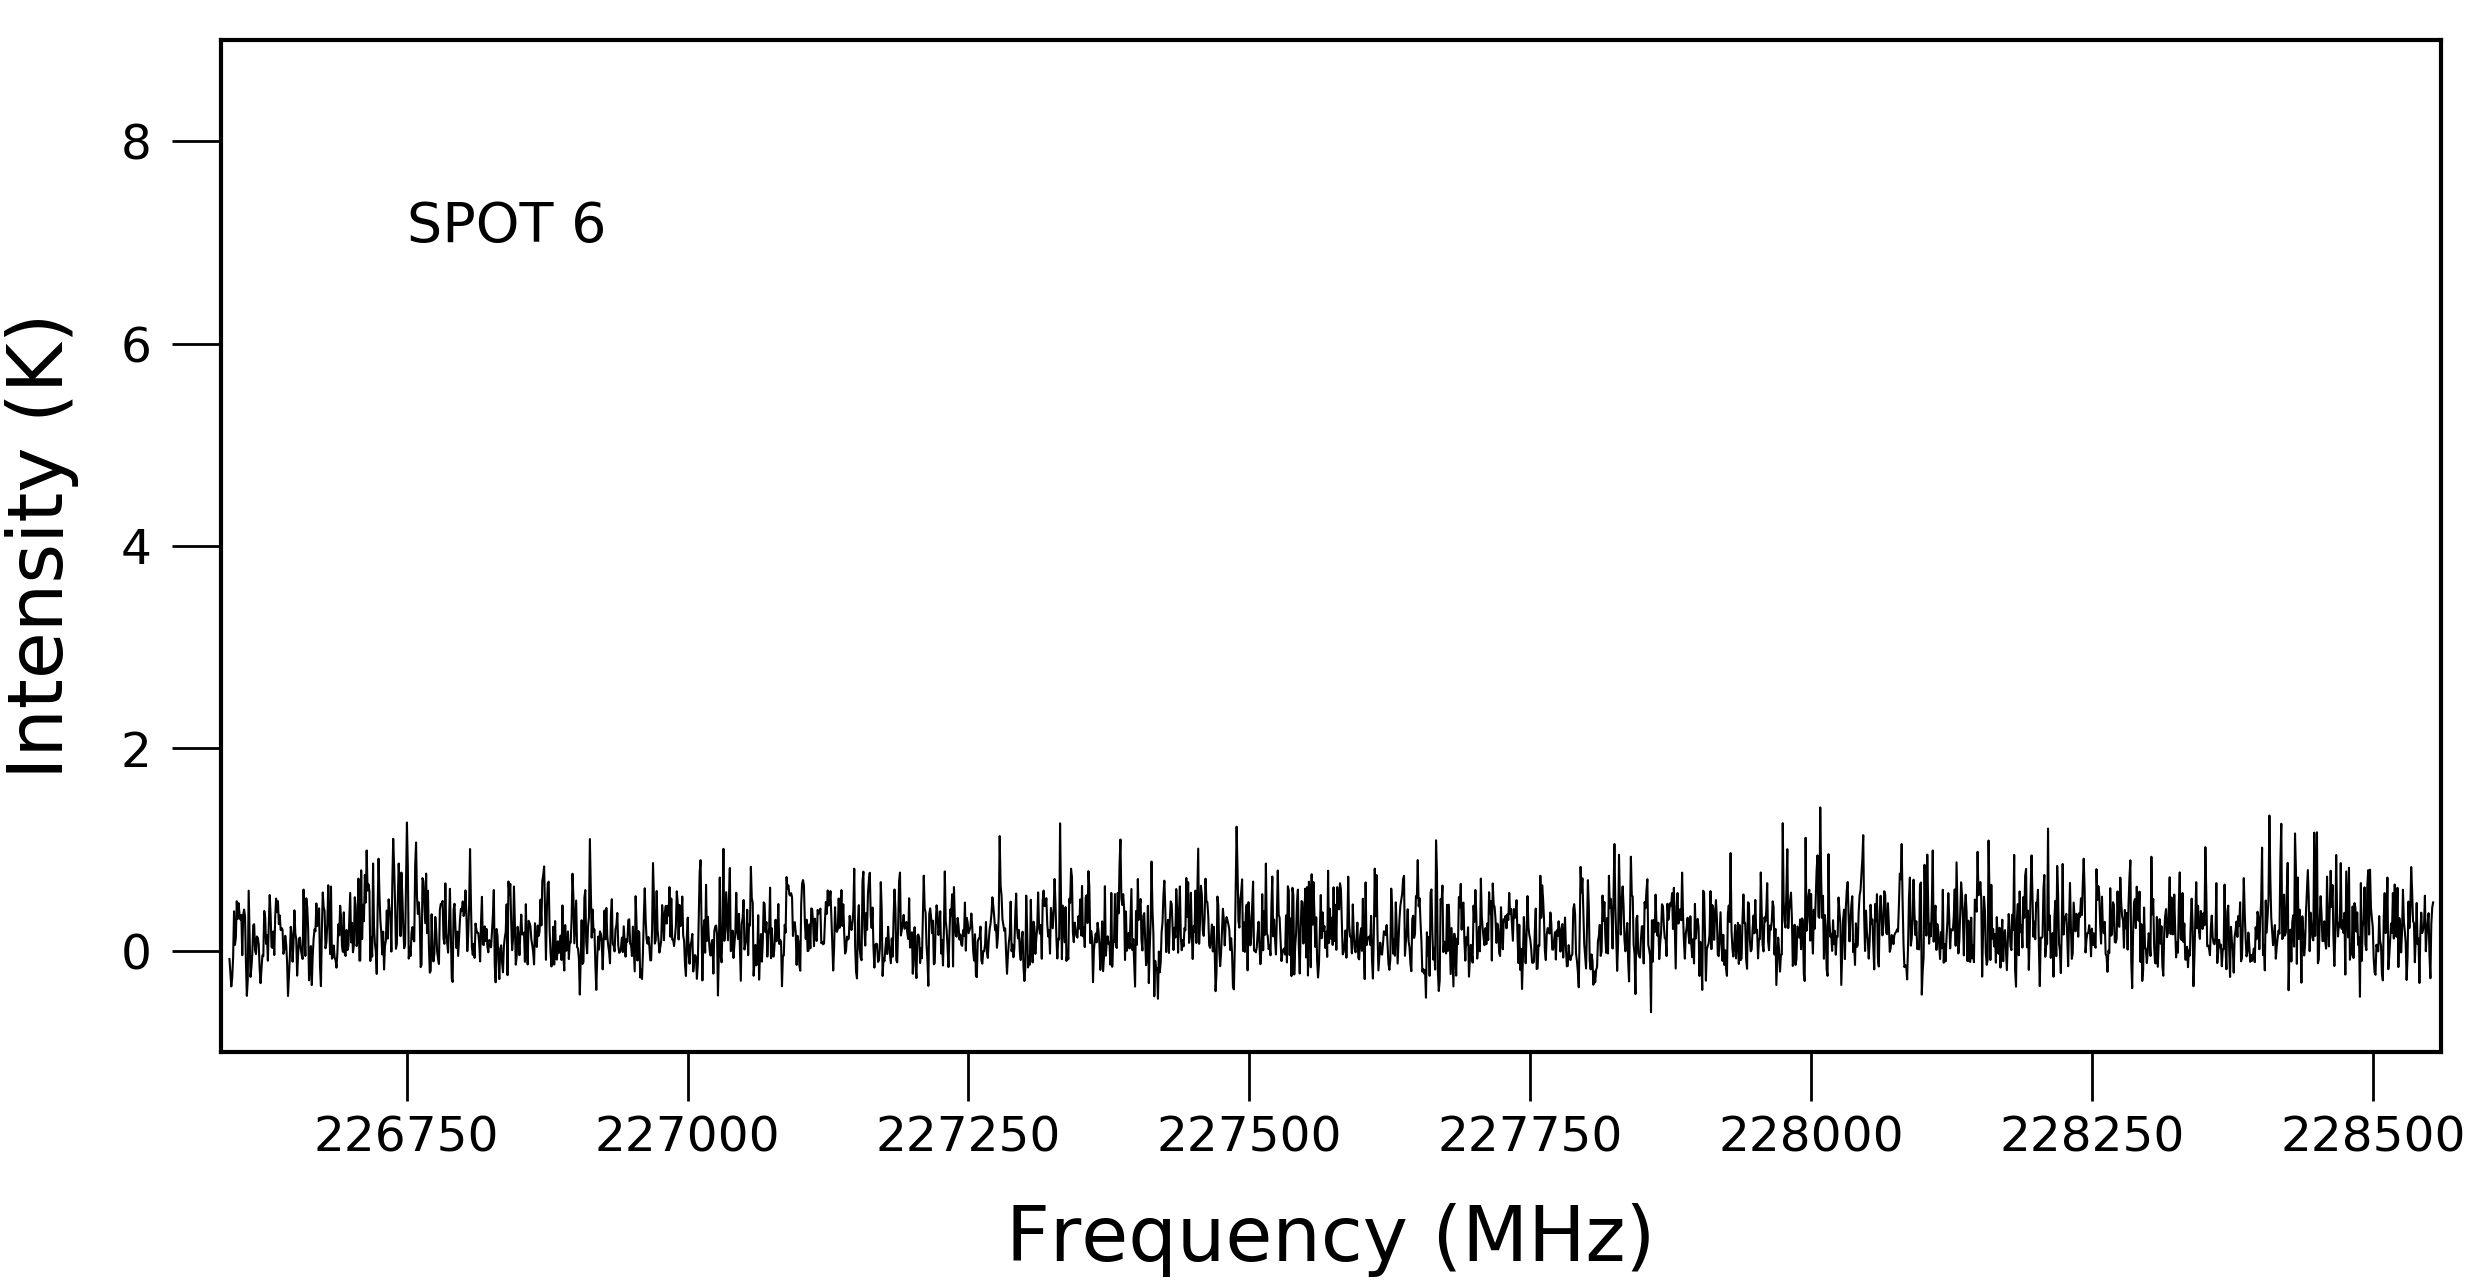
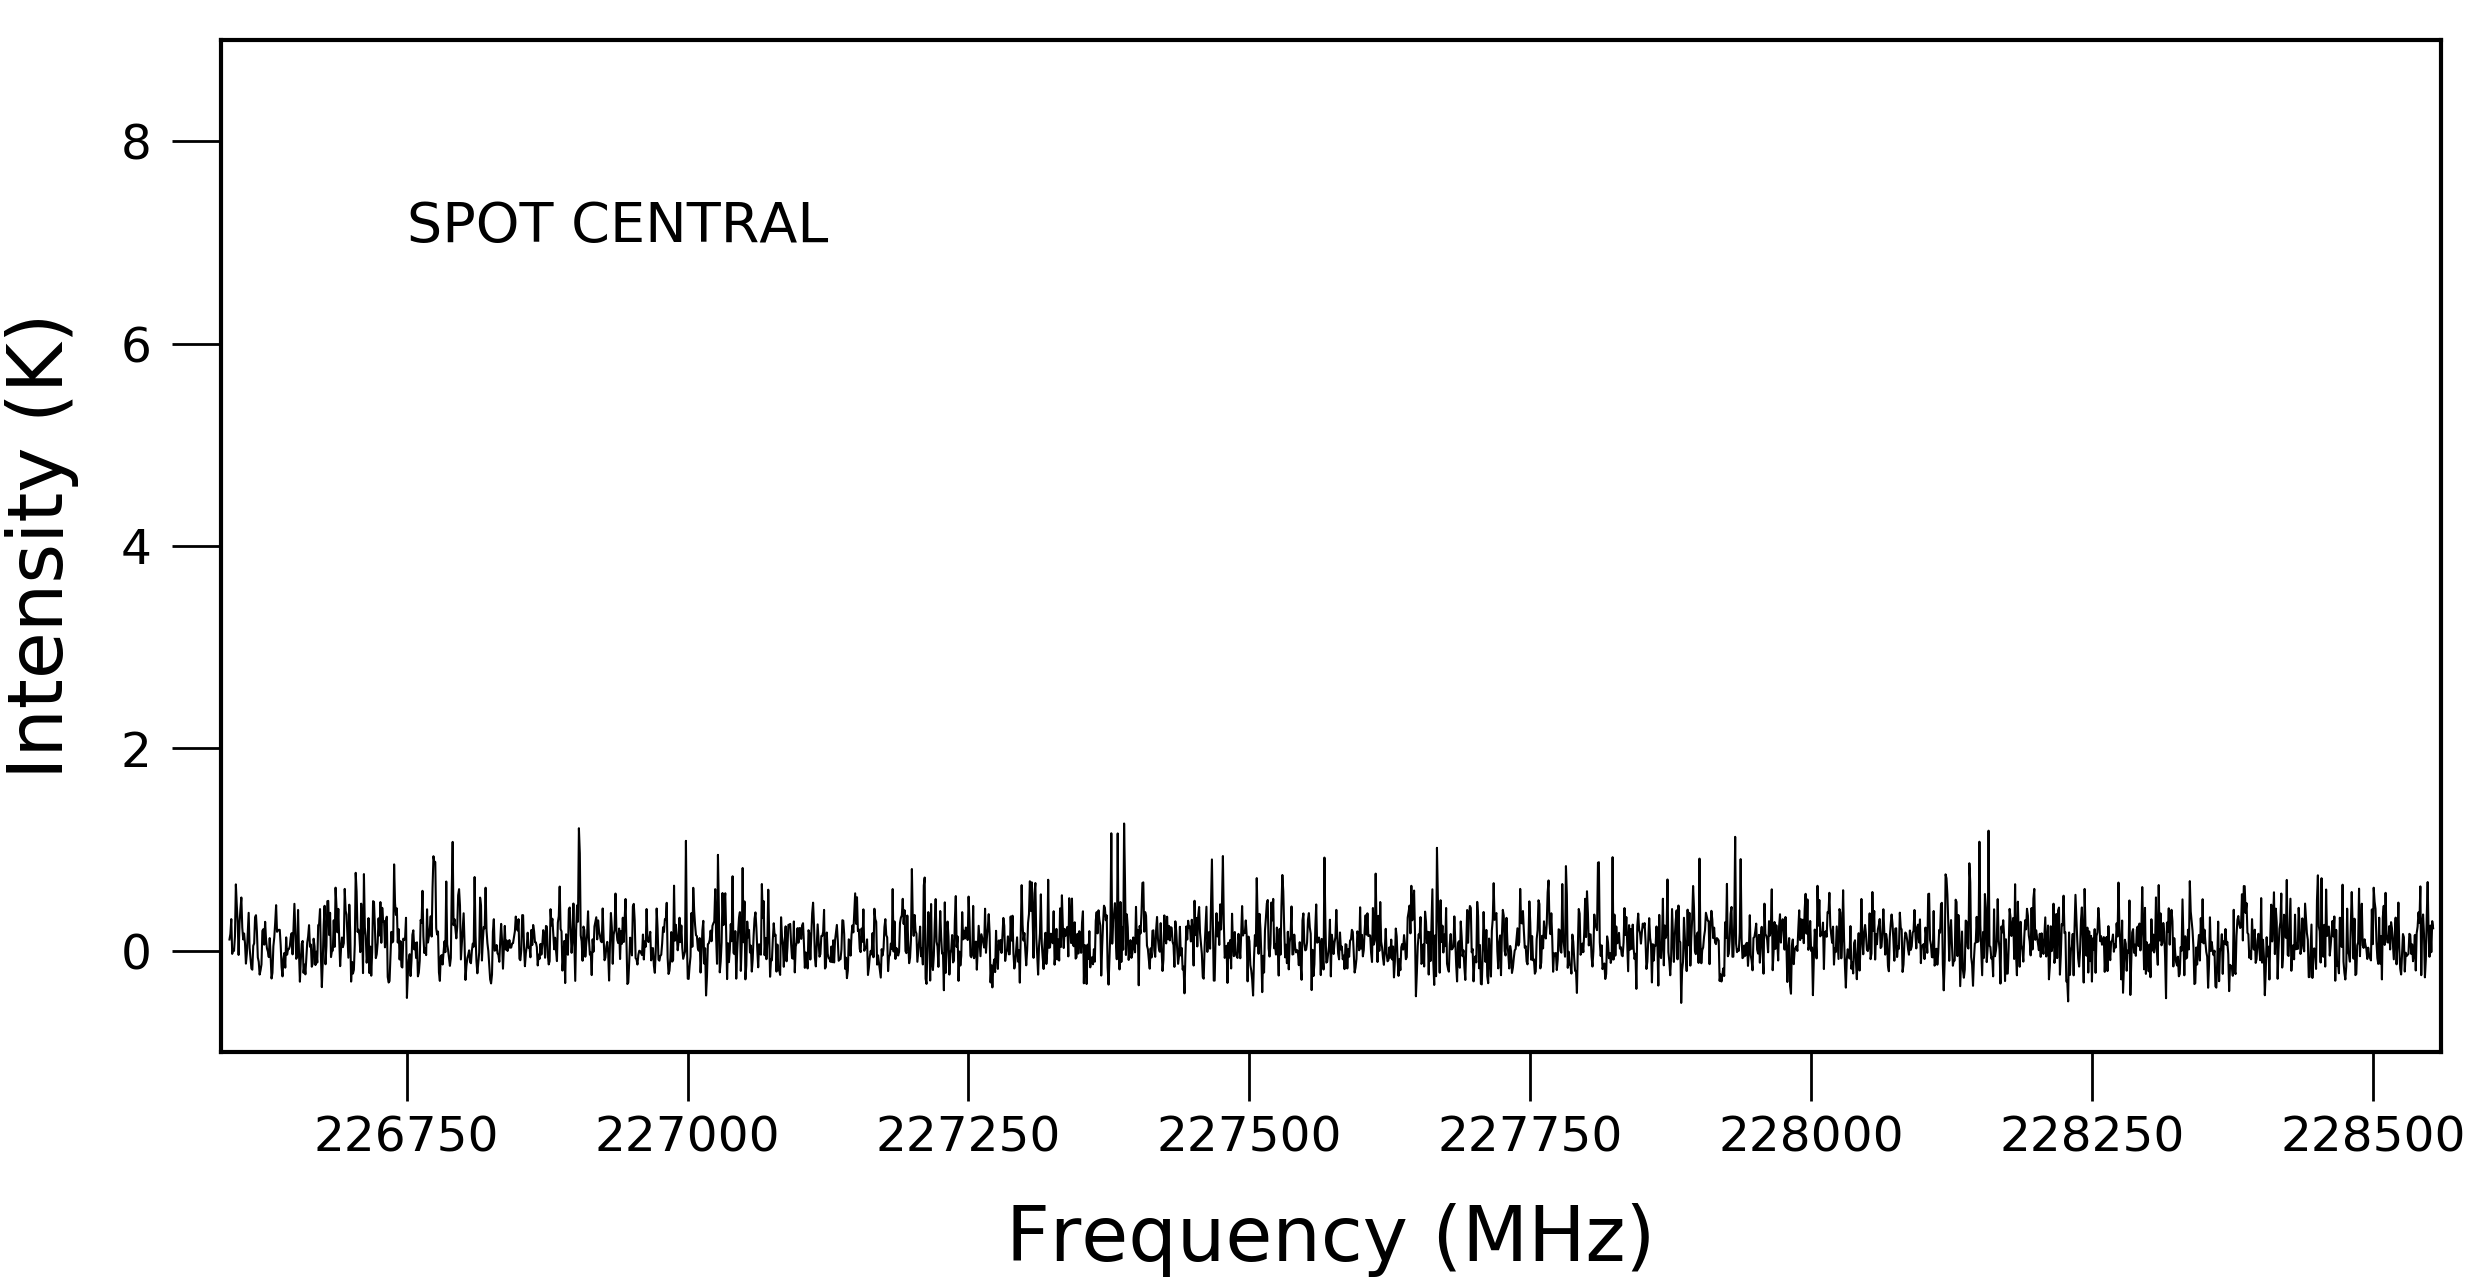
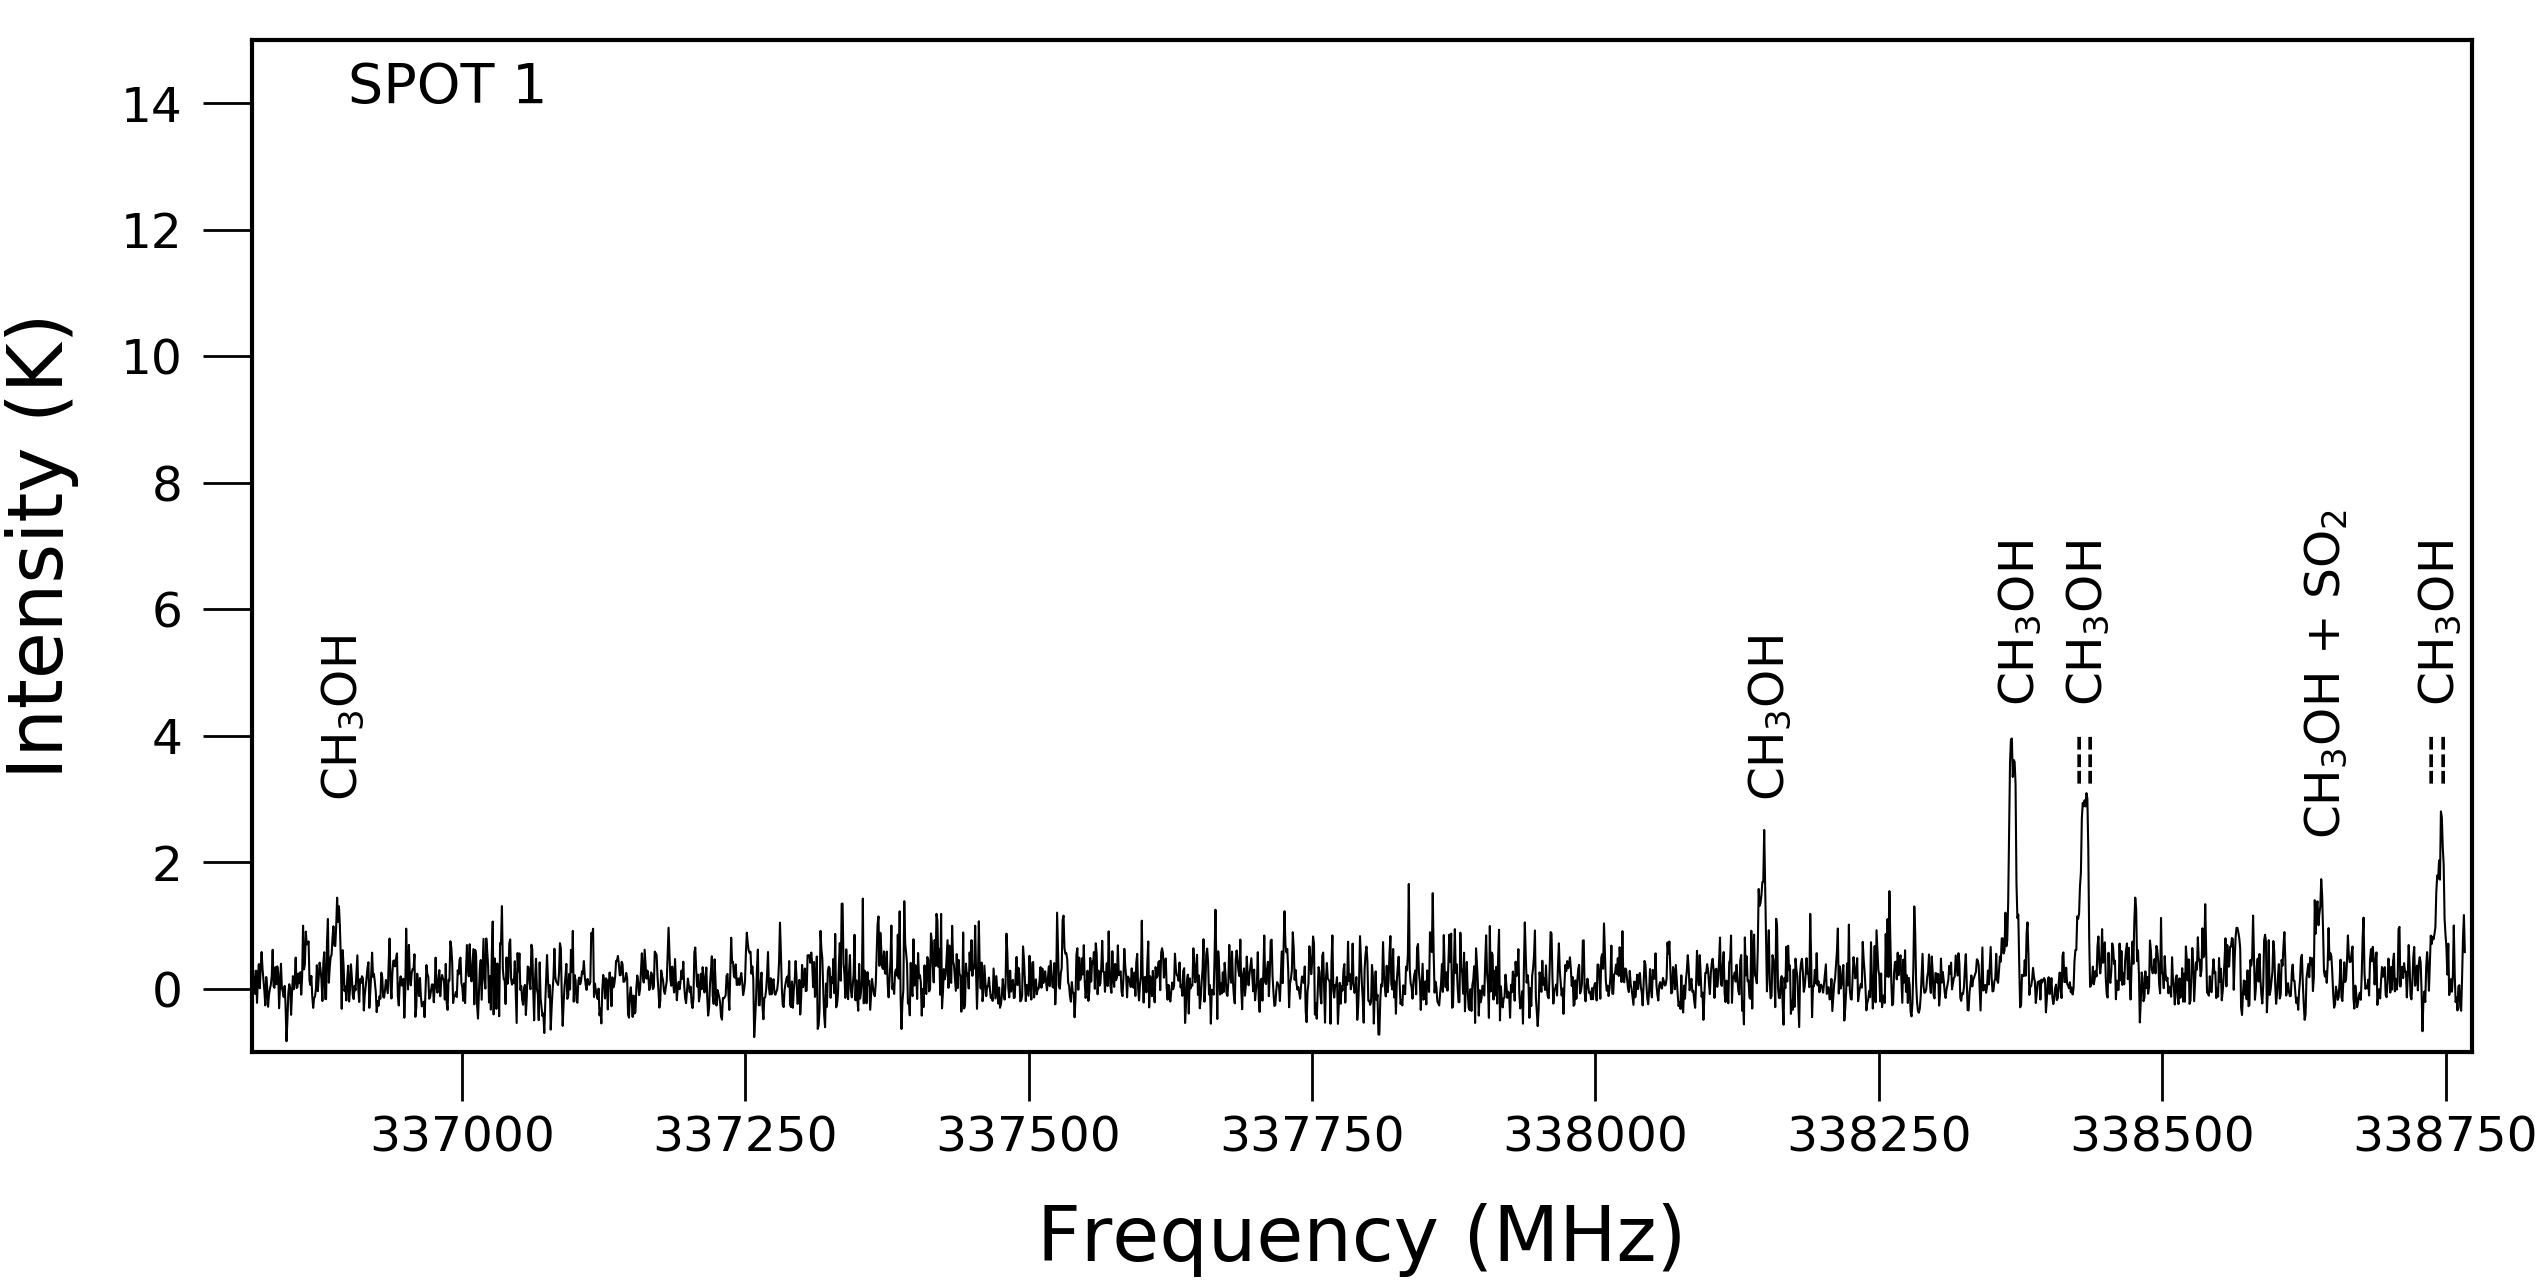
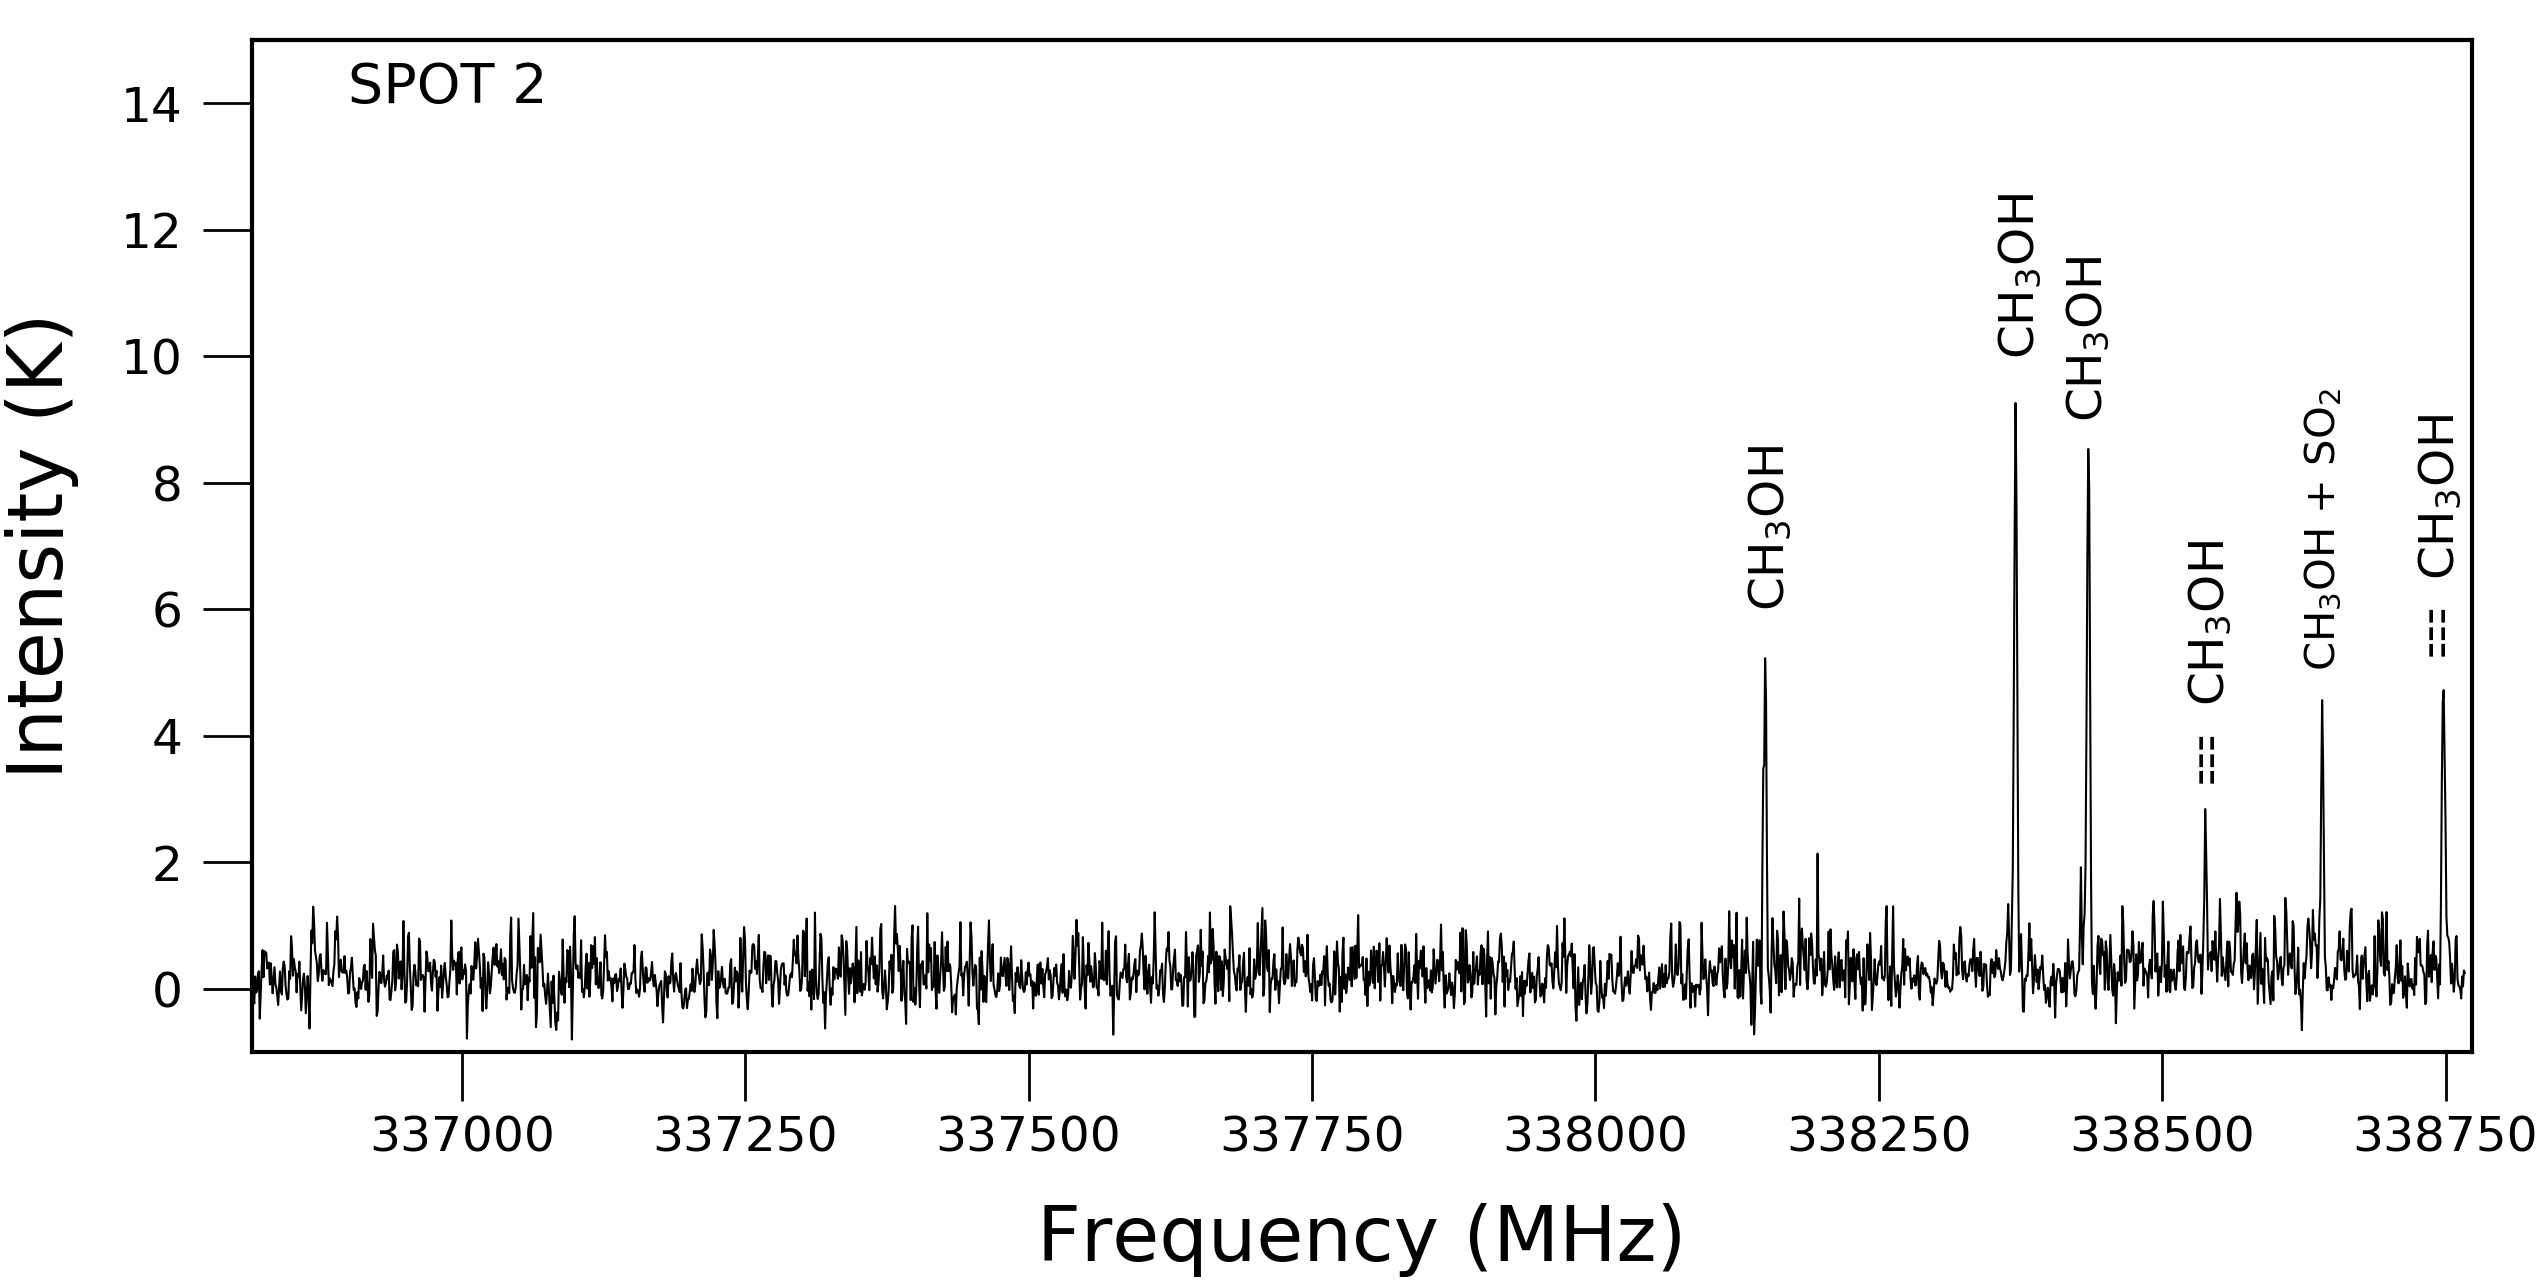
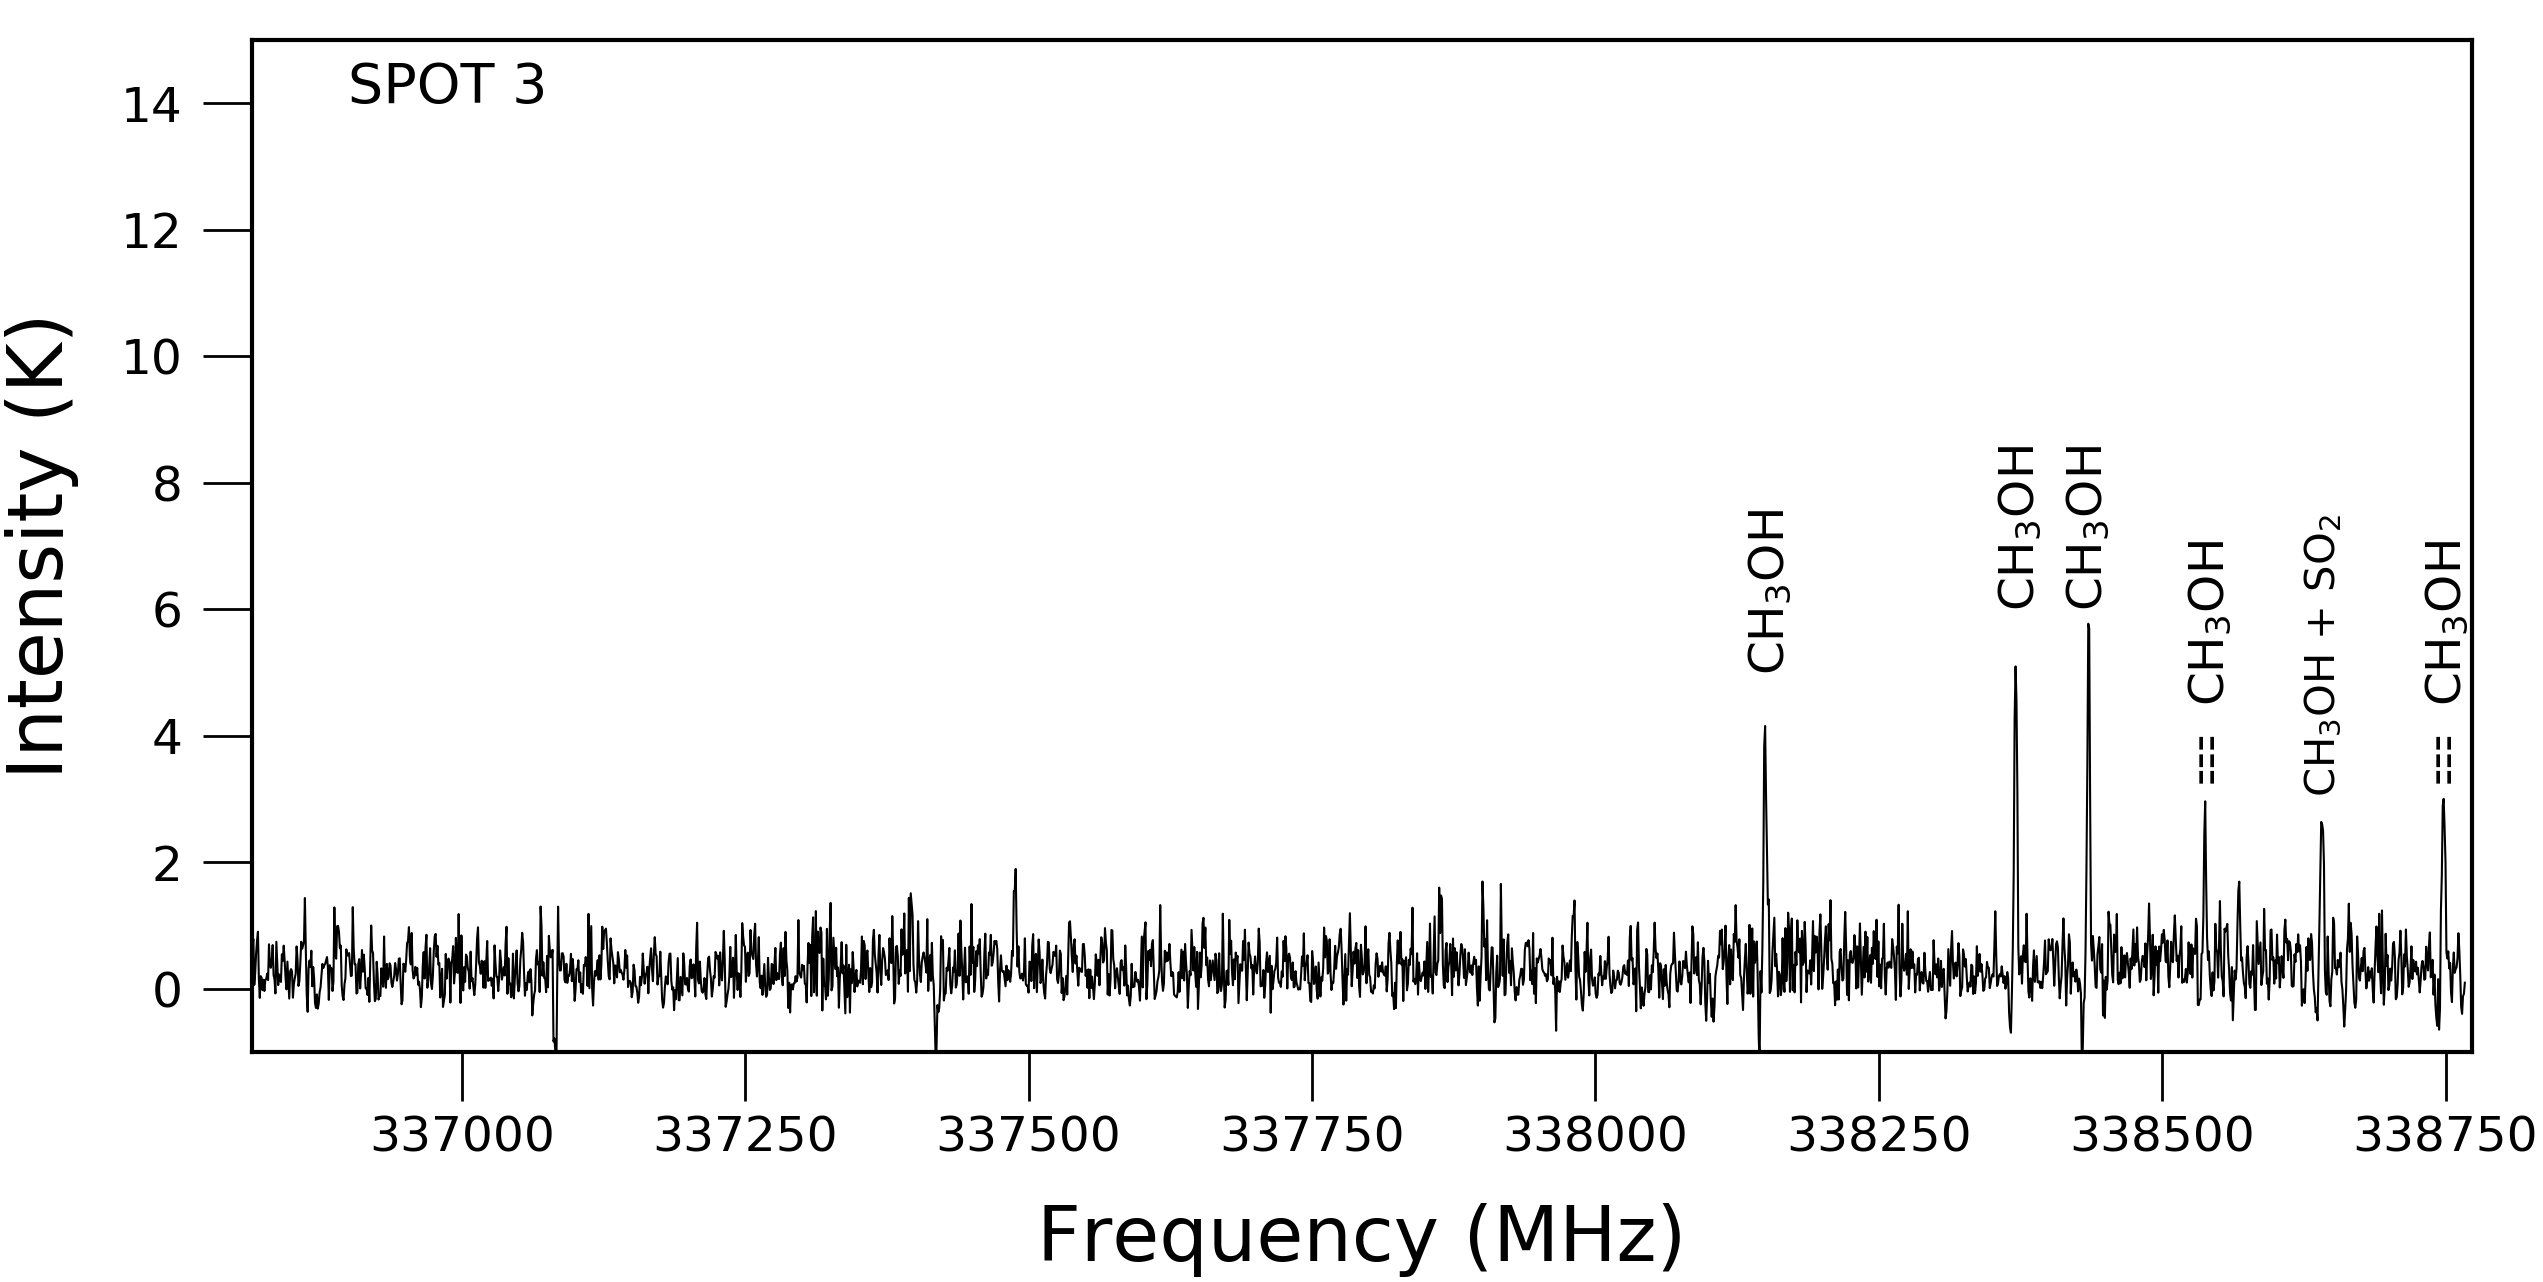
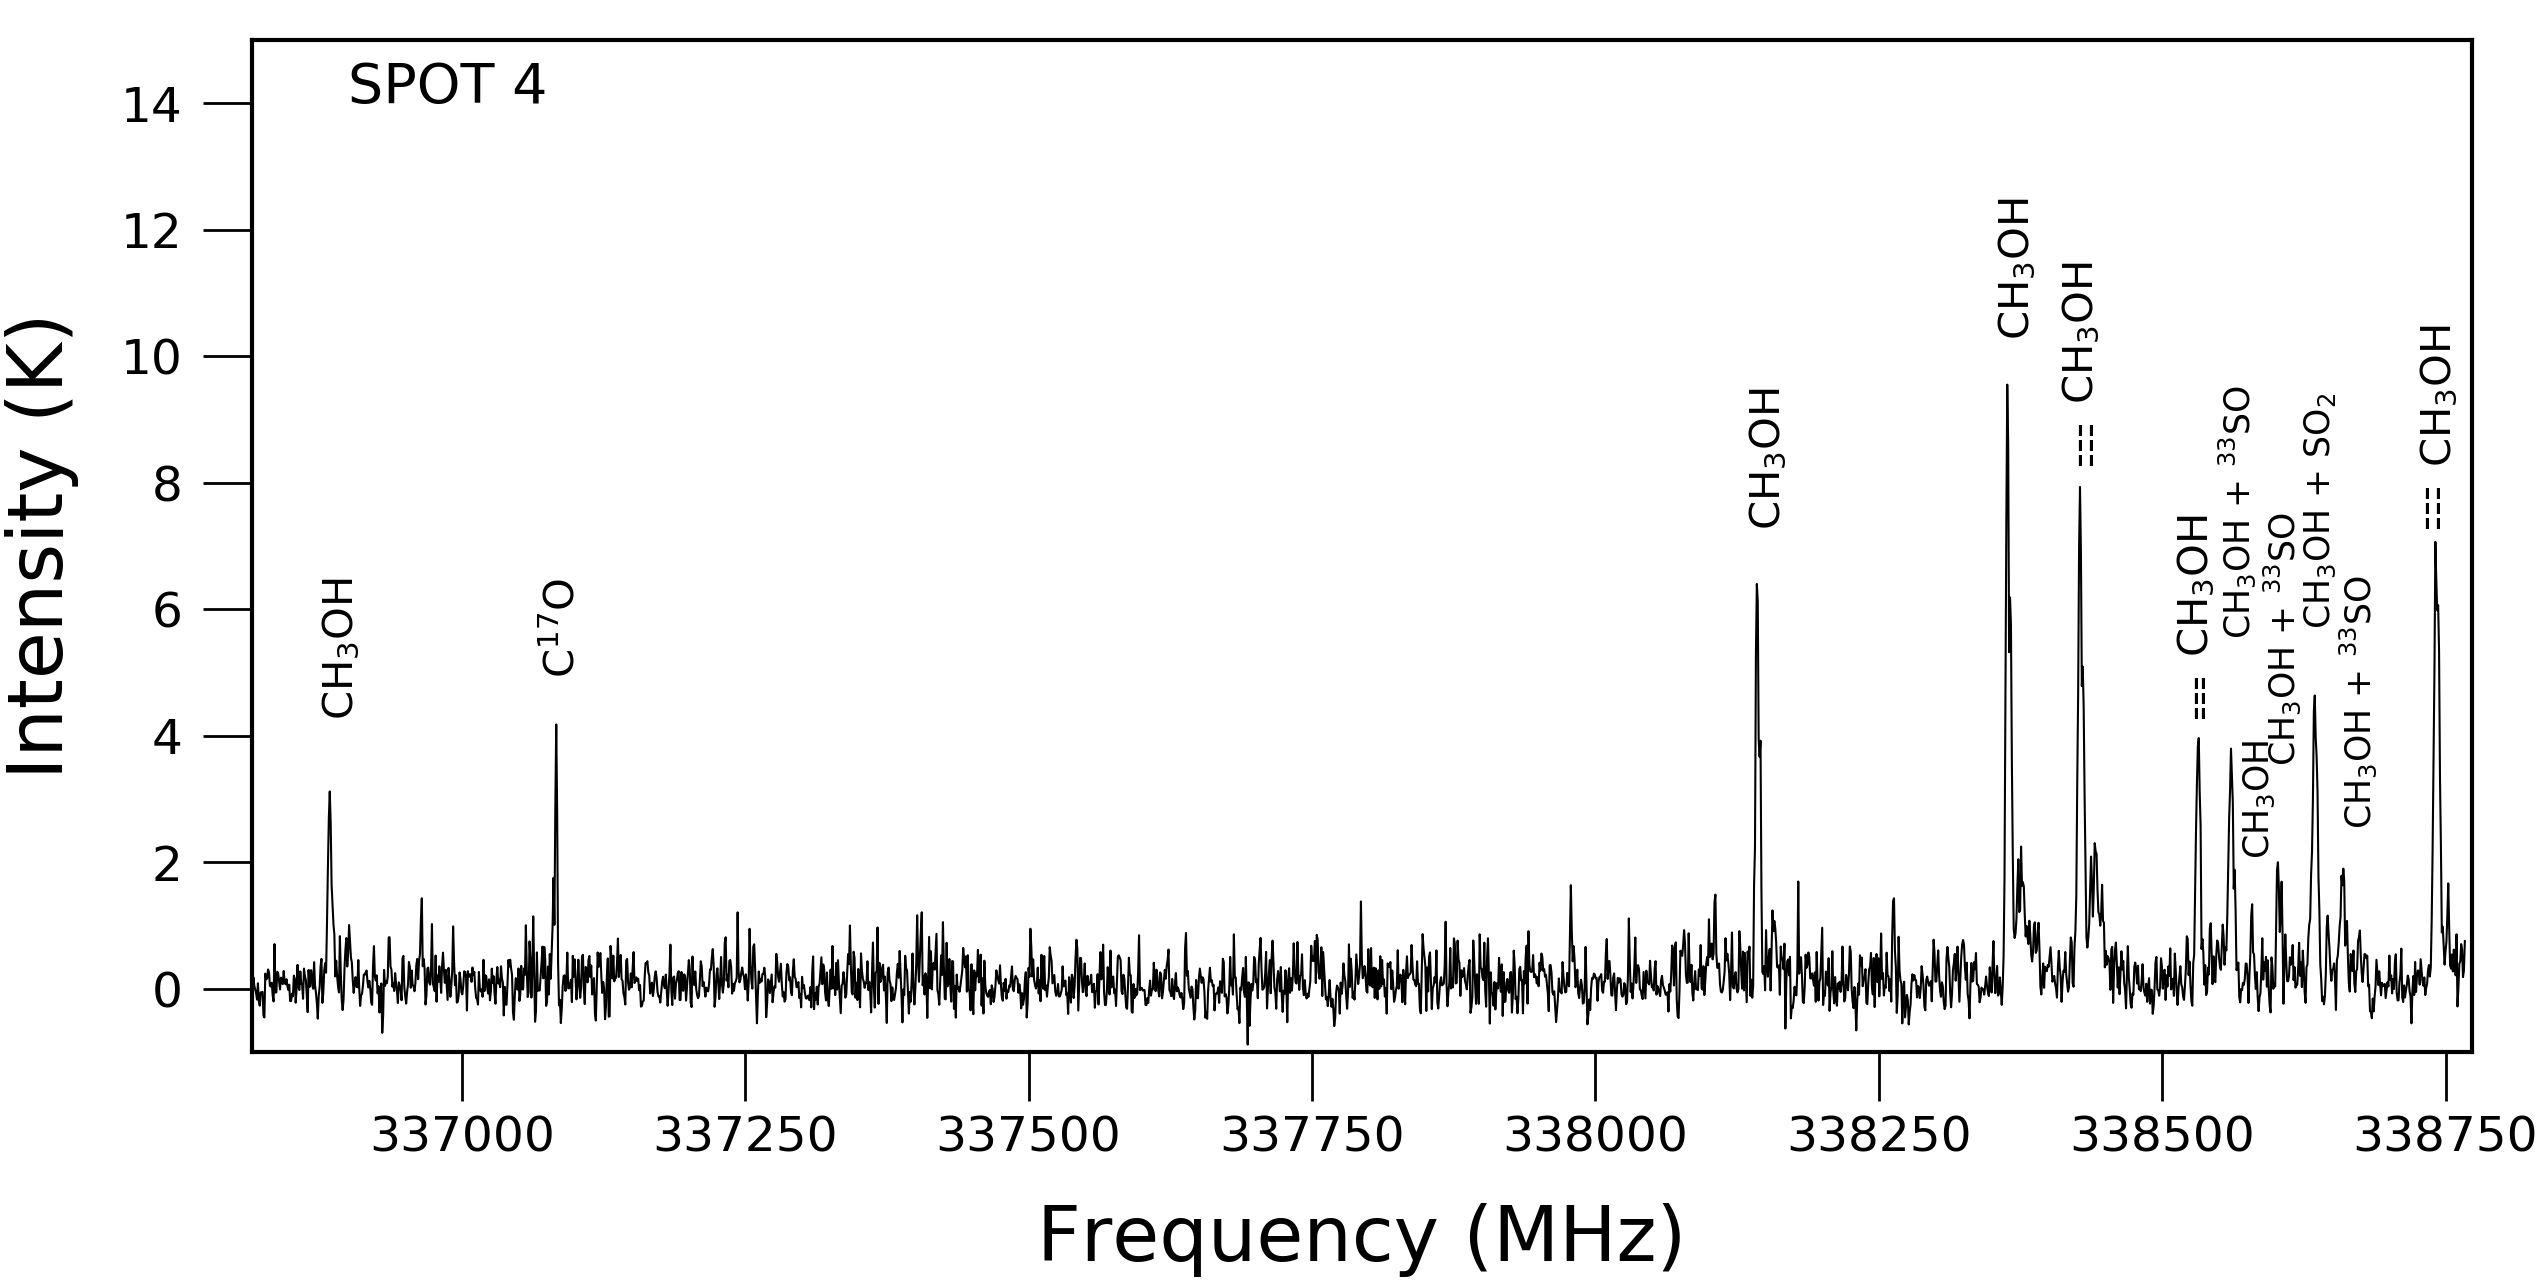
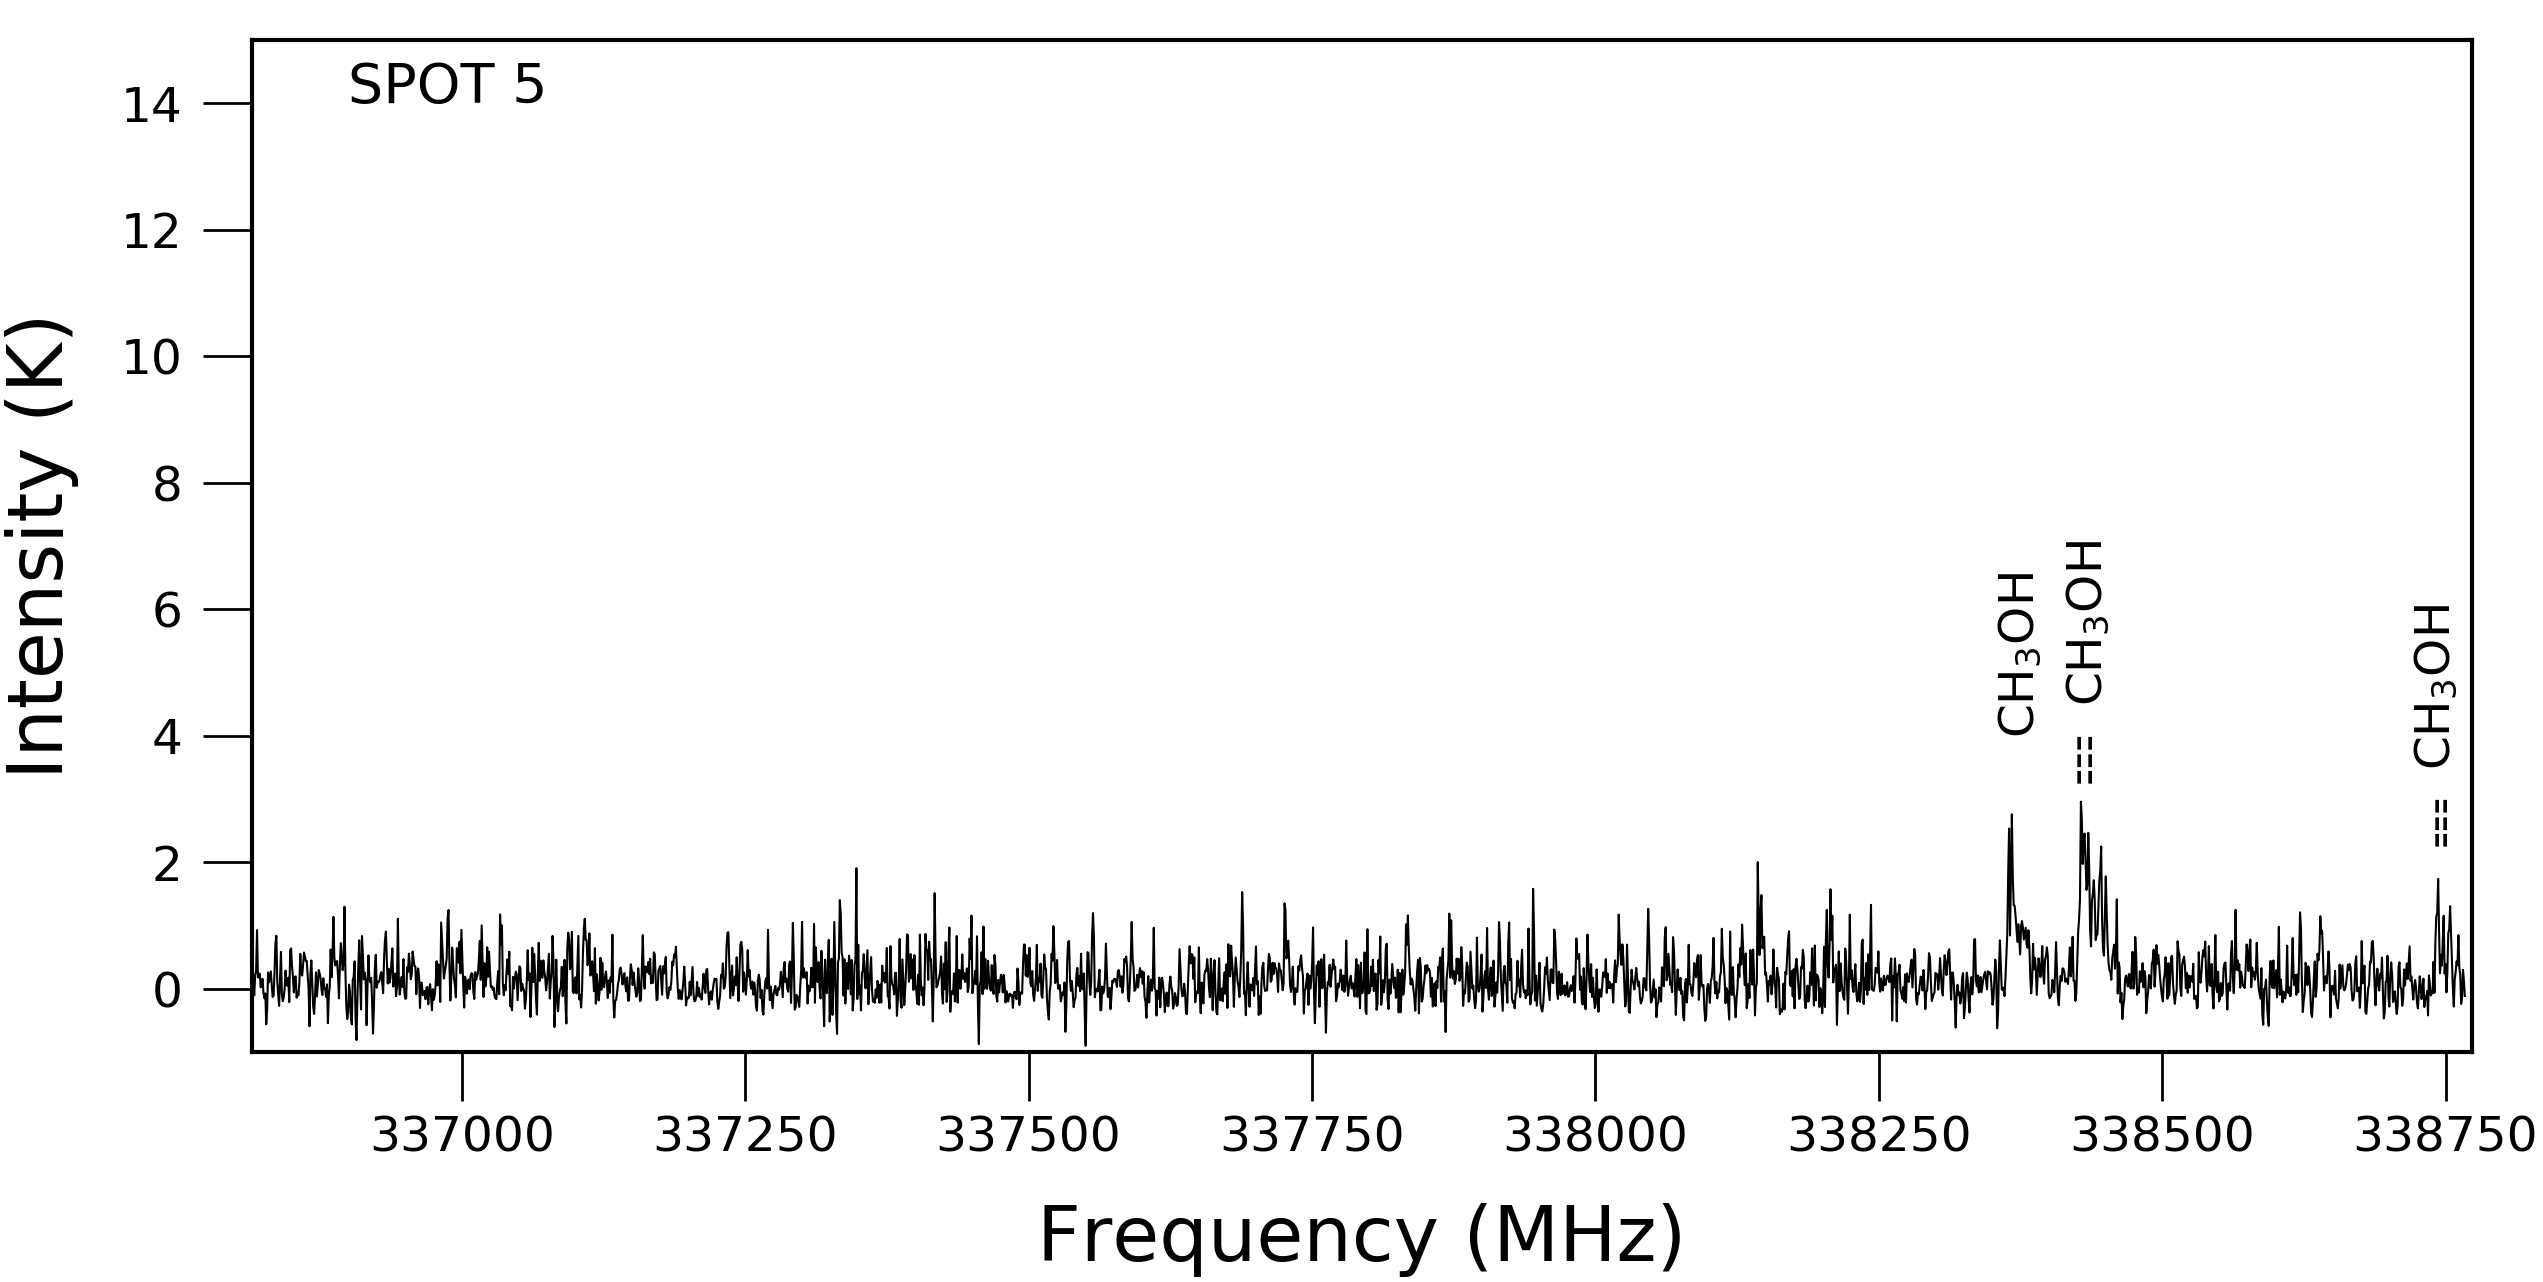
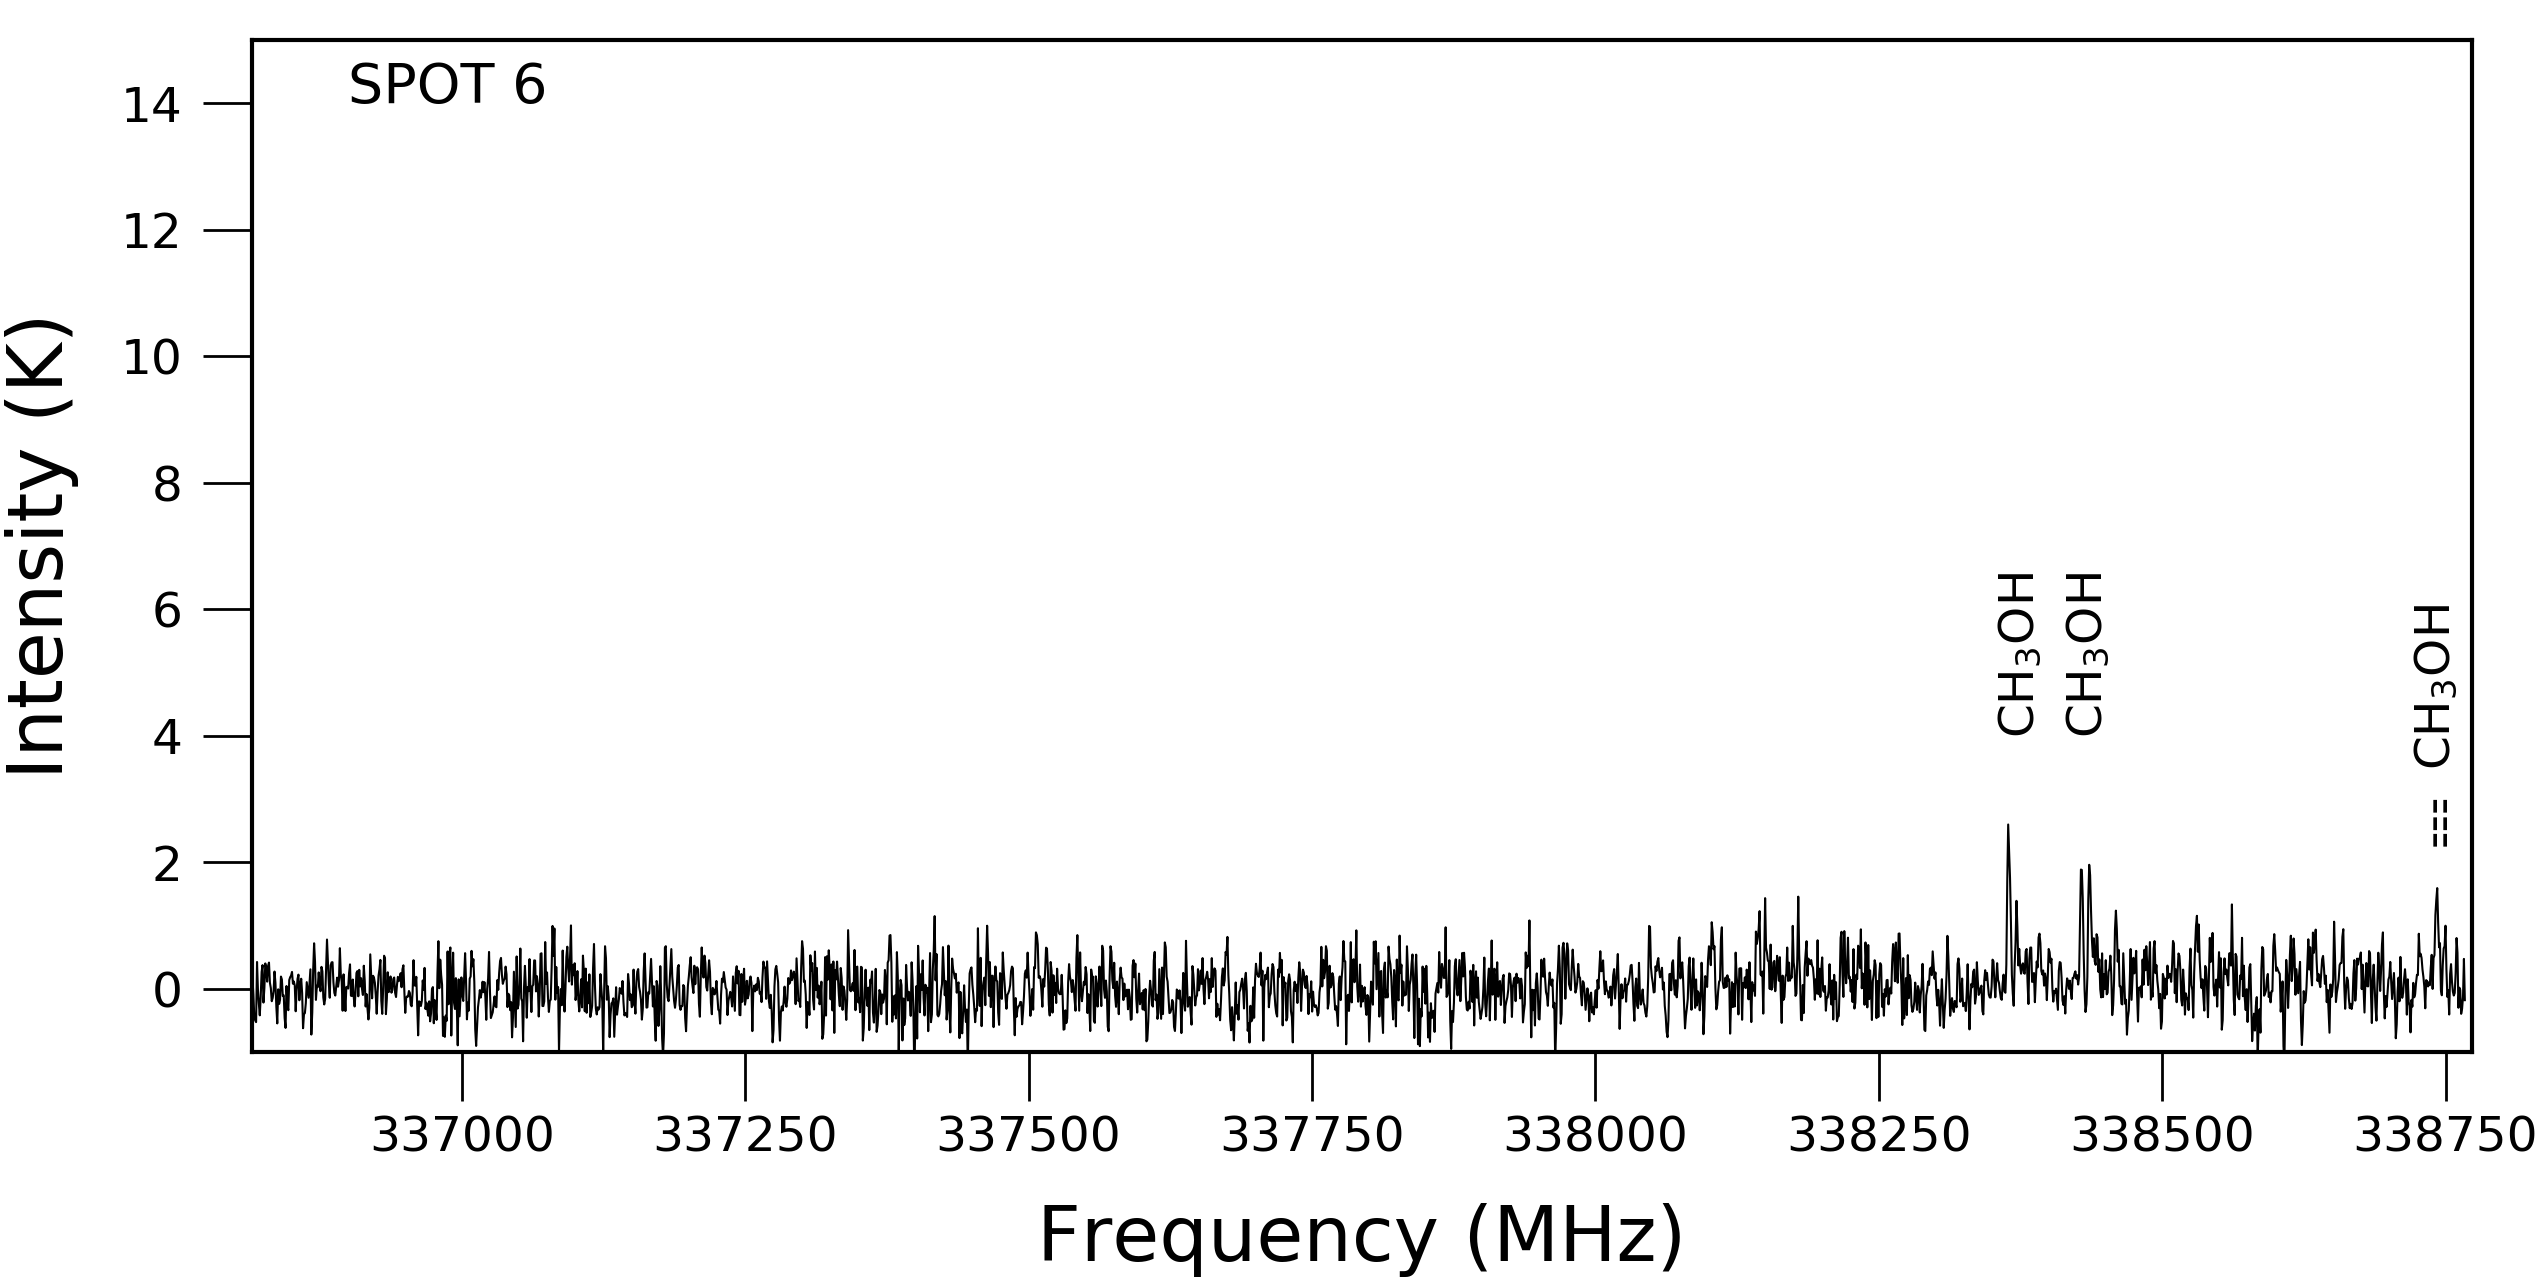
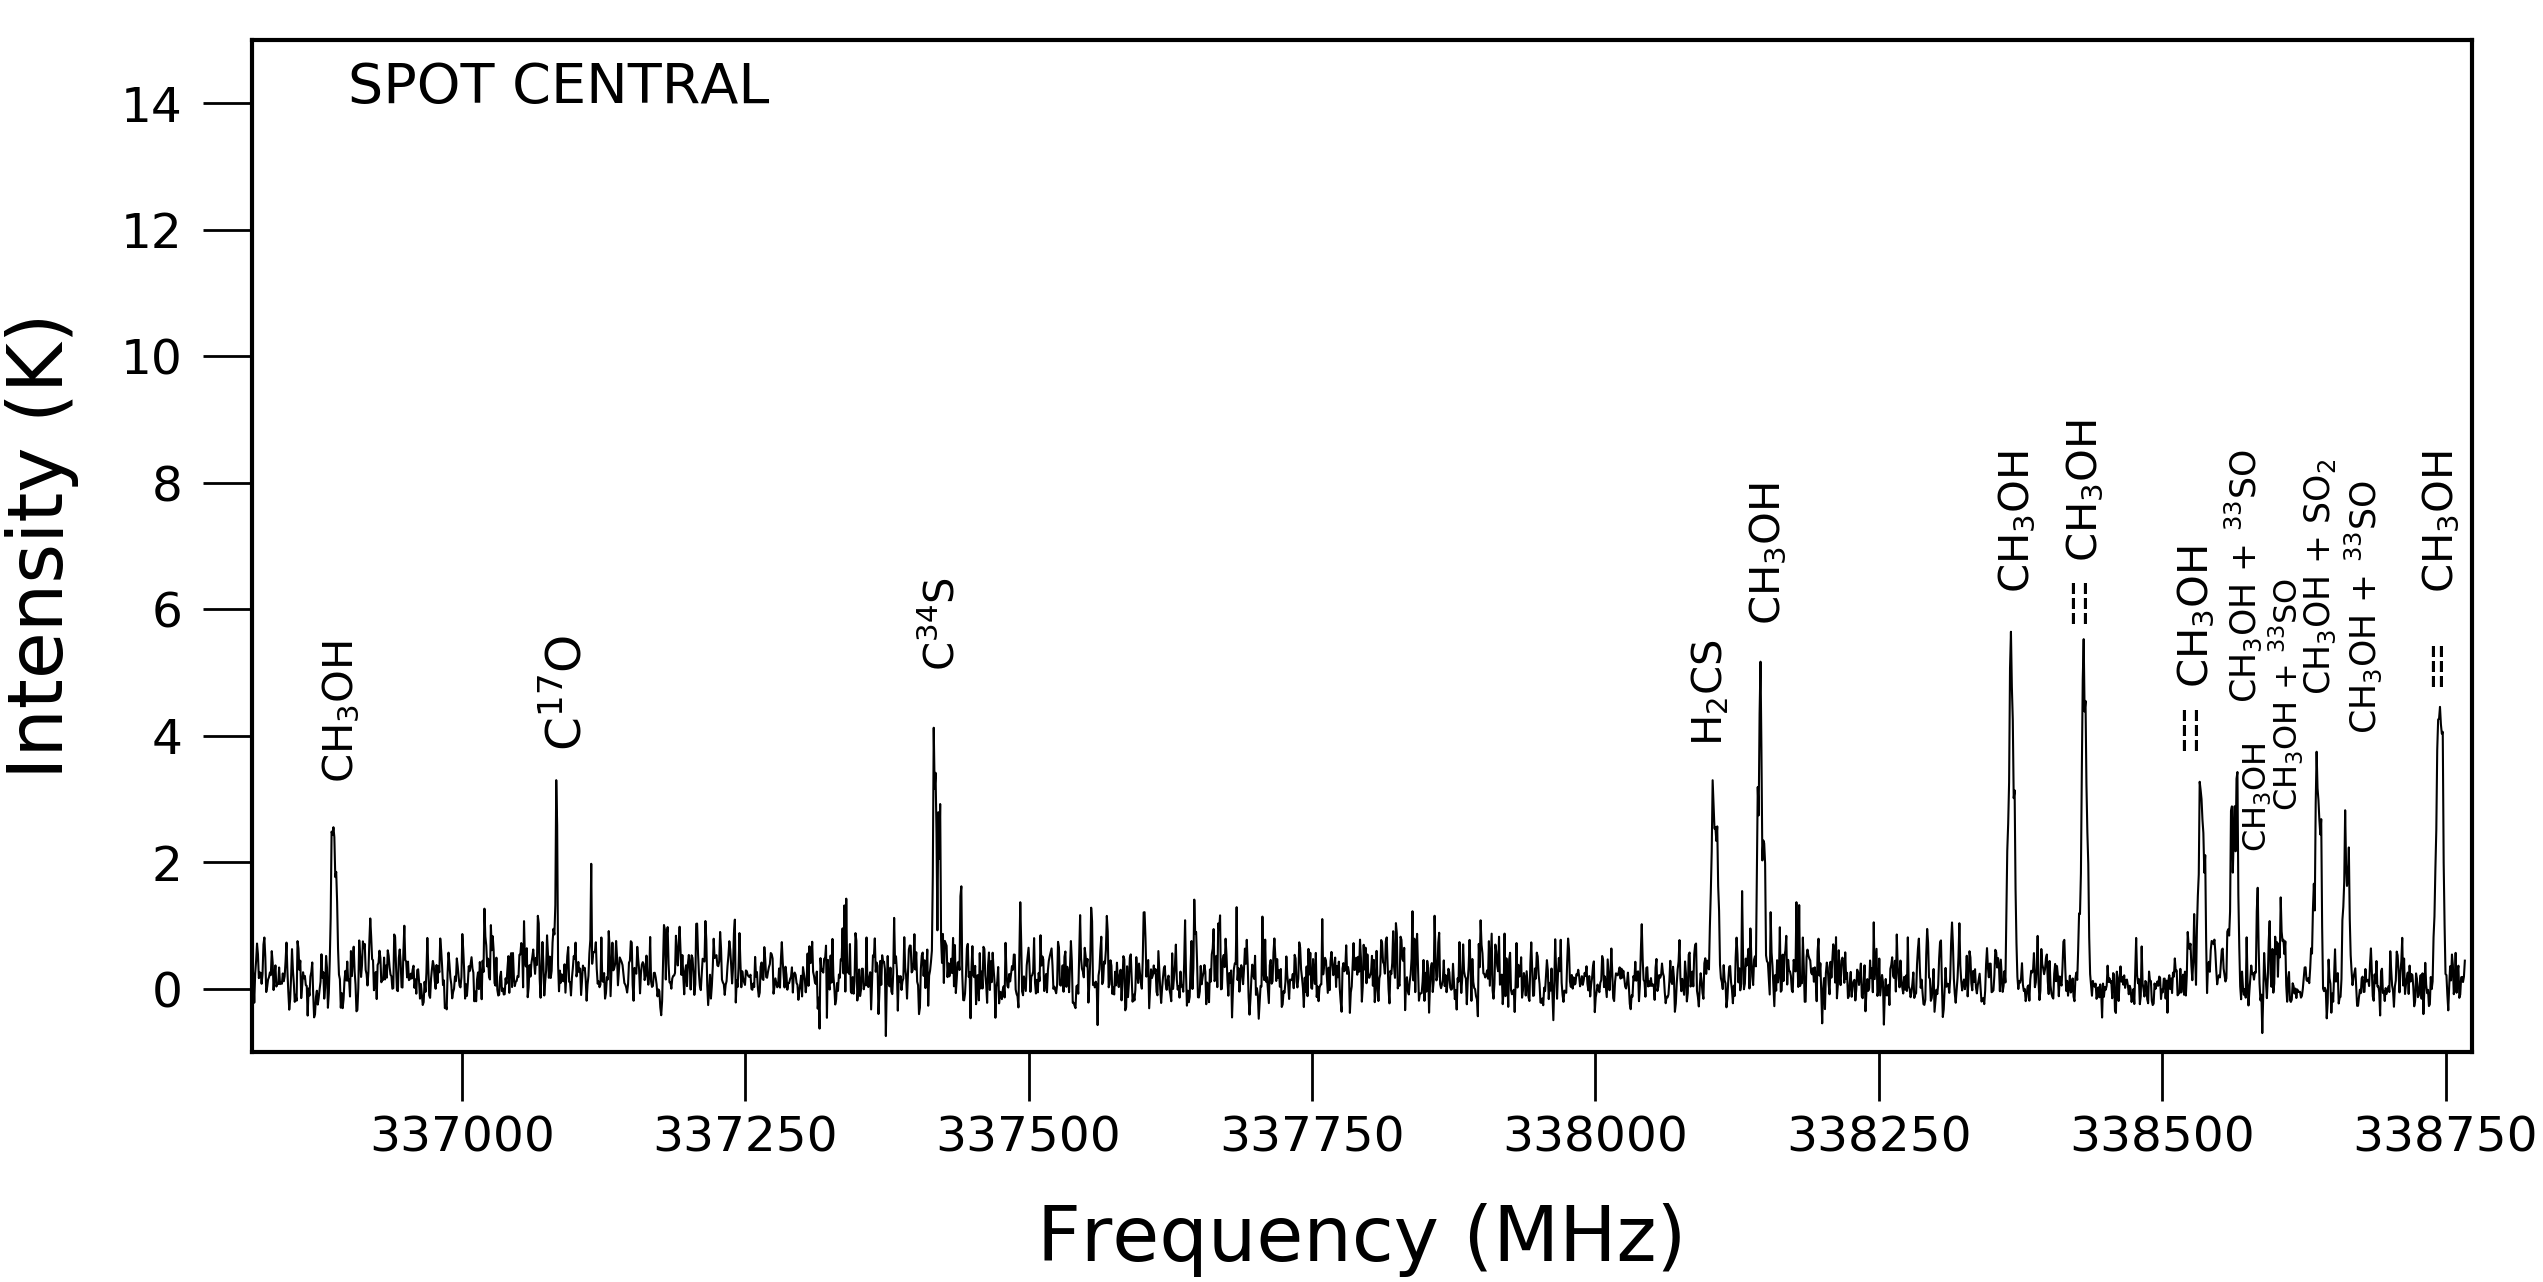
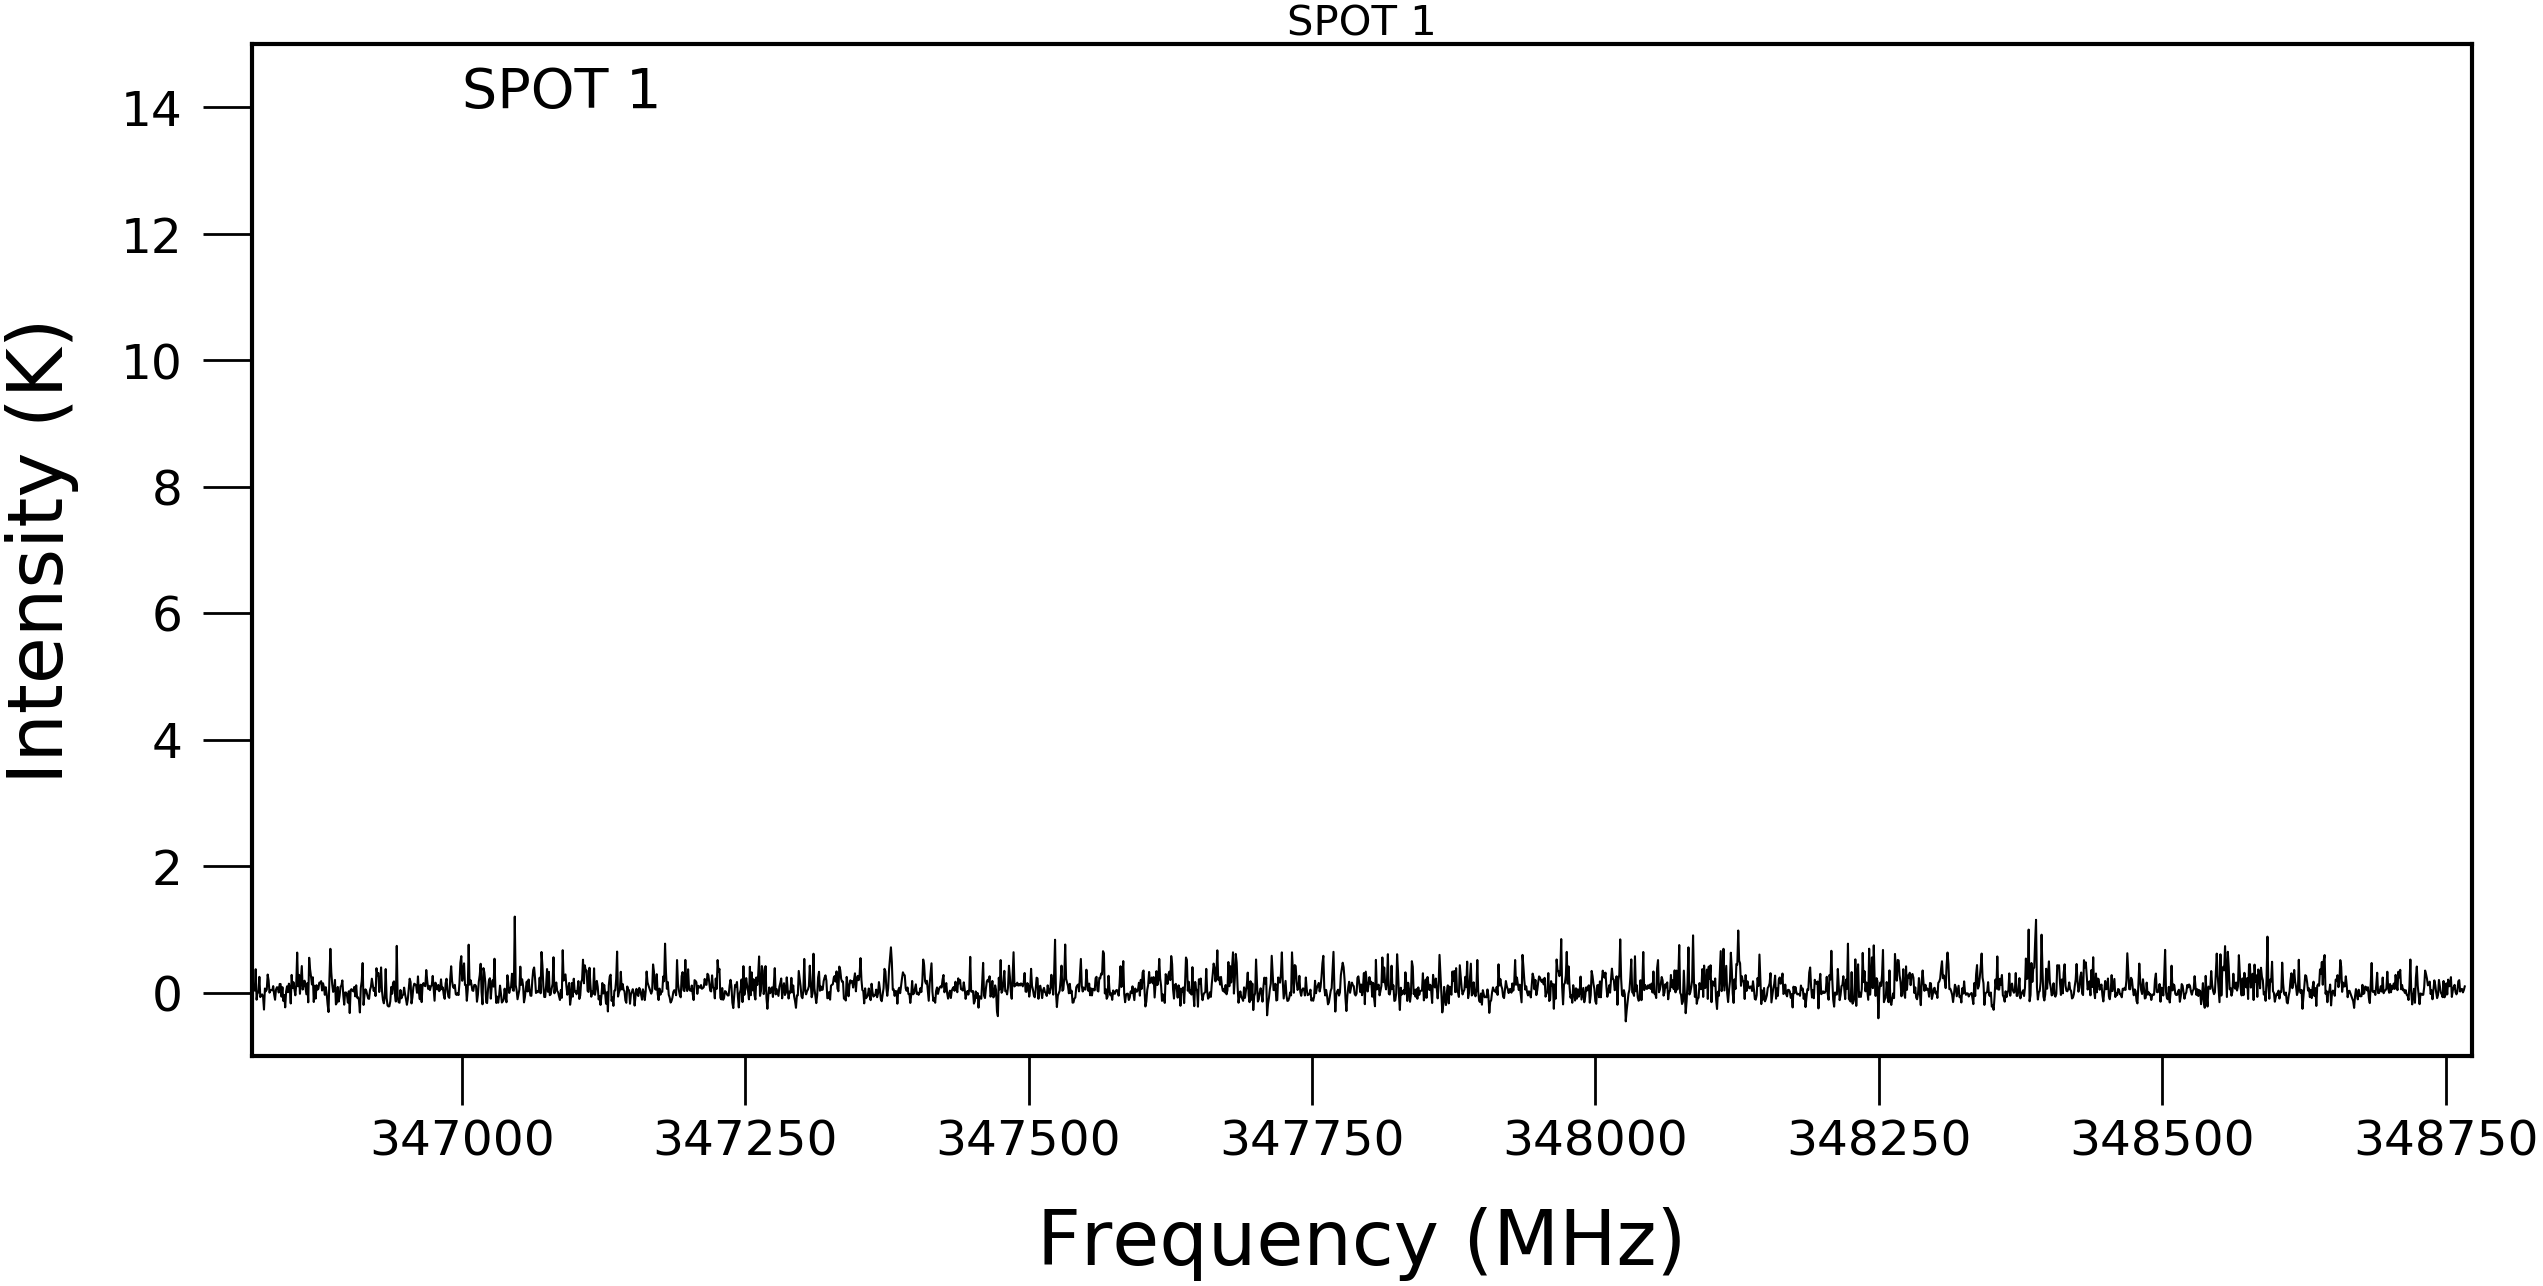
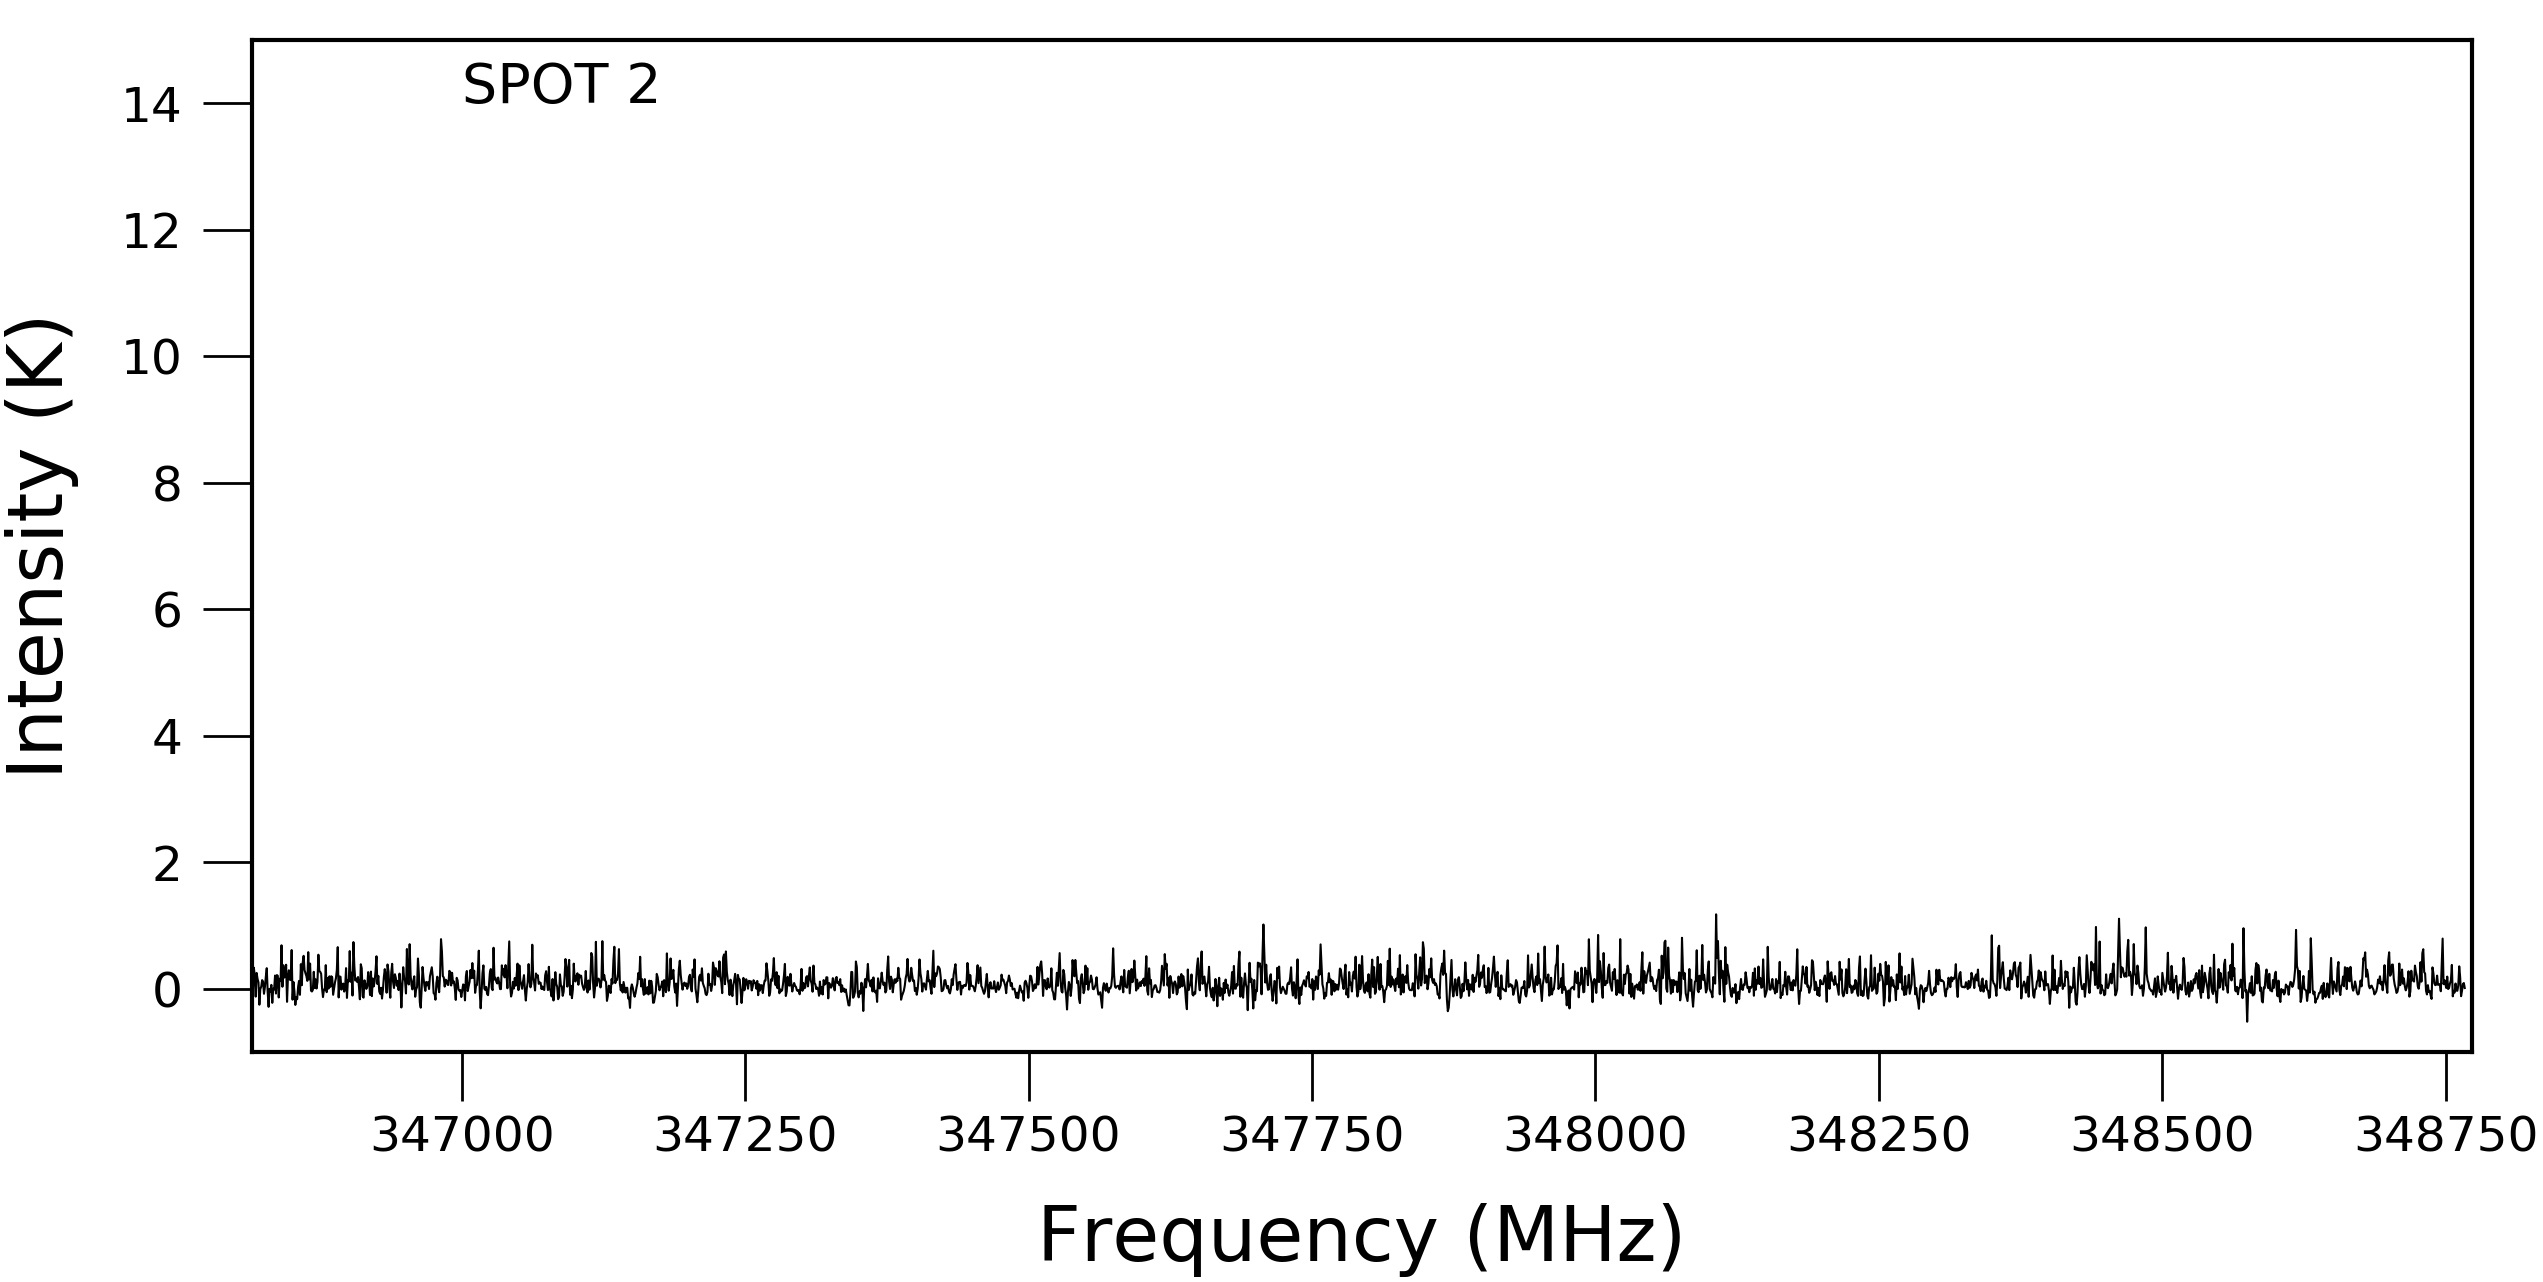
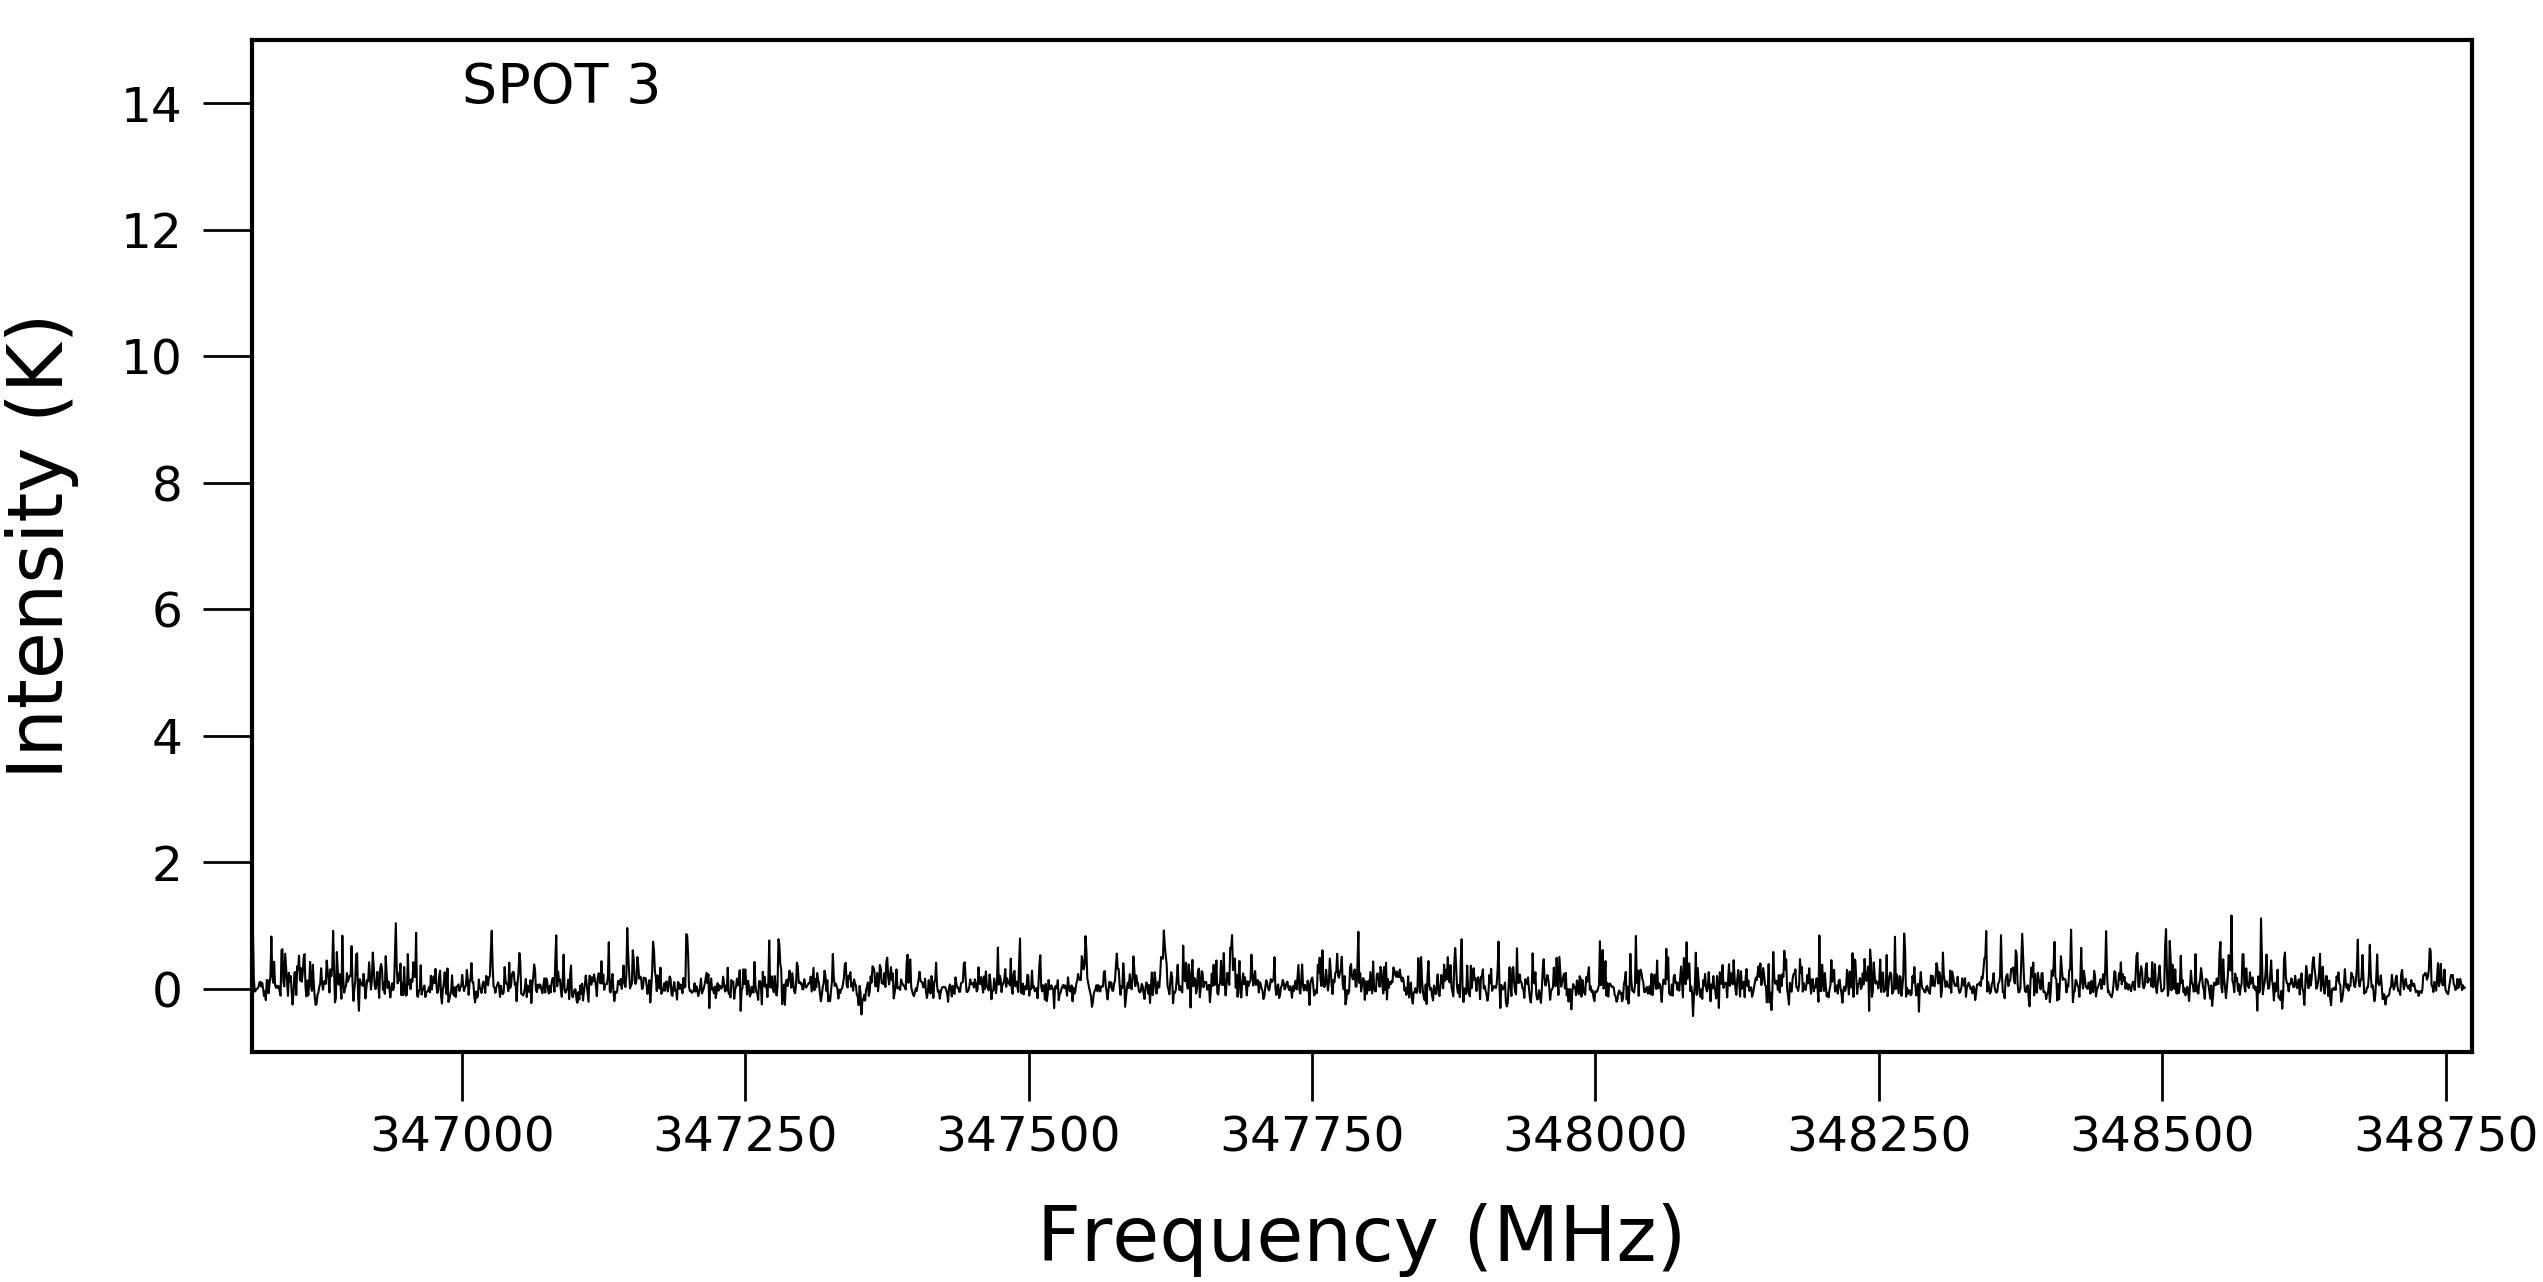
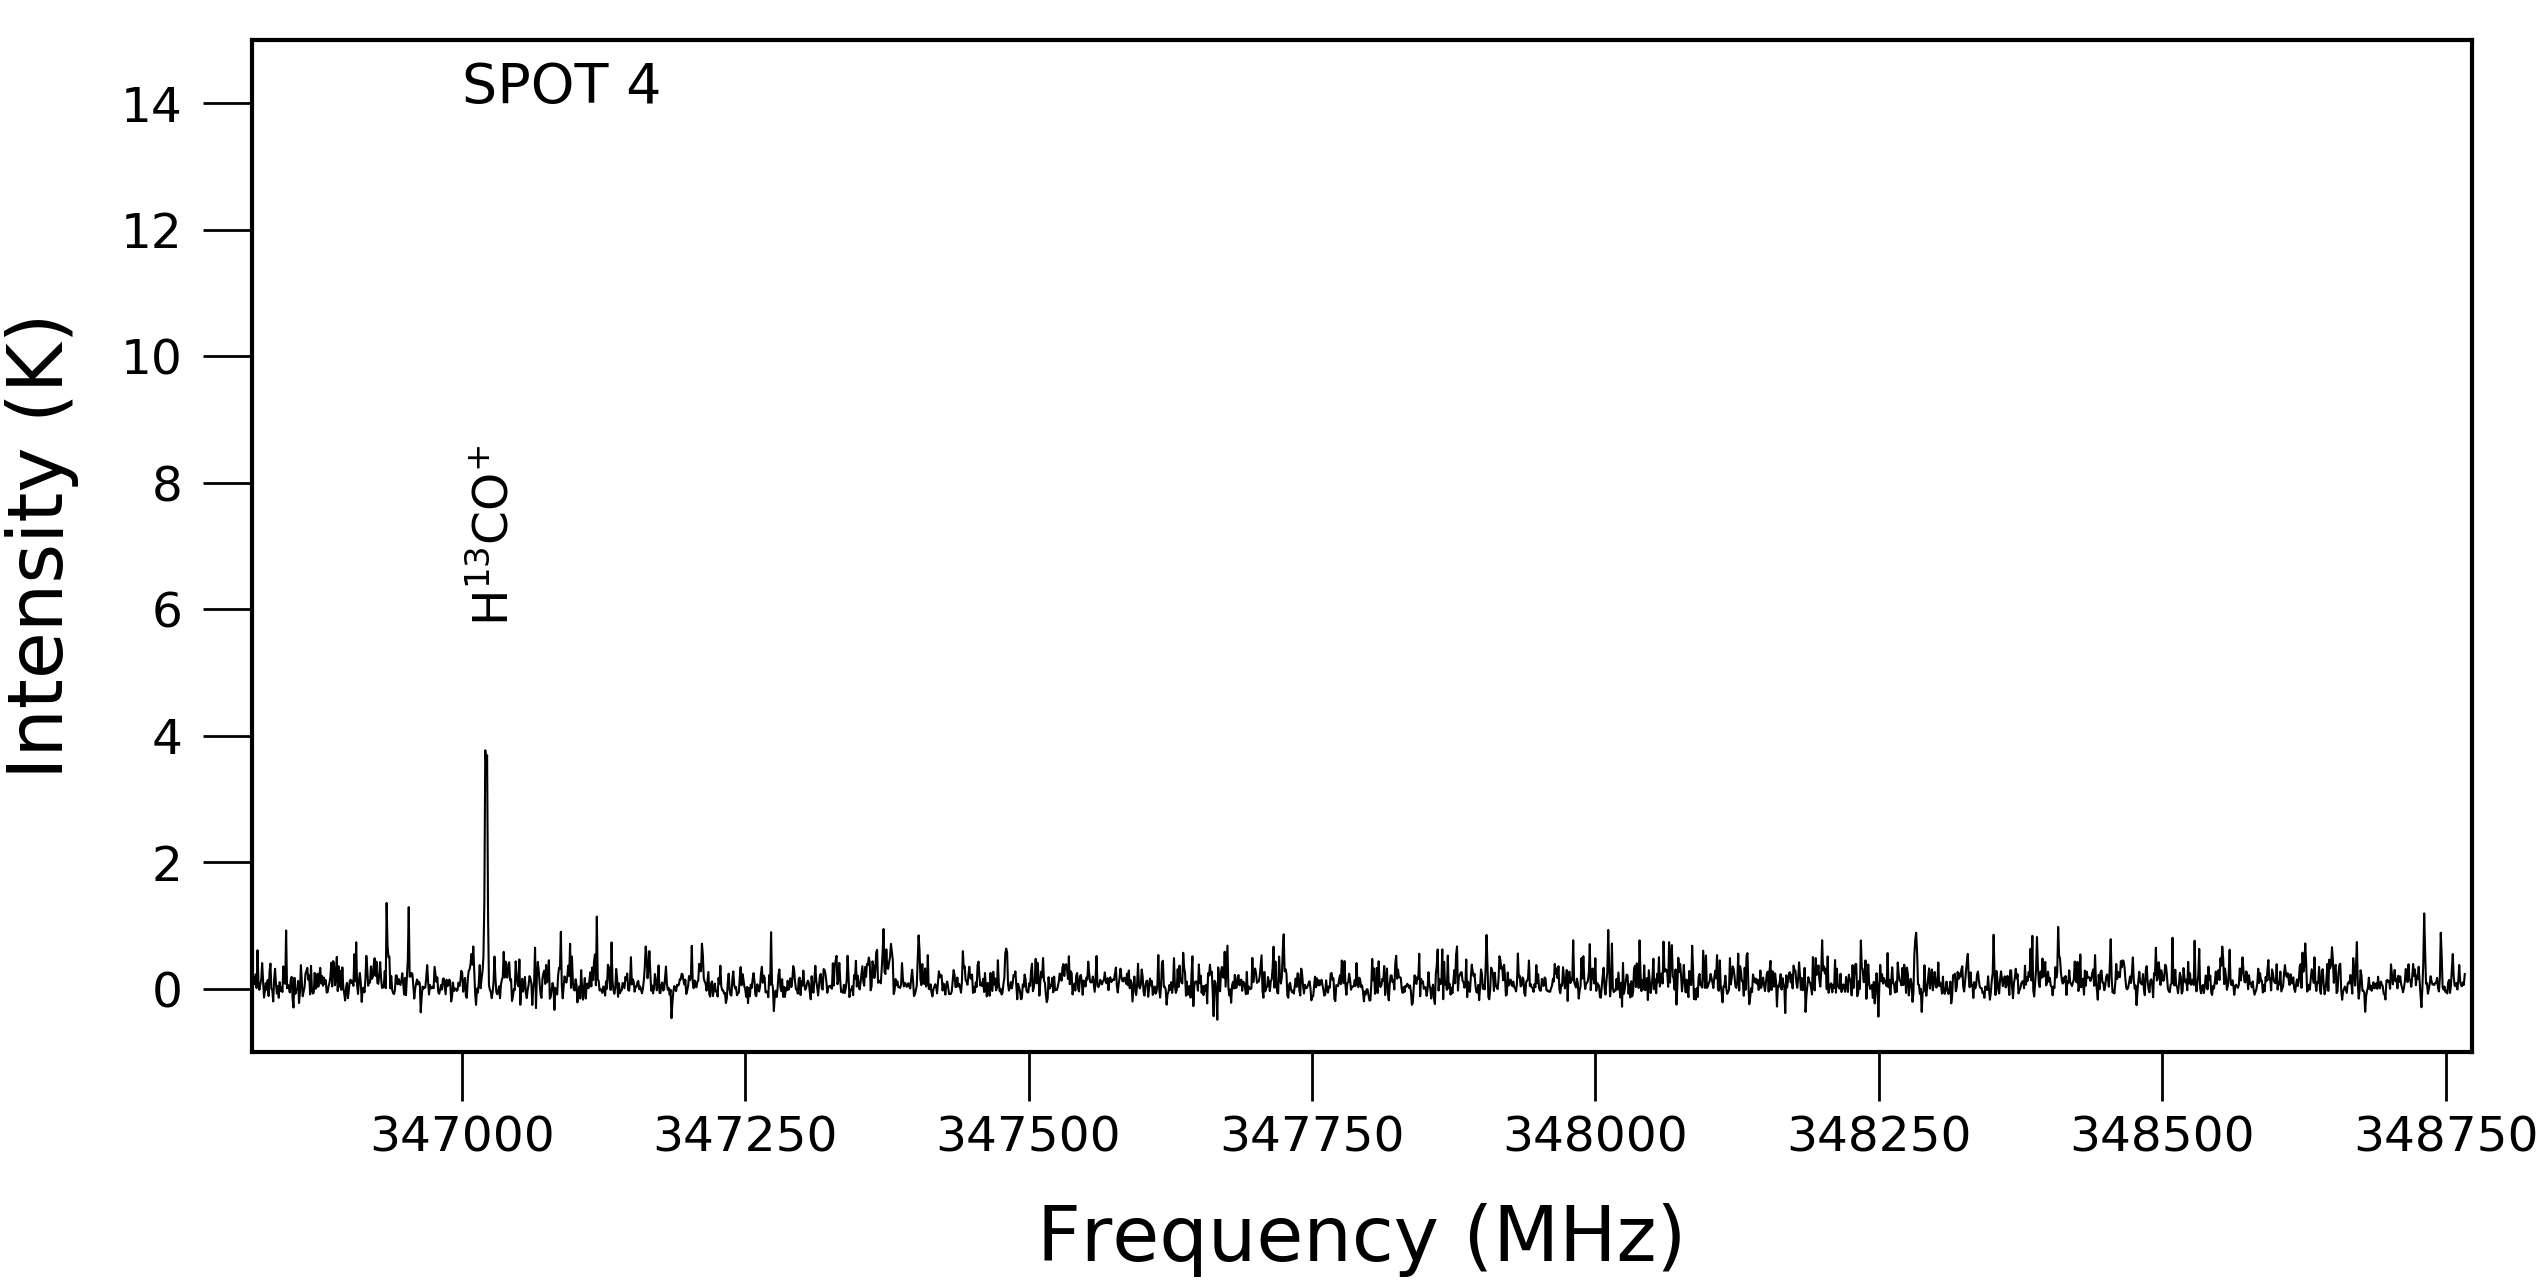
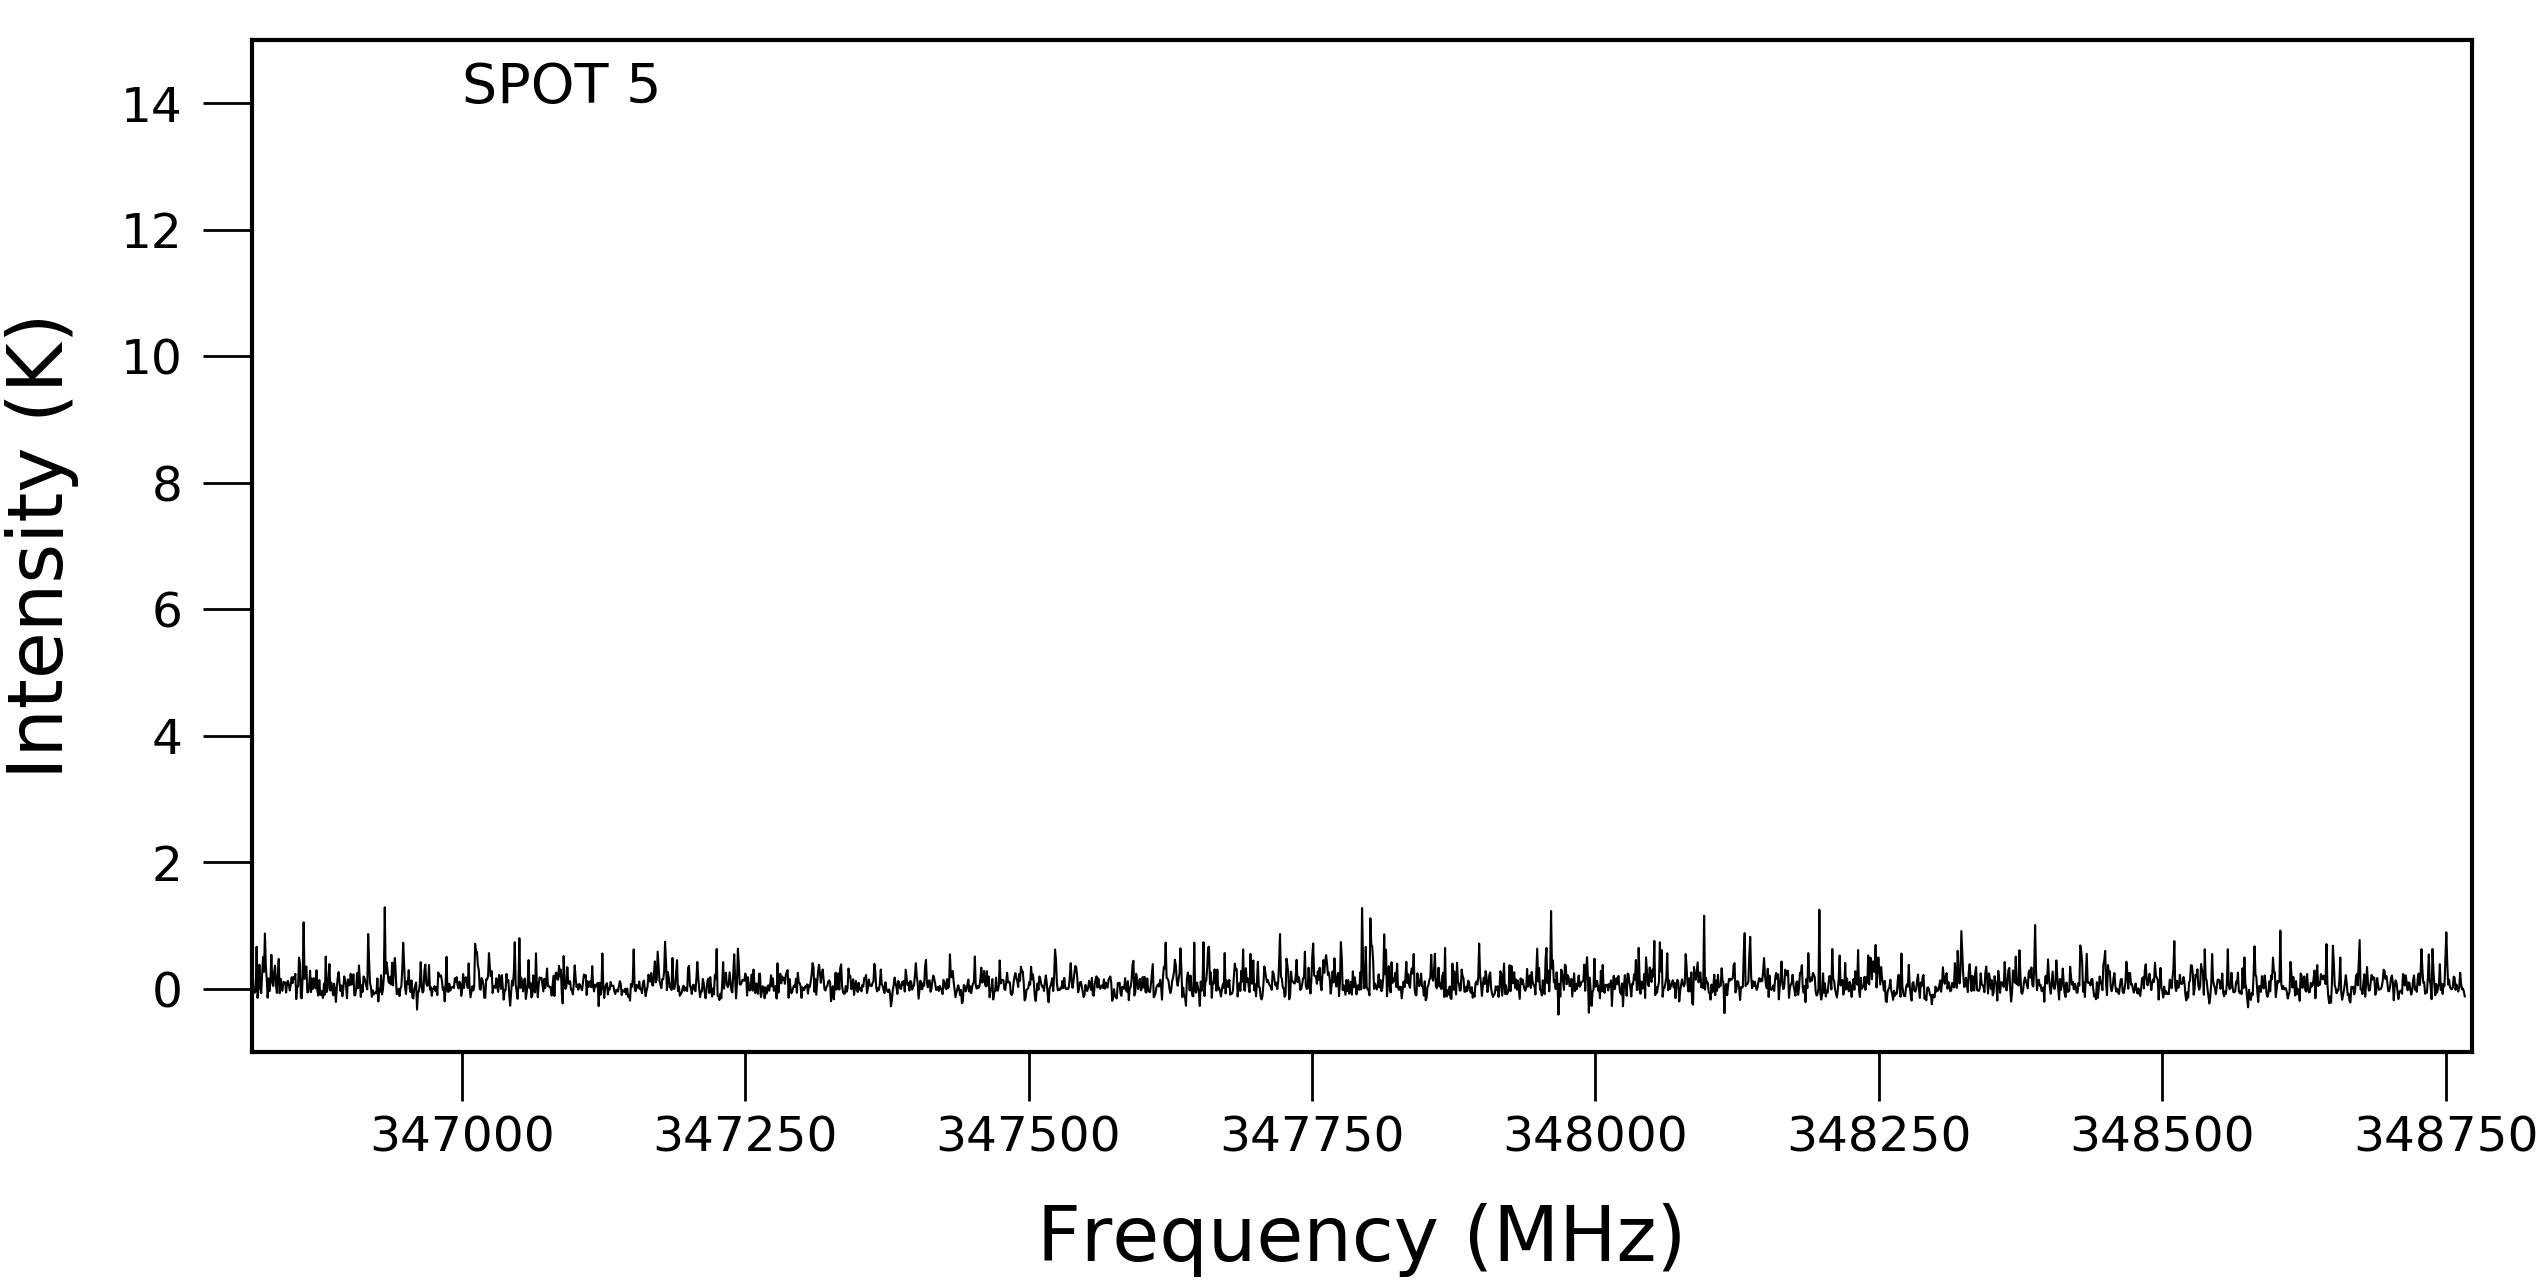
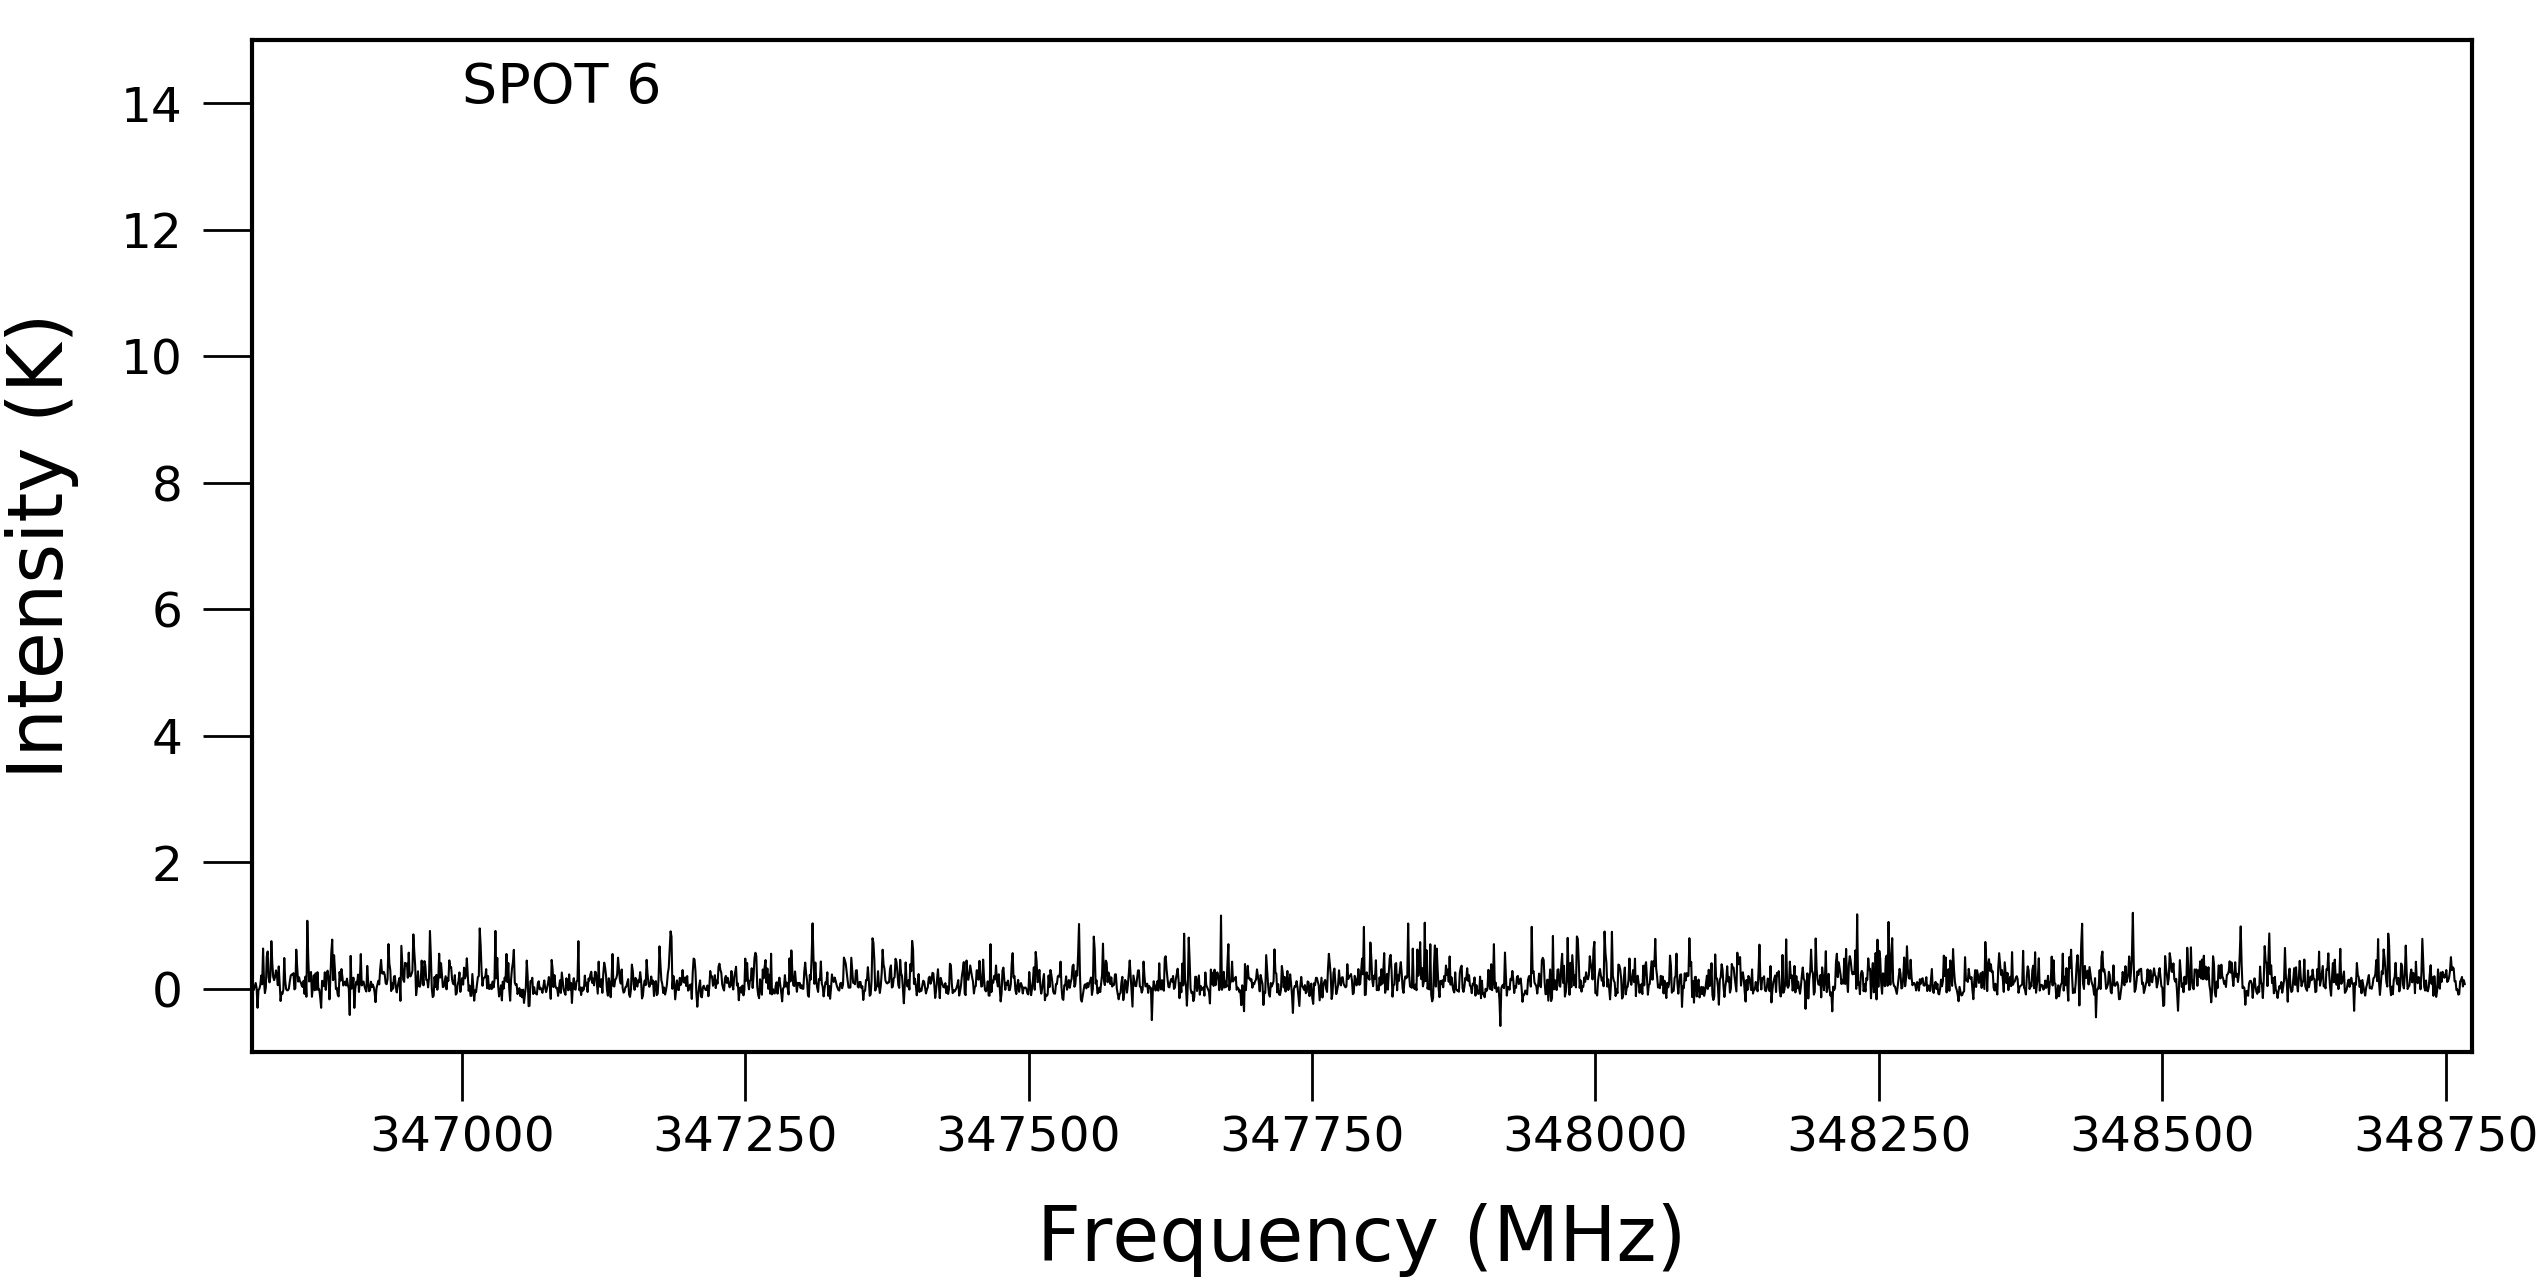
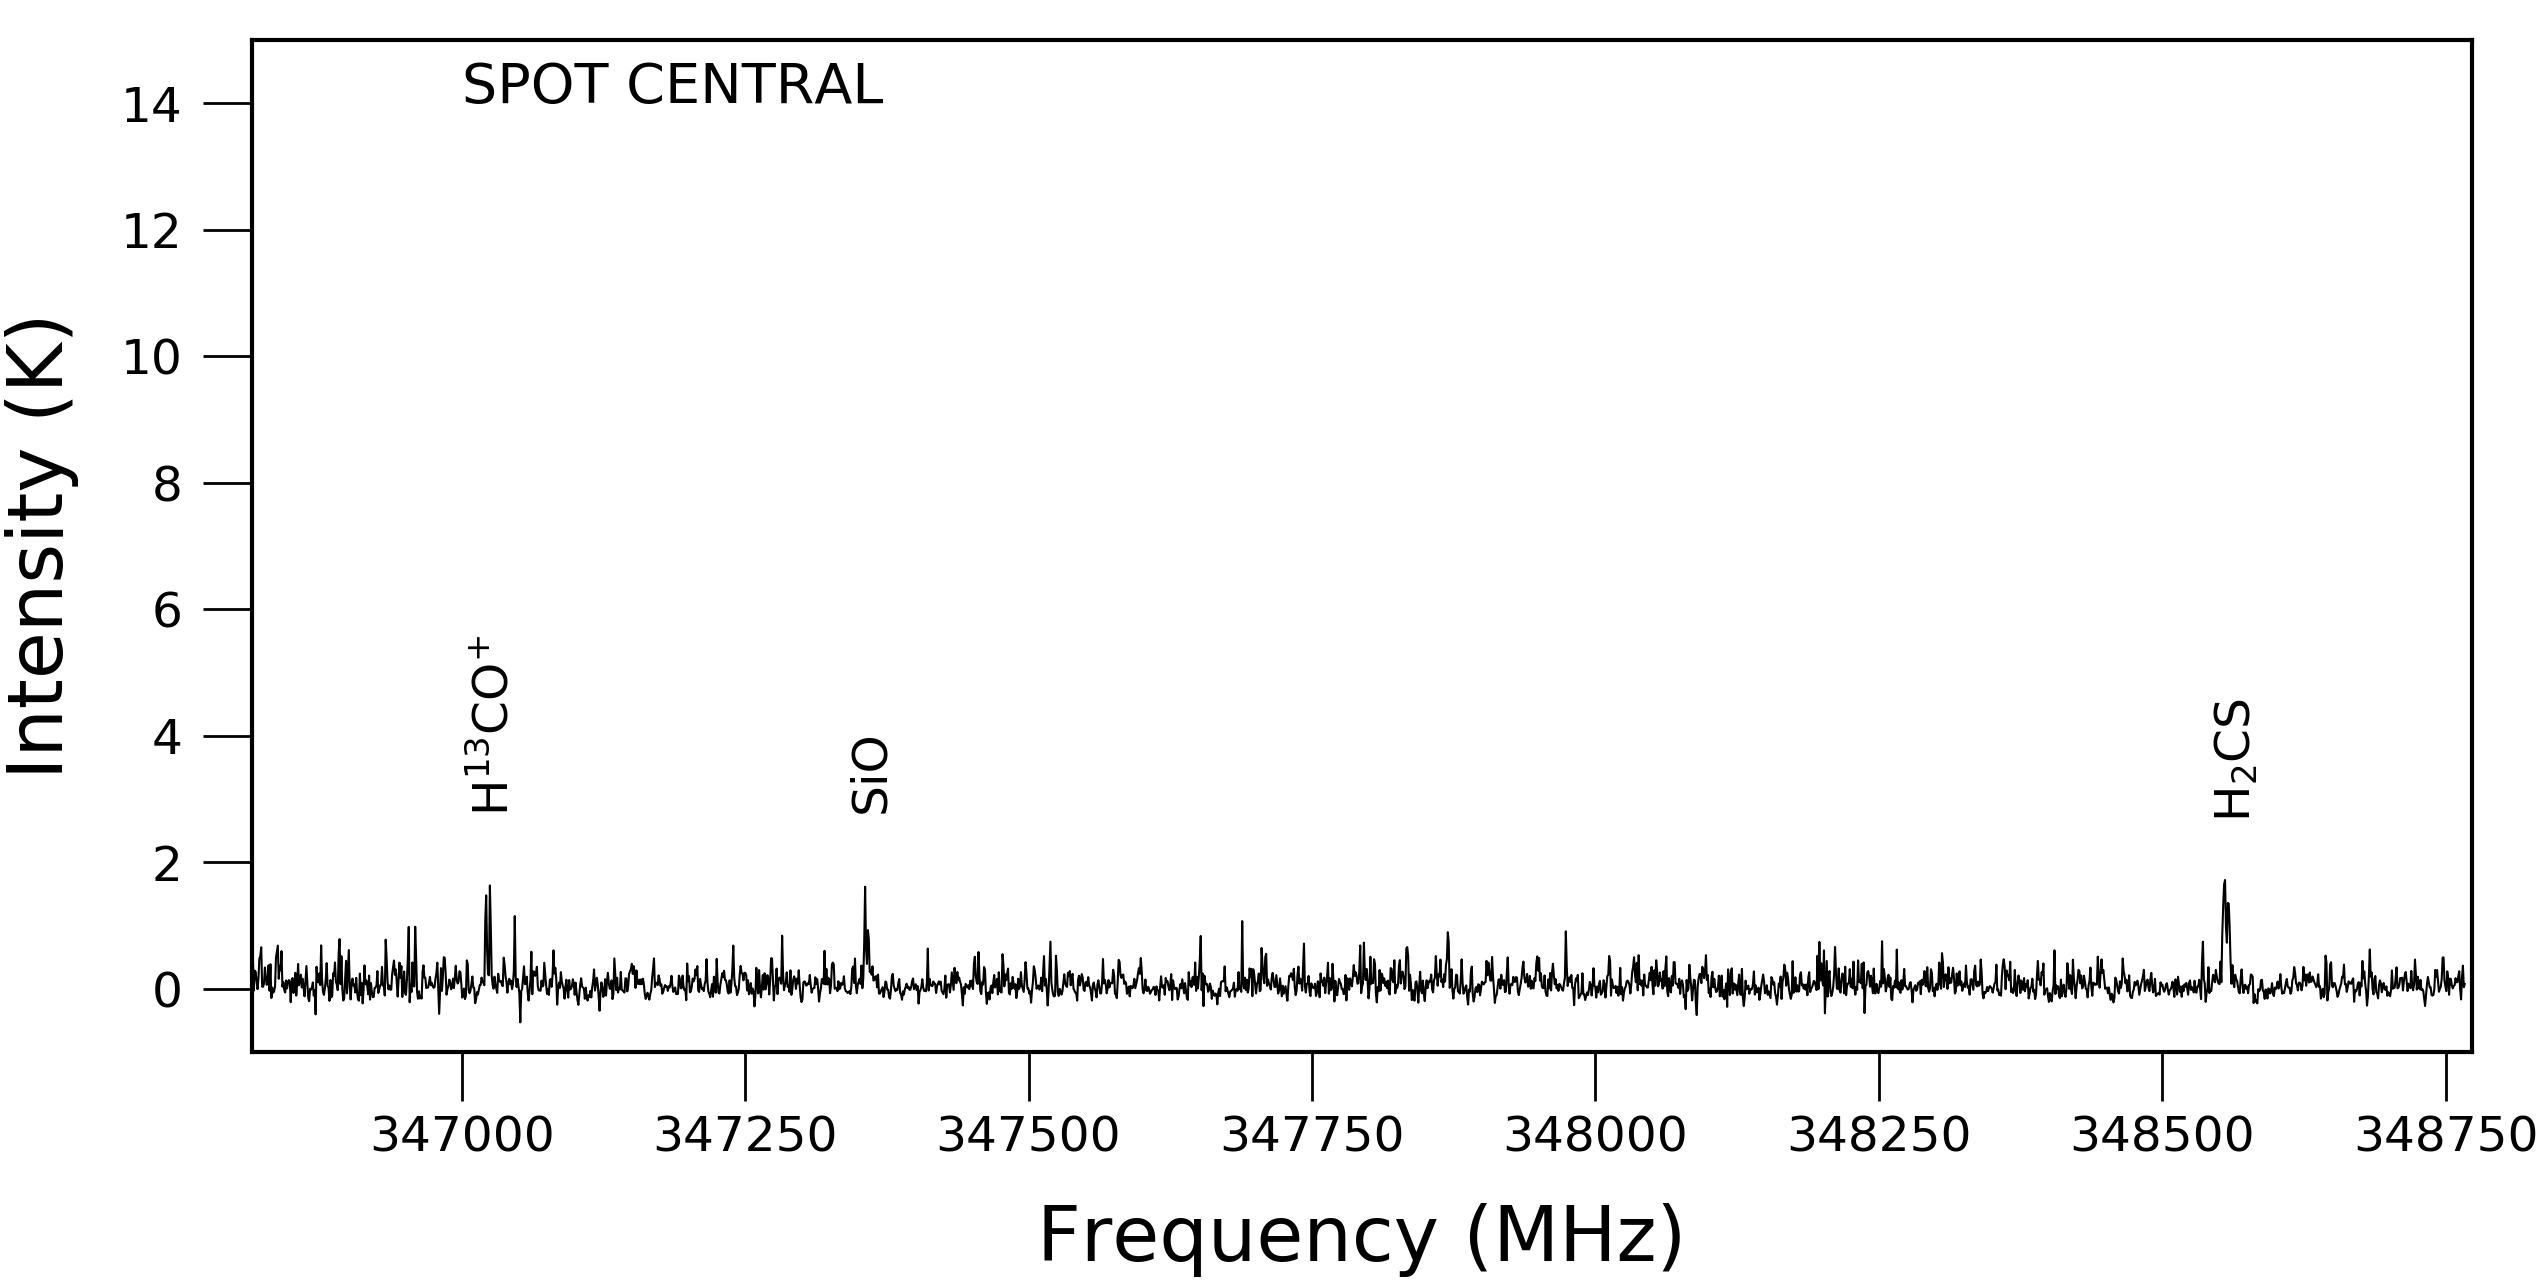
In Figure 1, we have also included the regions from the methanol outflow where we have obtained the spectra (SPOT1-6 and THE CENTRAL SPOT) to compute their physical conditions. The thermal emission from the detected molecules, see Table 1, is very sparse and complicated to make a single averaged spectra. However, the technique applied here allow us to find different exciting conditions along the flow. We extracted the spectra from the red boxes defined in Figure 1 at both analyzed frequencies (217 & 337 GHz) and identified a total of 21 molecular lines, 12 of which correspond to methanol. In Table 1, we show the identified lines and give the parameters for each line, such as the transition, the energy level , the Einstein coefficient , and the spot number in which it was found. These parameters are based on CDMS 333https://www.astro.uni-koeln.de/cdms database (Müller et al., 2001, 2005).
In the Appendix section, we include all the spectra obtained from the red boxes shown in Figure 1. These spectra include the four bands analized in this study (217/227 and 337/347 GHz). As it can be seen from the Appendix section and Table 1, the line emission from the different species is not found in all the box regions. This difficulties our study of the CH3OH-outflow. Even taken only the methanol line, it is still the same problem. We have included two images in Figure 15 showing the morphology of methanol lines to observe its sparsity. From this image, it is clear that only in the SPOT4 can make our analysis where most of the methanol lines are present. In the other positions we only found some methanol lines, but not enough to make a precise estimation for the column density and rotational temperatures. Some lines are even contaminated or blended with other transitions or species.
From the spectra of SPOT4, we have made a search in the SPITZER images for a compact infrared source located in this position, since we might have contamination from the sub-millimeter condensations associated with young protostars reported by Zapata et al. (2012); Girart et al. (2013) or other sources in MM2 cluster.
With a magenta hexagon in Figure 1 we have included the position of the closest infrared SPITZER source to MM2, which is the infrared source IRS1 detected with Spitzer at 8 m by Araya et al. (2009). We did not find any infrared source within MM2 cluster (especially associated with the millimeter compact source SMA2), so at this point the possibility of protostellar contamination seems to be difficult. In addition, as the molecular emission reported in this paper is very sparse towards the MM2 cluster, especially the high density tracer CH3OH (see Figures 12-15), the presence of a protostellar hot corino could also be discarded. However, the species such as C17O, C34S, and H2CS could be tracing cold and compact dusty condensations within MM2.

Within the methanol outflow we only found simple molecules such as CH3OH, H2CS, H2CO, SiO and H13CO+ (see Table 1). More complex molecules were not found at 4- level of 80 mJy at 230 GHz and 200 mJy at 345 GHz. These complex molecules include Methyl Formate (CH3OCHO), Acetone ((CH3)2CO), and Ethyl Formate (CH3CH2CN). This is in agreement to that proposed in Garrod & Herbst (2006); Herbst & van Dishoeck (2009), given that these simple molecules considered as first generation, or parent molecules, are probably released by shocks directly into the gas phase from the icy and dusty mantles.

state of art tools (as cassis and xclass for (sub)millimeter observations) to make a powerful analysis of the physical conditions of the outflow.
3.1. Physical parameters of the outflow in the SPOT4
We have used the methanol lines identified in the outflow (SPOT4) to determine its physical parameters. We used the rotational diagram method to calculate the column density and rotational temperature associated with the lines. This physical method takes into account that the measured integrated intensity of the lines, (Jy beam-1 km s-1) is related to the column densities of the molecules in the upper level Nu through the next equation:
where gu is the statistical weight of level ; Ntot is the total column density in cm-2; Q(Ttot) is the partition function for the rotational temperature Trot; Eu is the energy of the upper level in Kelvin; is the permanent dipole moment in Debye; and is the strength value. Therefore, a logarithmic plot of the quantity on the right-hand side of equation of above as a function of Eu provides a straight line with slope (1/Trot) and intercepts in Ntot/Q(Trot). This gives the rotational temperature and column density. This method assumes that all level populations can be characterized by a single rotational temperature Trot, and the lines are optically thin.
In Figure 3 we show the rotational diagram obtained with CASSIS444http://cassis.irap.omp.eu (Centre d’Analyse Scientifique de Spectres Instrumentaux et Synthétiques, Caux et al. 2011). We have avoided blended methanol lines to not over-estimate the integrated flux for these lines. From the fit we obtain a rotational temperature of K and a column density of cm-2 for the SPOT4 at 337GHz. We did the rotational diagram calculation for all the spots in the two bands, but because in the other spots there were a few methanol transitions or they were blended, the calculation could not be done with good certainty.
Using these values obtained from the rotational diagram for the column density and rotational temperature, we have computed a synthetic model with XCLASS (Möller, et al., 2017) to compare it with the observations. In Figure 4 we show the results. The synthetic model reproduces very well the spectra for the SPOT4 and in the window of 337 GHz where many methanol are present. The CH3OH lines that are not well fitted is because of line blending or contamination of other spectral lines. We also tried to make LTE XCLASS synthetic spectra for the rest of the spots, but again the blending, and the sparsity of the molecular emission along the outflow did not allow it.
The physical values for the rotational temperature obtained here are similar to those reported in the peak B1 in the blue lobe of the chemically rich active outflow L1157 ejected by a low-mass young star (Arce et al., 2008). However, it is not clear if the physical conditions are the same since the column densities differ by a factor of 100. These values for the column density and rotational temperature are very low (more obvious for the rotational temperatures) compared with those values reported for hot molecular cores (40 to 485K, and to cm-2; Hernández-Hernández et al., 2014). Moreover, Palau et al. (2017) for the the case of the massive outflow in IRAS 20126+4104 reported column densities between to cm-2, and rotational temperatures of 100 to 235 K. These values are also quite high to these reported here.
Compared with other molecular outflows reported in the literature (L1157, HH 114 MMS and IRAS 20126+4104), no complex molecules were found in the methanol outflow. A possibility for this non-detection could be related with the age of the molecular outflow. The dynamical age of the outflow is about of 15,000 years. This time is too short for the formation of complex molecules in the gas phase after the shock-induced sputtering of the grain mantles (see Garrod & Herbst, 2006; Herbst & van Dishoeck, 2009). However, Arce et al. (2008) noted that is it most likely that the complex species are formed in the surface of grains and then are ejected from the grain mantles by the shocks.
There could be the possibility that the emission from the C34S and H2CS may be contaminated from the sulfur-dominated region discovery by Plambeck & Menten (1990), likely originated from the northern part of the flow. However, our maps with better angular resolution from the H2CS line reveal some emission very close to SMA4, which could be tracing the outflow material ejected from this object. This possibility favours our interpretation that this emission (C34S and H2CS) is excited by the outflow. However, we think that more sensitive observations from sulfur molecules could help to reveal its origin.
4. Conclusions
The main results of our work can be summarized as follows:
-
•
We report the detection of 21 molecular lines, 12 of which correspond to methanol toward the methanol outflow in DR21(OH). These lines include CH3OH, H2CS, C17O, H13CO+, and C34S. This is the first time that these lines are detected within the outflow. However, we cannot discard the possibility that some of the observed species such as C17O, C34S, and H2CS, might be instead associated with compact dust continuum emission from cores in MM2 region. We suggest that this outflow is chemically active.
-
•
Given that most of the detected transitions correspond to methanol lines, we have computed a rotational diagram with CASSIS and a LTE synthetic spectra with XCLASS for the detected methanol lines in order to estimate the rotational temperature and column density in small solid angle of the outflow where enough lines are present. We obtain a rotational temperature of K and a column density of cm-2. These values are comparable to those column densities/ rotational temperatures reported in outflows emanating from low-mass stars.
-
•
No complex molecules were found in the methanol outflow, e.g., CH3OCHO, (CH3)2CO, and CH3CH2CN.
References
- Araya et al. (2009) Araya, E. D., Kurtz, S., Hofner, P., & Linz, H. 2009, ApJ, 698, 1321
- Arce et al. (2008) Arce, H. G., Santiago-García, J., Jørgensen, J. K., Tafalla, M., & Bachiller, R. 2008, ApJ, 681, L21
- Bachiller et al. (2001) Bachiller, R., Pérez Gutiérrez, M., Kumar, M. S. N., & Tafalla, M. 2001, A&A, 372, 899
- Caux et al. (2011) Caux, E., Bottinelli, S., Vastel, C., & Glorian, J. M. 2011, The Molecular Universe, 280, 120
- Chandler et al. (1993) Chandler, C. J., Gear, W. K., & Chini, R. 1993, MNRAS, 260, 337
- Csengeri et al. (2011) Csengeri, T., Bontemps, S., Schneider, N., et al. 2011, ApJ, 740, L5
- Davis et al. (2007) Davis, C. J., Kumar, M. S. N., Sandell, G., et al. 2007, MNRAS, 374, 29
- Downes & Rinehart (1966) Downes, D., & Rinehart, R. 1966, ApJ, 144, 937
- Fish et al. (2011) Fish, V. L., Muehlbrad, T. C., Pratap, P., et al. 2011, ApJ, 729, 14
- Garay et al. (1998) Garay, G., Köhnenkamp, I., Bourke, T. L., Rodríguez, L. F., & Lehtinen, K. K. 1998, ApJ, 509, 768
- Garrod & Herbst (2006) Garrod, R. T., & Herbst, E. 2006, A&A, 457, 927
- Girart et al. (2013) Girart, J. M., Frau, P., Zhang, Q., et al. 2013, ApJ, 772, 69
- Gooch (1996) Gooch, R. 1996, Astronomical Data Analysis Software and Systems V, 101, 80
- Harvey et al. (1986) Harvey, P. M., Joy, M., Lester, D. F., & Wilking, B. A. 1986, ApJ, 300, 737
- Harvey et al. (1977) Harvey, P. M., Campbell, M. F., & Hoffmann, W. F. 1977, ApJ, 211, 786
- Hennemann et al. (2012) Hennemann, M., Motte, F., Schneider, N., et al. 2012, A&A, 543, L3
- Herbst & van Dishoeck (2009) Herbst, E., & van Dishoeck, E. F. 2009, ARA&A, 47, 427
- Hernández-Hernández et al. (2014) Hernández-Hernández, V., Zapata, L., Kurtz, S., & Garay, G. 2014, ApJ, 786, 38
- Ho et al. (2004) Ho, P. T. P., Moran, J. M., & Lo, K. Y. 2004, ApJ, 616, L1
- Jakob et al. (2007) Jakob, H., Kramer, C., Simon, R., et al. 2007, A&A, 461, 999
- Jørgensen et al. (2007) Jørgensen, J. K., Bourke, T. L., Myers, P. C., et al. 2007, ApJ, 659, 479
- Kogan & Slysh (1998) Kogan, L., & Slysh, V. 1998, ApJ, 497, 800
- Kumar et al. (2007) Kumar, M. S. N., Davis, C. J., Grave, J. M. C., Ferreira, B., & Froebrich, D. 2007, MNRAS, 374, 54
- Kurtz et al. (2004) Kurtz, S., Hofner, P., & Álvarez, C. V. 2004, ApJS, 155, 149
- Lai et al. (2003) Lai, S.-P., Girart, J. M., & Crutcher, R. M. 2003, ApJ, 598, 392
- Mangum et al. (1991) Mangum, J. G., Wootten, A., & Mundy, L. G. 1991, ApJ, 378, 576
- Minh et al. (2012) Minh, Y. C., Chen, H.-R., Su, Y.-N., & Liu, S.-Y. 2012, Journal of Korean Astronomical Society, 45, 157
- Minh et al. (2011) Minh, Y. C., Liu, S.-Y., Chen, H.-R., & Su, Y.-N. 2011, ApJ, 737, L25
- Motte et al. (2007) Motte, F., Bontemps, S., Schilke, P., et al. 2007, A&A, 476, 1243
- Müller et al. (2001) Müller, H. S. P., Thorwirth, S., Roth, D. A., & Winnewisser, G. 2001, A&A, 370, L49
- Müller et al. (2005) Müller, H. S. P., Schlöder, F., Stutzki, J., & Winnewisser, G. 2005, Journal of Molecular Structure, 742, 215
- Möller, et al. (2017) Möller, T., Endres, C. & Schilke, P. 2017, A&A, 598, A7.
- Öberg et al. (2011) Öberg, K. I., van der Marel, N., Kristensen, L. E., & van Dishoeck, E. F. 2011, ApJ, 740, 14
- Palau et al. (2017) Palau, A., Walsh, C., Sánchez-Monge, Á., et al. 2017, MNRAS, 467, 2723
- Plambeck & Menten (1990) Plambeck, R. L., & Menten, K. M. 1990, ApJ, 364, 555
- Reipurth & Schneider (2008) Reipurth, B., & Schneider, N. 2008, Handbook of Star Forming Regions, Volume I, 36
- Rygl et al. (2012) Rygl, K. L. J., Brunthaler, A., Sanna, A., et al. 2012, A&A, 539, A79
- Sault et al. (1995) Sault, R. J., Teuben, P. J., & Wright, M. C. H. 1995, Astronomical Data Analysis Software and Systems IV, 77, 433
- Schneider et al. (2010) Schneider, N., Csengeri, T., Bontemps, S., et al. 2010, A&A, 520, A49
- Tafalla & Hacar (2013) Tafalla, M., & Hacar, A. 2013, A&A, 552, L9
- Vallée & Fiege (2006) Vallée, J. P., & Fiege, J. D. 2006, ApJ, 636, 332
- Zapata et al. (2012) Zapata, L. A., Loinard, L., Su, Y.-N., et al. 2012, ApJ, 744, 86
- Zapata et al. (2013) Zapata, L. A., Schmid-Burgk, J., Pérez-Goytia, N., et al. 2013, ApJ, 765, L29
- Zapata et al. (2017) Zapata, L. A., Schmid-Burgk, J., Rodríguez, L. F., Palau, A., & Loinard, L. 2017, ApJ, 836, 133
5. Appendix
5.1. Molecular spectra
In this appendix we show the obtained spectra from the spots (see figure 1).
 |
 |
 |
 |
 |
 |
 |
 |
 |
 |
 |
 |
 |
 |
 |
 |
 |
 |
 |
 |
 |
 |
 |
 |
 |
 |
 |
 |
5.2. Integrated intensity maps
In this section we include the moment 0 for all molecules reported in Table 1. We have used an exponential or logarithmic brightness scale depending on the maximum for each map to show the emission distribution.