Interpreting Crab Nebula’s Synchrotron Spectrum: Two Acceleration Mechanisms
Abstract
We outline a model of the Crab Pulsar Wind Nebula with two different populations of synchrotron emitting particles, arising from two different acceleration mechanisms: (i) Component-I due to Fermi-I acceleration at the equatorial portion of the termination shock, with particle spectral index above the injection break corresponding to , peaking in the UV ( is the bulk Lorentz factor of the wind, is wind magnetization); (ii) Component-II due to acceleration at reconnection layers in the bulk of the turbulent Nebula, with particle index . The model requires relatively slow but highly magnetized wind. For both components the overall cooling break is in the infra-red at eV, so that the Component-I is in the fast cooling regime (cooling frequency below the peak frequency). In the optical band Component-I produces emission with the cooling spectral index of , softening towards the edges due to radiative losses. Above the cooling break, in the optical, UV and X-rays, Component-I mostly overwhelms Component-II. We hypothesize that acceleration at large-scale current sheets in the turbulent nebula (Component-II) extends to the synchrotron burn-off limit of 100 MeV. Thus in our model acceleration in turbulent reconnection (Component-II) can produce both hard radio spectra and occasional gamma-ray flares. This model may be applicable to a broader class of high energy astrophysical objects, like AGNe and GRB jets, where often radio electrons form a different population from the high energy electrons.
1 Introduction
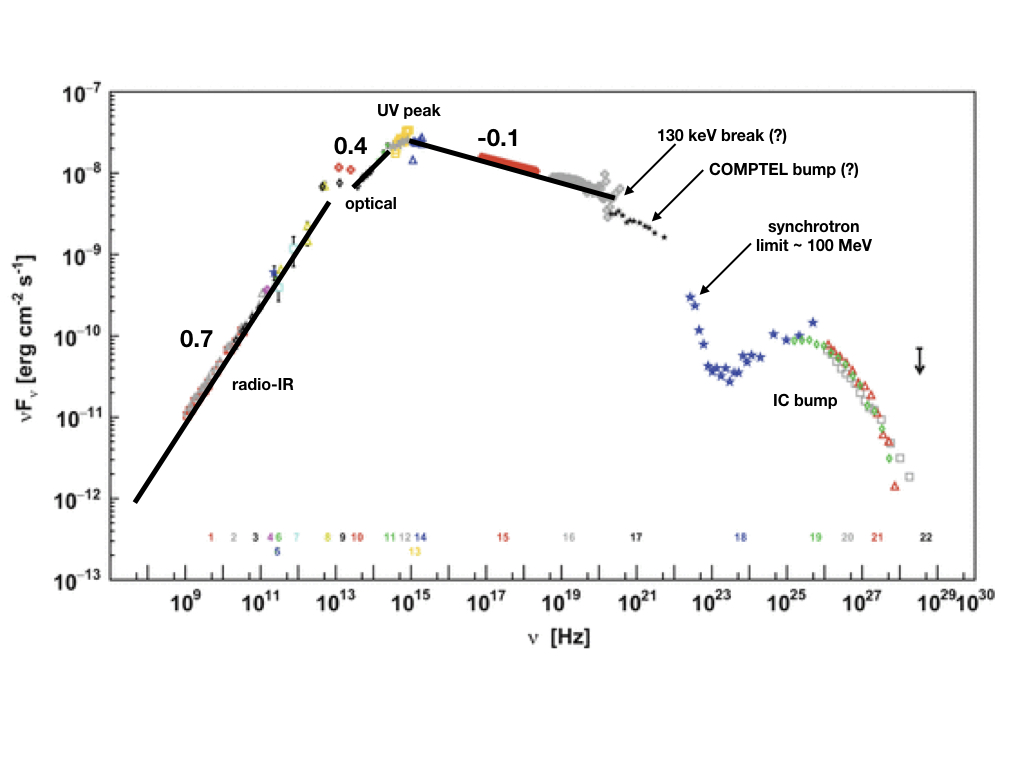
The Crab Nebula is the paragon of the high energy astrophysical source. Understanding physical processes operating in the Crab has enormous implications for high energy astrophysics in general. Conventionally, the particle acceleration was assumed to occur at the wind termination shocks, presumably via the Fermi-I mechanism (Rees & Gunn, 1974; Kennel & Coroniti, 1984a, b). The expected particle spectral index (e.g. Blandford & Eichler, 1987) matches nicely the inferred non-thermal X-ray synchrotron spectrum, see §2 and Fig. 1. (We adopt the notations for the spectral energy distribution as , and particle energy distribution .)
A strong argument in favor of particle acceleration at the (equatorial part of the) termination shock comes from the fact that the low magnetization numerical models of the Crab Nebula (Komissarov & Lyubarsky, 2004; Del Zanna et al., 2004) are able to reproduce the morphological details of the Crab Nebula down to intricate details. Until recently, acceleration at the termination shock was the dominant paradigm (Rees & Gunn, 1974; Kennel & Coroniti, 1984a, b). Consistent with this picture is the fact that low-sigma shocks are efficient particle accelerators (Sironi & Spitkovsky, 2011a; Sironi et al., 2013).
One of the biggest problems, recognized by Kennel & Coroniti (1984b), was the radio emission of the Crab and other pulsar wind nebulae (PWNe). First, the radio spectra of PWNe are very hard, with the spectral index approaching zero in some cases (Reynolds, 2001; Green, 2014; Reynolds et al., 2017). The implied particle spectral index is then approaching . The spectral index is not expected in Fermi-I acceleration models that typically have (e.g. Blandford & Eichler, 1987). Secondly, the number of radio emitting particles is much larger than what is expected in magnetospheric pair production (Kennel & Coroniti, 1984b; Atoyan, 1999a; Arons & Scharlemann, 1979; Timokhin, 2010), see also §4.3. (We suggest a way to obtain a hard spectrum, but the multiplicity problem remains.)
Another important observation that constrained the structure of PWNe was the discovery of flares from the Crab Nebula (Tavani et al., 2011; Abdo et al., 2011; Weisskopf et al., 2013), which further challenged our understanding of particle acceleration in the PWNe. The unusually short durations, high luminosities, and high photon energies of the Crab Nebula gamma-ray flares require reconsideration of our basic assumptions about the physical processes responsible for acceleration of (some) high-energy emitting particles in the Crab Nebula, and, possibly in other high-energy astrophysical sources.
Even before the discovery of Crab flares, Lyutikov (2010) argued that the observed cutoff in the synchrotron spectrum of the Crab Nebula at MeV in the persistent Crab emission is too high to be consistent with the diffusive shock acceleration. Indeed, balancing electrostatic acceleration in a regular electric field with synchrotron energy losses yields a maximum synchrotron photon energy (de Jager et al., 1996; Lyutikov, 2010)
| (1) |
where is the ratio of electric to magnetic field strengths. Since the high conductivity of astrophysical plasmas ensures that in most circumstances , the observed value of the cutoff is right at the very limit. During the gamma-ray flares the cutoff energy approached even higher value of , suggesting a different acceleration mechanism (Clausen-Brown & Lyutikov, 2012; Cerutti et al., 2012a, 2014a, 2013; Lyutikov et al., 2017a, b, 2018) - particle acceleration during reconnection events in highly magnetized plasma. In particular, Lyutikov et al. (2017b, a) developed a model of explosive reconnection events, whereby particles are accelerated by a charged-starved electric field during the X-point collapse in relativistically magnetized plasma.
In this paper we argue that there are two acceleration mechanisms in PWNe (which we call, naturally, Component-I and Component-II): Component-I is due to Fermi-I acceleration at the termination shock (and just thermalization at some parts of the shock) and Component-II is due to plasma turbulence with self-consistent generation of reconnecting current sheets in the bulk of the Nebula. (Therefore, this scenario is different from the models that invoke turbulence with a pre-existing current sheet; Lazarian & Vishniac, 1999). The possibility of having two acceleration mechanisms in PWNe has been suggested by Kennel & Coroniti (1984b) and then further discussed by Atoyan & Aharonian (1996); Bandiera et al. (2002); Meyer et al. (2010); Schweizer et al. (2013); Porth et al. (2014). Of particular relevance are the works of Olmi et al. (2014, 2015) who discussed two particle populations and argued that X-ray emission is produced from particles injected in the equatorial regions, while radio electrons are accelerated in the bulk. These are the underlying assumptions in the present study. Also, Komissarov (2013) suggested that magnetic dissipation in the bulk of the Nebula accelerates particles.
Here we discuss a more detailed model of the two component structure of the Crab Nebula, concentrating on the broadband SED and the spatial distribution of the emission in different bands.
2 Overall spectrum: observations
2.1 Mean features of the non-thermal component
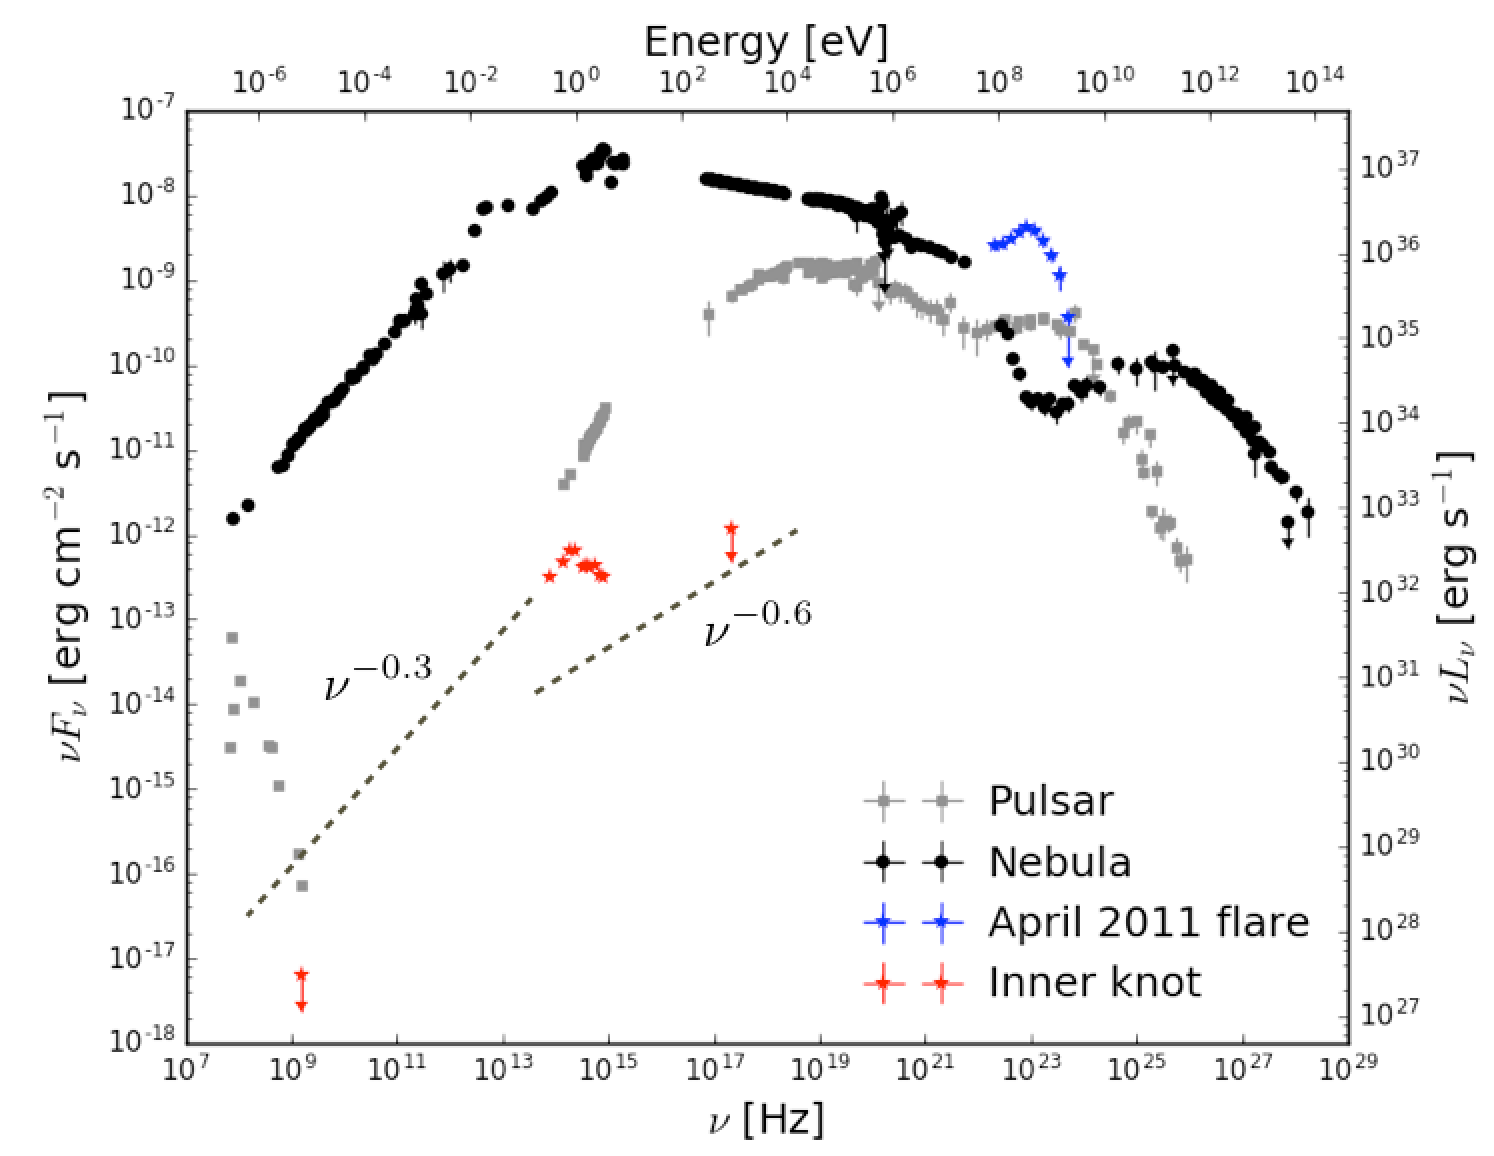
A number of authors have made fits to the spectral energy distribution of the Crab Nebula (see, e.g. reviews by Zanin, 2017; Reynolds et al., 2017). Let us briefly summarize them. (see Fig. 1):
-
1.
In the radio the spectral index is (so that ). It is homogeneous over the Nebula (Bietenholz et al., 1997).
-
2.
In the infra-red the situation is complicated – a large thermal component from filaments complicates the analysis, see §3.3
-
3.
In the optical the spectrum softens to (so that ).
-
4.
The overall spectral distribution of in the Crab Nebula has a peak in the UV, at eV. Above the peak the spectrum has
- 5.
- 6.
-
7.
There is an exponential cut-off around MeV (Abdo et al., 2010).
- 8.
2.2 The COMPTEL break and a bump
There are possibly important features in the high energy Crab Nebula spectrum that seem to be not given enough attention previously. First, there is a softening at keV, with a break with (Meyer et al., 2010). It is not clear if this feature is actually physically present. In Kuiper et al. (2001) (their Fig. A.1) there seems to be a factor of jump between the continuation of 100 keV spectrum and COMPTEL points above 1 MeV. This could be due to cross-detector uncertainty (Lucien Kuiper, priv. comm.). Yet a distinct difference in spectral slopes between MeV (van der Meulen et al., 1998) may indicate a different emission component. The data from SPI on INTEGRAL (Jourdain & Roques, 2009) indicate that a broken power law spectrum is statistically preferred over a single power law (see Fig. 1 in Jourdain & Roques, 2009).
Thus, in our model the keV - MeV break and the bump arise from a superposition of two components, §4.3.5. If confirmed, the COMPTEL break and a bump can be an interesting test of the model. We encourage further analysis of the Crab Nebula data in the MeV range.
3 Internal structure - observations
Above, we discussed the overall properties of the Crab Nebula. Next we highlight important observations related to the internal structure of the Crab Nebula.
3.1 X-rays
X-ray images of the Crab Nebula show interesting morphological variations. At lower energies, keV, the Nebula is considerably more extended than in higher energies. Overall, this is consistent with cooling, though some features (e.g. southward directed elongated feature) are both much brighter in lower energies, and have a corresponding features in radio and IR. {comment}
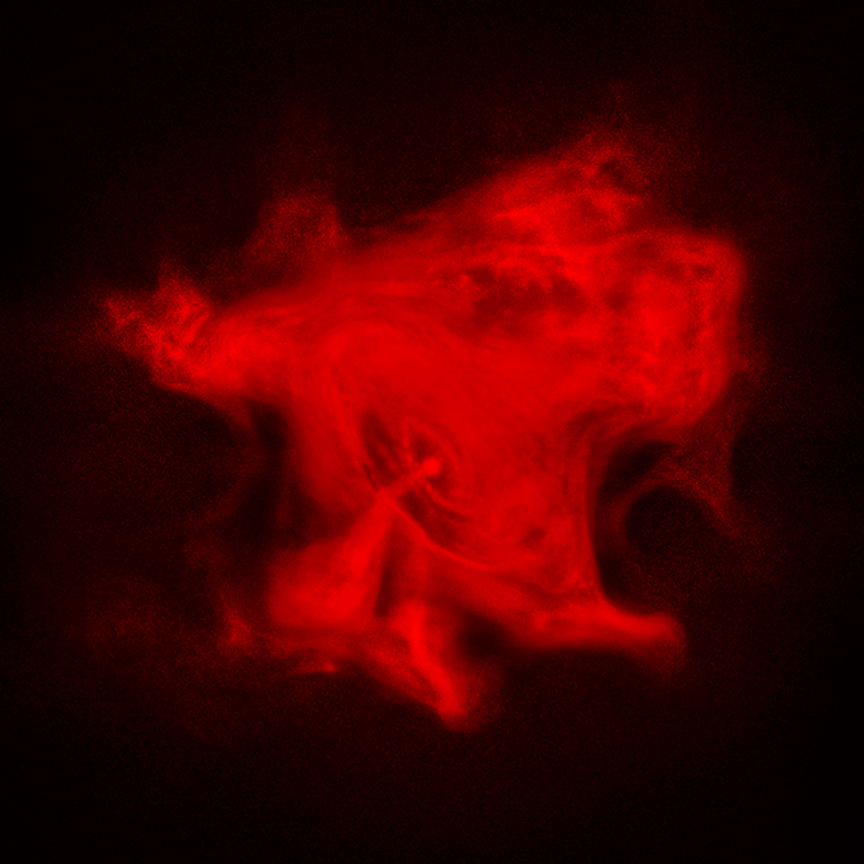
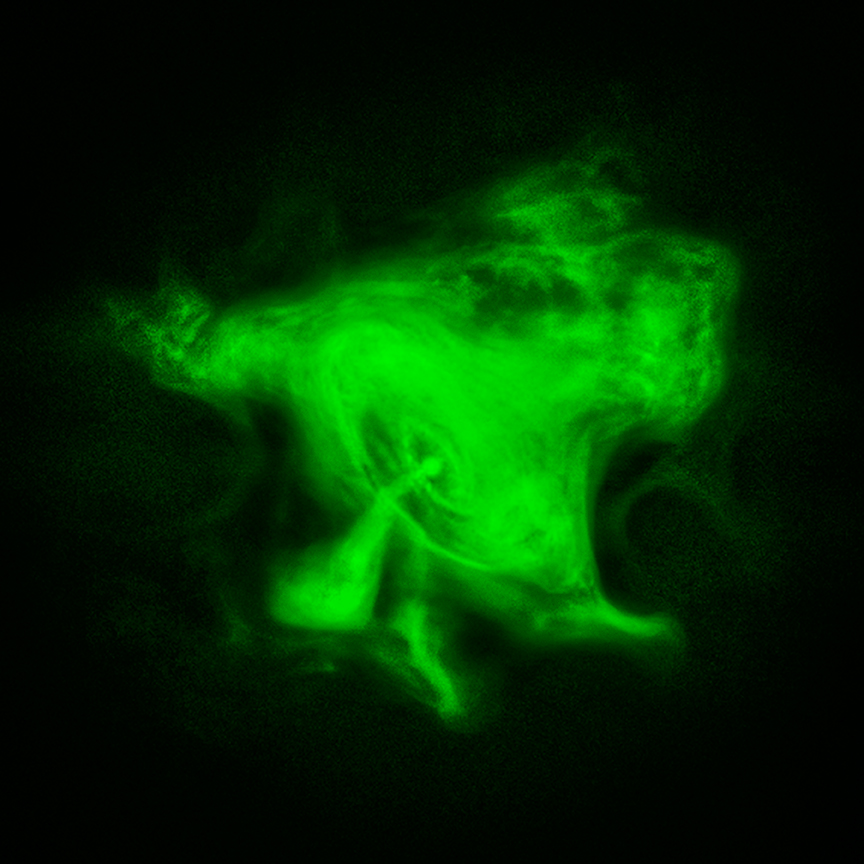
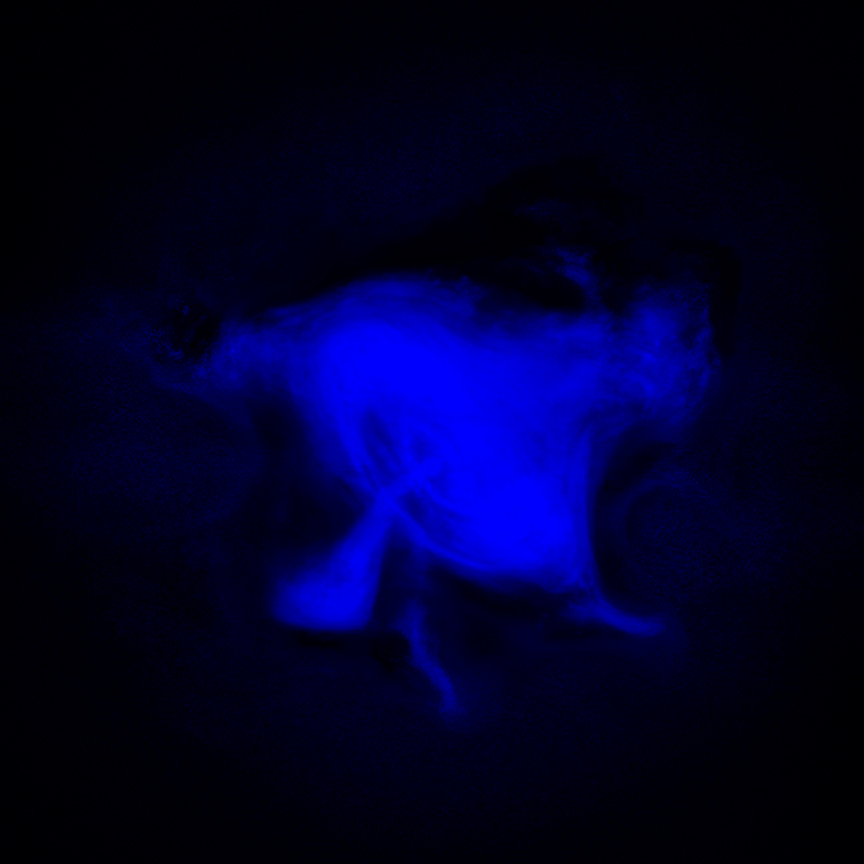
Spectral maps of the Crab in X-rays above 10 keV, i.e. above the Chandra band obtained with NuStar, are quite different (see Fig. 8 of Madsen et al., 2015; Reynolds et al., 2017). The map of spectral indices indicates that above 10 keV the hardest part is off the main torus, and hardens towards the SE (South-East). This contrasts with the fact that the Chandra images show that the high energy part (up to 7 keV) is nearly all torus. (The effect is not likely due to different spatial resolutions at different energies.)
The morphological map of the X-ray spectral index shows interesting structure: above 10 keV the hardest part is off the main torus, towards the low-left jet (Madsen et al., 2015). The torus spectrum softens sooner (closer to the center) than the SE part. This can be interpreted as due to the appearance of a new component, §3.1.


We interpret the X-ray intensity and spectral maps as follows. The keV intensity is dominated by Component-I; the increasing size of the emission region towards softer energies is due to radiative cooling (X-ray particles have cooling times of the order of a year). Above 10 keV we start to see Component-II, that eventually produces the COMPTEL bump, §2.2.
3.2 Spectral maps in optical: softening towards the edges
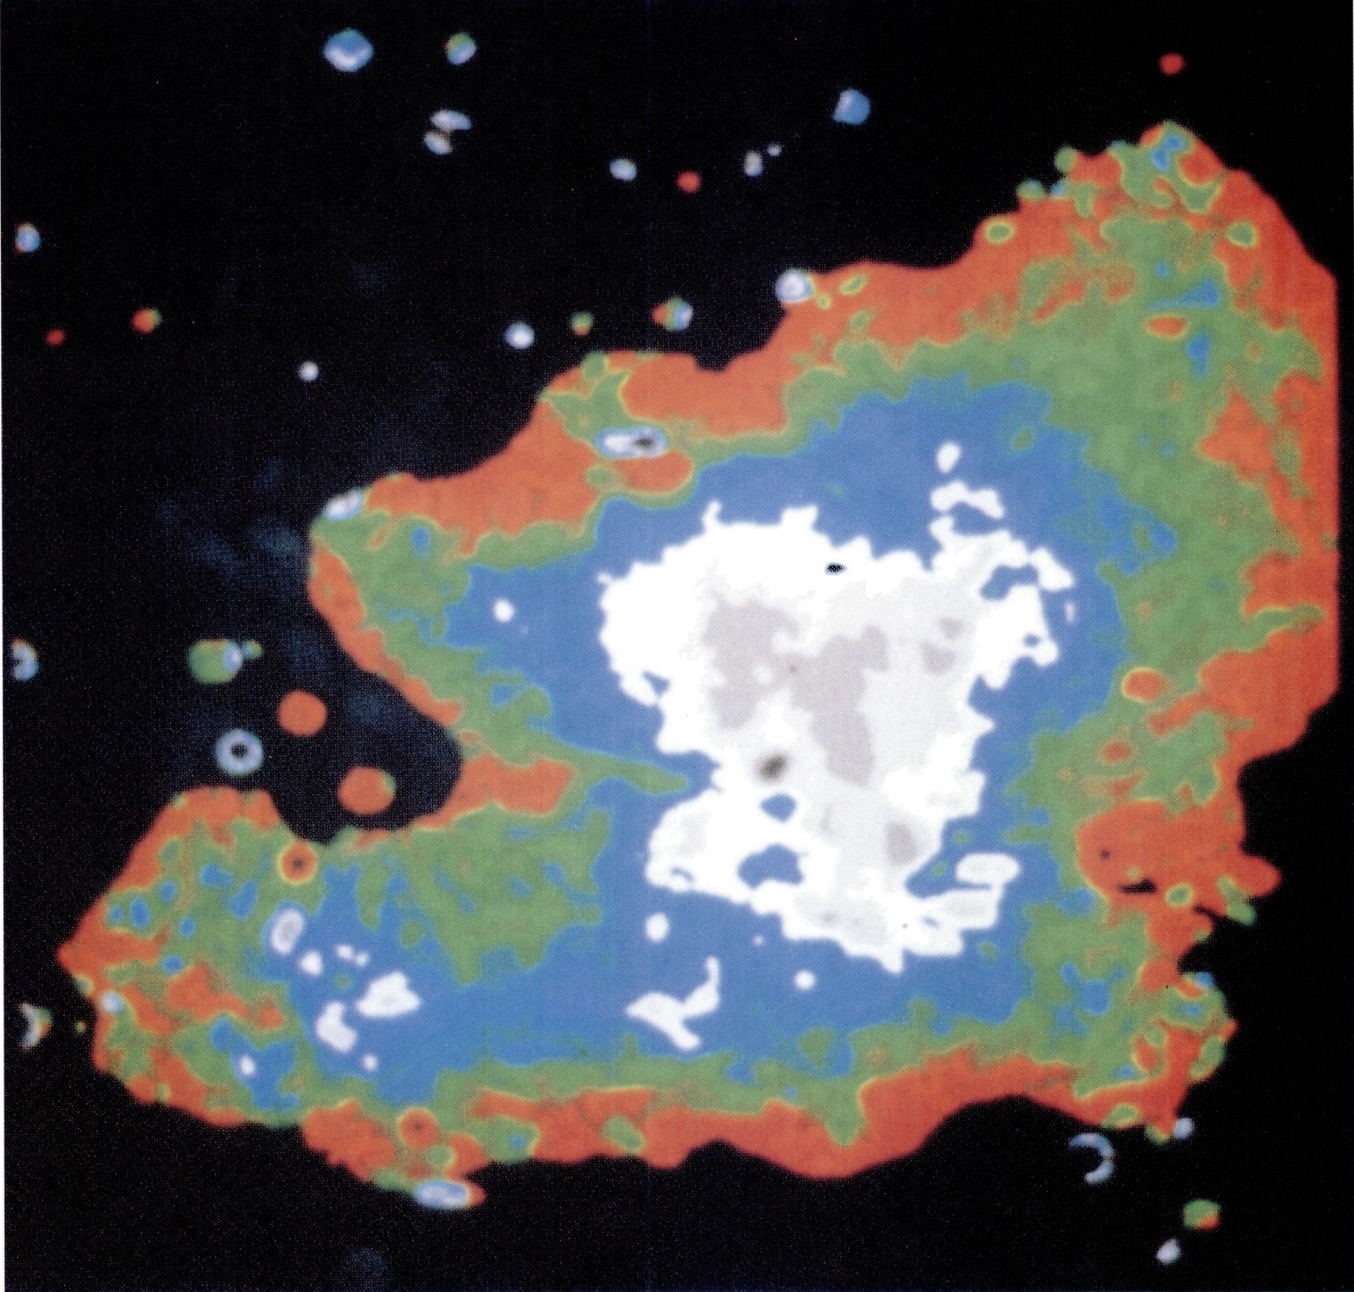
The map of the spectral index at optical wavelengths (Veron-Cetty & Woltjer, 1993) shows values of as low as 0.57 in the vicinity of the pulsar with gradual steepening towards the outer edges of the Nebula to values just above unity. The clear softening of the spectrum towards the outer nebula implies that the optical-emitting electrons have cooling times shorter than the age of the Nebula.
3.3 The infrared
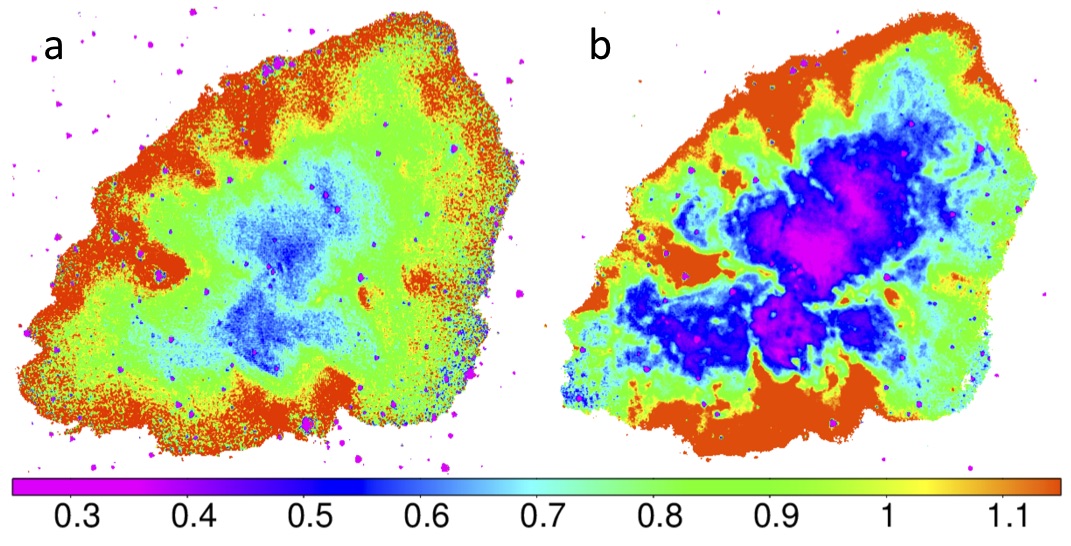
As a part of new analysis, we reprocessed the Spitzer Infrared Array Camera (IRAC) data originally presented in Temim et al. (2006) using updated calibration files, extended source corrections, and the final v18.5 of the MOPEX (MOsaicker and Point source EXtractor) software. We used the IRAC 3.5, 4.5, and 8.0 µm images from Temim et al. (2006) to create spectral index maps. The images were background subtracted using background levels of 0.18. 0.18, and 8.72 MJy/sr, respectively. The IRAC surface brightness correction for extended sources was applied to the images (0.91, 0.94, and 0.74, respectively). The images were also corrected for extinction using values of Indebetouw et al. (2005) and an value of 0.194, derived from the hydrogen column density towards the Crab Nebula of (Willingale et al., 2001) and the relation (Draine, 1989). This led to extinction correction factors of 1.1 for the 3.6 µm and 1.08 for 4.5 µm and 8.0 µmimages. Finally, we used the nominal wavelengths of 3.550 µm, 4.493 µm, and 7.872 µm to calculate the spectral index maps.

The two IR spectral index maps are shown in Fig. 5. The left panel show the map calculated from the IRAC 3.6 and 4.5 µm images that are dominated by synchrotron emission. The torus structure, evident in blue, has a spectral index of 0.55. The index steepens with distance from the torus, consistent with previous results. While the relative values of the spectral indices have small uncertainties, the uncertainty on the absolute value of the index for the map on the left is , assuming a conservative estimate for the IRAC flux calibration of 5%. We therefore produced a second spectral index map using the IRAC 3.6 and 8.0 µm images, which provide larger wavelength spacing and reduce the absolute uncertainty to . This map is shown in the right panel of Fig. 5. Since the IRAC 8.0 µm image has a large contribution from the ejecta filaments, the spectral index is significantly modified in the outer nebula. We can, however, use this map to more reliably constrain the absolute value of the spectral index for the inner torus, which clearly stand out in magenta. Here, the torus has a spectral index of . This is consistent with the continuation of the radio spectrum (which is clearly in the regime where radiative losses are not important). Similar spectral indices were found by Gallant & Tuffs (2002) when comparing m data with ISO from m.
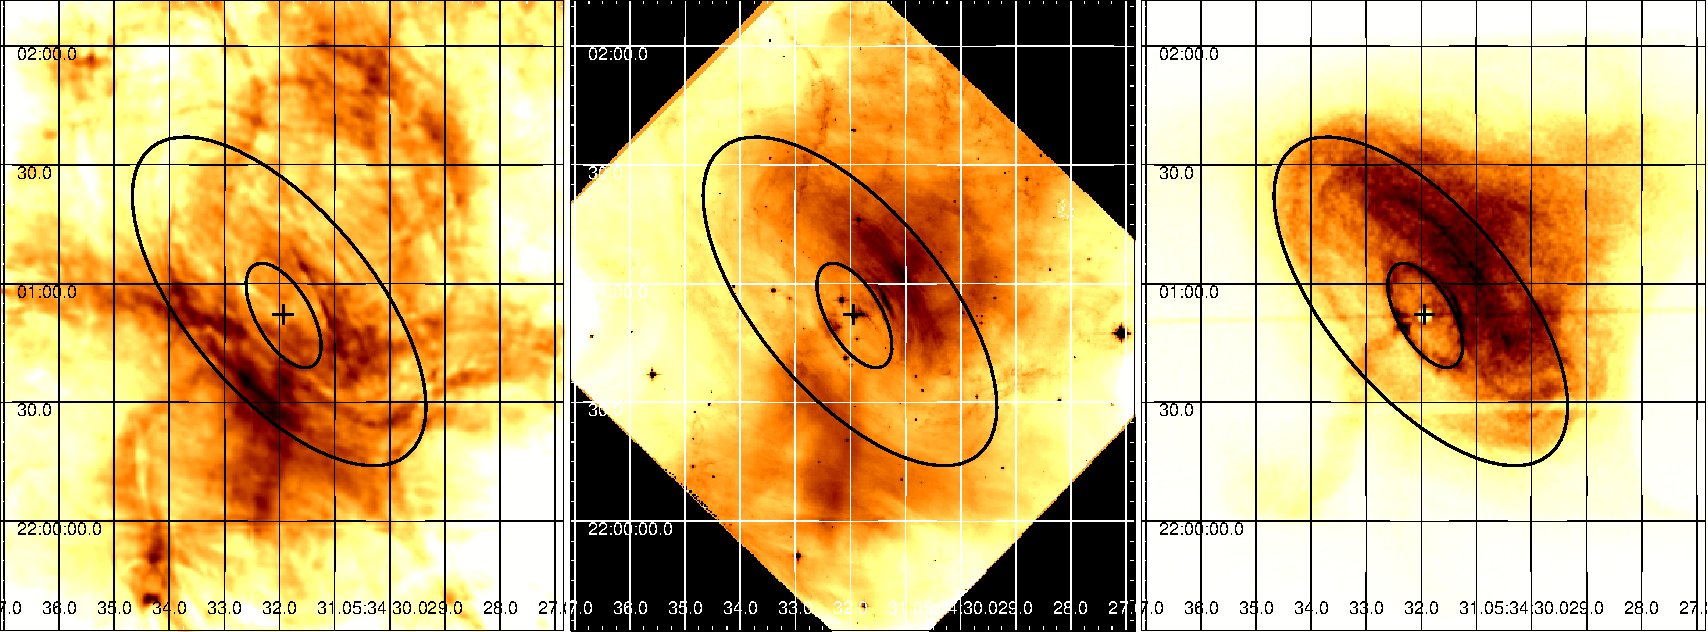
Fig. 7 shows a deep Chandra X-ray image of the Crab Nebula (contours) overlaid with the IR spectral index map from Fig. 5 (left) in magenta. The contours appear to correlate with the morphology of the X-ray emission, both from the inner torus and jet, as well as the fainter regions in the outer nebula. Comparing the spectral maps in the IR with intensities in IR and in the X-rays, Fig. 7, we find that there is a correlation, though not a one-to-one correspondence between the IR spectral maps and X-ray intensity contours.


The discussion above describes a complicated picture in the IR. First, there is clear spectral evolution towards the edges both in the optical and in the near-IR, indicating that the electrons emitting at these wavelengths also have overall cooling times shorter than the age of the Nebula (Gallant & Tuffs, 2002; Temim et al., 2006) (Turbulent mixing may smooth variations of the spectral index Tang & Chevalier, 2012; Porth et al., 2016). Second, there is some intensity and spectral correlation with X-rays, but the spectral index in the central part, , matches that of the radio emission (this could indicate that we start to see the extension of the radio component).
We interpret these somewhat contradictory facts due to the presence of two emission/acceleration components that produce nearly equal intensities in the IR, §§LABEL:themodel. Previously, Bandiera et al. (2002) argued for two separate distributions, based on significant spatial variations of the spectral index. Gallant & Tuffs (2002); Temim et al. (2006) found spectral steepening towards the PWN edges, similar to that observed in the optical band.
4 Interpretation of spectrum: two components
4.1 Location and spectra of components
In Fig. 8 we picture various acceleration regions within the Nebula, while in Figs. 9 and Fig, 10 we outline the particle distributions and the observed spectra.
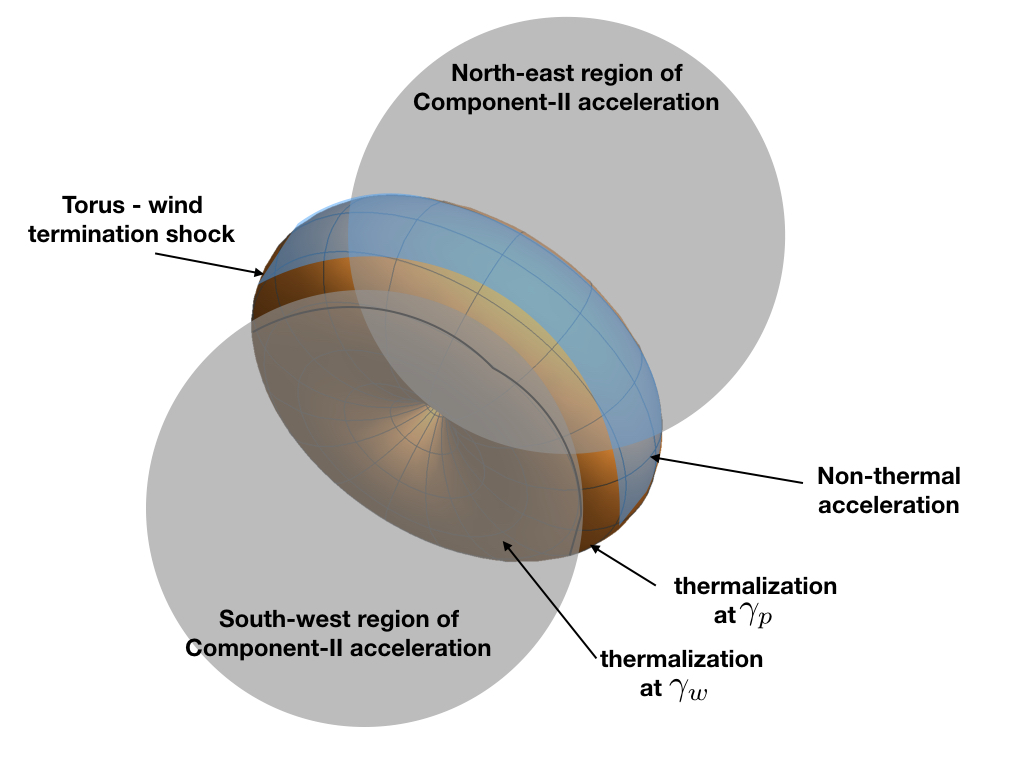
Qualitatively, there are two components that contribute to the emission; we call them Component-I and Component-II. Component-I is, using the terminology from Gamma Ray Bursts (Sari et al., 1996), in the fast cooling regime: the minimum injection energy corresponds (overall, on the time scale of the Nebula) to synchrotron emission above the spectral break associated with synchrotron cooling. Component-II is in the slow cooling regime: the injection peak is below the cooling frequency (the higher energy tail of Component-II is still affected by cooling). (Here and below we use interchangeably the terms the energy of the injected particle and the corresponding energy of the synchrotron photons.)
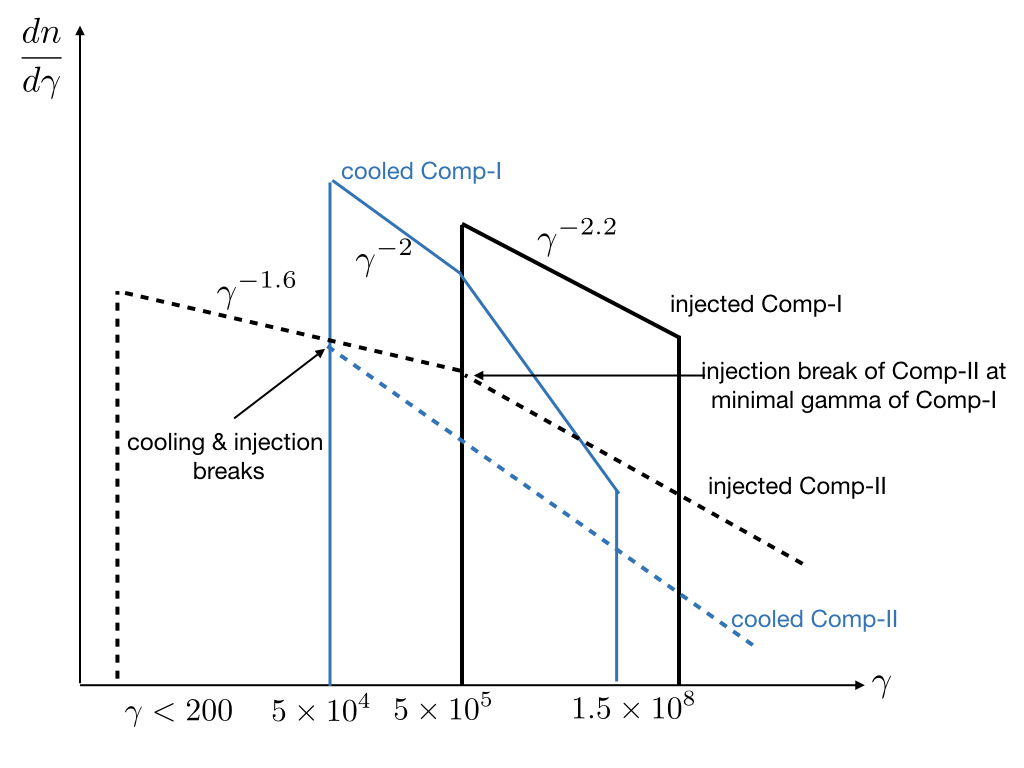
Our picture for the particle population in the Crab Nebula proposes two distinct components – one (Component-I) injected at low latitudes near the termination shock (corresponding to the Crab torus), and one (Component-II) injected at higher latitudes and subsequently modified by plasma turbulence with reconnecting current sheets in the bulk of the Nebula. This is illustrated in Fig. 9 where the solid (dashed) curves provide a qualitative description of Component-I (II). Component-I is characterized by a single power law with while Component-II is assumed to be a broken power law with indices and below and above the injection break at . The black curves represent the spectrum at the time of injection while the blue curves illustrate the evolved spectra showing breaks introduced by synchrotron cooling.
Thus, an inherent break in Component-II is assumed at injection. As we argue in §5.2.5, we expect that particle acceleration in reconnection sheets is sensitive to the average energy per particle in the wind, Eq.(23. The average energy comes from two components - bulk motion, and magnetization . As a result, we expect that Component-II has an injection break at the same energy as the minimal injection energy of the Component-I, , since both lie around the mean energy per particle
Let us summarize observational evidence, though not conclusive, for the Component-II above the IR:
-
•
Indications of a spectral break around keV in the overall spectrum of the Crab, §2.2.
-
•
Indications of spectral bump (COMPTEL bump) in the MeV region, §2.2.
-
•
The NuStar spectral map above 10 keV shows that the hardest spectra are not correlated with the keV X-ray torus, §3.1. (NuStar sensitivity above 10 keV extends to keV, so this statement applies to that energy.)
-
•
In IR the spectral index of the central part of the Nebula () matches that of the radio photons, Fig. 5.
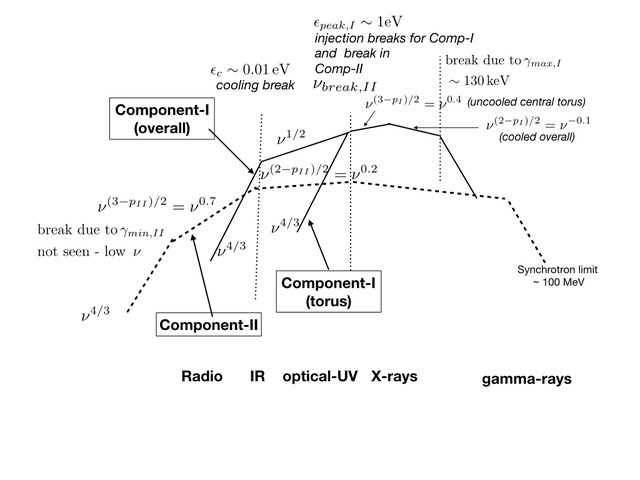
The associated synchrotron emission from each particle component is illustrated in Fig. 10 where we identify spectral indices and breaks associated with the evolution of the particle spectra, and constrained by observations of the broadband spectrum of the Crab Nebula. The associated spectral breaks (numbered as in §2.1) are (see also Table 1; the numbers given are approximate estimates and may not be unique):
-
0.
Injection break for Component-II, (not observed - corresponding synchrotron frequency below few tens of MHz)
-
1.
Radio: the required particle distribution of synchrotron emitting leptons (uncooled Component-II) is (by we mean the injected spectrum).
-
2.
Cooling break in mid-IR. Spectral steepening towards the edges in the optical Veron-Cetty & Woltjer (1993) and near-IR Gallant & Tuffs (2002); Temim et al. (2006) indicated that optical and near IR electrons are in a fast cooling regime - the cooling frequency is in the mid-IR. Particles enter the fast cooling regime, showing steepening towards the edges. The intensity of Component-I sharply drops below the cooling break, where ; above the cooling break Component-I dominates over Component-II.
-
3.
In the optical – these are the electrons from Component-I that were initially emitting in the UV and X-rays, in a fast cooling regime, but cooled down to emit in the optical. In the optical there is a clear steepening of spectral index towards the edges Veron-Cetty & Woltjer (1993).
-
4.
UV peak - - the peak emission of Component-I. This is the peak energy per particle in the equatorial part of the wind, .
-
5.
We interpret the break at keV (if it is real) as , Eq. (8), of Component-I. If the claim of the break is not supported by observations, there is no limit on .
-
6.
MeV bump - possible reappearance of Component-II. (Thus, above few hundred keV, we argue, we start to see the extension of the radio component.) If the MeV bump is not supported by observations, Component-II has a substantial spectral break between IR and X-rays.
- 7.
- 8.
| Quantity | Lorentz factor | photon energy |
|---|---|---|
| - minimal injection for Comp.-I | eV | |
| - maximal injection for Comp.-I | keV | |
| - cooling energy (both Comp.-I and Comp.-II) | eV | |
| - minimal injection for Comp.-II | MHz | |
| - break in injection spectrum for Comp.-II | eV |
Thus, our interpretation of the spectrum differs from Kennel & Coroniti (1984b) in one particularly important way: Kennel & Coroniti (1984b) (see also Bucciantini et al. (2011)) interpreted the UV break as a cooling break, and the IR break as an injection break. We argue it’s the reverse - both IR and optical spectral maps show clear evolution towards the edges, implying that IR and optical electrons have cooling time scale shorter than the life time of the Nebula.
4.2 Component-I
4.2.1 Wind Lorentz factor and magnetization
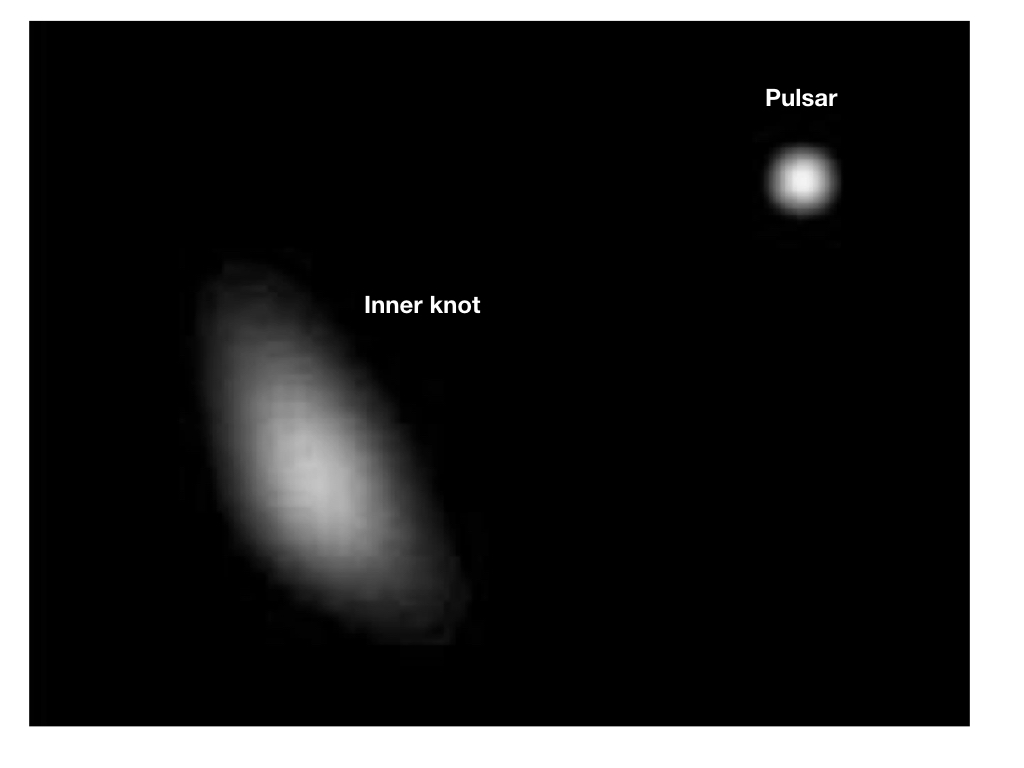
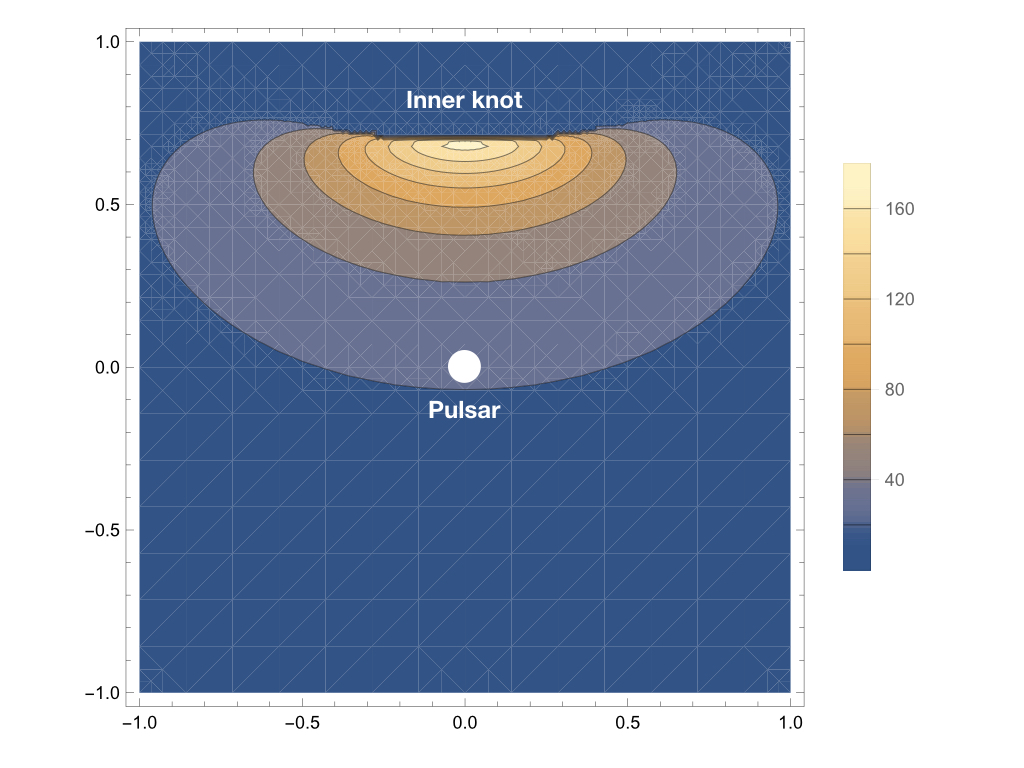
The Inner Knot in the Crab Nebula – a small bright spot close to the pulsar (Rudy et al., 2015) is interpreted as a surface of the relativistic pulsar wind termination shock (Lyutikov et al., 2016; Yuan & Blandford, 2015). Thus, its properties can be used to probe the properties of the pulsar wind. The Inner Knot is located at intermediate latitudes, off the spin axis. Importantly, the spectrum of the Inner Knot is thermal, with a peak frequency few times Hz (Porth et al., 2017, though this result has not been confirmed by others yet). The thermal nature of the knot is, first, consistent with the model of Sironi & Spitkovsky (2011a) (see also §5.1.2) that predicts that the termination shock in the striped wind does not accelerate particles outside of the sector from the equatorial plane. Second, using the model of the post-shock flow developed by Lyutikov et al. (2016), one can estimate the post-shock energy per particle . Using the peak frequency of the knot emission, and estimates of the post-shock magnetic field and Lorentz factor one finds
| (2) |
(Recall that the average energy per particle in the wind consists of the wind Lorentz factor times the magnetization, Eq. (23)). Below we will use the estimate (2) as the minimal for the Component-I.
The peak energy of Component-I is then
| (3) |
where is the non-relativistic cyclotron frequency. This matches the observed peak in the Crab spectrum.
The overall cooling break is in the IR:
| (4) | |||
| (5) |
where is the age of the Nebula.
Note the sharp dependence of and on the local magnetic field. In a fluctuating field this will produce large variations in the cooling energy; variations of the magnetic field by a factor of would produce variations in the cooling break of an order of magnitude – the cooling frequency is expected to vary by at least an order of magnitude between different regions in the Nebula.
Thus, the cooling energy calculated with the age of the Nebula is below the peak energy, . According to the terminology of Gamma-Ray Bursts this regime () is called fast cooling (Sari et al., 1996). In the fast cooling regime,
| (6) |
On the other hand, the inner parts of the Nebula – especially the torus – have dynamical times of few months, and are thus in the slow cooling regime. Thus we expect for the torus
| (7) |
plus a possible exponential break corresponding to , and synchrotron limit at MeV or less; in (6-7) the injection power-law is .
4.2.2 The torus: Component-I in slow cooling regime in the central region
In the overall spectrum of the Nebula, Fig 1, the near-IR flux of few erg cm-2 s -1 is only mildly lower than in X-rays, erg cm-2 s -1. Yet the torus is barely seen in IR, see §3. Thus the torus emission should decrease sharply below the peak. This can be achieved only if the UV peak is the injection break in the slowly cooling regime 111Overall, on the lifetime of the Nebula, Component-I is in the fast cooling regime, while the much smaller torus is in the slow cooling regime. - then the slope of changes from below the peak to and then to ) above the peak.
Consider the immediate post-termination shock region (to be called the “torus”) as a separate entity within a Nebula. Accelerated particles are injected into it (Component-I), they emit, and are advected out by the flow. Thus, the number of emitting particles within the torus region is constant in time (for approximately constant spin-down luminosity). Let’s estimate the expected ratio of intensities at two different wavelengths.
As a comparison point, we take X-rays, where the emitting particles are clearly above the injection break and are fast cooling. For frequencies below X-rays, but above the injection break (still in fast cooling), . Then comes the UV break at . If it is due to cooling then below it
| (9) |
for eV, eV, eV and .
Thus, in this case we would expect that the torus is as bright in optical and IR as in X-rays (in terms of surface brightness).
Alternatively, the UV break at can be due to injection. Then there are two cases: (i) If the residence time is sufficiently short, so that even particles with do not experience cooling, then
| (10) |
Thus, the expected torus brightness in this case is more than an order of magnitude smaller.
(ii) If particles with do cool to below the observed frequency, then
| (11) |
just somewhat smaller than (9).
Which of the estimates (10) and (11) is closer to reality? The overall estimate of the cooling break (5) is based on the age of the Nebula. But the inner regions of the Nebula have dynamical times much smaller than the age of the Nebula. As a result, the cooling break for the newly injected particles in the inner parts of the Nebula, in the torus, is at higher energies. Thus, we expect that particles with will not cool to below ( eV). Hence, estimate (10) is applicable.
These simple theoretical estimates demonstrate that intensity of the torus can decrease precipitously if we identify the UV spectral break with the injection break of Component-I. This then explains the sharp decrease of the torus emissivity from the UV towards the IR.
In principle, this does not mean that radio electrons are not accelerated at the termination shock. If a ratio of radio and X-ray emitting electrons within the same volume is , then in the same magnetic field the ratio of resulting fluxes is
| (12) |
Since - very little emission is expected from the newly injected radio particles: radio-emitting leptons are highly inefficient radiators; the overall radio emission is dominated by the accumulated long-living leptons.
In conclusion: radio electrons may be accelerated at the termination shock, but there is no observational requirement that they are accelerated at the termination shock; the shock may not accelerate any radio electrons.
4.2.3 Component-I: energetics
How do Component-I and Component-II compare energetically? Overall, most of the radiative power comes out in the UV, due to Component-I. In our model the peak UV power of Component-I comes from two related, but somewhat separate components: (i) power-law acceleration by Fermi-I process in the equatorial part, that extends from UV to X-rays – this is energetically the dominant component; (ii) thermalization at the high latitudes that produce a broad peak in the UV. The power of Component-I is related to the current spin-down power of the pulsar (since Component-I is in the fast cooling regime, most of the energy given to particles at the termination shock is radiated away).
The radiative efficiency of Component-I in case of the Crab is a few percent. For the wind power ( is the polar angle), the amount of wind energy that comes within of the equatorial plane is . Consistent with this estimate, the peak luminosity of Component-I is erg s-1, see Fig. 1, safely below the spin-down power of the Crab pulsar.
Component-I peaks in the UV at frequencies corresponding to ; it cools down to optical-IR over the lifetime of the Nebula. Thus, Component-I is in the fast cooling regime: most of the energy given to the particles during acceleration process is radiated away. To estimate the radiative efficiency of Component-I, we note that the cooling time for the eV injection peak is
| (13) |
This estimate matches really well the fact that there is a strong spectral evolution in the optical (Veron-Cetty & Woltjer, 1993).
The estimate (13) explains the radiative efficiency of the Inner Knot: Lyutikov et al. (2016) found that its radiative efficiency is . Since its spectrum peaks approximately at eV (Porth et al., 2017), similar to the peak of the overall spectrum in the Crab, this factor of is naturally explained as a ratio of the dynamic time of the Knot, few month (Rudy et al., 2015), to the cooling time scale (13). After a few months the directed post-shock flow loses directionality and becomes turbulent, so that the optical-UV emission is no longer contained within a relatively bright Inner Knot (see Lyutikov et al., 2016, for discussion of how extended is the post shock emission in the Inner Knot). Importantly, the whole flow contributes to the UV peak of Component-I, not only the equatorial belt where acceleration of X-ray emitting electrons occurs.
In conclusion, the UV peak has cooling time scale moderately small compared to the age of the Nebula – thus any small feature like the Inner Knot is not very bright. Most of the emission will be distributed. On the other hand, in X-rays the cooling time scales are similar to the dynamic time scales, only a few months, producing sharp features (the X-ray torus).
Overall, the peak intensity in of a few percent seems like a good consistent estimate of the radiative energetics of Component-I.
4.3 Component-II
4.3.1 The spectrum
The emission corresponding to the minimal injection energy of Component-II is very low, below MHz, so that (the radio power-law spectrum extends to at least 30MHz Baldwin, 1971). The cooling energy is the same as for Component-I, Eq. (5). Thus, Component-II is in the slowly cooling regime ().
In addition, Component-II has an intrinsic injection break at the minimal energy of Component-I. In this case
| (14) |
with and
4.3.2 Component-II: energetics
The luminosity of Component-II at the cooling break is erg cm2 s-1, see Fig. 1 (it grows slowly above the cooling break). So, the present total luminosity of Component-II is erg s-1, well below the spin-down luminosity (this estimate may increase due to a possible rise of Component-II towards the optical). The total energetics of Component-II for a distance of 2 kpc and age of 1000 yrs is ergs. This is a considerable fraction (few percent at least) of the total energy of the MHD flow (Kennel & Coroniti, 1984a). Since, in the IR, electrons are in a marginally cooled state, this is also the estimate of the total energetics in the particles contributing to Component-II. It is safely below the power that the pulsar put into the Nebula during its life time, regardless of the initial spin.
In other words, assume that Component-II continues without a break up to the injection energy of Component-I, eV, but only the keV part is in the fast cooling regime. In a magnetic field the corresponding Lorentz factors are , . Neglecting for simplicity the energy of Component-II above the break, the relative amount of energy deposited into the fast cooling part of Component-II is then for . Thus, approximately half of the energy transferred from the magnetic field to the particles in the reconnection events (Component-II) is given to the slowly cooling particles.
Thus, Component-II dissipates a considerable fraction of the Poynting luminosity of the wind (and most of the magnetic flux). A large fraction of the injected energy remains in the form of the turbulent magnetic field, plus approximately half of the dissipated energy is given to the slowly cooling particles. We thus conclude that the overall energetic requirement on Component-II are consistent with observations.
The fact that the energetics of Component-II is a non-negligible fraction of the total energy put into the Nebula by the pulsar is expected on theoretical grounds – in order to resolve the sigma-paradox a considerable fraction of the spin-down luminosity should be dissipated Lyutikov (2006); Porth et al. (2013). (As a cautionary note, what is needed to resolve the sigma-paradox is the destruction of the large scale magnetic flux, not magnetic energy Lyutikov (2006).)
Thus, the energetics of Component-II is very reasonable – a large fraction of the energy that the pulsar puts into the Nebula in a form of mostly Poynting flux is dissipated in reconnection events within the turbulent medium. On the other hand, the problem of the number of radio electrons remains, provided they are supplied by the wind (Atoyan, 1999b; Komissarov, 2013). For the number distribution , and assuming that the distribution extends to at least the cooling break, the total number of electrons within Component-II can be estimated as
| (15) |
Comparing with the injection rate
| (16) |
the needed multiplicity is
| (17) |
The allowed , which would still require . This is two orders of magnitude higher than the models of pulsar magnetospheres predict (e.g. Arons & Scharlemann, 1979; Timokhin, 2010).
4.3.3 Can Component-II extend to GeV energies?
Synchrotron spectra of accelerated particles may generally have two cutoffs - the synchrotron limit (de Jager et al., 1996; Lyutikov, 2010) and possibly a potential limit within the acceleration region. The synchrotron limit (independent of magnetic field) is given by Eq. (1).
The total electric potential drop with the Nebula corresponds to the maximal Lorentz factor
| (18) |
where erg s-1 is the spin-down power. It is hard/nearly impossible for particles, especially leptons, to gain the full potential (Bell, 1992, discussed how cosmic rays with large Larmor radius can achieve the potential drop).
If a particle gains a fraction of the maximal potential (18), then in a given magnetic field particles will produce synchrotron photons with energy
| (19) |
Thus, to reach the synchrotron limit (1) a particle needs to cross of the total potential (Lyutikov et al., 2018).
The example of Crab flares demonstrates that under certain conditions particles do achieve the synchrotron limit (1). Thus, there are acceleration sites that can, at least occasionally, gain large overall potentials, with . This implies that there is no intrinsic limit on (that is, there is no requirement from observations to have an intrinsic limit on the possible accelerating potential - there is no limit on , besides ).
One can then imagine a (power-law) distribution of reconnection sites with different total electric potential drops , with no special value for . The overall spectrum is then a combination of intrinsic (that may also depend on the distribution of ), distribution of , and how many particles are accelerated in a sheet with given .
4.3.4 Dominance of Component-II in radio
Scaling (6) and (14) naturally explain why Component-II dominates in radio – below the cooling frequency (globally in the IR, (5), but locally at higher frequencies) Component-I sharply drops off (as in ) and becomes subdominant to Component-II. Component-I dominates in the optical, UV and X-rays (Component-II experiences a cooling break, while Component-I increases toward the injection break). Thus, in our model it’s a natural consequence that the X-ray bright Component-I becomes subdominant below the cooling frequency (locally in the “torus” around eV, and globally around eV).
4.3.5 Explanation of the possible MeV bump/requirement of the spectral break in Component-II
Above the injection break Component-I is slowly decreasing with , while below the injection break Component-I
has globally . In the torus (in the torus particles did not have time to cool to form tail). The Component-II
above the cooling break is slowly increasing with . Thus Component-II may start to dominate over Component-I. Parametrizing spectral fluxes as:
Component-I:
| (20) |
where is the spectral flux of Component-I at the cooling energy ; above the spectral flux first increases , and then decays as .
Component-II:
| (21) |
where is the spectral flux of Component-II at the cooling energy, is the uncooled spectral index, and factor in the spectral exponent accounts for the spectral break.
The two components become equal at
| (22) |
This is clearly not seen, yet the ratio of the intensities in the X-ray band is a sensitive function of both the overall normalization and, especially, of the local magnetic field, . The ratio (22) can easily extend beyond hundreds of keV for few and few. It is tempting to associate the possible COMPTEL MeV bump, §2.2 with reemergence of Component-II.
Alternatively, in order not to overshoot Component-I in the X-rays Component-II should experience a mild spectral break somewhere between IR and hard X-rays. As we argue in §5.2.5 one might expect injection the break in Component-II corresponding to the average energy per particle, , which is the
4.3.6 Component-II: acceleration sites
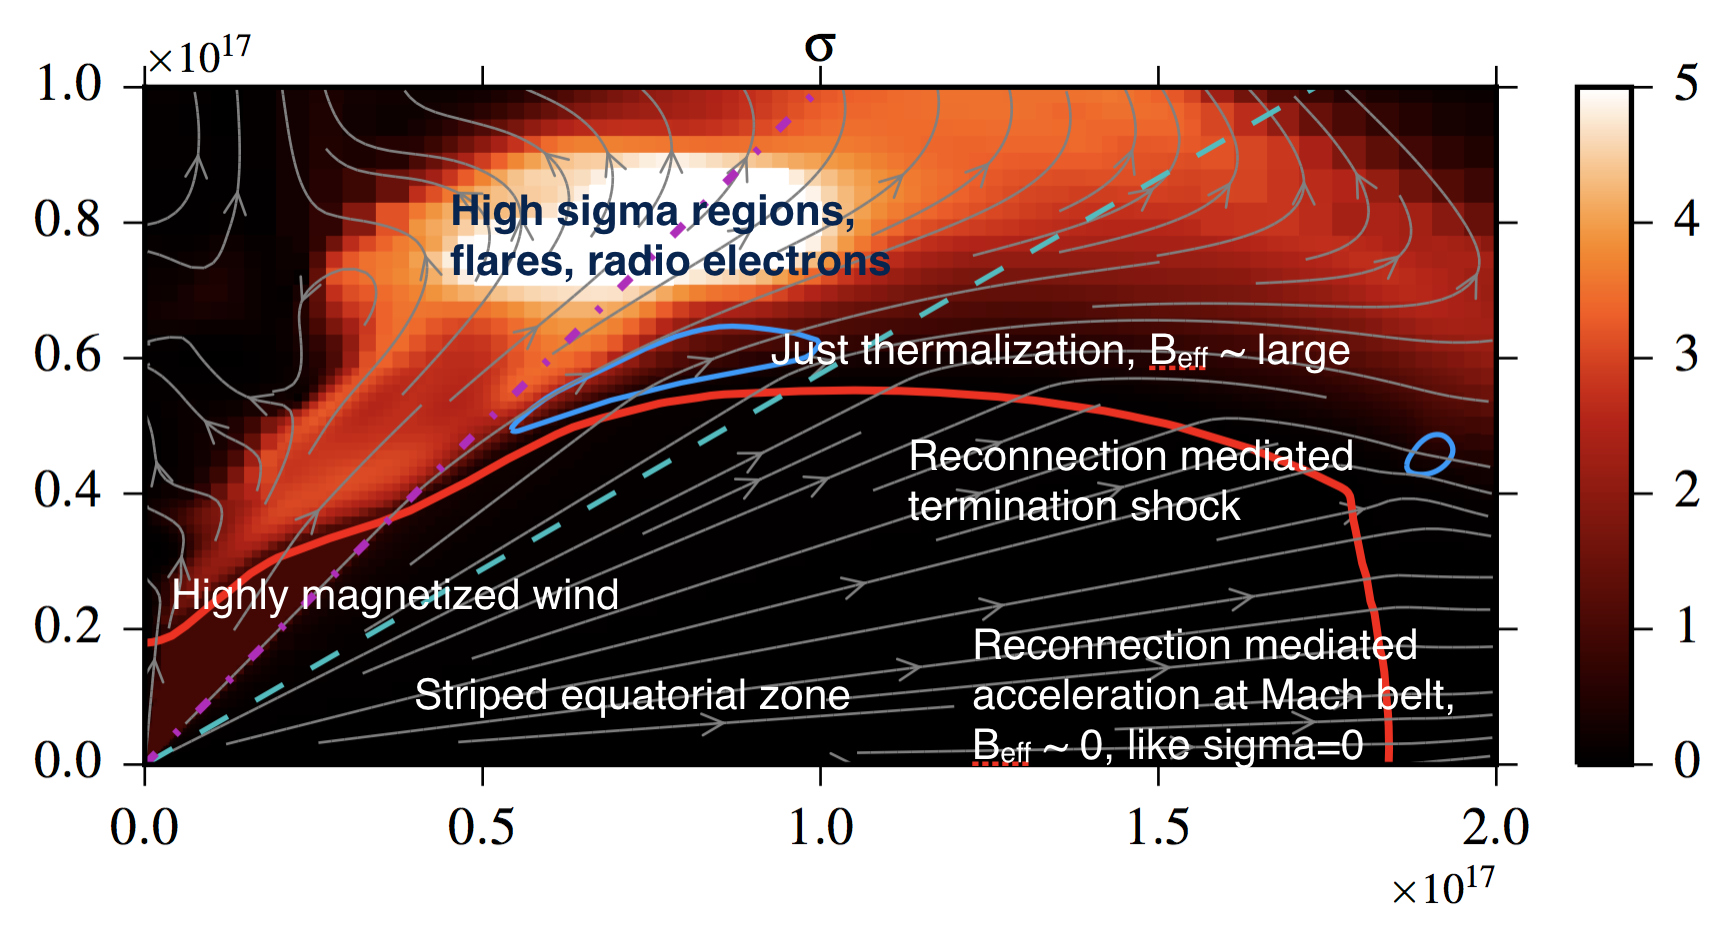
In our model Component-II is accelerated in the bulk of the Nebula, but still in the central parts, see Fig. 12. There are several arguments in favor of centrally concentrated acceleration of Component-II, as opposed to evenly distributed over the Nebula: (i) the spectrum of Component-II requires regions with high magnetization, - see §5.2.5. Such regions do exist in the central parts of the Nebula, see Fig. 12; (ii) spectral evolution in the IR towards the edges of the Nebula, Fig. 5, requires that particles are centrally accelerated, and that turbulence is not effective in mixing particles with different ages.
Even though radio emitting electrons (Component-II) are accelerated now in intermittent reconnection events, we do not expect any kind of scintillation over the radio nebula - radio electrons are very inefficient radiators, so an addition of freshly accelerated leptons to large pool of already present ones will not produce much of an enhancement, see §4.2.2 and §LABEL:whence.
5 Origin of Component-I and Component-II
Next we discuss a physical origin for Component-I and Component-II. Briefly, both components are supplied by the pulsar: the equatorial section of the termination shock accelerates Component-I, higher latitudes of the shock just thermalize the flow, while Component-II is given by particles that are accelerated in the turbulence that self-consistently generates reconnecting current sheets in the bulk of the Nebula.
5.1 Component-I: the wind termination shock
5.1.1 Component-I: insights from MHD simulations
The overall properties of the Crab X-ray emission are well reproduced by numerical models that assume low-sigma, equatorially-dominated flow (Komissarov & Lyubarsky, 2004). {comment}

In addition, modeling of the Inner Knot (Lyutikov et al., 2016; Yuan & Blandford, 2015) requires that the magnetization of the section of the pulsar wind producing the knot is low, . Thus, the agreement of X-ray observation and low-sigma numerical models require that the equatorial part of the wind must have low magnetization, . The requirement of a low-magnetized equatorial part sides nicely with the results of PIC modeling of Fermi-I acceleration in a weakly magnetized pair plasma, see §5.1.2. Thus, low-sigma MHD models and results of PIC simulations require/reproduce the Crab X-ray torus.
5.1.2 Component-I: insights from PIC simulations
Component-I is attributed to systematic Fermi-I acceleration at the relativistic shock that terminates the pulsar wind. In pulsar winds, if the rotational and magnetic axes of the central pulsar are misaligned, the wind around the equatorial plane consists of toroidal stripes of alternating magnetic polarity, separated by current sheets of hot plasma. Such a “striped wedge” extends at latitudes , where is the angle between magnetic and rotational axes of the pulsar (i.e., the pulsar inclination angle). For higher latitudes, the wind carries a non-alternating magnetic field.
Assuming that the stripes survive until the termination shock (Lyubarsky & Kirk, 2001; Kirk & Skjæraasen, 2003, but see Cerutti & Philippov 2017), we now describe the physics of particle acceleration if the pre-shock flow carries a strong magnetic field of intensity , oriented perpendicular to the shock normal and alternating with wavelength , where is the pulsar period. For the Crab nebula, we assume that the pre-shock (before the alternating stripes get annihilated) Lorentz factor of the wind is , and the pre-shock magnetization is (here, and are the wind magnetic field and mass density as measured in the frame of the nebula). Importantly, if the magnetic energy is completely transferred to the particles (either in the wind or at the shock), the mean particle Lorentz factor increases from up to
| (23) |
Although the magnetic field strength in the wind is always , the wavelength-averaged field can vary from zero up to , depending on the relative widths of the regions of positive and negative field. In pulsar winds, one expects only in the equatorial plane (where the stripes are symmetric), whereas at high latitudes (more specifically, at latitudes ). As a proxy for latitude, we choose , which varies between zero (at the midplane) and unity (at ). We now describe the expected shape of the particle spectrum as a function of (or equivalently, latitude), assuming that both and are independent of latitude. Our arguments are motivated by the results of PIC simulations described in Sironi & Spitkovsky (2011b).

At the termination shock, the compression of the flow forces the annihilation of nearby field lines through driven magnetic reconnection (Lyubarsky, 2003; Sironi & Spitkovsky, 2011a, 2012). The efficiency of field dissipation is a function of latitude. Taking as a criterion for efficient dissipation, we find that for most of the magnetic energy is dissipated, and as a result of reconnection the mean particle Lorentz factor increases from up to . The resulting shape of the reconnection-powered particle spectrum depends on the ratio , where (being the plasma frequency), namely the stripe wavelength measured in units of the post-shock particle Larmor radius (i.e., after dissipation has taken place, and the mean particle energy has increased by a factor of ). For Crab parameters, this ratio is small, and the resulting reconnection-powered particle spectrum should resemble a broad Maxwellian peaking at (Sironi & Spitkovsky, 2011a). A Maxwellian peaking at lying in a region with low residual magnetization is indeed invoked to explain the radiation spectrum of the Inner Knot.
At higher latitudes () only a moderate or minor fraction of the incoming field energy is dissipated. For , the post-shock particle spectrum consists of two Maxwellian components. The low-energy peak comes from cold plasma with mean Lorentz factor , whereas the high-energy part is populated by hot particles that gained energy from field dissipation, so that their mean Lorentz factor is now . With increasing latitude, the high-energy part gets depopulated at the expense of the low-energy part. For , i.e., at latitudes beyond the striped wedge, only the low-energy part peaking at survives. Here, the magnetic energy per particle is still large. Further downstream, in the bulk of the nebula, turbulent dissipation of the dominant magnetic energy embedded in this portion of the wind will give rise to Component-II.
As we have just discussed, on most of the shock surface, shock-driven reconnection is not expected to produce non-thermal particle distributions. Rather, depending on the latitude, in the immediate post-shock region one expects a Maxwellian peaking at or at (or a combination of the two). We do not expect to see a simple thermal bump in the integrated spectrum, though. The oblique post-shock flow has a large spread in Lorentz factors, and a corresponding large spread in the internal temperatures, (Komissarov & Lyutikov, 2011). Also, these leptons were at the lower end of the injection spectrum , and on the time scale of the Nebula they cooled off into the optical. Variations in B-field and the spread in post-shock temperatures (for oblique shocks) can erase a simple thermal distribution. {comment}
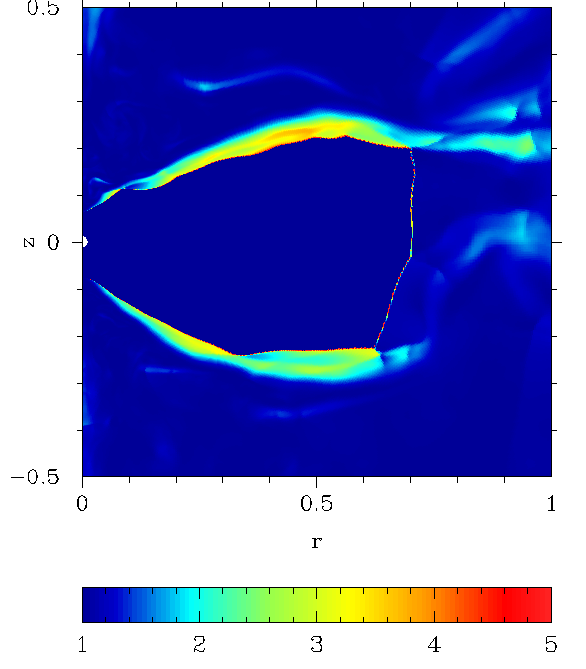
The equatorial wedge at represents an exception – here a systematic Fermi process can efficiently operate, in analogy to what happens in weakly magnetized shocks. Since the stripes are quasi-symmetric, the highest energy particles accelerated by the reconnection electric field can escape ahead of the shock, and be injected into a Fermi-I acceleration cycle by “surfing” the alternating magnetic fields (effectively, the shock in the equatorial plane has zero stripe-averaged field, and it displays the same acceleration capabilities of a weakly magnetized or unmagnetized shock, Spitkovsky 2008; Sironi et al. 2013). In the post-shock spectrum, the shock-accelerated particles populate a power-law tail with slope that extends beyond the Maxwellian at produced by reconnection. In summary, Component-I can be produced via Fermi-I acceleration in the equatorial region (at latitudes ): its minimum Lorentz factor is , and the slope of the non-thermal tail is .
5.2 Component-II: the turbulent nebula
5.2.1 Overview
We propose that magnetized turbulence generates reconnecting current sheets of different sizes in the bulk of the Nebula. Particles are then accelerated by magnetic reconnection in the current layers and by scattering off turbulent fluctuations. We suggest that this is the origin of Component-II. For a distribution of reconnecting sheets, with different sizes, that accelerate particles to some spectral slope , to different (determined by the size of the reconnection region and the inflow velocity), the final average spectrum will be a combination of intrinsic , distribution of , and how many particles are accelerated in a sheet with given . In addition, reconnection regions may occur in environments with different – there will be scaling with the relative contribution of different regions. Finally, particles can be further accelerated by stochastic interactions with turbulent fluctuations, producing a nontermal tail that extends well beyond the energy gained via magnetic reconnection alone (Comisso & Sironi 2018).
There are requirements on the spectrum of Component-II that have to be kept into consideration. Radio electrons (the low energy part of the distribution produced by Component-II) have (for the Crab). Then there will be a cooling break in the IR. On top of that, there should be another mild break, in order to extend the spectrum from radio to gamma-rays, see Fig. 10. The break may come from combination of particles accelerated in regions with different - if larger regions have on average smaller magnetization (which, in reconnection, leads to steeper slopes) then the higher energy part of the spectrum will be softer.
We expect that extra break of Component-II is related to the mean energy per particle. Thus, it is the same as of the shock-accelerated Component-I (see below).
5.2.2 Component-II: the problem of
Kennel & Coroniti (1984a, b) recognized two important problems with the radio emitting electrons in the Crab: (i) the minimal Lorentz factor for radio emitting electrons, , is well below the average energy per particle . It is expected that the termination shock heats particles to the Lorentz factor and further accelerates beyond that via Fermi-I process. Thus, Component-II requires well below the expected average energy per particles in the wind.
We already outlined a possible resolution of in §5.1.2. The pulsar wind is relativistic, , and magnetically dominated, . Thus, the total energy per particle (in terms of ) is . Within the striped part of the wind this total energy is given to the particles. We assume and ; thus, . At the intermediate attitudes, where the wind is not striped, only the bulk energy is thermalized, giving .
5.2.3 Turbulence is required to resolve the -problem
Kennel & Coroniti (1984a) identify the so-called sigma-problem of pulsar winds: models of pulsar magnetospheres predict , while such flows cannot be accommodated with the non-relativistically expanding nebula. Numerical simulations of the global structure of the Crab Nebula (Porth et al., 2014) observations of larger scale structure in radio (Dubner et al., 2017), as well as modeling of emission (Porth et al., 2016) demonstrate that the structure of the Crab Nebula is highly turbulent. {comment}

This runs contrary to the Kennel & Coroniti (1984a) model that envisions smooth evolution of the flow and the magnetic field from the termination shock to the edges. Turbulent redistribution of the magnetic flux from large scales to small scales, accompanied by the dissipation of magnetic energy, is required to resolve the sigma-problem (Lyutikov, 2006, 2010; Porth et al., 2013).
5.2.4 Very hard spectral indices in radio - not Fermi-I at shocks
The majority of PWNe have radio spectral indices (Green, 2014). This implies a particle index . Such hard spectra are not expected from a Fermi-I shock process, which typically produces (e.g. Blandford & Eichler, 1987, and §5.1.2). On the other hand, reconnection in highly magnetized plasmas can produce spectra that approach : in two dimensions (Zenitani & Hoshino, 2001, 2007; Jaroschek et al., 2004; Bessho & Bhattacharjee, 2005, 2007, 2010, 2012; Hesse & Zenitani, 2007; Daughton & Karimabadi, 2007; Lyubarsky & Liverts, 2008; Cerutti et al., 2012b; Sironi & Spitkovsky, 2014; Guo et al., 2014, 2015a; Liu et al., 2015; Nalewajko et al., 2015a; Sironi et al., 2015, 2016; Werner et al., 2016a; Kagan et al., 2016, 2018; Petropoulou & Sironi, 2018; Cerutti et al., 2014b; Lyutikov et al., 2017a, 2018, b; Cerutti et al., 2012a; Guo et al., 2015b; Nalewajko et al., 2015b; Werner et al., 2016b; Zenitani & Hoshino, 2008), and in three dimensions (Zenitani & Hoshino, 2005, 2008; Yin et al., 2008; Liu et al., 2011; Sironi & Spitkovsky, 2011a, 2012; Kagan et al., 2013; Cerutti et al., 2014c; Sironi & Spitkovsky, 2014; Guo et al., 2015a; Werner & Uzdensky, 2017). There is a clear trend: higher sigma plasmas produce harder spectra, seeming to approach in the very high-sigma limit.
5.2.5 Component-II: insights from PIC simulations
The post-shock high-latitude flow has a small mean Lorentz factor , and most of the energy per particle still resides in the magnetic field. When transported through the nebula, the magnetic energy might be dissipated, as a result of reconnection in a turbulent environment. It is well known that reconnection in magnetically dominated pair plasmas can produce hard particle spectra (Zenitani & Hoshino, 2001; Sironi & Spitkovsky, 2014; Guo et al., 2014; Werner et al., 2016a). Simulations of reconnection have shown that for (but see Petropoulou & Sironi 2018), and the slope tends asymptotically to in the limit appropriate for the Crab Nebula. However, it is conceivable to assume that the superposition of spectra from different regions in the nebula will soften the space-averaged electron spectrum of Component-II to the observed . It remains to be explored whether such a superposition is a natural result of inhomogeneities in the structure of the nebula.
We thus envision that reconnection in the nebula can naturally give the hard spectrum required for the radio electrons, above . In simulations of reconnection of an isolated current sheet, the high-energy cutoff of the particle distribution evolves quickly up to (Werner et al., 2016a), followed by a slower evolution to higher energies (Petropoulou & Sironi, 2018). In a turbulent environment, one might argue that particles energized by reconnection to Lorentz factors would be further accelerated by turbulent fluctuations (here, we neglect the factor of 4 between and ); in contrast, the particle spectrum between and will be entirely determined by reconnection, since particles will be trapped in reconnection plasmoids and cannot be effectively scattered by turbulence.
Particle acceleration in a self-similar sequence of current sheets produced by a turbulent cascade has recently been investigated by Zhdankin et al. (2017) and Comisso & Sironi (2018). These works have demonstrated that the generation of a power-law particle energy spectrum extending beyond the mean energy per particle is a generic by-product of magnetized turbulence. More specifically, Comisso & Sironi (2018) have shown that in a magnetized turbulent environment where turbulence and reconnection interplay, particle injection from the thermal bath at up to is governed by the reconnection electric field; some particles are then further accelerated by stochastic interactions with turbulent fluctuations, producing a non-thermal tail extending much beyond the mean energy per particle. The power-law slope of the high-energy tail is harder for higher magnetizations and stronger turbulence levels. While the regime appropriate for the Crab nebula is yet to be fully explored, we find that the slope can become harder than (Comisso & Sironi, 2018), but it is in general steeper than the slope generated by reconnection alone with the same parameters.
We then argue that a break in the particle distribution of Component II should appear around (this is also the location of the injection Lorentz factor for Component I): at lower energies, energization is controlled by reconnection; at higher energies, reconnection-injected particles are further accelerated by turbulence. We remark, though, that at this point this is merely an hypothesis motivated by the distinct roles of the two acceleration mechanisms, as discussed in Comisso & Sironi (2018). To assess the validity of this assumption, one will need simulations of turbulence with and a large dynamic range between the energy-carrying turbulent scales and the Larmor radius of particles energized by reconnection.
In summary, we expect the particle spectrum of Component-II to be a broken power-law: from to the space-averaged spectrum has slope (but it is locally expected to be as hard as ), in response to acceleration via reconnection; beyond the break at , particles are accelerated by a stochastic process akin to Fermi II, with a steeper slope .
The timescale of the stochastic acceleration process is comparable to that of magnetic reconnection in the strong turbulence scenario considered here. Indeed, in this regime, the energy diffusion coefficient is , as measured in Wong et al. (2019) and Comisso and Sironi 2019 (in prep.). Here, indicates the integral scale of turbulence, which specifies the energy-containing scale, and is also indicative of the size of the longest current sheets in the turbulent environment. Therefore, the stochastic acceleration timescale is fast and comparable to that of magnetic reconnection.
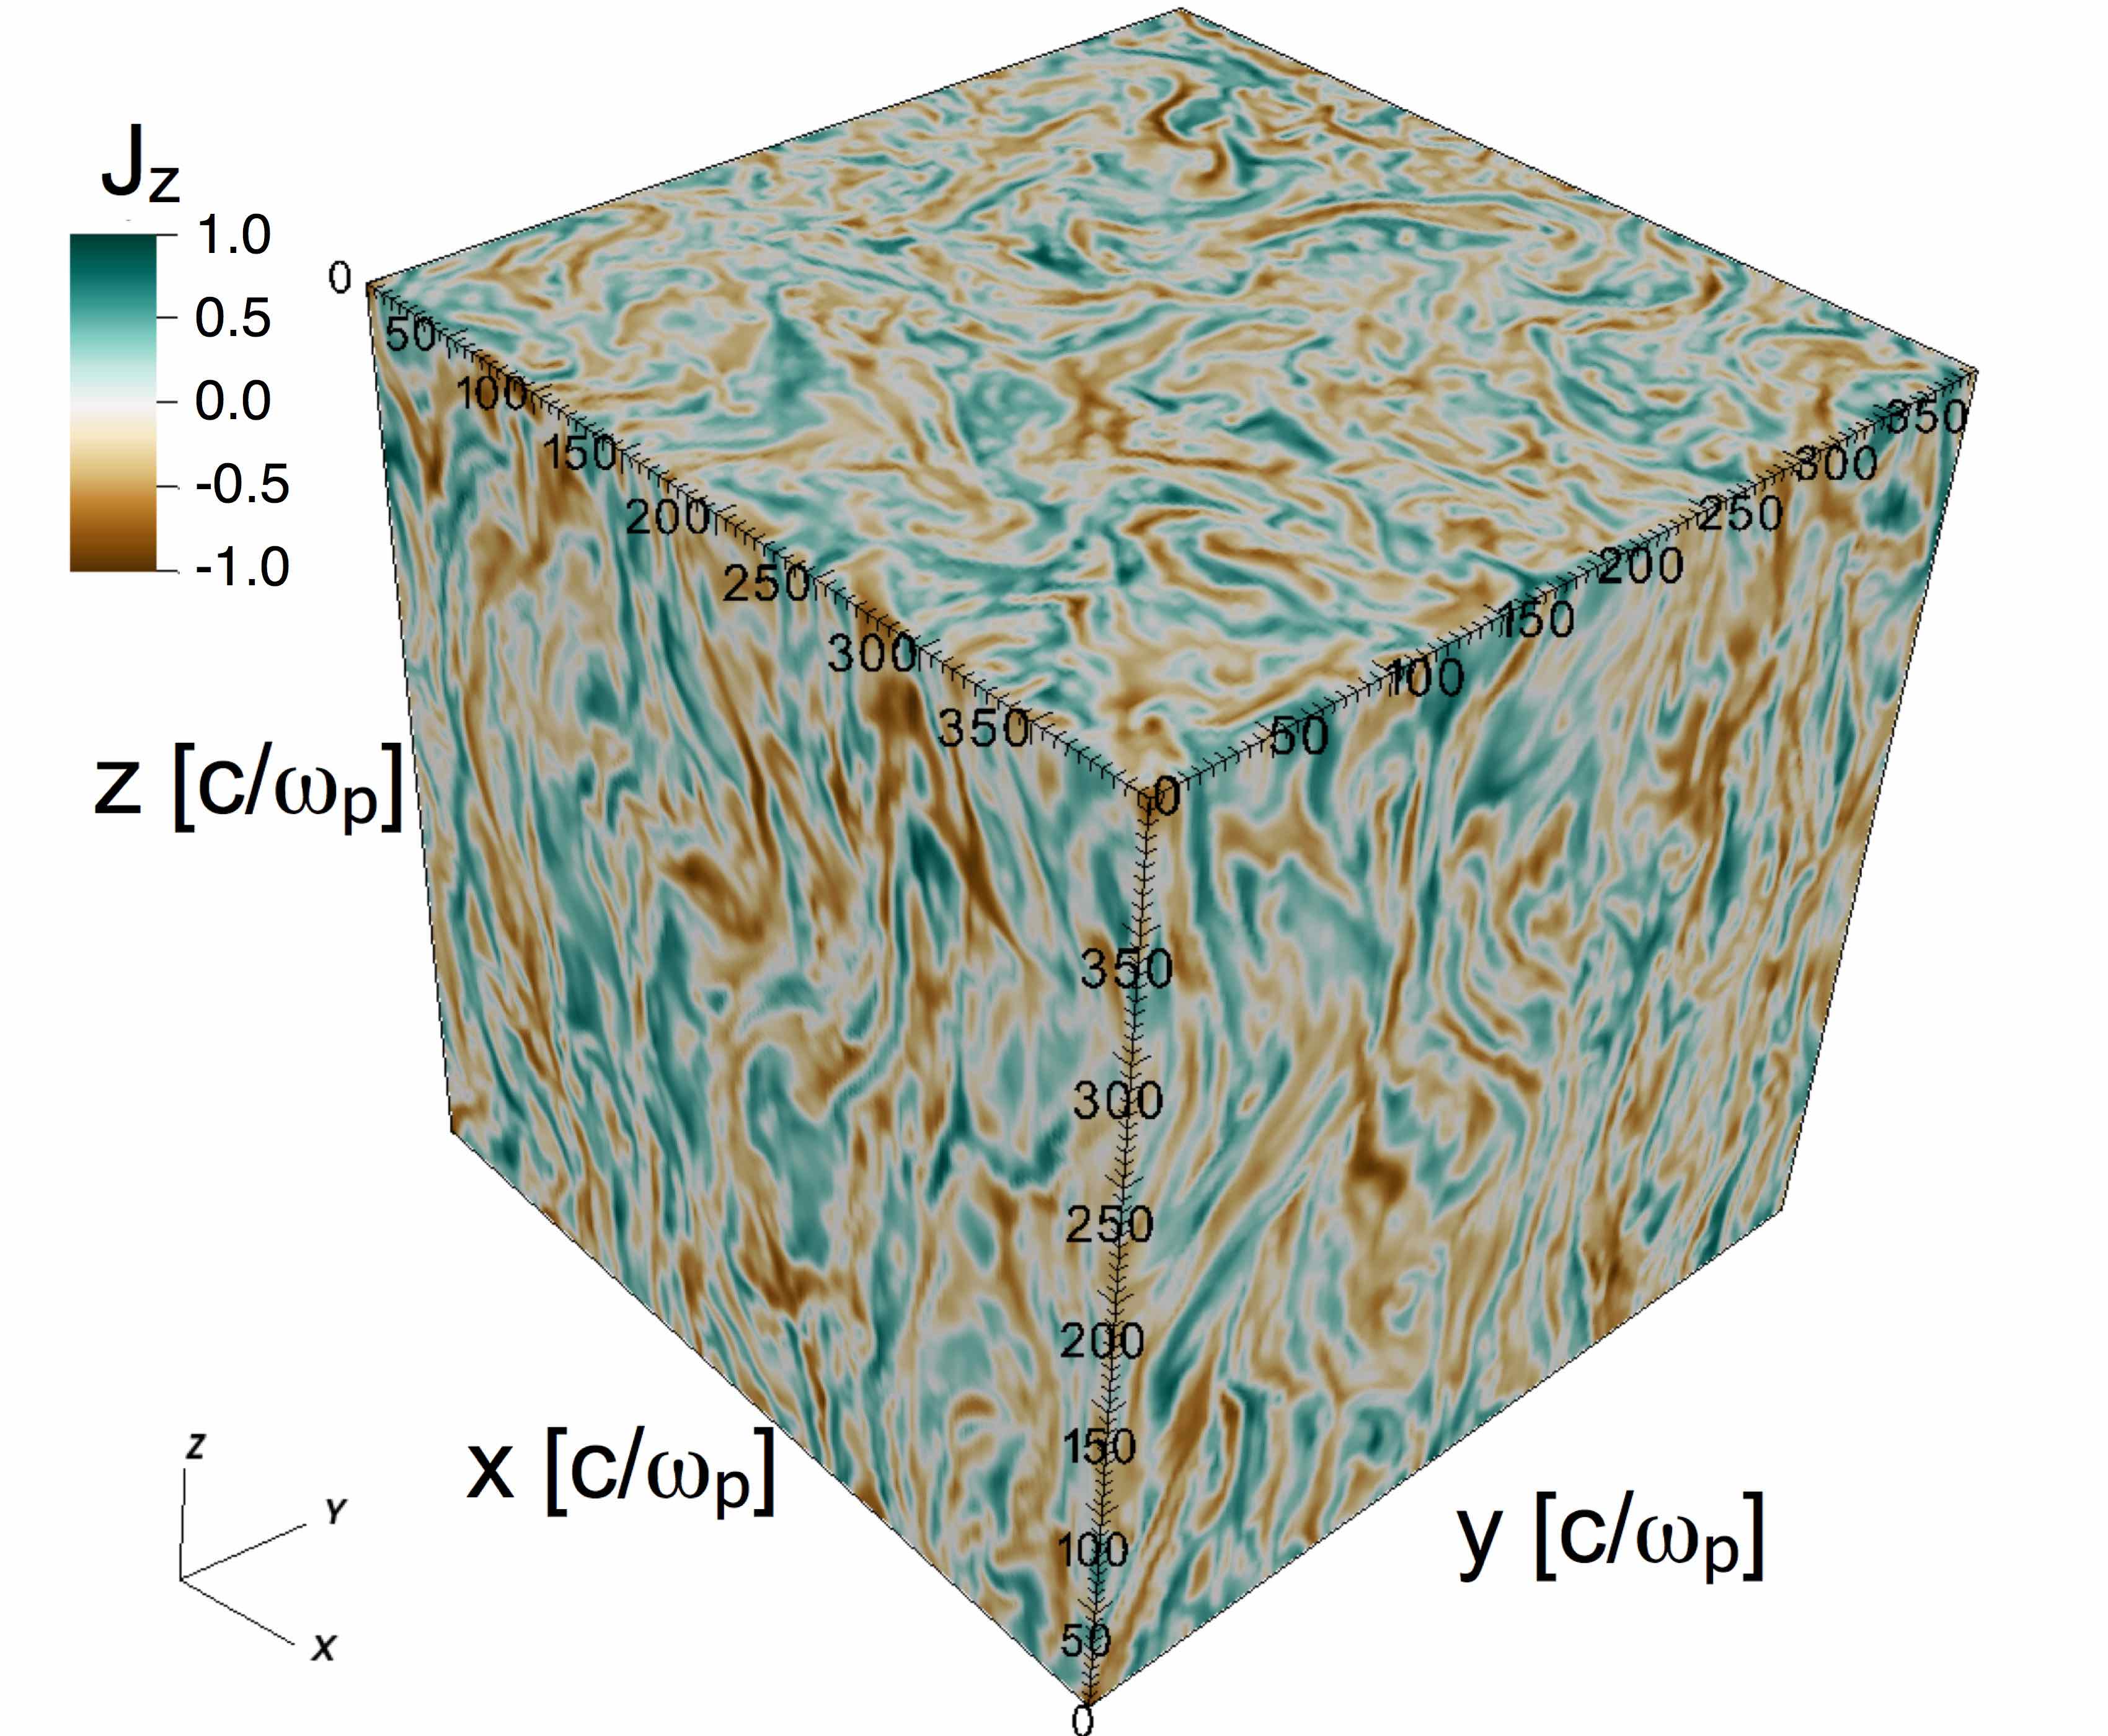

We expect that at the largest scales the statistics of current sheets might not be described as a self-similar sequence controlled by turbulent motions. There could be non-self-similar current sheets that result from large scale collisions of flux tubes (Lyutikov et al., 2017b). In this case, if , the reconnection might be responsible for particle acceleration up to the maximum available potential (for such magnetizations, , and the maximum particle energy is not constrained by the fixed energy content of the system). Particle acceleration at these large-scale current sheets, Component-II, can extend up to the synchrotron burn-off limit and beyond, thus powering the Crab Nebula gamma-ray flares (Lyutikov et al., 2017a, 2018)
6 Discussion
In this paper we advance a two-component model of the Crab Nebula broad-band synchrotron emission. Component-I arises from the shock acceleration at the equatorial part of the pulsar wind termination shock (and thermalization at higher latitudes), while Component-II is generated from the interplay between reconnection events and turbulent fluctuations in the bulk of the Nebula. We suggest that Component-II extends from radio to gamma-rays, but is subdominant to Component-I in the range from the optical band to hard X-rays. There are two independent motivations for the separate Component-II related to magnetic reconnection and turbulence: very hard radio spectra and gamma-ray flares – both are inconsistent with shock acceleration.
We envision the following structure/ acceleration properties of the Crab PWN, Fig. 12
-
•
The Crab pulsar produces a relativistic highly magnetized wind.
-
•
The equatorial part of the termination shock, of the order of around the equator, accelerates X-ray emitting particles via the reconnection-mediated Fermi-I mechanism, while at higher latitudes the reconnection-mediated shock just thermalizes the wind. This produces Component-I with .
-
•
Component-I is in the fast cooling regime on the time sale of the Nebula. Cooled leptons produce optical and near-IR emission (with a spectral index close to , steepening towards the edges).
-
•
At even higher latitudes the termination shock thermalizes only the bulk energy of the wind, .
-
•
Turbulence in high-sigma regions in the mid-to-high latitudes leads to the formation of reconnecting current sheets and turbulent fluctuations that accelerate particles from radio to MeV. Rare large-scale reconnection events lead to Crab gamma-ray flares. Radio and gamma-ray flares are produced by the same population (Component-II), different from X-rays (Component-I)
-
•
The above-GeV photons are produced by IC scattering of the synchrotron emission, in a conventional way. Subdominant extension of the synchrotron emission of Component-II to MeV energies will not change appreciably the IC component which has been previously calculated using the observed synchrotron spectra (Atoyan & Aharonian, 1996; Meyer et al., 2010; Martín et al., 2012)
We interpret the UV peak in the spectrum of the Crab Nebula as arising from the peak injection of particles accelerated at the equatorial part of the termination shock with a power-law index . The UV peak energy corresponds to the few . Optical and near-IR photons are produced by cooled leptons, both those accelerated at the equatorial part of the termination shock and those that are just thermalized at the shock at intermediate latitudes. This naturally produces spectral index .
Radio emitting particles require injection index , which is too hard for the Fermi-I acceleration. We suggest that radio emitting particles are accelerated in turbulence mediated reconnection events. Component-II experiences two breaks: a cooling break in the IR and an intrinsic injection break corresponding to the minimal Lorentz factor of Component-I. In the optical and UV Component-II is mostly overwhelmed by Component-I. The injection break in Component-II above the IR is needed for Component-II not to overshoot Component-I up to hard X-rays (if there were no break in Component-II, it would produce a slightly rising spectrum above the cooling break, that may overshoot the falling of Component-I in the X-rays). We hypothesize that Component-II extends to the synchrotron burning off limit of 100 MeV. In our model, magnetized turbulence with reconnecting current sheets accelerates both the radio electron and also produces the Crab -ray flares.
Importantly, the implied bulk Lorentz factor in the wind is fairly low, . Conventional models of particle acceleration near the polar caps (e.g. Arons & Scharlemann, 1979) predict . On the other hand, there is still no complete kinetic model of pulsar magnetospheres that include pair production and particle acceleration self-consistently.
In the present model the region eV is the most complicated: this is where several competing effects contribute nearly equally: (i) this is where the overall cooling break is for both components ( eV); (ii) where the peak of Component-I is ( eV); (iii) where Component-I cools into optical, . All these estimates are a strong function of local B-field, hence large variations are expected.
The model has several predictions:
-
•
Details of the spectrum of the torus: shape of the UV peak. The shock-produced Component-I is in the fast cooling regime on the lifetime of the Nebula, but is in the slowly cooling regime on the life-time of particles in the torus (years). In our model the UV peak is the injection break of Component-I. Thus, the spectrum of the torus should change from below the peak to (hence, it is a break not a peak). Only at higher frequencies should it steepen to . (These are asymptotic estimates, for well separated cooling, injection and the observed frequencies; more detailed computations are needed to address the shape of the UV bump.) There is another testable prediction of the model related to the UV peak. If higher latitudes only thermalize the flow, this may have an effect on the shape of the peak.
-
•
Possible reappearance of Component-II above hard X-rays. In the model, Component-II becomes subdominant to Component-I above the cooling break at eV. It may also experience an injection break at . Depending on the value of the spectral index above the break, Component-II may eventually dominate over Component-I (which is slowly decreasing with frequency above the peak). The MeV COMPTEL bump, §2.2, offers tantalizing hints.
-
•
Flares in the low MeV range. In our model the MeV COMPTEL bump, §2.2, is interpreted as a different component from the lower energy X-rays; it extends to GeV energies and occasionally produces -ray flares. We may expect flares in the lower MeV range. Flares from Component-II also occur in the X-ray region, but at those energies the integrated flux is dominated by Component-I, so that only the brightest X-ray flares could possibly be detectable.
-
•
We expect a Doppler-broadened thermal peak in the UV, corresponding to just thermalized wind component at high latitudes.
There are a number of issues that need to be addressed within the model, that we leave to the future study: a combined radiative model of the two synchrotron emitting components; (ii) calculations of the SSC spectrum within the model (e.g., whether the spatially-dependent magnetic field of G is consistent with the IC signal; (iii) calculations of the spectral evolution of Component-I (e.g., one would predict temporary hardening in optical as the peak particles from Component-I first cool into optical from the UV into optical and then into IR).
Acknowledgments
This work had been supported: ML by NSF grant AST-1306672, DoE grant DE-SC0016369 and NASA grant 80NSSC17K0757; LS: DoE DE-SC0016542, NASA Fermi NNX-16AR75G, NASA ATP NNX-17AG21G, NSF ACI-1657507, and NSF AST-1716567; PS: NASA contract NAS8-03060.
ML would like to thank Laboratoire Univers et Particules de l’Universite de Montpellier for hospitality.
We would like to thank Fabio Acero, Joe DePasquale, Gloria Dubner, Yves Gallant, Elisabeth Jourdain, Oleg Kargaltsev, Lucien Kuiper, George Pavlov, Mark Pearce, Matthieu Renaud, Steve Reynolds, Jean-Pierre Roques and Jacco Vink for comments and discussions.
References
- Abdo et al. (2011) Abdo, A. A., Ackermann, M., Ajello, M., Allafort, A., Baldini, L., Ballet, J., Barbiellini, G., & Bastieri, D. e. 2011, Science, 331, 739
- Abdo et al. (2010) Abdo et al. 2010, ApJ, 708, 1254
- Aharonian et al. (2006) Aharonian, F., Akhperjanian, A. G., Bazer-Bachi, A. R., Beilicke, M., Benbow, W., Berge, D., Bernlöhr, K., Boisson, C., Bolz, O., Borrel, V., Braun, I., Breitling, F., Brown, A. M., Bühler, R., Büsching, I., Carrigan, S., Chadwick, P. M., Chounet, L.-M., Cornils, R., Costamante, L., Degrange, B., Dickinson, H. J., Djannati-Ataï, A., O’C. Drury, L., Dubus, G., Egberts, K., Emmanoulopoulos, D., Espigat, P., Feinstein, F., Ferrero, E., Fiasson, A., Fontaine, G., Funk, S., Funk, S., Gallant, Y. A., Giebels, B., Glicenstein, J. F., Goret, P., Hadjichristidis, C., Hauser, D., Hauser, M., Heinzelmann, G., Henri, G., Hermann, G., Hinton, J. A., Hofmann, W., Holleran, M., Horns, D., Jacholkowska, A., de Jager, O. C., Khélifi, B., Komin, N., Konopelko, A., Kosack, K., Latham, I. J., Le Gallou, R., Lemière, A., Lemoine-Goumard, M., Lohse, T., Martin, J. M., Martineau-Huynh, O., Marcowith, A., Masterson, C., McComb, T. J. L., de Naurois, M., Nedbal, D., Nolan, S. J., Noutsos, A., Orford, K. J., Osborne, J. L., Ouchrif, M., Panter, M., Pelletier, G., Pita, S., Pühlhofer, G., Punch, M., Raubenheimer, B. C., Raue, M., Rayner, S. M., Reimer, A., Reimer, O., Ripken, J., Rob, L., Rolland, L., Rowell, G., Sahakian, V., Saugé, L., Schlenker, S., Schlickeiser, R., Schwanke, U., Sol, H., Spangler, D., Spanier, F., Steenkamp, R., Stegmann, C., Superina, G., Tavernet, J.-P., Terrier, R., Théoret, C. G., Tluczykont, M., van Eldik, C., Vasileiadis, G., Venter, C., Vincent, P., Völk, H. J., Wagner, S. J., & Ward, M. 2006, A&A, 457, 899
- Arons & Scharlemann (1979) Arons, J. & Scharlemann, E. T. 1979, ApJ, 231, 854
- Atoyan (1999a) Atoyan, A. M. 1999a, A&A, 346, L49
- Atoyan (1999b) —. 1999b, A&A, 346, L49
- Atoyan & Aharonian (1996) Atoyan, A. M. & Aharonian, F. A. 1996, MNRAS, 278, 525
- Baldwin (1971) Baldwin, J. E. 1971, in IAU Symposium, Vol. 46, The Crab Nebula, ed. R. D. Davies & F. Graham-Smith, 22
- Bandiera et al. (2002) Bandiera, R., Neri, R., & Cesaroni, R. 2002, A&A, 386, 1044
- Bell (1992) Bell, A. R. 1992, MNRAS, 257, 493
- Bessho & Bhattacharjee (2005) Bessho, N. & Bhattacharjee, A. 2005, Physical Review Letters, 95, 245001
- Bessho & Bhattacharjee (2007) —. 2007, Physics of Plasmas, 14, 056503
- Bessho & Bhattacharjee (2010) —. 2010, Physics of Plasmas, 17, 102104
- Bessho & Bhattacharjee (2012) —. 2012, ApJ, 750, 129
- Bietenholz et al. (1997) Bietenholz, M. F., Kassim, N., Frail, D. A., Perley, R. A., Erickson, W. C., & Hajian, A. R. 1997, ApJ, 490, 291
- Blandford & Eichler (1987) Blandford, R. & Eichler, D. 1987, Phys. Rep., 154, 1
- Bucciantini et al. (2011) Bucciantini, N., Arons, J., & Amato, E. 2011, MNRAS, 410, 381
- Cerutti & Philippov (2017) Cerutti, B. & Philippov, A. A. 2017, A&A, 607, A134
- Cerutti et al. (2012a) Cerutti, B., Uzdensky, D. A., & Begelman, M. C. 2012a, ApJ, 746, 148
- Cerutti et al. (2012b) Cerutti, B., Werner, G. R., Uzdensky, D. A., & Begelman, M. C. 2012b, ApJ, 754, L33
- Cerutti et al. (2013) —. 2013, ApJ, 770, 147
- Cerutti et al. (2014a) —. 2014a, Physics of Plasmas, 21, 056501
- Cerutti et al. (2014b) —. 2014b, ApJ, 782, 104
- Cerutti et al. (2014c) —. 2014c, ApJ, 782, 104
- Clausen-Brown & Lyutikov (2012) Clausen-Brown, E. & Lyutikov, M. 2012, MNRAS, 426, 1374
- Comisso & Sironi (2018) Comisso, L. & Sironi, L. 2018, Physical Review Letters, 121, 255101
- Daughton & Karimabadi (2007) Daughton, W. & Karimabadi, H. 2007, Physics of Plasmas, 14, 072303
- de Jager et al. (1996) de Jager, O. C., Harding, A. K., Michelson, P. F., Nel, H. I., Nolan, P. L., Sreekumar, P., & Thompson, D. J. 1996, ApJ, 457, 253
- Del Zanna et al. (2004) Del Zanna, L., Amato, E., & Bucciantini, N. 2004, A&A, 421, 1063
- Draine (1989) Draine, B. T. 1989, in ESA Special Publication, Vol. 290, Infrared Spectroscopy in Astronomy, ed. E. Böhm-Vitense
- Dubner et al. (2017) Dubner, G., Castelletti, G., Kargaltsev, O., Pavlov, G. G., Bietenholz, M., & Talavera, A. 2017, ApJ, 840, 82
- Gallant & Tuffs (2002) Gallant, Y. A. & Tuffs, R. J. 2002, in Astronomical Society of the Pacific Conference Series, Vol. 271, Neutron Stars in Supernova Remnants, ed. P. O. Slane & B. M. Gaensler, 161
- Green (2014) Green, D. A. 2014, Bulletin of the Astronomical Society of India, 42, 47
- Guo et al. (2014) Guo, F., Li, H., Daughton, W., & Liu, Y.-H. 2014, Physical Review Letters, 113, 155005
- Guo et al. (2015a) Guo, F., Liu, Y.-H., Daughton, W., & Li, H. 2015a, ApJ, 806, 167
- Guo et al. (2015b) —. 2015b, ApJ, 806, 167
- Hesse & Zenitani (2007) Hesse, M. & Zenitani, S. 2007, Physics of Plasmas, 14, 112102
- Indebetouw et al. (2005) Indebetouw, R., Mathis, J. S., Babler, B. L., Meade, M. R., Watson, C., Whitney, B. A., Wolff, M. J., Wolfire, M. G., Cohen, M., Bania, T. M., Benjamin, R. A., Clemens, D. P., Dickey, J. M., Jackson, J. M., Kobulnicky, H. A., Marston, A. P., Mercer, E. P., Stauffer, J. R., Stolovy, S. R., & Churchwell, E. 2005, ApJ, 619, 931
- Jaroschek et al. (2004) Jaroschek, C. H., Lesch, H., & Treumann, R. A. 2004, ApJ, 605, L9
- Jourdain & Roques (2009) Jourdain, E. & Roques, J. P. 2009, ApJ, 704, 17
- Kagan et al. (2013) Kagan, D., Milosavljević, M., & Spitkovsky, A. 2013, ApJ, 774, 41
- Kagan et al. (2016) Kagan, D., Nakar, E., & Piran, T. 2016, ArXiv e-prints
- Kagan et al. (2018) —. 2018, MNRAS, 476, 3902
- Kennel & Coroniti (1984a) Kennel, C. F. & Coroniti, F. V. 1984a, ApJ, 283, 694
- Kennel & Coroniti (1984b) —. 1984b, ApJ, 283, 710
- Kirk & Skjæraasen (2003) Kirk, J. G. & Skjæraasen, O. 2003, ApJ, 591, 366
- Komissarov (2013) Komissarov, S. S. 2013, MNRAS, 428, 2459
- Komissarov & Lyubarsky (2004) Komissarov, S. S. & Lyubarsky, Y. E. 2004, MNRAS, 349, 779
- Komissarov & Lyutikov (2011) Komissarov, S. S. & Lyutikov, M. 2011, MNRAS, 414, 2017
- Kuiper et al. (2001) Kuiper, L., Hermsen, W., Cusumano, G., Diehl, R., Schönfelder, V., Strong, A., Bennett, K., & McConnell, M. L. 2001, A&A, 378, 918
- Lazarian & Vishniac (1999) Lazarian, A. & Vishniac, E. T. 1999, ApJ, 517, 700
- Liu et al. (2011) Liu, W., Li, H., Yin, L., Albright, B. J., Bowers, K. J., & Liang, E. P. 2011, Physics of Plasmas, 18, 052105
- Liu et al. (2015) Liu, Y.-H., Guo, F., Daughton, W., Li, H., & Hesse, M. 2015, Physical Review Letters, 114, 095002
- Lyubarsky & Kirk (2001) Lyubarsky, Y. & Kirk, J. G. 2001, ApJ, 547, 437
- Lyubarsky & Liverts (2008) Lyubarsky, Y. & Liverts, M. 2008, ApJ, 682, 1436
- Lyubarsky (2003) Lyubarsky, Y. E. 2003, MNRAS, 345, 153
- Lyutikov (2006) Lyutikov, M. 2006, New Journal of Physics, 8, 119
- Lyutikov (2010) —. 2010, MNRAS, 405, 1809
- Lyutikov et al. (2018) Lyutikov, M., Komissarov, S., & Sironi, L. 2018, Journal of Plasma Physics, 84, 635840201
- Lyutikov et al. (2016) Lyutikov, M., Komissarov, S. S., & Porth, O. 2016, MNRAS, 456, 286
- Lyutikov et al. (2017a) Lyutikov, M., Sironi, L., Komissarov, S. S., & Porth, O. 2017a, Journal of Plasma Physics, 83, 635830601
- Lyutikov et al. (2017b) —. 2017b, Journal of Plasma Physics, 83, 635830602
- Madsen et al. (2015) Madsen, K. K., Reynolds, S., Harrison, F., An, H., Boggs, S., Christensen, F. E., Craig, W. W., Fryer, C. L., Grefenstette, B. W., Hailey, C. J., Markwardt, C., Nynka, M., Stern, D., Zoglauer, A., & Zhang, W. 2015, ApJ, 801, 66
- Martín et al. (2012) Martín, J., Torres, D. F., & Rea, N. 2012, MNRAS, 427, 415
- Meyer et al. (2010) Meyer, M., Horns, D., & Zechlin, H.-S. 2010, A&A, 523, A2
- Nalewajko et al. (2015a) Nalewajko, K., Uzdensky, D. A., Cerutti, B., Werner, G. R., & Begelman, M. C. 2015a, ApJ, 815, 101
- Nalewajko et al. (2015b) —. 2015b, ApJ, 815, 101
- Olmi et al. (2014) Olmi, B., Del Zanna, L., Amato, E., Bandiera, R., & Bucciantini, N. 2014, MNRAS, 438, 1518
- Olmi et al. (2015) Olmi, B., Del Zanna, L., Amato, E., & Bucciantini, N. 2015, MNRAS, 449, 3149
- Petropoulou & Sironi (2018) Petropoulou, M. & Sironi, L. 2018, ArXiv e-prints
- Porth et al. (2017) Porth, O., Buehler, R., Olmi, B., Komissarov, S., Lamberts, A., Amato, E., Yuan, Y., & Rudy, A. 2017, Space Sci. Rev., 207, 137
- Porth et al. (2013) Porth, O., Komissarov, S. S., & Keppens, R. 2013, MNRAS, 431, L48
- Porth et al. (2014) —. 2014, MNRAS, 438, 278
- Porth et al. (2016) Porth, O., Vorster, M. J., Lyutikov, M., & Engelbrecht, N. E. 2016, MNRAS, 460, 4135
- Rees & Gunn (1974) Rees, M. J. & Gunn, J. E. 1974, MNRAS, 167, 1
- Reynolds (2001) Reynolds, S. P. 2001, Space Science Reviews, 99, 177
- Reynolds et al. (2017) Reynolds, S. P., Pavlov, G. G., Kargaltsev, O., Klingler, N., Renaud, M., & Mereghetti, S. 2017, Space Sci. Rev., 207, 175
- Rudy et al. (2015) Rudy, A., Horns, D., DeLuca, A., Kolodziejczak, J., Tennant, A., Yuan, Y., Buehler, R., Arons, J., Blandford, R., Caraveo, P., Costa, E., Funk, S., Hays, E., Lobanov, A., Max, C., Mayer, M., Mignani, R., O’Dell, S. L., Romani, R., Tavani, M., & Weisskopf, M. C. 2015, ApJ, 811, 24
- Sari et al. (1996) Sari, R., Narayan, R., & Piran, T. 1996, ApJ, 473, 204
- Schweizer et al. (2013) Schweizer, T., Bucciantini, N., Idec, W., Nilsson, K., Tennant, A., Weisskopf, M. C., & Zanin, R. 2013, MNRAS, 433, 3325
- Seward et al. (2006) Seward, F. D., Tucker, W. H., & Fesen, R. A. 2006, ApJ, 652, 1277
- Sironi et al. (2016) Sironi, L., Giannios, D., & Petropoulou, M. 2016, MNRAS, 462, 48
- Sironi et al. (2015) Sironi, L., Petropoulou, M., & Giannios, D. 2015, MNRAS, 450, 183
- Sironi & Spitkovsky (2011a) Sironi, L. & Spitkovsky, A. 2011a, ApJ, 741, 39
- Sironi & Spitkovsky (2011b) —. 2011b, ApJ, 726, 75
- Sironi & Spitkovsky (2012) —. 2012, Computational Science and Discovery, 5, 014014
- Sironi & Spitkovsky (2014) —. 2014, ApJ, 783, L21
- Sironi et al. (2013) Sironi, L., Spitkovsky, A., & Arons, J. 2013, ApJ, 771, 54
- Spitkovsky (2008) Spitkovsky, A. 2008, ApJ, 673, L39
- Tang & Chevalier (2012) Tang, X. & Chevalier, R. A. 2012, ApJ, 752, 83
- Tavani et al. (2011) Tavani, M., Bulgarelli, A., Vittorini, V., Pellizzoni, A., Striani, E., Caraveo, P., Weisskopf, M. C., Tennant, A., Pucella, G., Trois, A., Costa, E., Evangelista, Y., Pittori, C., Verrecchia, F., Del Monte, E., Campana, R., Pilia, M., De Luca, A., Donnarumma, I., Horns, D., Ferrigno, C., Heinke, C. O., Trifoglio, M., Gianotti, F., Vercellone, S., Argan, A., Barbiellini, G., Cattaneo, P. W., Chen, A. W., Contessi, T., D’Ammando, F., DeParis, G., Di Cocco, G., Di Persio, G., Feroci, M., Ferrari, A., Galli, M., Giuliani, A., Giusti, M., Labanti, C., Lapshov, I., Lazzarotto, F., Lipari, P., Longo, F., Fuschino, F., Marisaldi, M., Mereghetti, S., Morelli, E., Moretti, E., Morselli, A., Pacciani, L., Perotti, F., Piano, G., Picozza, P., Prest, M., Rapisarda, M., Rappoldi, A., Rubini, A., Sabatini, S., Soffitta, P., Vallazza, E., Zambra, A., Zanello, D., Lucarelli, F., Santolamazza, P., Giommi, P., Salotti, L., & Bignami, G. F. 2011, Science, 331, 736
- Temim et al. (2006) Temim, T., Gehrz, R. D., Woodward, C. E., Roellig, T. L., Smith, N., Rudnick, L., Polomski, E. F., Davidson, K., Yuen, L., & Onaka, T. 2006, AJ, 132, 1610
- Timokhin (2010) Timokhin, A. N. 2010, MNRAS, 408, 2092
- van der Meulen et al. (1998) van der Meulen, R. D., Bloemen, H., Bennett, K., Hermsen, W., Kuiper, L., Much, R. P., Ryan, J., Schonfelder, V., & Strong, A. 1998, A&A, 330, 321
- Veron-Cetty & Woltjer (1993) Veron-Cetty, M. P. & Woltjer, L. 1993, A&A, 270, 370
- Weisskopf et al. (2013) Weisskopf, M. C., Tennant, A. F., Arons, J., Blandford, R., Buehler, R., Caraveo, P., Cheung, C. C., Costa, E., de Luca, A., Ferrigno, C., Fu, H., Funk, S., Habermehl, M., Horns, D., Linford, J. D., Lobanov, A., Max, C., Mignani, R., O’Dell, S. L., Romani, R. W., Striani, E., Tavani, M., Taylor, G. B., Uchiyama, Y., & Yuan, Y. 2013, ApJ, 765, 56
- Werner & Uzdensky (2017) Werner, G. R. & Uzdensky, D. A. 2017, ApJ, 843, L27
- Werner et al. (2016a) Werner, G. R., Uzdensky, D. A., Cerutti, B., Nalewajko, K., & Begelman, M. C. 2016a, ApJ, 816, L8
- Werner et al. (2016b) —. 2016b, ApJ, 816, L8
- Willingale et al. (2001) Willingale, R., Aschenbach, B., Griffiths, R. G., Sembay, S., Warwick, R. S., Becker, W., Abbey, A. F., & Bonnet-Bidaud, J.-M. 2001, A&A, 365, L212
- Wong et al. (2019) Wong, K., Zhdankin, V., Uzdensky, D. A., Werner, G. R., & Begelman, M. C. 2019, arXiv e-prints, arXiv:1901.03439
- Yin et al. (2008) Yin, L., Daughton, W., Karimabadi, H., Albright, B. J., Bowers, K. J., & Margulies, J. 2008, Physical Review Letters, 101, 125001
- Yuan & Blandford (2015) Yuan, Y. & Blandford, R. D. 2015, MNRAS, 454, 2754
- Zanin (2017) Zanin, R. 2017, in Astrophysics and Space Science Library, Vol. 446, Modelling Pulsar Wind Nebulae, ed. D. F. Torres, 101
- Zenitani & Hoshino (2001) Zenitani, S. & Hoshino, M. 2001, ApJ, 562, L63
- Zenitani & Hoshino (2005) —. 2005, Physical Review Letters, 95, 095001
- Zenitani & Hoshino (2007) —. 2007, ApJ, 670, 702
- Zenitani & Hoshino (2008) —. 2008, ApJ, 677, 530
- Zhdankin et al. (2017) Zhdankin, V., Werner, G. R., Uzdensky, D. A., & Begelman, M. C. 2017, Physical Review Letters, 118, 055103