Emerging angular momentum
physics from kinematic surveys
Abstract
I review the insights emerging from recent large kinematic surveys of galaxies at low redshift, with particular reference to the SAMI, CALIFA and MaNGA surveys. These new observations provide a more comprehensive picture of the angular momentum properties of galaxies over wide ranges in mass, morphology and environment in the present-day universe. I focus on the distribution of angular momentum within galaxies of various types and the relationship between mass, morphology and specific angular momentum. I discuss the implications of the new results for models of galaxy assembly.
keywords:
galaxies: kinematics and dynamics, galaxies: structure, galaxies: evolution galaxies: formation, galaxies: stellar content1 Introduction
This brief review focusses on recent integral field spectroscopy surveys of the stellar kinematics in large samples of galaxies at low redshifts. It does not cover radio HI surveys of the neutral gas in low-redshift galaxies (which are important for understanding the kinematics at large radius) nor does it extend to surveys at high redshifts (which explore the origin and evolution of galaxy kinematics). What local surveys of stellar kinematics can tell us about angular momentum in galaxies is its dependence on mass, morphology and other properties (if sample selection is understood) and its dependence on environment (if the sample is embedded in a fairly complete redshift survey); such dependencies can provide indirect evidence for the origin and evolution of angular momentum.
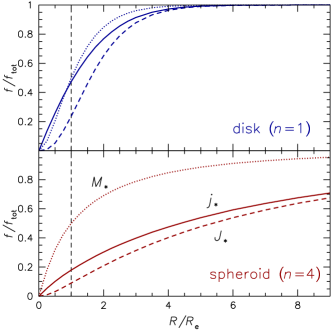
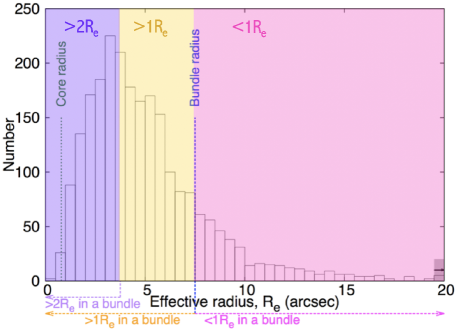
It is immediately apparent that all current kinematic surveys have weaknesses relating to the trade-offs demanded by instrumental constraints: firstly, between spatial resolution and spatial coverage (also between spectral resolution and spectral coverage) and, secondly, between this per-galaxy information and sample size (also sample volume and completeness). The lack of radial coverage is a serious problem for late-type disk galaxies having exponential mass profiles (i.e. having Sersic index ), for which ,0.8 at ,1.8 and ,0.8 at ,2.2. But it is a much worse problem for early-type spheroidal galaxies with deVaucouleurs profiles (), for which ,0.8 at ,3.2 and ,0.8 at ,9 (see Figure 1a). This problem is compounded by the necessary instrumental trade-off between radial coverage (field of view) and spatial resolution (spaxel scale) of integral field units (IFUs) due to constraints imposed by the limited available detector area. For example, in the SAMI sample the median major axis is arcsec (10–-90% range spans 1.8-–9.4 arcsec) which means that the SAMI IFUs only sample out to a median radius of 1.7 (see Figure 1b).
2 Surveys
2.1 SAMI
SAMI is the Sydney-AAO Multi-IFU instrument on the 3.9m Anglo-Australian Telescope (AAT). It has 13 IFUs that can be positioned over a 1 degree field at the telescope’s prime focus. Each hexabundle IFU has 61 1.6 arcsec fibres covering a 15 arcsec diameter field of view. SAMI feeds the AAOmega spectrograph, which gives spectra over 375–575nm at 1800 (70 km s-1) and 630–740nm at 4300 (30 km s-1). The SAMI Second Data Release (DR2) includes 1559 galaxies (about half the full sample) covering 0.004 z 0.113 and 7.5 11.6. The core data products for each galaxy are two primary spectral cubes (blue and red), three spatially binned spectral cubes, and a set of standardised aperture spectra. For each core data product there are a set of value-added data products, including aperture and resolved stellar kinematics, aperture emission line properties, and Lick indices and stellar population parameters. The data release is available online through AAO Data Central (datacentral.org.au).
2.2 CALIFA
CALIFA is the Calar Alto Legacy Integral Field survey, consisting of integral field spectroscopy for 667 galaxies obtained with PMAS/PPak on the Calar Alto 3.5m telescope. There are three different spectral setups: 375–750 nm at 0.6 nm FWHM resolution for 646 galaxies, 365–484 nm at 0.23 nm FWHM resolution for 484 galaxies, and a combination of these over 370–750 nm at 0.6 nm FWHM resolution for 446 galaxies. The CALIFA Main Sample spans 0.005 0.03 and the colour-magnitude diagram, with a wide range of stellar masses, ionization conditions and morphological types; the CALIFA Extension Sample includes rare types of galaxies that are scarce or absent in the Main Sample.
2.3 MaNGA
MaNGA is the Mapping Nearby Galaxies at Apache Point Observatory survey (part of SDSS-IV). It is studying the internal kinematic structure and composition of gas and stars in 10,000 nearby galaxies. It employs 17 fibre-bundle IFUs varying in diameter from 12 arcsec (19 fibres) to 32 arcsec (127 fibers) that feed two dual-channel spectrographs covering 360–1030 nm at 2000. The targets have based on SDSS-I redshifts and -band luminosities. The MaNGA sample is designed to approximate uniform radial coverage in terms of , a flat stellar mass distribution, and a wide range of environments. SDSS Data Release 14 (DR14) includes MaNGA data cubes for 2812 galaxies.
2.4 Comparison
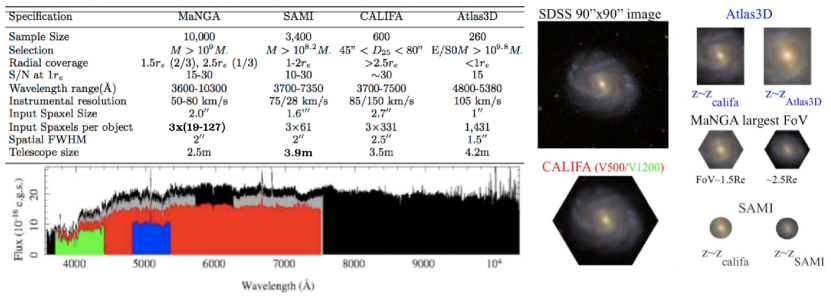
Figure 2 provides a tabular and graphical summary of the parameters of these three surveys (and also the earlier Atlas3D survey), which helps to understand their various relative strengths and weaknesses, and consequently their complementarities. A few kinematic surveys of small samples offer greater radial coverage and higher velocity resolution: SLUGGS surveyed kinematics of 25 early-type galaxies to 3 from stars and to 10 using globular clusters ([Bellstedt et al. (2018), Bellstedt et al. 2018]); PN.S surveyed the kinematics of 33 early-type galaxies to 10 using planetary nebulae ([Pulsoni et al. (2018), Pulsoni et al. 2018]).
3 Results
3.1 Role of angular momentum
After mass, angular momentum is the most important driver of galaxy properties, with a key role in the formation of structure and morphology. For regular oblate rotators, angular momentum can be derived from dynamical models as well as direct estimates of projected angular momentum. Surveys can determine population variations in the total angular momentum and its distribution with radius, exploring dependencies on mass, morphology, ellipticity and other properties. These relations can provide insights on the assembly histories of galaxies for comparison with simulations.
3.2 Angular momentum & spin profiles
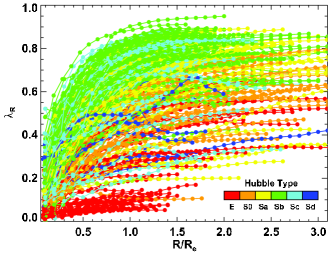
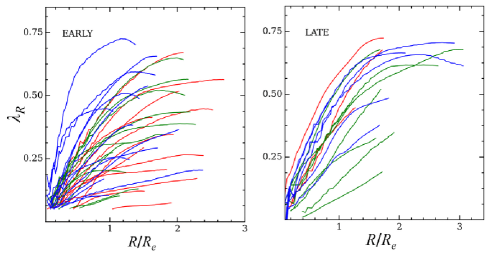
SAMI, CALIFA and MaNGA together now provide angular momentum profiles (or, alternatively, spin proxy, , as a function of ) for thousands of galaxies to 1 and for hundreds of galaxies to 2. These samples are large enough to be useful when split by mass, morphology or environment. Figure 3 shows spin profiles for galaxies from the CALIFA survey ([Falcón-Barroso (2016), Falcón-Barroso 2016]) and the MaNGA survey ([Greene et al. (2018), Greene et al. 2018]); [Foster et al. (2018)] give similar results from the SAMI survey.
3.3 Spin, morphology & ellipticity
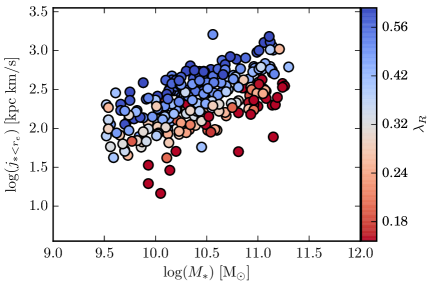
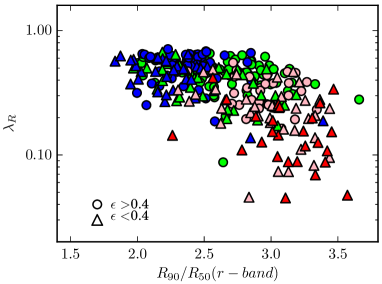
Typical galaxies lie on a plane relating mass , and stellar distribution (quantified by, e.g., Sersic index or photometric concentration index), with overall morphologies regulated by their mass and dynamical state (see, e.g., [Cortese et al. (2016), Cortese et al. 2016]). The correlation shown in the left panel of Figure 4 between the offset from the mass–angular momentum (-–) relation and spin parameter shows that at fixed the contribution of ordered motions to dynamical support varies by more than a factor of three. The right panel of Figure 4 shows that correlates strongly with morphology and concentration index (especially if slow-rotators are removed), suggesting that late-type galaxies and early-type fast-rotators form a continuous class in terms of their kinematic properties.
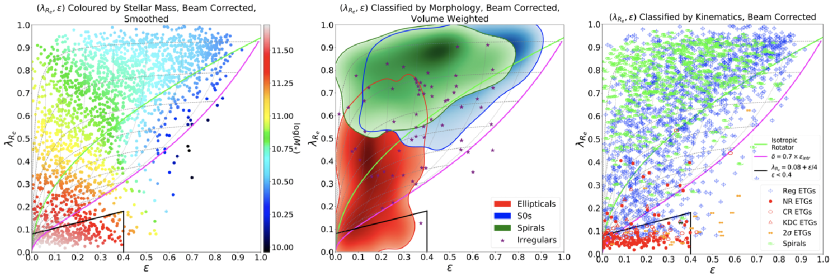
The spin–ellipticity (–) diagram is a particularly revealing frame for understanding relations between kinematic and morphological properties of galaxies. This is illustrated in Figure 5, from the work of [Graham et al. (2018)] using the MaNGA survey. The left panel shows the strong correlation between the mass of a galaxy and its position in this diagram, with more massive galaxies tending to have lower spin and ellipticity. The central panel shows the areas of the diagram occupied by various morphological types: elliptical galaxies occupy the low-, low- region, while lenticular and spiral galaxies largely overlap, covering the full range of at 0.5. The right panel shows how galaxies belonging to different kinematic classes are distributed: spirals generally lie in the region consistent with rotationally-dominated kinematics, while regular (fast-rotating) early-type galaxies occupy a wider range of at given , with lower corresponding to systems with more pressure-support; slowly-rotating (‘non-rotating’) early-type galaxies mainly occupy the region with 0.15 and 0 0.4.
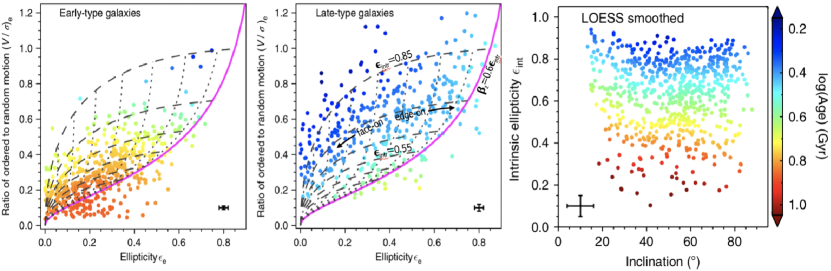
There is also an strong correlation between a galaxy’s spin parameter and its intrinsic ellipticity, as demonstrated using the SAMI survey by [van de Sande et al. (2018)]. Figure 6 shows the distribution of the ratio of rotation velocity to velocity dispersion () with apparent ellipticity () for early-type and late-type galaxies, together with the inferred distribution of intrinsic ellipticity (). This is derived using the theoretical model predictions for rotating, oblate, axisymmetric spheroids with varying intrinsic shape and anisotropy shown by the dashed and dotted lines in the left two panels. The galaxies are colour-coded by the luminosity-weighted age of their stellar populations, and the righthand panel shows the clear trend of age with intrinsic ellipticity. As [van de Sande et al. (2018)] discuss in detail, this newly discovered relation extends beyond the general notion that ‘disks are young’ and ‘bulges are old’.
3.4 The mass–angular momentum relation
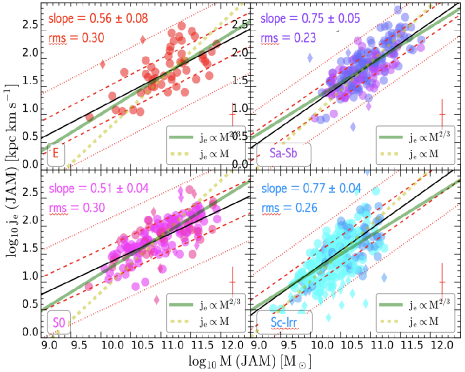
The mass–angular momentum (-–) relation is discussed in detail elsewhere in these proceedings. However, it is worth noting the opportunties for studying this key relation that follow from large surveys providing kinematics for many galaxies. Some prelminary results from the SAMI survey are shown in Figure 7 (D’Eugenio et al., in prep.), using hundreds of galaxies with masses and angular momenta derived from self-consistent dynamical models—in this case, Jeans anisotropic mass (JAM) models. This permits the study of the -– relation for subsets of the population, such as different morphological types. While the results shown here are too preliminary to allow conclusions to be drawn, the opportunities are clear.
4 Summary
This is a golden age for studying galaxy angular momentum. Large kinematic surveys using integral field spectrographs are vastly increasing the amount and richness of the available information Sample sizes are now beginning to allow studies of the dependence on multiple simultaneous influences (mass/morphology/environment…) The main limitations remain instrumental trade-offs between spatial resolution and radial coverage, and challenges in spatial resolution and surface brightness at higher redshift.
References
- [Bellstedt et al. (2018)] Bellstedt, S., Forbes, D.A., Romanowsky, A. J., et al., 2018, MNRAS, 476, 4543 [DOI: 10.1093/mnras/sty456]
- [Cortese et al. (2016)] Cortese, L., Fogarty, L.M.R., Bekki, K., et al., 2016, MNRAS, 463, 170 [DOI: 10.1093/mnras/stw1891]
- [Falcón-Barroso (2016)] Falcón-Barroso, J., 2016, Astronomical Surveys and Big Data, ASP Conf. Series, 505, 133 [ADS: 2016ASPC..505..133F]
- [Foster et al. (2018)] Foster, C., van de Sande, J., Cortese, L., et al., 2018, MNRAS, 480, 3105 [DOI: 10.1093/mnras/sty2059]
- [Graham et al. (2018)] Graham, M.T., Cappellari, M., Li, H., et al., 2018, MNRAS, 477, 4711 [DOI: 10.1093/mnras/sty504]
- [Greene et al. (2018)] Greene, J.E., Leauthaud, A., Emsellem, E., et al., 2018, ApJ, 852, 36 [DOI: 10.3847/1538-4357/aa9bde]
- [Pulsoni et al. (2018)] Pulsoni, C., Gerhard, O., Arnaboldi, et al., 2018, A&A, 618, 94 [DOI: 10.1051/0004-6361/201732473]
- [Sanchez et al. (2015)] Sánchez, Sebastián F., & The CALIFA Collaboration, 2015, Galaxies in 3D across the Universe, IAU Symposium 309, pp85-92 [DOI: 10.1017/S1743921314009375]
- [van de Sande et al. (2018)] van de Sande, J., Scott, N., Bland-Hawthorn, J., et al., 2018, Nature Astronomy, 2, 483 [DOI: 10.1038/s41550-018-0436-x]