Perfect separation of intraband and interband excitations in PdCoO2
Abstract
The temperature dependence of the optical properties of the delafossite PdCoO2 has been measured in the a-b planes over a wide frequency range. The optical conductivity due to the free-carrier (intraband) response falls well below the interband transitions, allowing the plasma frequency to be determined from the f-sum rule. Drude-Lorentz fits to the complex optical conductivity yield estimates for the free-carrier plasma frequency and scattering rate. The in-plane plasma frequency has also been calculated using density functional theory. The experimentally-determined and calculated values for the plasma frequencies are all in good agreement; however, at low temperature the optically-determined scattering rate is much larger than the estimate for the transport scattering rate, indicating a strong frequency-dependent renormalization of the optical scattering rate. In addition to the expected in-plane infrared-active modes, two very strong features are observed that are attributed to the coupling of the in-plane carriers to the out-of-plane longitudinal optic modes.
pacs:
63.20.-e, 72.15.Lh, 78.30.-jI Introduction
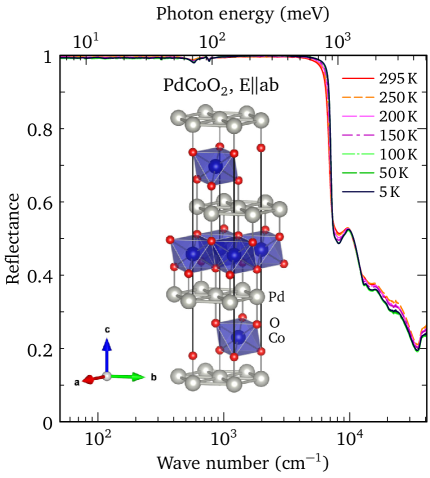
The delafossite PdCoO2 is one of only a handful of transition metal oxides whose in-plane resistivity at room temperature rivals that of silver or copper (), establishing a new benchmark for conducting metal oxides Shannon et al. (1971). Perhaps even more remarkable is the large resistivity ratio () and extremely low in-plane residual resistivity at low temperature, ncm Tanaka et al. (1996); Hicks et al. (2012), which may place this material in the hydrodynamic limit Moll et al. (2016); Zaanen (2016). Given the quasi two-dimensional (2D) behavior of this material Tanaka et al. (1996), it is inevitable to compare it with the 2D cuprate materials, perhaps the most studied of the conducting metal oxides. The cuprates are typically described as bad metals Emery and Kivelson (1995) in which the resistivity often shows a peculiar non-saturating linear temperature dependence that may violate the Mott-Ioffe-Regel limit at high temperatureHussey et al. (2004); MIR ; the optical conductivity reveals an unusual free-carrier response where the scattering rate is strongly renormalized with frequency, resulting in an incoherent response that merges with other bound excitations Basov and Timusk (2005). Surprisingly, in both of these materials the free carriers originate from a single band at the Fermi level. The common structural motif in the cuprates is the square copper-oxygen plaquettes where the conducting states originate; however, PdCoO2 is different in that it crystalizes in the trigonal (166) space group, consisting of Pd triangular layers and CoO2 triangular slabs Shannon et al. (1971), shown in the inset of Fig. 1. There is theoretical Seshadri et al. (1998); Eyert et al. (2008); Kim et al. (2009); Ong et al. (2010) as well as experimental Noh et al. (2009) evidence that the density of states at the Fermi level is dominated by Pd rather than Co, indicating that the conduction originates in the Pd layers. The exceptionally long in-plane mean free paths of m at low temperature implies that the Pd layers are almost completely free of any disorder, since the mean free path corresponds to lattice spacings Mackenzie (2017), a situation that is difficult to justify given that the crystals are grown using flux-based techniques.
In this work the complex optical properties of PdCoO2 have been determined for light polarized in the a-b planes over a wide frequency range at a variety of temperatures. The real part of the optical conductivity reveals that the free-carrier response is completely isolated from the interband transitions, allowing the plasma frequency to be determined from the f-sum rule. The free-carrier response has also been fit using the Drude-Lorentz model, returning values for the plasma frequency and scattering rate. In addition, the in-plane and out-of-plane plasma frequencies and interband optical conductivities have been calculated using density functional theory. The calculated and experimentally-determined plasma frequencies are all in good agreement. However, at low temperature the experimentally-determined optical scattering rate is much larger than the estimated transport scattering rate; this disagreement may only be resolved if the optical scattering rate is assumed to vary quadratically with frequency (Fermi liquid), as opposed to the linear dependence observed in the cuprates (marginal Fermi liquid). Finally, in addition to the expected in-plane infrared-active modes, two very strong features are attributed to the coupling of the in-plane carriers with the out-of-plane longitudinal optic (LO) modes Reedyk and Timusk (1992), indicating the presence of electron-phonon coupling.
II Experiment
Single crystals of PdCoO2 were grown in an evacuated quartz ampoule with a mixture of PdCl2 and CoO as described in Refs. Shannon et al., 1971; Takatsu et al., 2010, yielding thin platelets of typical dimensions . The reflectance of PdCoO2 was measured at a near-normal angle of incidence for light polarized in the a-b planes at a variety of temperatures over a wide frequency range ( meV to 5 eV) using an overfilling and in situ evaporation technique Homes et al. (1993). While the reflectance contains a great deal of information, it is a combination of the real and imaginary parts of the refractive index, and as such it is not an intuitive quantity. The complex optical properties have been calculated from a Kramers-Kronig analysis of the reflectance Dressel and Grüner (2001); Wooten (1972), which requires extrapolations for . Below the lowest-measured frequency point, a Hagen-Rubens form is employed, , where is chosen to match the data. Above the highest-measured frequency, the reflectance is assumed to have the power-law dependence up to cm-1, above which a free-electron behavior is assumed.
III Results and Discussion
The temperature dependence of the reflectance is shown in over a wide frequency range in Fig. 1; a remarkable feature of the reflectance is its extremely high value () over the far- and mid-infrared regions, with a sharp plasma edge at cm-1 ( eV). We note that this measurement is particularly challenging because at room temperature the in-plane reflectance of PdCoO2 in this region is already higher than that of gold or silver Lynch and Hunter (1985), two elements that are used as optical references. Despite the dramatic decrease in the resistivity at low temperature Hicks et al. (2012), the only noticeable change in the reflectance is a slight sharpening of the plasma edge. Interestingly, there is also structure in the cm-1 region, the energy range associated with lattice vibrations.
III.1 Complex conductivity
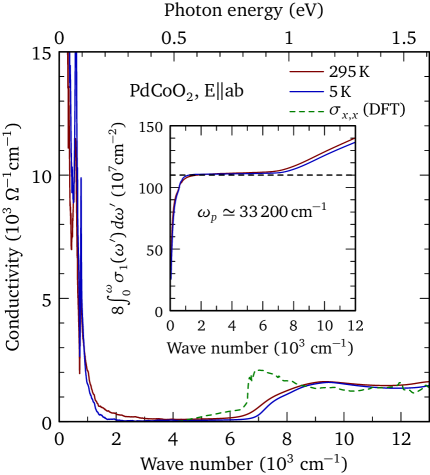
The real part of the optical conductivity is shown over a wide spectral region at 295 and K in Fig. 2. Interestingly, at low temperature the low-frequency conductivity associated with the free-carrier response is limited to below cm-1; as a consequence, there is no overlap with the interband transitions which are observed above cm-1. The f-sum rule allows that in the absence of other excitations, , where is the square of plasma frequency with carrier concentration and effective mass , and the cut-off frequency is chosen so that converges smoothly (here has the units of cm-1). The inset in Fig. 2 shows the result of this conductivity sum rule up to eV; the integral has converged by about cm-1, yielding a value of cm-1 at both 295 and 5 K; this is close to the value of cm-1 determined from a de Haas–van Alphen study Hicks et al. (2012).
The optical conductivity may also be fit to the Drude-Lorentz model with the complex dielectric function ,
| (1) |
where is the real part of the dielectric function at high frequency, is previously defined, and is the scattering rate for the delocalized (Drude) carriers; typically, is nearly identical to the scattering rate determined from transport measurements, . In the summation, , and are the position, width, and strength of the th transverse optic (TO) mode or a bound excitation, respectively. The complex conductivity is (in units of cm-1), where is the impedance of free space.
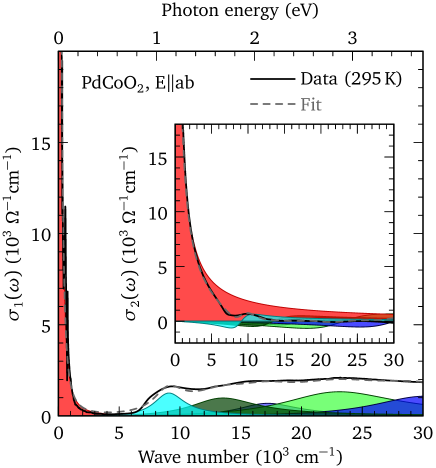
The results of the simultaneous fit to the real and imaginary parts of the optical conductivity of PdCoO2 at 295 K for light polarized in the a-b planes with a single Drude component and five Lorentz oscillators using a non-linear least-squares technique is shown in Fig. 3; the values of the fitted parameters are listed in Table 1. The fit to the real part of the optical conductivity returns a Drude component with cm-1 and cm-1. While the result for the plasma frequency is in excellent agreement with the value determined from the f-sum rule, the value for is more than an order of magnitude smaller than the scattering rate suggested from photoemission experiments Noh et al. (2009). The corresponding fit to the imaginary part of the optical conductivity in the inset of Fig. 3 indicates that the free-carrier response extends well into the mid-infrared region and allows the high-frequency part of the dielectric function to be determined, . A minimal number of oscillators has been used to describe the relatively flat optical conductivity at high frequency; however, it should be noted that the placement of the high-frequency mode () is somewhat arbitrary.
III.2 Scattering rates
Using the Drude expression for the dc conductivity with the values for the fitted parameters at 295 K yields cm-1, or in terms of the resistivity, cm, which is close to the transport value, cm Hicks et al. (2012). Given that Takatsu et al. (2007), and , then at low temperature cm-1; however, fits to both the optical conductivity and the plasma edge in the reflectance at K yield the significantly larger values of cm-1. While a value for cm-1 might reasonably be thought to result in a plasma edge in the reflectance that resembles a step function, the proximity to nearby interband transitions has the effect of significantly broadening this feature.
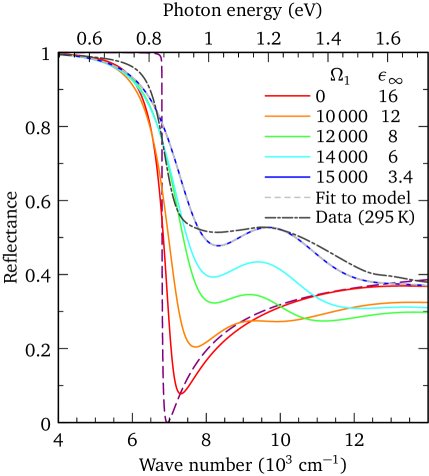
To demonstrate this effect, the reflectance has been calculated at a normal angle of incidence; is the Fresnel reflectance, which is related to the dielectric function through the complex refractive index, . The Drude reflectance is initially calculated in the absence of any interband excitations for cm-1 with a scattering rate of cm-1, and (the value of is chosen to place the renormalized plasma frequency, , close to the experimentally-observed position); the resulting plasma edge is extremely sharp with a sharp drop at just over 0.8 eV that resembles a step function, shown by the dashed line in Fig. 4.
The five interband excitations in Table 1 have been added to the reflectance; however, the low-frequency oscillator is described by cm-1, with width cm-1, and a gradually increasing value of the oscillator strength of cm-1 (the values of have been adjusted by hand to keep the value of the reflectance at high frequency roughly constant); the addition of the interband terms, the low-frequency oscillator in particular, has the effect of broadening the Drude plasma edge considerably, as well as shifting the minima to higher frequency. The broadened nature of the plasma edge in the reflectance might make it difficult to determine the intrinsic value of the free-carrier scattering rate.
| Component | , | , | ||
|---|---|---|---|---|
| Drude | 97 | 33317 | ||
| Lorentz | 1 | 9099 | 3067 | 15200 |
| Lorentz | 2 | 13555 | 6620 | 19760 |
| Lorentz | 3 | 17223 | 6085 | 15880 |
| Lorentz | 4 | 23135 | 11585 | 30360 |
| Lorentz | 5 | 30200 | 10557 | 26190 |
To test this possibility, we have fit the upper curve in Fig. 4 that most closely resembles the experimental reflectance at 295 K (dash-dot line) using the model values in Table 2 (the remaining high-frequency oscillators are taken from Table 1), employing a spectral resolution of 8 cm-1 (less than or equal to the experimental resolution in the mid- and near-infrared regions). The free-carrier component and the low-frequency oscillator are fit to the reflectance using a non-linear least-squares method, while the four high-frequency modes are kept fixed; the fitted results are identical to the model values, which are summarized in Table 2. This indicates that despite the broadening of the plasma edge in the reflectance due to nearby interband transitions, as well as an instrumental resolution that is lower than the intrinsic width of this feature, the values for cm-1 may still be accurately determined from fits to the reflectance (or complex conductivity).
Thus, we conclude that there is a profound disagreement between the optical and transport scattering rates at low temperature, . This discrepancy may arise if within a single band the optical scattering rate is strongly renormalized with frequency, as described by the generalized Drude model Dordevic and Basov (2006); Homes et al. (2015)
| (2) |
However, this approach is complicated by the fact that ; because the reflectance is close to unity, even a small uncertainty can result in large changes to , and subsequently the scattering rate, making the experimentally-determined values unreliable.
While the in-plane transport at very low temperatures is rather unusual and perhaps governed by phonon-drag effects Hicks et al. (2012), in general this material may be regarded as a Fermi liquid Tanaka et al. (1996), where the scattering rate is quadratic in both temperature and frequency, , where Dordevic and Basov (2006). In the (dc) limit , with a residual scattering rate cm-1 Hicks et al. (2012). Using the Drude scattering rate cm-1 at 295 K we can estimate cm 111A useful conversion is 1 eV = 8065.5 cm-1. In the frequency domain at low temperature, is then the average of over the interval ,
| (3) |
From Fig. 2, a reasonable estimate for would be the point at which most of the spectral weight from the free carriers is captured, cm-1, resulting in cm-1, which is in excellent agreement with the Drude estimates for the optical scattering rate at low temperature.
| Parameter | Model value | Seed value | Fitted value |
|---|---|---|---|
| 1.0 | 100 | 1.00 | |
| 9100 | 9000 | 9100 | |
| 3100 | 2000 | 3100 | |
III.3 Electronic structure
Several first principle calculations have been undertaken to study the electronic Seshadri et al. (1998); Eyert et al. (2008); Kim et al. (2009); Ong et al. (2010) and vibrational Kumar et al. (2013); Cheng et al. (2017) properties of PdCoO2; however, we are unaware of any that have dealt with the optical properties. Accordingly, the electronic properties have been calculated using density functional theory (DFT) with the generalized gradient approximation (GGA) using the full-potential linearized augmented plane-wave (FP-LAPW) method Singh (1994) with local-orbital extensions Singh (1991) in the WIEN2k implementation wie . The total energy and residual forces have been minimized with respect to the unit cell parameters and the fractional coordinates, respectively (details are provided in the Supplementary Material sup ). The real part of the optical conductivity including the effects of spin orbit coupling has been calculated from the imaginary part of the dielectric function, Ambrosch-Draxl and Sofo (2006), using a fine -point mesh ( points). The calculated conductivity due to interband transitions along the a axis () shown in Fig. 2 is in excellent agreement with the experimental results. The intraband plasma frequencies have also been calculated for the a and c axes with values of cm-1 and cm-1, respectively, indicating a large anisotropy in the effective mass ; this is consistent with the quasi-2D nature of this material. The value for is in good agreement with the experimentally-determined average in-plane value of cm-1.
III.4 Vibrational properties
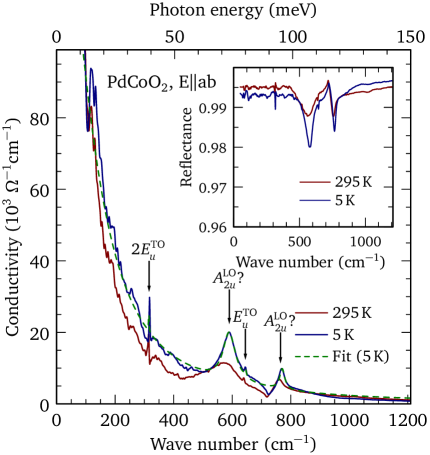
The low-frequency optical conductivity in Fig. 2 has some structure superimposed on the free-carrier response. The optical conductivity at 295 and 5 K is shown in Fig. 5 below eV; several very strong features are observed, which are also present in the reflectance (shown in the inset). The irreducible vibrational representation for PdCoO2 for the space group is ; the and modes are Raman active, while the and modes are infrared-active along the c and a axes, respectively Takatsu et al. (2007). While only two infrared-active vibrations are expected for light polarized in the a-b planes, it is clear from Fig. 5 that there are at least four modes present. The features in the optical conductivity have been fit to Lorentzian oscillators [Eq. (1)], and the results shown in Table 3.
There are several existing first-principles calculations of the lattice modes in this material Kumar et al. (2013); Cheng et al. (2017), which we have reproduced using the frozen-phonon (direct) method to determine the atomic character of the zone-center TO vibrations pho (details are provided in the Supplementary Material); the results are summarized in Table 3. The low-frequency mode involves mainly the Pd and Co atoms and is calculated to be at cm-1; this mode is not observed due to the extremely large electronic background. However, there is a sharp feature at 318 cm-1 that is tentatively assigned as the second harmonic of this vibration. The high-frequency mode, which involves the Co and O atoms, is calculated to be at cm-1 and is observed at 645 cm-1. Although this feature appears relatively insignificant, it possesses significant oscillator strength (Table 3); it only appears weak because it is superimposed on a large electronic background. The two strong features at and 764 cm-1 fall into the characteristic energy range expected for lattice vibrations; however, they do not correspond to any of the calculated infrared or Raman vibrations. Both modes, the one at 588 cm-1 in particular, narrow considerably and harden at low temperature, ruling out artifacts from absorptions elsewhere in the optical path as their origin. These structures are considerably broader and stronger than expected for infrared-active vibrations. It appears these features are manifestations of the c-axis LO modes, which have been observed in the cuprates and have the same antiresonant line shape in the reflectance Reedyk and Timusk (1992) (inset of Fig. 5). For a single oscillator, . Using the values in Table 3 and returned from the fits, LO modes at the correct positions can be obtained using cm-1. This suggests the presence of electron-phonon coupling where the out-of-plane displacements of the Pd and O atoms allow the in-plane carriers to couple of the long-range electric field Reedyk and Timusk (1992).
| Experiment (5 K) | Theorya | |||||||||
| Mode | (branch) | Pd | Co | O | ||||||
| (TO) | 154 | 0.45 | 0.43 | 0.12 | ||||||
| (TO) | 287 | 0.43 | 0.52 | 0.05 | ||||||
| (TO) | 318 | 2.3 | 1334 | 308 | ||||||
| ? | (LO) | 588 | 53 | 6566 | ||||||
| (TO) | 645 | 6.7 | 872 | 628 | 0.00 | 0.28 | 0.72 | |||
| (TO) | 661 | 0.03 | 0.18 | 0.79 | ||||||
| ? | (LO) | 764 | 13.5 | 2080 | ||||||
IV Conclusions
The in-plane optical properties of PdCoO2 reveal that the free-carrier
intraband response falls well below the interband transitions, allowing the plasma
frequency to be determined from the f-sum rule; the value of cm-1 is in good agreement with fits to the Drude-Lorentz model, as well as
first-principle calculations.
While the optically-determined scattering rate at room temperature of cm-1 is in good agreement with transport measurements, it displays little
temperature dependence, and at low temperature .
This inconsistency is resolved by assuming Fermi liquid behavior where the scattering rate
varies quadratically with both temperature and frequency; is then the average of
over the region of the free-carrier response, unlike the
behavior observed in the cuprates.
Despite the high conductivity of this material, at least one in-plane infrared-active
mode is identified. The two additional features appear to be manifestations of the
c-axis LO modes coupling to the in-plane carriers; the strength and width
of these features suggests that electron-phonon coupling is present.
Acknowledgements.
We would like to acknowledge helpful conversations with Ana Akrap and Jungseek Hwang. Work at Brookhaven National Laboratory was supported by the Office of Science, U.S. Department of Energy under Contract No. DE-SC0012704.References
- Shannon et al. (1971) Robert D. Shannon, Donald Burl Rogers, and Charles T. Prewitt, “Chemistry of noble metal oxides. I. Syntheses and properties of ABO2 delafossite compounds,” Inorg. Chem. 10, 713–718 (1971).
- Tanaka et al. (1996) Masayuki Tanaka, Masashi Hasegawa, and Humihiko Takei, “Growth and Anisotropic Physical Properties of PdCoO2 Single Crystals,” J. Phys. Soc. Jpn. 65, 3973–3977 (1996).
- Hicks et al. (2012) Clifford W. Hicks, Alexandra S. Gibbs, Andrew P. Mackenzie, Hiroshi Takatsu, Yoshiteru Maeno, and Edward A. Yelland, “Quantum Oscillations and High Carrier Mobility in the Delafossite ,” Phys. Rev. Lett. 109, 116401 (2012).
- Moll et al. (2016) Philip J. W. Moll, Pallavi Kushwaha, Nabhanila Nandi, Burkhard Schmidt, and Andrew P. Mackenzie, “Evidence for hydrodynamic electron flow in PdCoO2,” Science 351, 1061–1064 (2016).
- Zaanen (2016) Jan Zaanen, “Electrons go with the flow in exotic material systems,” Science 351, 1026–1027 (2016).
- Emery and Kivelson (1995) V. J. Emery and S. A. Kivelson, “Superconductivity in bad metals,” Phys. Rev. Lett. 74, 3253–3256 (1995).
- Hussey et al. (2004) N. E. Hussey, K. Takenaka, and H. Takagi, “Universality of the Mott-Ioffe-Regel limit in metals,” Phil. Mag. 84, 2847–2864 (2004).
- (8) The Mott-Ioffe-Regel limit is the point at which the mean free path is equal to a lattice spacing and the Boltzmann description of diffusive transport breaks down.
- Basov and Timusk (2005) D. N. Basov and T. Timusk, “Electrodynamics of high- superconductors,” Rev. Mod. Phys. 77, 721–779 (2005).
- Seshadri et al. (1998) R. Seshadri, C. Felser, K. Thieme, and W. Tremel, “Metal-Metal Bonding and Metallic Behavior in Some ABO2 Delafossites,” Chem. Mater. 10, 2189–2196 (1998).
- Eyert et al. (2008) Volker Eyert, Raymond Frésard, and Antoine Maignan, “On the Metallic Conductivity of the Delafossites PdCoO2 and PtCoO2,” Chem. Mater. 20, 2370–2373 (2008).
- Kim et al. (2009) Kyoo Kim, Hong Chul Choi, and B. I. Min, “Fermi surface and surface electronic structure of delafossite PdCoO2,” Phys. Rev. B 80, 035116 (2009).
- Ong et al. (2010) Khuong P. Ong, Jia Zhang, John S. Tse, and Ping Wu, “Origin of anisotropy and metallic behavior in delafossite PdCoO2,” Phys. Rev. B 81, 115120 (2010).
- Noh et al. (2009) Han-Jin Noh, Jinwon Jeong, Jinhwan Jeong, En-Jin Cho, Sung Baek Kim, Kyoo Kim, B. I. Min, and Hyeong-Do Kim, “Anisotropic Electric Conductivity of Delafossite PdCoO2 Studied by Angle-Resolved Photoemission Spectroscopy,” Phys. Rev. Lett. 102, 256404 (2009).
- Mackenzie (2017) A P Mackenzie, “The properties of ultrapure delafossite metals,” Rep. Prog. Phys. 80, 032501 (2017).
- Reedyk and Timusk (1992) M. Reedyk and T. Timusk, “Evidence for a-b-plane coupling to longitudinal c-axis phonons in high- superconductors,” Phys. Rev. Lett. 69, 2705–2708 (1992).
- Takatsu et al. (2010) Hiroshi Takatsu, Shingo Yonezawa, Satoshi Fujimoto, and Yoshiteru Maeno, “Unconventional Anomalous Hall Effect in the Metallic Triangular-Lattice Magnet ,” Phys. Rev. Lett. 105, 137201 (2010).
- Homes et al. (1993) C. C. Homes, M. Reedyk, D. A. Crandles, and T. Timusk, “Technique for measuring the reflectance of irregular, submillimeter-sized samples,” Appl. Opt. 32, 2976–2983 (1993).
- Dressel and Grüner (2001) M. Dressel and G. Grüner, Electrodynamics of Solids (Cambridge University Press, Cambridge, 2001).
- Wooten (1972) F. Wooten, Optical Properties of Solids (Academic Press, New York, 1972) pp. 244–250.
- Lynch and Hunter (1985) David W. Lynch and W. R. Hunter, “Comments on the Optical Constants of Metals and an Introduction to the Data for Several Metals,” in Handbook of Optical Constants of Solids, edited by Edward D. Palik (Academic Press, Boston, 1985) pp. 275–367.
- Momma and Izumi (2011) K. Momma and F. Izumi, “VESTA3 for three-dimensional visualization of crystal, volumetric and morphology data,” J. Appl. Crystr. 44, 1272–1276 (2011).
- Takatsu et al. (2007) Hiroshi Takatsu, Shingo Yonezawa, Shinichiro Mouri, Satoru Nakatsuji, Koichiro Tanaka, and Yoshiteru Maeno, “Roles of High-Frequency Optical Phonons in the Physical Properties of the Conductive Delafossite PdCoO2,” J. Phys. Soc. Jpn. 76, 104701 (2007).
- Dordevic and Basov (2006) S.V. Dordevic and D.N. Basov, “Electrodynamics of correlated electron matter,” Ann. Phys. 15, 545–570 (2006).
- Homes et al. (2015) C. C. Homes, Y. M. Dai, J. S. Wen, Z. J. Xu, and G. D. Gu, “FeTe0.55Se0.45: A multiband superconductor in the clean and dirty limit,” Phys. Rev. B 91, 144503 (2015).
- Note (1) A useful conversion is 1 eV = 8065.5 cm-1.
- Kumar et al. (2013) S. Kumar, H.C. Gupta, and Karandeep, “First principles study of structural, bonding and vibrational properties of PtCoO2, PdCoO2 and PdRhO2 metallic delafossites,” J. Phys. Chem. Solids 74, 305–310 (2013).
- Cheng et al. (2017) Long Cheng, Qing-Bo Yan, and Ming Hu, “The role of phonon-phonon and electron-phonon scattering in thermal transport in PdCoO2,” Phys. Chem. Chem. Phys. 19, 21714–21721 (2017).
- Singh (1994) D. J. Singh, Planewaves, Pseudopotentials and the LAPW method (Kluwer Adademic, Boston, 1994).
- Singh (1991) David Singh, “Ground-state properties of lanthanum: Treatment of extended-core states,” Phys. Rev. B 43, 6388–6392 (1991).
- (31) P. Blaha, K. Schwarz, G. K. H. Madsen, D. Kvasnicka and J. Luitz, WIEN2k, An augmented plane wave plus local orbitals program for calculating crystal properties (Techn. Universität Wien, Austria, 2001).
- (32) See Supplemental Material at [URL will be inserted by publisher] for details of electronic structure calcuations and lattice dynamics.
- Ambrosch-Draxl and Sofo (2006) Claudia Ambrosch-Draxl and Jorge O. Sofo, “Linear optical properties of solids within the full-potential linearized augmented planewave method,” Comp. Phys. Commun. 175, 1–14 (2006).
- (34) K. Parlinksi, Software PHONON (2003).
![[Uncaptioned image]](/html/1811.01026/assets/x6.png)
![[Uncaptioned image]](/html/1811.01026/assets/x7.png)
![[Uncaptioned image]](/html/1811.01026/assets/x8.png)
![[Uncaptioned image]](/html/1811.01026/assets/x9.png)