Analysis and implications of precision near-forward TOTEM data
Abstract
Very precise data on elastic proton-proton scattering at , and TeV have been obtained by the TOTEM group at LHC in the near-forward region (momentum transfers down to at TeV and to at TeV). The Coulomb-nuclear interference has been measured with sufficient accuracy for TOTEM to establish the falloff of the parameter with increasing energy. The predictions from a previously studied model are shown to be in good agreement with the data and thus allow us to draw rather firm conclusions about the structure of the near-forward nuclear amplitude. We point out that due to a zero in the real part of the nuclear amplitude occurring at a very small momentum transfer–that can migrate into the Coulomb-nuclear interference (CNI) region at higher energies–much care is needed in extracting the numerical value of for such energies. Thus, the true value of would be higher than the TOTEM value for found under the hypothesis that the real part of the elastic nuclear amplitude is devoid of such a zero in the CNI region.
pacs:
Valid PACS appear hereI Introduction
The TOTEM group has produced a remarkably precise determination of the proton-proton elastic nuclear amplitude at LHC energies TOTEM:2011 ; TOTEM:2016 ; TOTEM1:2017 ; TOTEM2:2017 . In particular, through the Coulomb-nuclear interference (CNI) at very small momentum transfer, TOTEM has reported direct measurements of the parameter (that is, the ratio of the real to the imaginary part of the nuclear amplitude in the forward direction at and 13 TeV). Thus, we now have data for the modulus (through the elastic differential cross section) and the phase (through CNI) of the near-forward nuclear amplitude.
The energy dependence of the parameter has been extensively studied both experimentally and theoretically for over five decades. Spanning an energy range of more than 3 orders of magnitude, experiments performed with the CERN intersecting storage rings up those at the Large Hadron Collider (LHC), show the parameter to rise, with apparently stabilizing its value around Tevatron energies. Asymptotically, the parameter was predicted a long time ago by Khuri and Kinoshita (KK) in Ref. khuri to decrease as , both for and . The first TOTEM results at LHC energy TeV were noncommittal as to whether the predicted asymptotic decrease had started. By now, the reported TOTEM results at and 13 TeV point to a decrease, apparently even faster than the original KK prediction, as clearly seen from the compilation shown by Fig. 15 in Ref. TOTEM2:2017 . The question as to whether this is the epiphany of a new phenomenon or, the high energy manifestation of nonleading contributions to the elastic cross section, such as the odderon TOTEM1:2017 ; Nicolescu:1975 , is presently under discussion.
In the present paper, we shall analyze the TOTEM results for the CNI region at and 13 TeV through
a recently studied model Fagundes:2013 ; Pancheri:2017 , which is a modified version of a model originally proposed by Barger and Phillips (BP) BP . The BP amplitude was proposed as an ”independent” model to highlight the main characteristics of the elastic diffractive cross section, namely the forward peak, the dip-bump structure arising from the zero of the imaginary part of the amplitude in , the slower, powerlike decrease at large . In the original model, the parameter is negative, in agreement with data on scattering at the time. However, as the energy increases, besides the well-known ”diffraction dip” due to a zero in the absorptive part, the amplitude must develop a zero in the real part of the nuclear amplitude for the parameter to change sign. If, at LHC energies, the real part vanishes in the CNI region, the extraction of the parameter gets complicated.
A zero in the real part of the elastic amplitude has been studied previously by Martin Martin:1997 and more extensively for the LHC data at and 8 TeV by Kohara et al. in Ref. Kohara:2017 , who find a positive evidence for this Martin zero. In fact, Martin Martin:1997 proved that if at infinite energies, (i) the total cross section tends to infinity and (ii) the differential elastic cross section tends to zero for large values, then the real part of the even-signature amplitude must change sign near . Such a circumstance necessarily questions the assumption, underlying the present TOTEM analysis of the CNI data, that the real part of the nuclear amplitude is a constant. At LHC energies, data show the total cross section to rise continuously and the differential cross section at a fast falloff at high values, satisfying both of Martin’s assumptions. Martin’s theorem then implies that, if the real part of the amplitude is positive at , due to the existence of a zero in the CNI region, the value of obtained from an analysis assuming the real part of the nuclear amplitude to be a constant (near ) would be lower than its true value.
The paper is organized as follows. In Sec. II the presence of a zero in the real part of the forward amplitude is discussed in the general case of geometrical scaling. In Sec. III, we discuss various prescriptions for obtaining the real and imaginary parts of the modified BP nuclear amplitude based on our phenomenological expressions for the parameters deduced in Ref. Fagundes:2013 . In Secs. IV and V, after a brief description of the parametrization for the nuclear amplitude used by TOTEM, we compare the results from our model with the TOTEM data at and 13 TeV in the CNI region. Relative residuals and ’s are defined and discussed in detail. In Sec. VI, we exhibit the phases and both real and imaginary parts of all four of our nuclear amplitudes in order to understand better qualitative differences between them and to delineate further the problems associated with finding the correct value of (at ). We shall see that our rotated BP amplitudes move the zero in the real part of the elastic amplitude nearer to the CNI at higher energies. Thus, at TeV, the effect is more pronounced (reducing true to an apparent -averaged ; see below), than at and 8 TeV (as discussed in Ref. Kohara:2017 ).
As the real part has a zero in the CNI region, in Sec. VII we define mean values of in various intervals to compare our results with those from TOTEM that assumes to be a constant in that interval. Quite good agreement is reached with the TOTEM values. A compendium of all our results for and [, ] is presented and compared with TOTEM data in Tables 1 and 2. In Sec. VIII, we examine the question whether TOTEM data in the CNI region require QCD odderon contributions. In the concluding Sec. IX, we present our conclusions deduced from the model.
II Near-forward zero in from Geometric scaling
In this section we discuss further evidence, arising from geometrical scaling, for the real part of the nuclear amplitude exhibiting a zero near the forward direction.
If there is a domain in within which geometric scaling were valid, then Martin Martin:1973 showed that
| (1) | |||||
Since the imaginary part is large and positive at and decreases to zero at , then employing Eq. (1), we have:
| (2) |
Since , satisfaction of Eq. (2) necessarily implies that the real part of the amplitude must change sign–at least once–somewhere between and . That is,
| (3) |
Geometric scaling is presumably a good approximation for small . What the above analysis shows is that it can be valid up to only if the real part vanishes prior to the value of where the imaginary part does.
Actually, one can prove a stronger result: if geometric scaling holds, then between any two consecutive zeroes of the imaginary part, there must be at least one zero of the real part. The trivial proof goes as follows, let be a set of zeros for the imaginary part of the amplitude, i.e.,
this implies
| (4) |
by virtue of Eqs. (1) and (4). For the integral in Eq. (4) to vanish, clearly the real part of the amplitude must change sign at least once, thus proving the theorem.
The relevance of the above to the extraction of at LHC energies (and beyond) is obvious. Since the imaginary part of the amplitude at LHC energies has a zero at a rather small value of , i.e., GeV2, geometric scaling tells us the real part has a zero at an even smaller value of . We shall confirm such a behavior within a specific symmetrized version of the model elastic amplitude presented in Ref. Fagundes:2013 . This will further support the assertion that care must be exercised in extracting a value for from small data due to a zero in the near-forward real part of the nuclear amplitude.
III Modified Barger and Phillips amplitude
Let the elastic amplitude be defined through its relation with the total cross section as
| (5) |
so that the elastic differential cross section reads
| (6) |
(all particle masses are being ignored). The amplitude of our modified BP model is Fagundes:2013
| (7) |
In Fagundes et al. Fagundes:2013 , data for the elastic differential cross section in the energy range GeV had been fitted with the above model. Using values from these fits, values of the parameters in Eq. (7), based on asymptotic theorems and sum rules Froissart:1961 ; Martin:1963 ; Pancheri:2005 had been put forward, as shown in the following.
-
•
The dependence of was chosen so as to saturate the Froissart bound
(8) where
(9) -
•
The proton form factor is defined in terms of the standard dipole
(10) -
•
While the phase , introduced in Eq. (7), is very slowly varying with , the pole of the form factor has a not negligible dependence on the energy, as it is shown in Fig. 3 of Ref. Fagundes:2013 . However, for large values of , it appears to approach the usual value of 0.71 GeV2. Hence, for high energies, we had frozen both phase and pole position as
(11) -
•
Based on two asymptotic sum rules Pancheri:2005 , which were shown to be almost saturated at TeV Fagundes:2013 , the two slope parameters in the model were parametrized as
(15) -
•
The dependence of the term is more complicated due to its large variation from low to high energies. Phenomenologically, we had chosen for an asymptotically constant , the following form
(16)
Before discussing our application to the recent TeV TOTEM data, we stress that the asymptotic behavior of the slope chosen above, differs from the usual behavior expected from Regge or Pomeron pole trajectories. Namely, in this empirical model, the recent TOTEM observation that the slope in the forward region increases faster than a logarithm, is not a surprise. Our observation is also in agreement with an earlier study by Shegelsky and Ryskin Schegelsky:2012 . For a very comprehensive study of the slope–covering different regions of –see Okorokov Okorokov:2015 . Our choice for in Eq. (15) is consistent with solution (d) of Ref. Okorokov:2015 . A recent analysis by Jenkovszky et al., in the context of the dipole model, also confirms the acceleration of the slope with energy Jenkovszky:2018 .
To study the CNI region, in light of Martin’s observation mentioned in the Introduction Martin:1997 , we first notice that neither the original BP amplitude nor the amplitude of Ref. Fagundes:2013 were symmetric. In this paper we shall consider modifications of our proposed amplitude, such that the resulting amplitude would be invariant under , namely we study the even-signature component of the above model.
Let us first consider the transformation rule , valid for a amplitude, as discussed thoroughly by Block in Sec. 10.3 etc. of his review Block:2006 . For the present parametrizations, this implies the substitution in and . For example, it gives for the contribution of the term into the real and imaginary parts of to be
so that their ratio
| (19) |
similarly for . Of course, such a choice leaves the slope parameters and unrotated.
One may entertain the possibility that the slope parameters and also get rotated using the above rule . Namely, for a amplitude, what is really required is to preserve the symmetry at fixed of the entire amplitude Martin:1997 . For large and at fixed (neglecting the masses), this reduces to setting .
In the following, we have considered all four possibilities with the following four sets of nuclear amplitudes:
| only and rotated | (20) | ||||
As we shall see, both the real and imaginary parts of the nuclear amplitude are practically identical for and , but they are substantially different from and . Moreover, the predictions from the amplitudes and are in remarkable accord with the TOTEM data in the CNI region whereas those from and are decidedly inferior. In the following Sec. IV, we shall use the amplitudes and parameters of Eqs. (8)-(15) for the four nuclear amplitudes of Eq. (III) to make predictions and compare them with the TOTEM data in the CNI region at the two representative energies and 13 TeV.
IV Coulomb-nuclear interference
at and 13 TeV
As stated earlier, the CNI has been measured with great precision by the TOTEM group at and 13 TeV. Numerical values of the elastic differential cross section in the momentum transfer regions for TeV and for TeV are presented in Tables 3 of Ref. TOTEM:2016 and Ref. TOTEM2:2017 , respectively.
To isolate CNI, TOTEM shows the TeV data in the following way TOTEM2:2017 .
-
1.
Figure 13 of Ref. TOTEM2:2017 shows the cross section data with momentum transfer up to .
-
2.
Figure 14 of Ref. TOTEM2:2017 shows cross section data up to .
-
3.
In both figures, along with data is also plotted the fractional quantity
(21) The reference value Ref at TeV is defined as
(22) with the Coulomb cross section,
defined as
(23)
The above is the reference nuclear amplitude for GeV2. To investigate the CNI, TOTEM TOTEM2:2017 uses the following parametrization for the nuclear amplitude, called ,
| (24) | |||||
It depends on the set of parameters . In particular, is the “large” diffraction slope and are supposed to account for minor fluctuations in the low- data. It is interesting to note that, in Ref. TOTEM2:2017 , for the data covering a smaller interval, , for , 2, 3, the per degree of freedom, , have roughly the same value: , 0.6, 0.6, respectively; whereas data that cover a larger interval, , the fit with just one term has a much larger compared to for and for . In fact, as the authors of Ref. TOTEM2:2017 note themselves, the quality of fit is bad and no values for are displayed for and . Notice that their chosen parametrization of the nuclear amplitude leaves no room for the real part of the nuclear amplitude to vanish in the CNI region. It cannot be excluded that this assumption is responsible for the poor fit in the case , since, as Martin’s theorem indicates, the existence of a zero is highly likely.
To investigate the existence of a zero, in the following Sec. V, we shall follow the steps of the TOTEM analysis but using our rotated asymptotic model in lieu of their parametrization, which excludes a priori the possibility of to change sign in the CNI region.
V Differential cross section and residuals at and 13 TeV
We now show our results in Figs. 1 and 2 for the complete elastic differential cross section in the CNI region at and 13 TeV covering the region up to . It is obtained from the modified nuclear BP amplitude discussed above in Sec. III. We emphasize that in Figs. 1 and 2, all four theoretical curves are drawn using the energy behavior of the parameter from Eqs. (8)-(15) obtained without changing any parameters from Ref. Fagundes:2013 , and implementing the rotation proposal of Eqs. (III). Hence, these are predictions for the absolute differential cross section at and 13 TeV as well as for the total cross section , the elastic one and parameter, that are discussed later.
Figures 1 and 2 show differential cross sections data, model predictions and the corresponding residuals , in the four cases labeled with and at and 13 TeV. The th differential cross section is obtained as
| (25) |
where the nuclear th and Coulomb amplitudes are given in Eqs. (III) and (23) respectively, and residuals for the two datasets at and ,
| (26) |
consisting of and points, are defined as
| (30) |
As one can see, the agreement with data is excellent for the nuclear amplitudes (red, green, blue areas and lines), whereas (black area and line) is essentially ruled out. The corresponding residuals both at and 13 TeV are practically zero all the way up to GeV2.
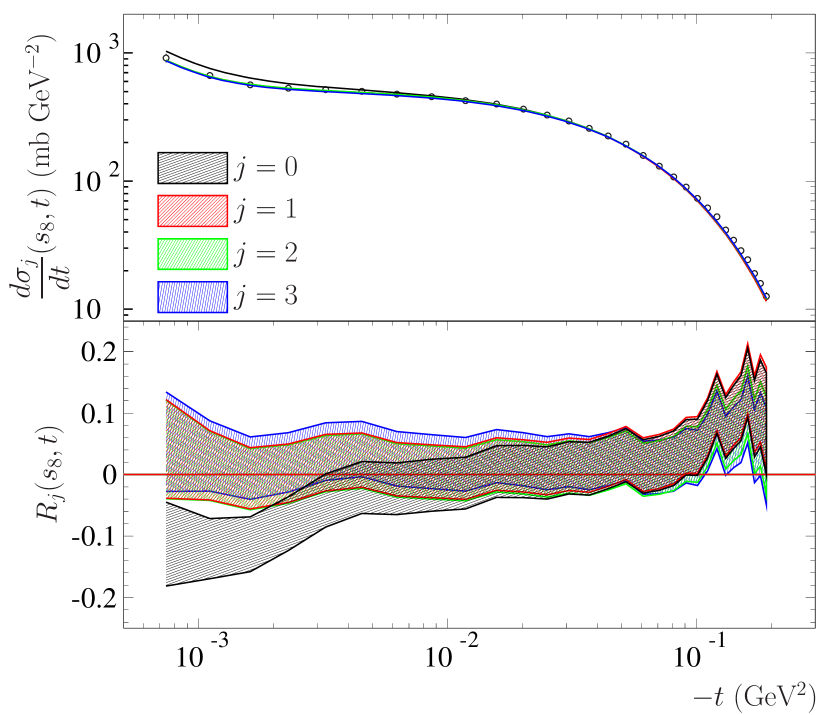
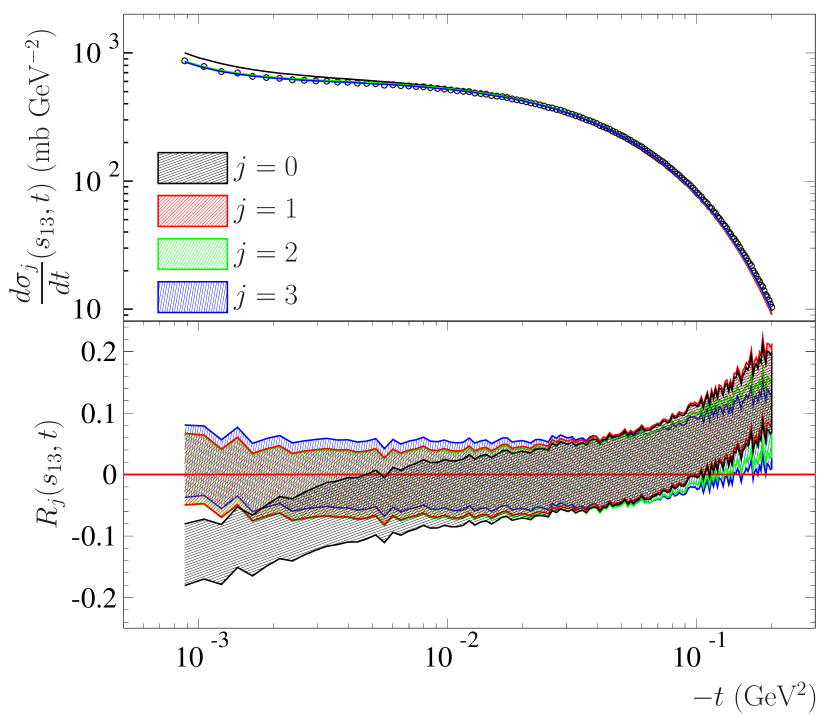
Figure 3 shows, for the datasets of Eq. (26), the per degree of freedom
with and GeV2. The remarkably low value of , which is less than 0.3 for all GeV2, tells us that the nuclear amplitudes describe both and 13 TeV data extremely well. We can then conclude that our model in the proposed analytic and crossing-symmetric version is very appropriate to describe present low- data, in the CNI region, and eventually predict future trends.
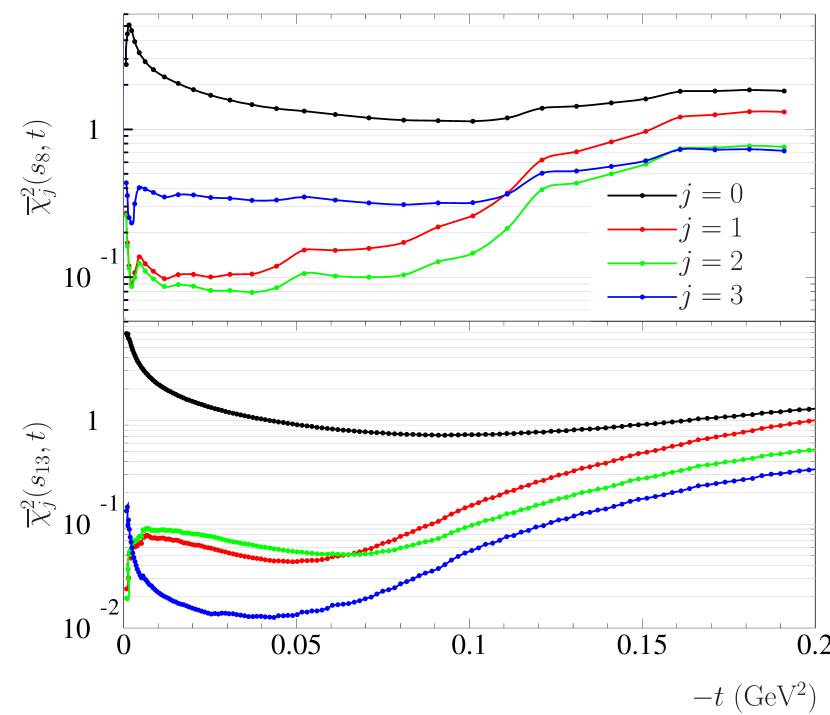
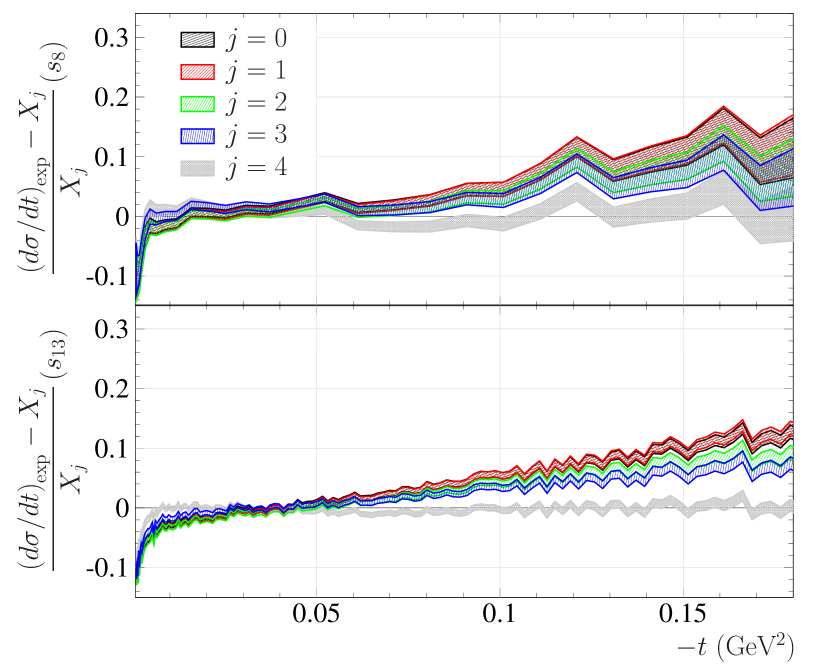
Figure 4 shows the residuals
| (31) |
between data and the sum of Coulomb and nuclear cross sections with no interference, i.e.,
| (32) |
where the first four nuclear amplitudes, with , are given in Eq. (III), while the fifth one, with , is obtained by using for the nuclear cross section the best exponential fits of Refs. TOTEM:2016 ; TOTEM2:2017 . The expression at TeV is given in Eq. (22), while the one at TeV reads
Figure 4, showing residuals between data and models without the CNI term, is the same as Figs. 16 and 17 of Ref. TOTEM:2016 and Fig. 14 of Ref. TOTEM2:2017 .
VI Complex nuclear amplitude at and 13 TeV
As seen in the previous Secs. IV and V, nuclear amplitudes describe the differential cross section data in the CNI region very well. Here we shall exhibit the phases and both real and imaginary parts of all four of our nuclear amplitudes, in order to understand better qualitative differences between them and delineate further the problems associated with finding the correct value of the parameter.
In Fig. 5 we show the phases predicted by the present model for all the four amplitudes previously described.
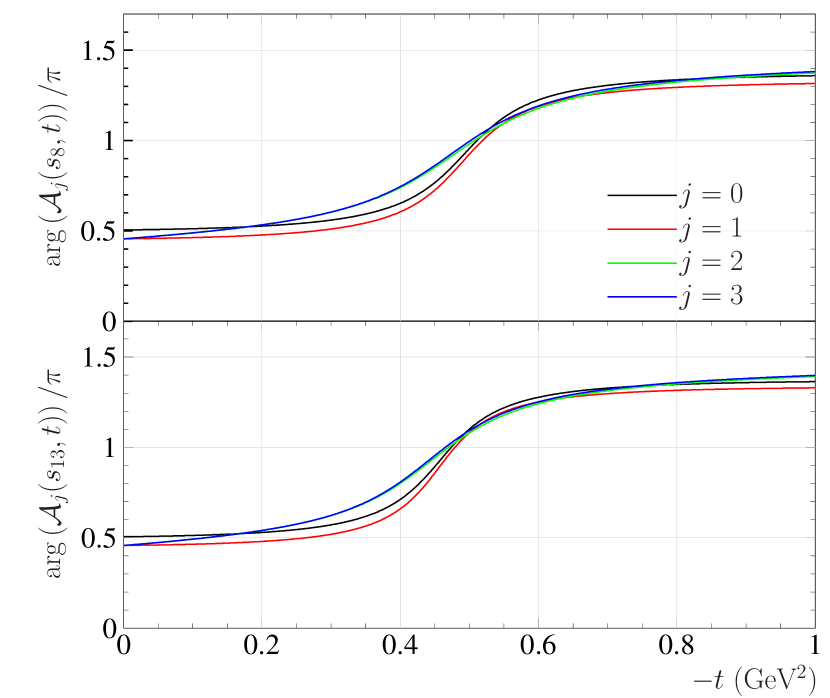
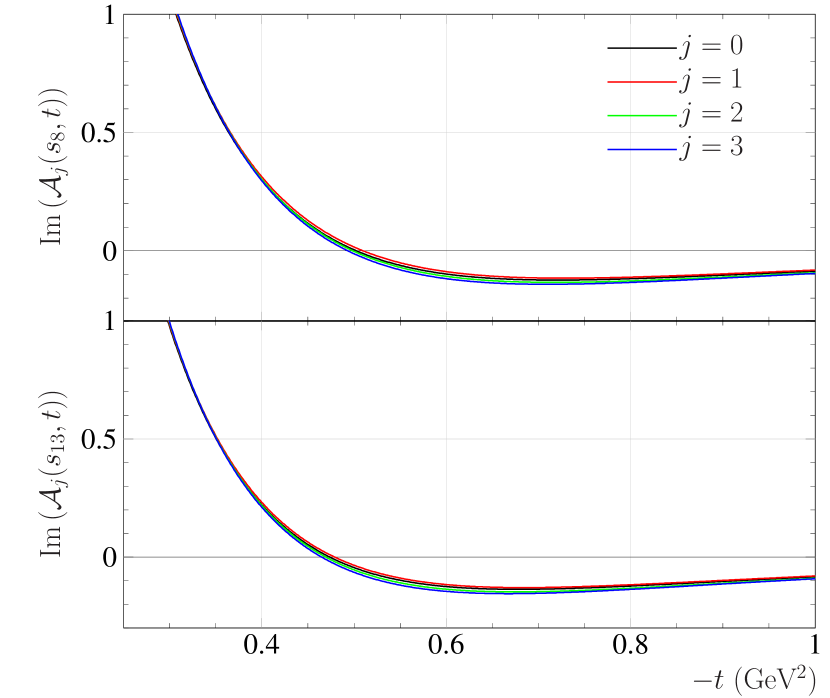
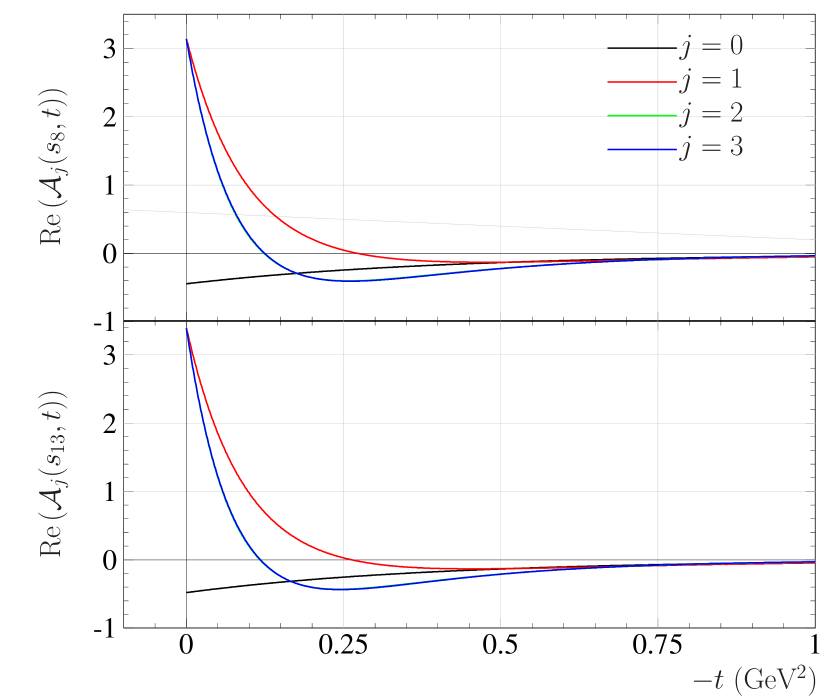
Figures 6 and 7 show imaginary and real parts of the amplitudes. From Fig. 6, we see that the imaginary part is basically unaffected by the crossing implementation. On the contrary, as it is shown in Fig. 7, the real part of the amplitude with no rotation is clearly different from the other three real parts, that still are quite similar. In addition, and most importantly, Fig. 7 shows that when rotated, the real part of the amplitude develops a zero whereas the original unrotated expression for the real part is negative throughout the entire forward peak region, up to GeV2. Furthermore, even for the three rotated amplitudes, there are differences in the position of the zero of the real part. In particular, we notice that:
-
(i)
in the cases and , the two amplitudes are indistinguishable, with the real part developing a zero around GeV2;
-
(ii)
for the case, with no rotation of slopes ad , the real part, and hence the parameter, as a function of , changes sign around GeV2, already outside the CNI.
We now turn to an estimate of the parameter in the small region. We will have to distinguish the case when the zero of the real part of the amplitude is within the CNI region, where the TOTEM experiment assumes a constant value TOTEM2:2017 . By considering different physics assumptions and mathematical modeling, TOTEM has extracted by the same set of data on the proton-proton differential cross section, two values for the parameter, i.e. TOTEM2:2017
| (35) |
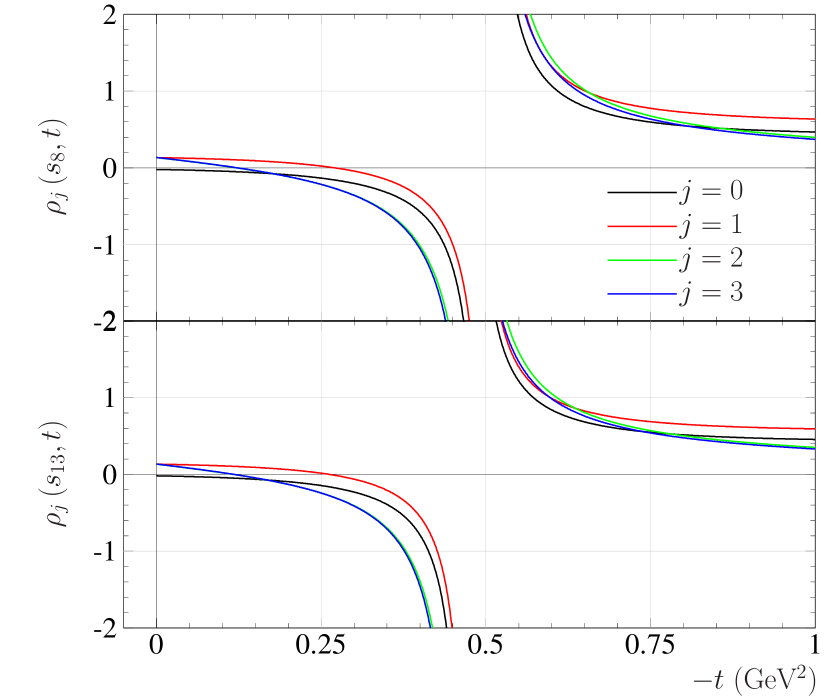
In Fig. 8 the parameters
| (36) |
for the four amplitudes with , at and , are plotted as a function of in the momentum transfer region GeV2.
VII Averages over momentum transfer and comparison with TOTEM results
As discussed above and explicitly seen in Fig. 7 for models , the real part of the amplitude has a zero near or inside the CNI region. Thus, it is useful to define a mean value of that could be used to compare to the constant ’s used by TOTEM to analyze their data in the CNI region.
For this purpose, we consider a range of momentum transfer through the region covered by the TOTEM data at and TeV and average the model predictions for in such ranges; namely, we define
| (37) |
that are mean values depending on the interval ()–over the CNI region–as chosen by TOTEM. The obtained , for the most relevant three cases are shown in Fig. 9.
It is satisfactory that
i.e., in the cases , the mean value of in the momentum transfer region GeV2, at TeV, is remarkably close to the value found by TOTEM for , namely and of Eq. (35), assumed to be constant quantities in this interval.

| (Tev) | (GeV2) | ||||
| 8 | 1 | 0.1352 | 0.1256 | 0.2 | TOTEM:2016 |
| 2 | 0.1352 | 0.0865 | |||
| 3 | 0.1365 | 0.0874 | |||
| 13 | 1 | 0.1330 | 0.1285 | 0.07 | () TOTEM2:2017 () TOTEM2:2017 () TOTEM2:2017 |
| 2 | 0.1330 | 0.1050 | |||
| 3 | 0.1341 | 0.1062 | |||
| 13 | 1 | 0.1330 | 0.1247 | 0.15 | () TOTEM2:2017 () TOTEM2:2017 |
| 2 | 0.1330 | 0.0877 | |||
| 3 | 0.1341 | 0.0885 |
In Tables 1 and 2, we report the values obtained for the quantities of interest in this paper, i.e.: the parameter at , its average value in the interval corresponding to the one investigated by TOTEM, and the total and elastic cross section at the two LHC energies.
A more comprehensive analysis of the model, tuned for a larger interval covering the bump-dip region ( GeV2) is left for future work after definitive TOTEM results become available with proper overall normalization over the entire momentum transfer interval.
| (Tev) | (mb) | (mb) | (mb) | (mb) | |
| 8 | 0 | 103.44 | 26.82 | Stark:2017 | |
| 1 | 102.68 | TOTEM:2016 | 26.85 | ||
| 2 | 102.68 | TOTEM:2016 | 27.06 | ||
| 3 | 101.64 | 26.85 | |||
| 13 | 0 | 113.66 | TOTEM1:2017 | 30.76 | TOTEM1:2017 |
| 1 | 112.87 | 30.81 | |||
| 2 | 112.87 | 31.03 | |||
| 3 | 111.84 | 30.84 |
VIII Do TOTEM data require odderons?
The precise TOTEM data in the CNI region at TeV give us rather accurate values of the parameter TOTEM2:2017 reported in Eq. (35). We have presented in the previous sections an analysis which confirms the measured low value of the parameter at TeV, through an empirical model based on analyticity, crossing symmetry and which satisfies known asymptotic theorems. As the existence of a zero in the CNI region, which is found to be consistent with TOTEM results, was connected in Ref. Martin:1997 to the asymptotic behavior of the total cross section, we shall now discuss this issue.
Specifically, we shall consider the possibility that the imaginary part of the scattering amplitude at may not saturate the Froissart bound. Let us compare the above with an assumed high energy total cross section increasing as some power of [see Eq. (9)]. Using the nomenclature from the soft-gluon resummation work reviewed in Ref. Pancheri:2017 , we may write the forward elastic amplitude–using the rule discussed in Sec. III–as follows. Considering the amplitude
| (38) |
where is a positive constant, in the limit of large , i.e., , the imaginary and real parts of the amplitude read
| (41) |
so that the total cross section and the parameter are
| (42) |
In such a model the parameter , varying in the interval , describes the level of saturation of the Martin-Froissart bound. The limit is reached for leading to the well-known Khuri-Kinoshita bound khuri .
Of course, care should be exercised in applying such expressions and comparing them to data due to finite corrections as well as due to the occurrence of a zero in the real part of the nuclear amplitude in the near-forward CNI region, as it is only after averages over the intervals are taken that we obtain , in agreement with the TOTEM values.
Just for illustration, consider our analysis at 13 TeV. Our nuclear amplitudes are chosen to saturate the Froissart bound (i.e., in the notation above). Thus, asymptotically, should have the KK value. Numerically, at 13 TeV, . On the other hand, after finite corrections, this value is reduced to [see, Eq. (19)]. Consideration of our complete nuclear amplitude (i.e., including contributions also from the term), reduces it further to our actual value of (see Table 1).
Using Eq. (42), this would be obtained for an effective (modulo further finite corrections, if any). And for this value of , , a slower rate than .
A similar trend is also reflected in other phenomenological analyses, such as in the soft-gluon resummation model of Ref. Corsetti:1996 , as shown in Ref. Grau:2009qx . Another example can be found in Table 13 of Block’s review of Ref. Block:2006 , is parametrized with the leading term , where mb is a (small) positive coefficient, accompanied by a nonleading term , where mb is instead a large negative coefficient. While TOTEM has not released a total cross section expression using a power series in , the following parametrization of the LHC elastic cross section data–attributed to Compact Muon Solenoid–can be found in the TOTEM report of Ref. TOTEM:2011
The above expression suggests that indeed the proton-proton total, elastic and inelastic cross sections might be increasing at a rate lower than , as increases.
The modified crossing symmetric BP near-forward nuclear amplitude discussed at length in the previous sections is also anchored upon two leading terms, and , with the dominant term in with a positive coefficient followed by a nonleading term with a negative coefficient [ in Eq. (8)] and by next term, as seen from Eq. (16). The success of this model in describing TOTEM data in the CNI region also suggests a similar pattern without on the other hand invoking a odderon contribution. Theoretical QCD models for three gluon color singlet Regge trajectories obtain a very low intercept, even lower than the trajectory Estrada:2006 . Also, at HERA, the H1 group H1 has ruled out an odderon Regge intercept above . Thus, the prognosis for QCD odderons with intercepts equal to or greater than 1 seems exceedingly dim. The odderon hypothesis may also have difficulties with unitarity and the black disk limit as recent QCD model calculations Khoze:2018 show a contradiction between unitarity and a maximal odderon Martynov:2017zjz , namely the one which would give a contribution to the total cross section rising . Also, a calculation in the color glass condensate model Gotsman:2018buo estimates the contribution of the -odd amplitude to to be of order 1%, namely .
Further evidence that TOTEM results do not force the existence of a contribution in the CNI region can be found in a recent paper by Jenkovszky and co-workers Jenkovszky:2018-2 . It is to be hoped that further TOTEM differential cross section data (not just total cross section data) covering a larger interval would help resolve this issue.
IX Conclusions
Modified BP nuclear amplitudes, called models in the text, appear to describe the CNI data rather well thus allowing us to draw the following conclusions.
-
1.
At LHC energies, the real part of the nuclear amplitude vanishes at a momentum transfer value GeV2.
-
2.
As TOTEM CNI data at TeV TOTEM:2016 were analyzed over the interval , the zero in the real part of the nuclear amplitude was within this interval. This might explain the choice of a peripheral phase with double zeroes in both the real and the imaginary parts (see solution KL/peripheral in Table 5 of Ref. TOTEM:2016 ), which, however, violates analyticity and positivity. Such a peripheral phase solution can be ruled out on rigorous grounds. An analysis of the 8 TeV data, based on a simple Regge model Fagundes:2016rpx , argued that the nonexponential behavior at low could be explained by the existence of a threshold singularity CohenTannoudji:1972gd ; Jenkovszky:2018 , required by channel unitarity. On the other hand, the empirical model discussed here with a single zero in both the real and the imaginary parts is able to adequately describe the CNI data at TeV (as well as that TeV).
-
3.
For LHC energies, the zero in the real part lies in the CNI region, thus rendering a precise determination of parameter rather problematic. For example, TOTEM analyzed its TeV data assuming that
(43) i.e., that the parameter is a constant in over the region GeV2, whereas we expect . To make a comparison, we defined a mean value, see Sec. VII etc. over this interval and found good agreement with the TOTEM value.
-
4.
The need of a QCD odderon contribution to explain the TOTEM data in the CNI region is not compelling, in particular for what concerns the energy rise of the total cross section and the nonsaturation of the Froissart bound at present LHC energies. Thus, model-independent analyses of the entire region covered by future TOTEM data are likely to clarify this important issue.
-
5.
Both elastic and total cross sections appear to be approaching their asymptotic limits from below. For example
-
6.
Also, the values for the parameter obtained by TOTEM at TeV, and of Eq. (35), are much lower than the Khuri-Kinoshita bound
having .
-
7.
Both items 5 and 6 above suggest that cross sections very likely rise less fast than Pancheri:2017 . Clearly, further data are required to settle this crucial issue.
X Acknowledgements
Y. S. would like to thank the Department of Physics and Geology at the University of Perugia, Perugia, Italy for its hospitality. We thank Professor Earle Lomon, from CTP at MIT, for invaluable advice and criticism during the preparation of this paper.
References
- (1) G. Antchev et al. (TOTEM Collaboration]), Europhys. Lett. 96, 210002 (2011) [arXiv:1110.1395 [hep-ex]].
- (2) G. Antchev et al. (TOTEM Collaboration), Eur. Phys. J. C 76, 661 (2016) [arXiv:1610.00603 [nucl-ex]].
- (3) G. Antchev et al. (TOTEM Collaboration), Eur. Phys. J. C 79, 103 (2019) [arXiv:1712.06153 [hep-ex]].
- (4) G. Antchev et al. (TOTEM Collaboration), arXiv:1812.04732 [hep-ex].
- (5) N. N. Khuri and T. Kinoshita, Phys. Rev. 137, 20 (1965); 140, B706 (1965); Phys. Rev. Lett. 14, 84 (1965).
- (6) K. Kang and B. Nicolescu, Phys. Rev. D 11, 2461 (1975).
- (7) D. A. Fagundes, A. Grau, S. Pacetti, G. Pancheri and Y. N. Srivastava, Phys. Rev. D 88, 094019 (2013) [arXiv:1306.0452 [hep-ph]].
- (8) G. Pancheri and Y. N. Srivastava, Eur. Phys. J. C 77, 150 (2017) [arXiv:1610.10038 [hep-ph]].
- (9) R. J. N. Phillips and V. D. Barger, Phys. Lett. 46B, 412 (1973).
- (10) A. Martin, Phys. Lett., B f̱404, 137 (1997).
- (11) A. K. Kohara, E. Ferreira, T. Kodama, and M. Rangel, Eur. Phys. J. C 77, 877 (2017).
- (12) S. H. Stark, EPJ Web Conf. 141, 03007 (2017).
- (13) A. Martin, Lett. Nuovo Cimento 7S2, 811 (1973).
- (14) M. Froissart, Phys. Rev. 123, 1053 (1961).
- (15) A. Martin, Phys. Rev. 129, 1432 (1963).
- (16) G. Pancheri, Y. Srivastava and N. Staffolani, Acta Phys. Pol. B 36, 749 (2005) [hep-ph/0411007].
- (17) V. A. Schegelsky and M. G. Ryskin, Phys. Rev. D 85, 094024 (2012) [arXiv:1112.3243 [hep-ph]].
- (18) V. A. Okorokov, Adv. High Energy Phys. 2015, 914170 (2015) [arXiv:1501.01142 [hep-ph]].
- (19) L. Jenkovszky et al., Eur. Phys. J. A 54, 116 (2018).
- (20) M. M. Block, Phys. Rept. 436, 71 (2006) [hep-ph/0606215].
- (21) A. Corsetti, A. Grau, G. Pancheri, and Y.N. Srivastava, Phys. Lett. B 382, 282 (1996); R. M. Godbole, A. Grau, G. Pancheri, and Y.N. Srivastava, Phys. Rev. D 72, 076001 (2005).
- (22) A. Grau, R. M. Godbole, G. Pancheri and Y. N. Srivastava, Phys. Lett. B 682, 55 (2009) [arXiv:0908.1426 [hep-ph]].
- (23) F. J. Llanes-Estrada, P. Bicudo and S. R. Cotanch, Phys. Rev. Lett. 96, 081601 (2006) [hep-ph/0507205].
- (24) C. Adloff et al. (H1 Collaboration), Phys. Lett. B 544, 35 (2002) [hep-ex/0206073].
- (25) V. A. Khoze, A. D. Martin and M. G. Ryskin, Phys. Lett. B 780, 352 (2018) [arXiv:1801.07065 [hep-ph]].
- (26) E. Martynov and B. Nicolescu, Phys. Lett. B 778, 414 (2018) [arXiv:1711.03288 [hep-ph]].
- (27) E. Gotsman, E. Levin and I. Potashnikova, Phys. Lett. B 786, 472 (2018) arXiv:1807.06459 [hep-ph].
- (28) N. Bence, L. Jenkovszky, and I. Szanyi, arXiv:1808.03588 [hep-ph].
- (29) D. A. Fagundes, L. Jenkovszky, E. Q. Miranda, G. Pancheri and P. V. R. G. Silva, Int. J. Mod. Phys. A 31, 1645022 (2016).
- (30) G. Cohen-Tannoudji, V. V. Ilyin and L. L. Jenkovszky, Lett. Nuovo Cimento 5S2, 957 (1972).