Photoevaporation of Molecular Gas Clumps Illuminated by External Massive Stars: Clump Lifetimes and Metallicity Dependence
Abstract
We perform a suite of 3D radiation hydrodynamics simulations of photoevaporation of molecular gas clumps illuminated by external massive stars. We study the fate of solar-mass clumps and derive their lifetimes with varying the gas metallicity over a range of . Our simulations incorporate radiation transfer of far ultraviolet (FUV) and extreme ultraviolet (EUV) photons, and follow atomic/molecular line cooling and dust-gas collisional cooling. Nonequilibrium chemistry is coupled with the radiative transfer and hydrodynamics in a self-consistent manner. We show that radiation-driven shocks compress gas clumps to have a volume that is set by the pressure-equilibrium with the hot ambient gas. Radiative cooling enables metal-rich clumps to condense and to have small surface areas, where photoevaporative flows are launched. For our fiducial set-up with an O-type star at a distance of 0.1 parsec, the resulting photoevaporation rate is as small as for metal-rich clumps, but is larger for metal-poor clumps that have larger surface areas. The clumps are continuously accelerated away from the radiation source by the so-called rocket effect, and can travel over 1 parsec within the lifetime. We also study photoevaporation of clumps in a photo-dissociation region. Photoelectric heating is inefficient for metal-poor clumps that contain a smaller amount of grains, and thus they survive for over years. We conclude that the gas metallicity strongly affects the clump lifetime and thus determines the strength of feedback from massive stars in star-forming regions.
1. Introduction
Giant molecular clouds (GMCs) have masses greater than and are the largest self-gravitating bodies in galaxies. It has been revealed through molecular line surveys at millimeter and sub-millimeter wavelengths that GMCs have highly inhomogeneous substructures and even clumps with a variety of sizes and masses (Bally et al., 1987; Bertoldi & McKee, 1992; Blitz, 1993; Evans, 1999; Williams et al., 2000; Muñoz et al., 2007). Typically, most massive clumps are sites of star formation in a GMC. Stars formed in clusters in those clumps account for a large fraction of star formation in GMCs. This suggests that evolution of the stars and their interaction with the associated clumps may set the overall star formation rate and efficiency in GMCs. The evolution and the fate of clumps in a star-forming region has been a study of great interest.
In a GMC, newly formed massive OB stars illuminate the surrounding gas. The radiation of the embedded OB stars are so intense that the parental GMC can be destroyed in about ten million years (e.g. Blitz & Shu, 1980; Stahler & Palla, 2005). Ultraviolet (UV) radiation from the massive stars strongly influences the thermal and chemical state of the gas. Far-UV (FUV; ) photons photodissociate molecules in the medium, whereas extreme-UV (EUV; ) photons ionize hydrogen atoms. Around a massive star, there forms an H II region surrounded by a large photo-dissociation region (PDR). Typically, the gas in the PDR is heated to by grain photoelectric heating, while the gas in the H II region is heated to by photoionization. The central H II region has a sufficiently high pressure to drive hydrodynamic shock waves in the ambient gas. The shocked gas is compressed to become unstable, often to promote star formation. Indication of such “sequential star formation” (Elmegreen & Lada, 1977) has been actually found in local H II regions (e.g., Deharveng et al., 2005, 2008; Miura et al., 2010) and those in the Large and Small Magellanic Clouds (Contursi et al., 2000; Rubio et al., 2000; Barbá et al., 2003).
UV radiation emitted by young massive OB stars affects the dynamics and thermal/chemical structure of nearby clumps in the H II region in a highly complicated manner. The EUV radiation of massive stars heats and ionizes the low-density gas surrounding the clumps. The high-pressure drives shocks that propagate through to the cool interior of the clumps. The so-called radiation-driven implosion (e.g., Tenorio-Tagle, 1977; Klein et al., 1980; Bertoldi, 1989; Duvert et al., 1990; Lefloch & Lazareff, 1994) compresses the interior gas and can trigger star formation inside the clumps around newly-born massive OB stars. After the implosion phase, a cometary structure develops that consists of a dense core and a protruding long tail in the direction opposite to the radiation source. Such cometary-shaped clumps formed around hot nearby stars are termed “cometary globules” (CGs). CGs are commonly found in the vicinity of OB associations (e.g., Reipurth, 1983), and are thought to be precursors of the Bok globules (Bok & Reilly, 1947). Cometary-structured clumps are also found in nearby planetary nebulae such as Rosette nebula, Helix nebula, and Gum nebula (Reipurth, 1983; O’dell & Handron, 1996; O’Dell et al., 2002, 2007). Infrared observations have shown that star formation activities might be actually taking place in these cometary globules (Sugitani et al., 1991; Sugitani & Ogura, 1994) and at the bright rims of the globules (Sugitani et al., 1995; Megeath et al., 1996).
Besides triggering star formation and forming cometary structures, UV radiation heats the gas on the surface of a clump and drive outflows. This process is referred to as photoevaporation (e.g, Bertoldi, 1989; Bertoldi & McKee, 1990). Illuminated clumps are gradually eroded from the surface and lose a significant fraction of their mass. Clump photoevaporation accompanied by the radiation-driven implosion and the subsequent CG formation has been studied both numerically (Tenorio-Tagle, 1977; Klein et al., 1980; Sandford et al., 1982, 1984; Lefloch & Lazareff, 1994; Mellema et al., 1998) and analytically (Bertoldi, 1989; Bertoldi & McKee, 1990; Mellema et al., 1998), starting with Oort & Spitzer (1955). Clump photoevaporation models had been directly compared with the observed features of CGs in the nearby nebulae. The theoretical models are largely consistent with the observations (López-Martín et al., 2001; Williams et al., 2001). Other studies investigate clump photoevaporation due to ionizing radiation with self-gravity (Kessel-Deynet & Burkert, 2003; Esquivel & Raga, 2007) and with the diffuse EUV (Cantó et al., 1998; Pavlakis et al., 2001). Clump photoevaporation of highly inhomogeneous clumps (González et al., 2005; Raga et al., 2005) and of a multi-clump system (Raga et al., 2009) are also studies with radiation-hydrodynamics simulations.
FUV photons also drive photoevaporation. The influences of FUV from external massive stars on gas clumps (and protoplanetary disks) is studied by Johnstone et al. (1998) by one-dimensional analytic modeling and hydrodynamics simulations. Gorti & Hollenbach (2002) develop a one-dimensional analytic model of FUV photoevaporation, and explore a wide variety of input parameters as a generalization of Johnstone et al. (1998) and Störzer & Hollenbach (1999). The authors conclude that strong FUV radiation drives shocks in an irradiated clump, which may trigger star formation inside the compressed core. The lifetime is estimated to be for clumps with typical parameters in a star-forming region. More recently, Decataldo et al. (2017) perform 1D radiation-hydrodynamics simulations with the effects of both FUV and EUV to study photoevaporation of clumps around massive stars or quasars. The derived clump lifetimes are in good agreement with those found in Gorti & Hollenbach (2002).
These previous studies consider clump photoevaporation in solar-metallicity environments. There can be a number of differences in the evolution and the fate of clumps in low-metallicity environments such as, for example, star-forming regions in the LMC (Minamidani et al., 2011) or in the early universe (Shapiro et al., 2004). Radiation cooling by metals and dust is inefficient in a low-metallicity clump, and the FUV photoelectric heating rate decreases with the amount of dust grains. Hence the gas metallicity is likely a critical parameter that determines the thermal/chemical/dynamical structure of clumps. Clump lifetimes and the metallicity dependence may be an important factor that controls the star formation efficiency in high-redshift galaxies. Clearly, it is important to study photoevaporation of clumps in various environments.
In the present study, we perform 3D radiation hydrodynamics simulations of clump photoevaporation by FUV and EUV irradiation. We solve nonequilibrium chemistry coupled with all the relevant atomic/molecular line cooling and dust-gas collisional cooling. Radiative transfer, hydrodynamics, and non-equilibrium chemistry are solved in a self-consistent manner, allowing us to examine clump evolution in detail. We vary the gas (clump) metallicity over a wider range of , and study the fate of the clumps.
2. Methods
We consider an initially spherical clump with metallicity illuminated by an external radiation source (massive star) at distance (Figure 1).
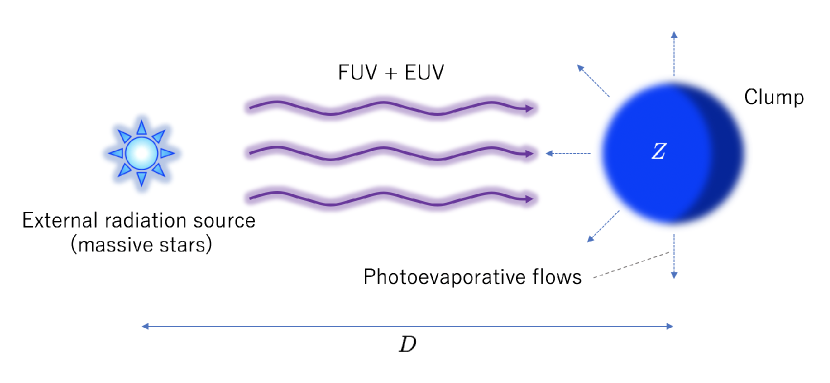
The radiation source is assumed to have an FUV luminosity and an EUV photon emission rate . The clump is exposed to the FUV and EUV fluxes of and . We use the publicly available radiation hydrodynamics code PLUTO (Mignone et al., 2007), suitably modified for the present study. In the following, we describe the numerical methods for our simulations with giving a brief review of the code. Further details are found in Nakatani et al. (2018a) (hereafter Paper I) and Nakatani et al. (2018b), where the metallicity dependence of protoplanetary disk photoevaporation is investigated.
We assume that the interstellar medium consists of dust and gas that contains seven chemical species: H, \ceH+, \ceH2, \ceC+, O, CO, e-. The carbon and oxygen abundances are set to be and , respectively. We set the dust-to-gas-mass ratio to be . We incorporate heating by H I photoionization (hereafter EUV heating) and photoelectric heating (hereafter FUV heating; Bakes & Tielens, 1994). FUV and EUV radiative transfer are followed at each time step by ray-tracing. We do not solve radiative transfer for diffuse radiation components. Diffuse EUV photons can slightly change the geometrical structure of the cloud in the early phase of its evolution, but would not cause significant differences in the cloud evolution, as demonstrated by Pavlakis et al. (2001). One can also naively expect that diffuse or scattered FUV photons might change the thermal and/or chemical structure especially in shadowed regions, but there, strong photoevaporative flows are not generated. Although it would be ideal to include radiation transfer of diffuse components, we focus, in the present study, on clump photoevaporation and lifetimes that are largely determined by the effect of direct UV photons from the radiation source.
In a fully molecular gas cloud that we consider in the present study, EUV photons can directly ionize \ceH2 to produce \ceH2+ at the beginning of the clump evolution. Since the absorption cross section of \ceH2 is comparable to that of H I, \ceH2 photoionization can be more efficient than \ceH2 photodissociation on the surface of the clump. However, the dissociative recombination \ceH2+ + e -¿ H + H and subsequent H I photoionization occur sufficiently rapidly, so that the produced \ceH2+ is immediately converted to \ceH+ to form an H II region. In order to examine the effects of \ceH2 photoionization and the associated photoheating, we have performed test simulations with these processes. We have found that \ceH2 ionization hardly changes the evolution of the clumps. This allows us to omit the \ceH2 ionization process in our chemistry model and to save computational cost.
The simulation volume is defined with 3D cartesian coordinates. The clump center is initially located at . We set the computational box extending from to along the -axis, and from to along each of the - and axes, assuming symmetries with respect to both the -plane and -plane. The computational grid is uniformly spaced with the number of the cells . The radiation is turned on at , and the clump is illuminated by the source located at from the clump surface. We adopt a distant-source approximation; a plane-parallel UV radiation is incident on the computational domain at . We set the incident FUV flux and EUV photon number flux to be and ,where the FUV flux is measured in the unit of the average interstellar flux . These fluxes correspond to the source luminosity of and . In Section 4.1, we also consider lower UV fluxes in order to study the variation of clump lifetimes. We do not incorporate gravity in our simulations but refer the readers to our discussion in Section 4.3.
We model the initial clump as a Bonner-Ebert (BE) sphere (Ebert, 1955; Bonnor, 1956). The clump is assumed to be initially fully molecular. We follow Decataldo et al. (2017) and adopt , , and as the initial hydrogen nuclei density and temperature at the clump center, and confining pressure, respectively. The corresponding initial clump radius is , and the initial clump mass is , which is smaller than .
In order to examine clump photoevaporation in an H II region and in a photodissociation region (PDR), and in order to investigate the effects of FUV and EUV separately, we run three sets of simulations with (i) both EUV and FUV photons, (ii) only FUV, and (iii) only EUV. Hereafter, we label the sets of our simulations according to the incorporated processes. A set of simulations labeled as “XX” specifies which of the photo-heating sources are included. For instance, runs with both FUV and EUV are labeled “FE”, and runs with only EUV are labeled as “E”. In addition, we indicate the assumed gas metallicity by appending “Z” to the labels. This label indicates that is adopted in the simulation.
3. Results
3.1. Solar-Metallicity Clumps
3.1.1 Photoevaporation and clump lifetime
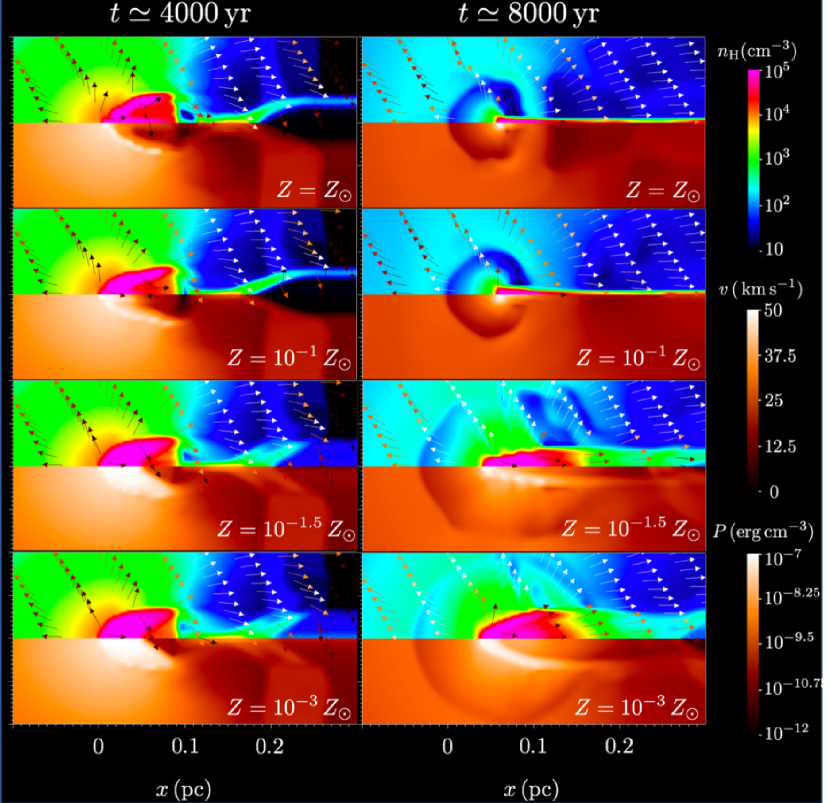
We first focus on the simulation result for a solar-metallicity clump. When the radiation source is turned on, the incident FUV photons quickly dissociate \ceH2 molecules in the entire hemisphere facing the source. The incident EUV photons then immediately ionize the hydrogen atoms produced by the photodissociation. The photo-chemical reactions yield three distinct regions: a molecular core region, a geometrically thin H I shell with a typical thickness of , and an H II region surrounding the neutral regions. In the neutral regions, a bowl-shaped shock is driven, which propagates through the interior of the clump and compresses the gas there. This is the so-called radiation-driven implosion phase (Lefloch & Lazareff, 1994). Hereafter, we simply refer to the compression due to the shock as shock-compression.
The shock propagates through the clump and converges toward the -axis (see the snapshots at in Figure 2). The gas cools quickly after the shock passes through, because the characteristic timescales of O I cooling and dust-gas collisional cooling are much shorter than the shock crossing time. Thus the clump temperature remains being low at . The low temperature and the low ionization degree in the neutral region assure that O I remains effective as a major coolant during the implosion phase without being destroyed through the rapidly-proceeding charge transfer reaction \ceH+ + O -¿ H+ + O (Draine, 2011). Owing to the low temperature (hence low pressure), the clump is compressed by the external hot ionization front, even after the shock converges towards the -axis. The clump is continuously compressed until the internal density becomes high enough to yield comparable internal pressure with the external pressure. This approximate pressure balance is achieved from the portion closer to the radiation source. The shock-compression and the external pressure raise the average density of the neutral clump in the first . After this compression phase, the clump expands slightly and generates a cometary structure in the rest frame of the clump with the typical internal density of (Figure 2).
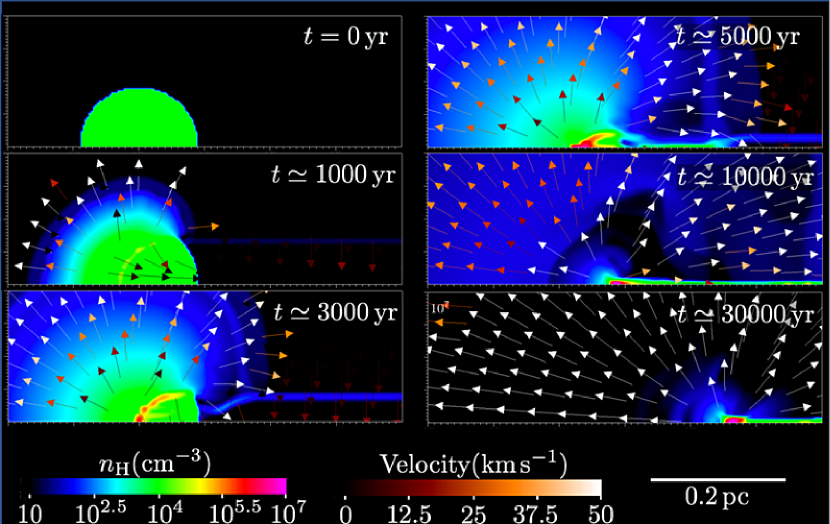
The UV radiation drives photoevaporative winds (Figure 2), which are launched from the ionization front at a velocity of with , stripping the mass at the wind base. Throughout the present study, we calculate the clump mass as
| (1) |
where is the volume of a sphere with radius from the center position . We use for , while we set to be the position of the center of mass in the “dense” region defined as
| (2) |
where is the maximum hydrogen nuclei density in the computational domain at each time step. We adopt this definition to estimate the mass for the clumps in all the FE, F, and E runs.
Figure 3 shows the ratio of the clump mass to the initial clump mass as a function of time.
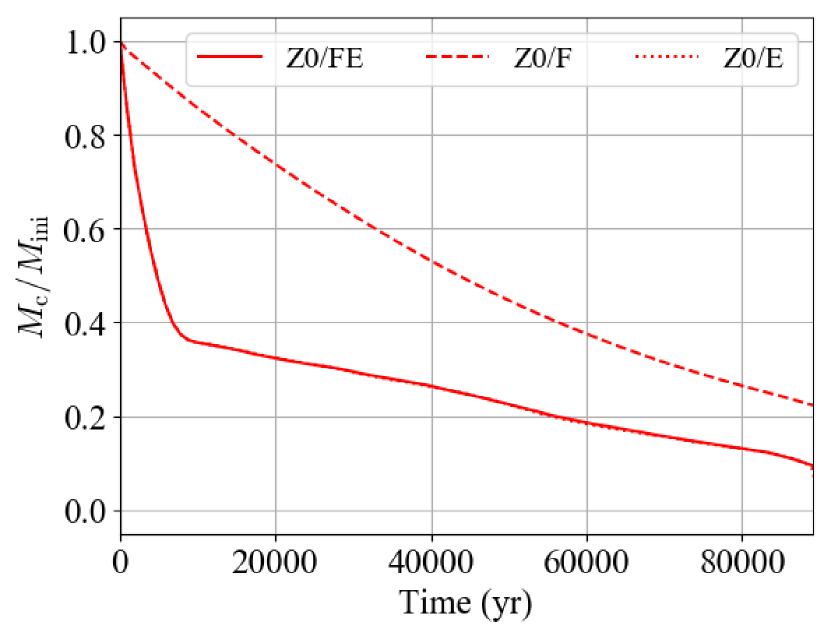
The clump mass monotonically decreases in all the cases of Z0/FE, Z0/F, and Z0/E. In run Z0/FE the clump loses about a half of its initial mass in the implosion phase in the first years. The lost mass was contained in the part where the R-type ionization front sweeps before it converts to D-type (Spitzer, 1978; Shapiro et al., 2004). The ionized gas evaporates and flows outward from the clump center, over approximately a crossing time of the EUV-driven flows of . In run Z0/F, FUV photons heat nearly the entire hemisphere facing to the radiation source to temperatures of . The heated region starts to expand at a velocity of . The outflow is significantly slower than the EUV-driven flows. Therefore, the dispersal time of the clump is longer than in Z0/FE or Z0/E (Figure 3). Gorti & Hollenbach (2002) show that the evolution of a clump which is impulsively illuminated by FUV radiation bifurcates, depending on the effective optical depth parameter defined as
| (3) |
where is the initial internal density of the clump and is the column heated by FUV. If , the FUV-heated region is confined to a thin surface layer of the clump. A shock is driven inside the clump when FUV heating is sufficiently strong. If , the clump is entirely heated and expands on the crossing timescale. Our clump with has an intermediate evolutional character: FUV heats almost entire region of the clump. Especially, the hemisphere facing to the radiation source is heated to high temperatures. FUV-driven flows are quickly excited, and weak shocks are generated inside the clump. The clump eventually forms a cometary structure at .
3.1.2 The rocket effect
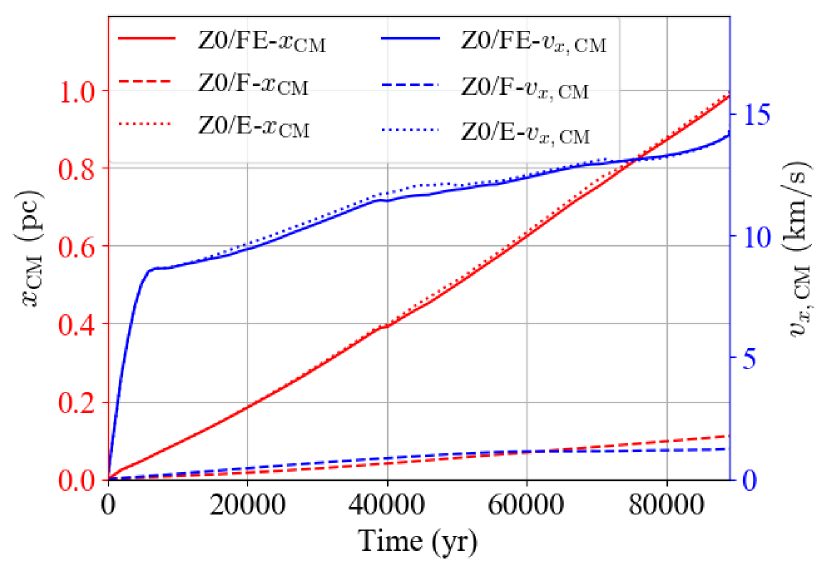
Photoevaporating clumps move away from the radiation source by the rocket effect (Oort & Spitzer, 1955). It is observed in our simulations that clumps are accelerated and move along the -axis (Figure 2 and Figure 4). The rocket effect can be described in terms of momentum conservation between the clump and the materials ejected by photoevaporation. Assuming that photoevaporative flows are launched with density and velocity from the surface of the hemisphere facing the radiation source, we can calculate the acceleration as
| (5) | |||||
where and are the launch area of the photoevaporative flows and the compressed clump mass. The base hydrogen nuclei density is calculated as , where is the mass of a hydrogen atom. Note the factor of a half in Eq.(5) that accounts for the net momentum in the -direction gained through photoevaporation. We use the values of the clump in our Z0/FE run: , , , and . Substituting these into Eq.(5), we estimate the acceleration to be . In run Z0/FE, the position of the center of mass in the “dense” region is well approximated by a function of time as with and (the solid and dotted lines in Figure 4), after the implosion phase . The acceleration is consistent with that estimated by Eq.(5). The coefficient corresponds to the clump velocity at the end of the implosion phase. In summary, the solar metallicity clump starts to move away from the external radiation source at a velocity of after the implosion phase, and then continuously accelerated by the rocket effect caused by EUV photoevaporation at a rate of ; the clump travels over a distance of in , when the mass decreases to 10 percent of the initial mass.
3.2. Photoevaporation of Low-Metallicity Clumps
3.2.1 Effects of EUV radiation
The initial evolution of low-metallicity clumps is similar to that of the solar-metallicity clump. The ionization front first develops within the radius of from the clump center in the hemisphere facing to the source (cf. Figure 2). A bowl-shaped shock (the left column of Figure 5) is generated in the neutral region inside the ionization front. Clumps are first compressed by the shock for . The shock-compression time corresponds to the timescale with which the shock propagates through the clump (the phase (1) in Figure 6).
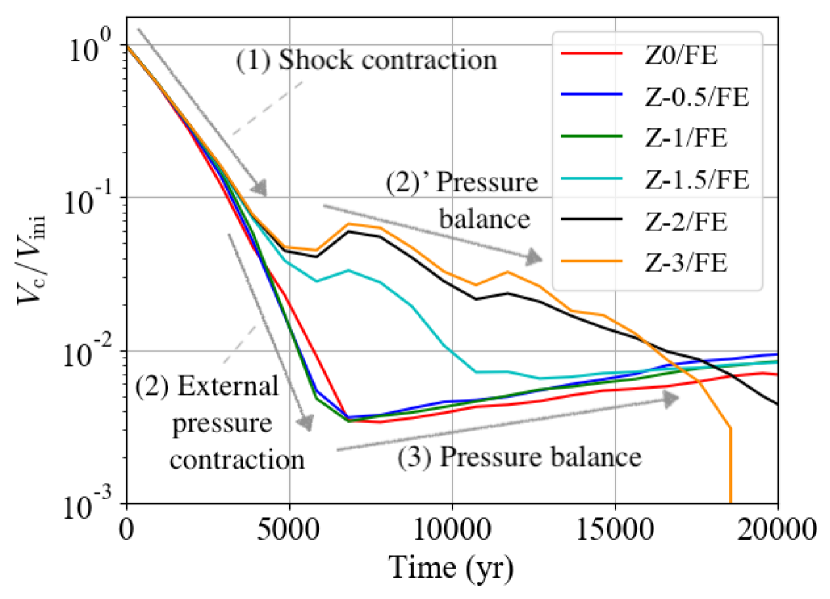
The strong shock with a very large mach number of can heat the post-shock gas to a temperature of . This is sufficiently high for the internal pressure of the clump to equal the external pressure. For clumps, radiative cooling processes are not effective owing to the smaller amount of metals and dust. The internal temperatures reach through the shock compression, yielding comparable pressure between the inside and outside of the clump, and the clumps do not shrink. Hence, the lower metallicity clumps keep larger volumes than in run Z0 even after the implosion phase (the phase (2)’ and (3) in Figure 6).
The cooling time of a clump with is much shorter than the shock propagation time. Thus the neutral region cools quickly to below , allowing the clump to be compressed further until the internal density becomes sufficiently high to match the external pressure.
The thermal energy is lost by line emission and dust-gas collisional heat transfer. In particular, O I cooling and dust-gas collisional cooling are dominant in the neutral region. Since the amounts of oxygen and dust are proportional to metallicity, the specific O I cooling rate and dust-gas collisional cooling rate increase with metallicity. Figure 6 shows the volume of the “dense” region
| (6) |
as a function of time for each metallicity clump. In the early stage of the clump evolution (; the phase (1) in Figure 6), the characteristic time for O I cooling and dust-gas collisional cooling is evaluated as
| (7) |
respectively. Clearly, the cooling time is sufficiently short for the clumps with , compared to . Thus, the temperature of the inner region of the clump with is coupled with the dust temperature of at .
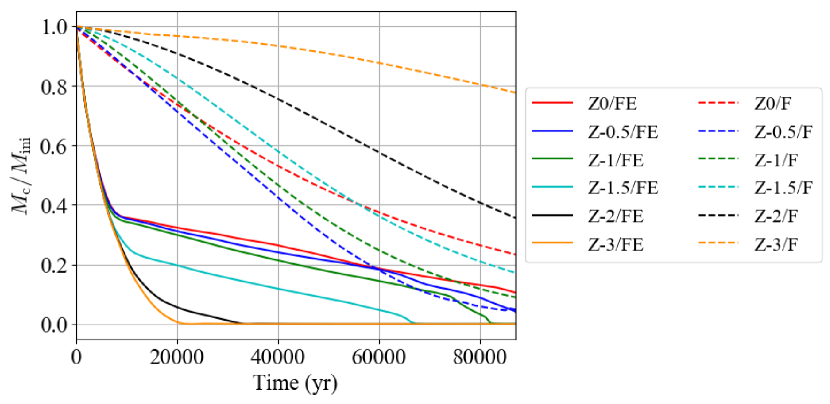
About a half of the initial mass is lost during the implosion phase in the FE runs (solid lines Figure 7; see also the discussions in Section 3.1). In the later phase, the gas is gradually stripped off from the clump surface through EUV photoevaporative flows. The mass loss rate due to EUV photoevaporation is approximated by
| (8) |
Since EUV photons are mainly absorbed by hydrogen atoms, is independent of metallicity. The launch velocity of the EUV-driven photoevaporative winds is of the order of , which is typically , and is also independent of metallicity. Therefore, the metallicity dependence of the mass loss rates is caused by the difference in the area of the evaporating region.
For the clumps with , the compression is the main channel to decrease until the compression phase ends at , forming the cometary structure (Figure 5). After that, the channel is replaced by photoevaporation. The mass loss rate is switched to be a smaller value (the red, blue, and green solid lines in Figure 7). For , the clump volume hardly decreases in the implosion phase because cooling is inefficient to reduce the temperature in the post-shock region. The surface area decreases only slightly owing to photoevaporation even in the implosion phase, in contrast to the clumps with . Thus, the resulting photoevaporation rate remains large, and the clump evaporates in a shorter time than the cases with higher metallicities. For , the cooling time is comparable to in the beginning, but becomes shorter as the density increases by shock-compression (cf. Eq.(7)). The volume of the clump remains relatively large for a long time compared to those with (Figure 6); the amount of mass lost before forming cometary structure is larger for the clump than the clumps (Figure 7). Afterwards, the mass loss rate is largely the same as that of the clump. The clump evolves in an intermediate manner between the higher metallicity () clumps and the lower metallicity () clumps.
We define the lifetime of a clump as the time at which the clump mass decreases to 10 percent of its initial mass.
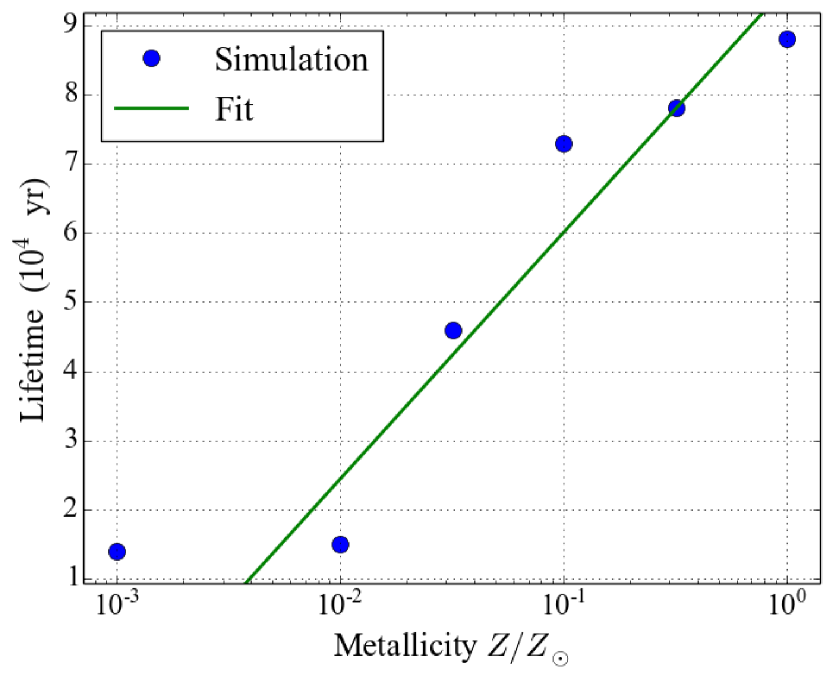
We find that the lifetime decreases with metallicity at in the FE runs. The metallicity dependence is fitted as
| (9) |
The lifetimes is roughly constant at for . Metal-rich clumps illuminated by the EUV radiation have longer lifetimes because of the smaller clump sizes resulting from the efficient cooling and contraction.
In order to separate the effects of FUV and EUV in clump photoevaporation, we have also performed simulations without FUV radiation (Runs E). We have found that the overall evolution is quite similar to the FE runs. We conclude that the mass loss of clumps is mainly driven by EUV photoevaporation at any metallicity, and that FUV radiation does not cause a significant impact on the dynamical evolution of the clumps. These conclusions hold when a clump is illuminated by direct EUV photons, i.e., when the clump is located within an H II region.
3.2.2 FUV-driven photoevaporation
FUV photons can penetrate through to the outer region of an H II region. There, in the so-called photodissociation regions (PDRs), molecules are dissociated and the gas is heated by photoelectric heating. Since PDRs generally have much larger volumes than the inner/central H II regions, there may exist numerous molecular clumps in PDRs. It is thus worth studying clump photoevaporation in such regions. To this end, we perform an additional set of simulations without EUV radiation. We dub these runs with “F”.
With our fiducial configuration (Section 2), a clump with is marginally optically thick to the FUV radiation. FUV photons are attenuated in the hemisphere facing the radiation source, where the gas temperature is . Photoevaporative flows are driven with a typical launch velocity of . Weak shocks are excited inside the clump, and the clump eventually forms a cometary shape in a similar manner to Figure 2.
For , the clumps are effectively optically thin to FUV, and the whole volume of a clump is photo-heated. The FUV photoheating raises the gas temperature to for the clumps with , respectively. The clumps have , where we generalize of Eq.(3) to incorporate metallicity dependence as
| (10) |
The dynamical evolution of the clumps in a PDR is largely consistent with the study of Gorti & Hollenbach (2002). The clumps expand at the velocity of the order of the sound speed, keeping the initial spherical shape. Hydrodynamics shocks are not generated in the low-metallicity clumps.
We find that the mass loss rate is larger for higher metallicity clumps in the range , owing to the higher (the dashed line in Figure 7). The solar-metallicity clump has a smaller evaporation rate than the clumps with sub-solar metallicities, because photoevaporation occurs only in the hemisphere facing the external radiation source. We note also that the small mass loss rate in a very low-metallicity case with is likely caused because we do not include self-gravity in our simulations. We discuss the effect of self-gravity in Section 4.3.
4. Discussions
4.1. Clump Photoevaporation with Lower UV fluxes
We examine possible variations of our results due to different assumptions and to details of the simulation set-up. We first study the effect of UV flux. To this end, we perform simulations with smaller incident UV fluxes of . This also allows us to make comparison with the study of, e.g., Decataldo et al. (2017). We refer to these parameter sets as the intermediate and weak cases, respectively, and differentiate them from the fiducial one.
| Case | Label | ||||
|---|---|---|---|---|---|
| Fiducial | H | ||||
| Intermediate | M | ||||
| Weak | L |
In Table 1, we list the sets of the fluxes and the corresponding luminosities of the external radiation source which is assumed to be located at from the clump surface. Hereafter in this section, we specify a simulation by naming it as, e.g., “Z-0.5/F(M)”. The letter in the parenthesis indicates the labels in Table 1.
The main results are summarized as follows. The overall evolution of the clumps in runs FE(M) and FE(L) is similar to that of FE(H), and the clump lifetime is shorter for lower metallicity clumps. The mass loss rate depends on luminosity (Figure 9).
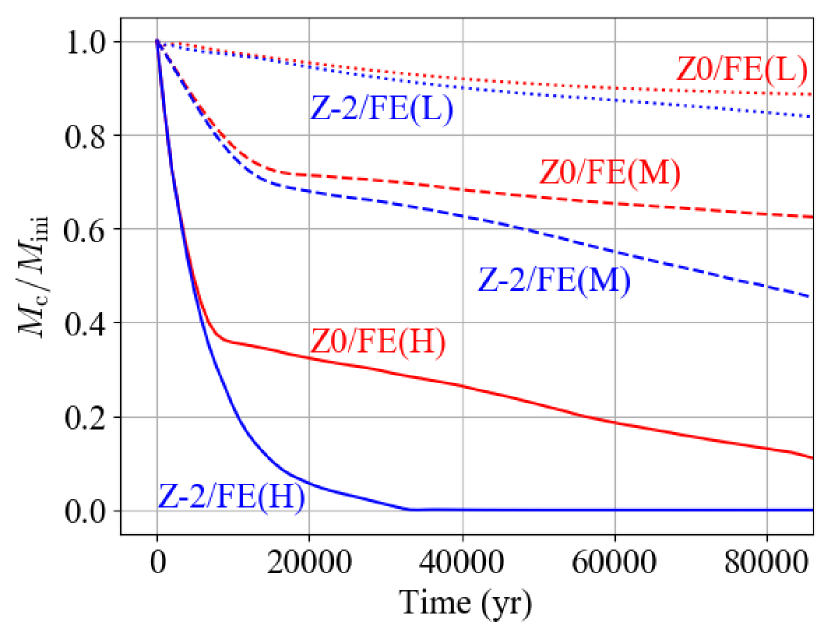
The timescale of the shock-compression phase is proportional to the initial ionization radius , which is set by \ceH2 photodissociation and subsequent H I photoionization. The \ceH2 photodissociation timescale is estimated to be at the clump surface, but it becomes longer in the deeper interior of the clump owing to the self-shielding effect. The self-shielding makes larger to , where is the depth measured from the clump surface; \ceH2 photodissociation is effective only for small \ceH2 column when the FUV flux is low. Since EUV photons ionize the hydrogen atoms produced by photo-dissociation in a sufficiently short time, becomes larger with decreasing the luminosity. Hence, the shock-compression phase lasts longer in the smaller luminosity cases. After the initial phase, the clumps lose mass through EUV photoevaporation with the mass loss rate approximately given by Eq.(8). The launch velocity is , independent of the EUV luminosity. The base density is set by the balance between ionization and recombination. Most of the ionizing photons are absorbed in a small volume near the launch surface, and thus is proportional to . The launching area increases with decreasing the EUV luminosity, because the lower external pressure keeps the clump volume to be large. The luminosity dependence is approximately expressed as during the cometary phase. Thus, mass loss rates due to EUV photoevaporation slightly decrease with EUV luminosity .
Lefloch & Lazareff (1994) investigate the evolution of a neutral globule irradiated by OB stars. They perform 2D hydrodynamics simulations with the assumption that the neutral gas is isothermal. The lifetime of the compressed globule in the cometary phase is analytically derived as
| (11) |
where is the mass of the globule after the compression and is the neutral region temperature. Substituting the typical values of the clumps in our Z-2/FE(H) and Z0/FE(H) runs into Eq.(11), we obtain , respectively. The photoevaporation timescale (= clump lifetime) is then estimated to be for Z0/FE(H) and Z-2/FE(H), respectively. This is in a good agreement with our simulation results (Figure 9). We can apply Eq.(11) to the intermediate and weak flux cases to estimate the clump lifetimes, instead of continueing the simulations until the clumps completely evaporate.
| Label | ||||
|---|---|---|---|---|
| Z0/FE(M) | 0.98 | |||
| Z0/FE(L) | 4.6 | |||
| Z-2/FE(M) | 0.22 | |||
| Z-2/FE(L) | 1.0 |
We measure from the simulation results to estimate the lifetimes of the clumps in Z0/FE(M), Z-2/FE(M), Z0/FE(L), and Z-2/FE(L). The adopted values and the estimated lifetimes are tabulated in Table 2. The resulting lifetime is with the weak luminosity for a clump. The corresponding EUV flux is comparable to that of an early O-type star at away from the clump. Since such a hot star has a lifetime of a few million years (Stahler & Palla, 2005), distant clumps can survive, although they may lose a significant fraction of the initial mass.
The qualitative features of our runs F with the intermediate and low fluxes are again quite similar to that with our fiducial run. The solar-metallicity clumps are marginally optically thick to FUV, and thus photoevaporative flows are excited from the surface of the upstream hemisphere. The flows have velocities comparable to , which is set by FUV heating. Although the lower fluxes yield lower temperatures of the FUV-heated region, the luminosity dependence is not strong; the temperature of the FUV-heated regions varies only by a factor of three, from to for the considered FUV luminosities. Hence, the FUV photoevaporation rate monotonically decreases with FUV flux, and the flux dependence is relatively small (Figure 10), compared to the FE cases.
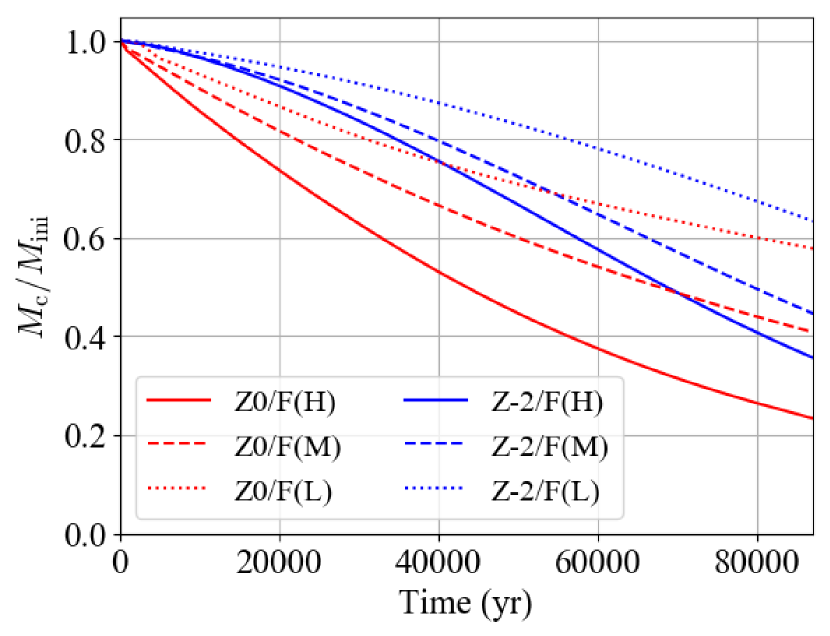
For the lower metallicity , FUV can heat the entire interior of the “optically thin” clumps. Again, FUV heating with a higher luminosity results in a slightly higher internal temperature. Photoevaporative flows are then driven at a higher mass-loss rate in the higher flux cases (Figure 10).
4.2. The Rocket Effect and Star Formation
If a clump moving away from the radiation source survives for a sufficiently long time, it eventually gets out of the H II region and enters the photodissociation region (PDR). After the clump enters the PDR, its lifetime can be extended even longer. In our fiducial model, the Strömgren radius of the central OB star (radiation source) is estimated to be , where is the average density of the H II region, with neglecting dust absorption of EUV. 111 The Strömgren radius can be reduced by owing to dust absorption (Spitzer, 1978). The timescale where the accelerated clump gets out of the H II region is calculated as
| (12) | |||||
| (13) |
Here we have assumed . In order to compare with the lifetime of a photoevaporating clump , we apply the clump model of Eq.(5) to estimate ,
| (14) |
for the solar-metallicity case. Hence, the photoevaporation time is comparable to in our model; clumps could either evaporate before reaching the PDR, or enter the PDR with small masses. Overall, solar-metallicity clumps lose most of the mass while they are in the H II region, and thus star formation can be suppressed around massive stars.
The clumps which survive to go out of the H II region are still exposed to the FUV radiation field in the PDR. Since the compression in the H II region makes an optically-thick dense clump to FUV (), the evolution of the compressed clump would be different from that of the F case presented in Section 4. Gorti & Hollenbach (2002) show that the evolution of clumps with bifurcates, depending on the ratio of the sound speed in the PDR to that in the cold clump . If , a PDR “shell” is produced in the cold clump, where the high pressure drives a shock and compresses the clump. The compression continues until the column density of the clump increases to . If , a thinner PDR shell is produced compared to the case with , and the shell expands at . The thermal pressure inside the shell rapidly declines below the cold clump pressure because of the expansion. The clump expands until the column density decreases to , and then it keeps the constant column density of . The clump shrinks in size because of the mass loss due to photoevaporation, and thus it gets denser to yield the constant column density. If the density could get sufficiently high, star formation would take place in the surviving clump Gorti & Hollenbach (2002).
4.3. Effects of Gravity
Self-gravity is ineffective to prevent clumps from photoevaporating. In fact, at the launching points of EUV-driven flows, the free fall time
| (15) |
is much longer than the crossing time of the photoevaporative flows . This indicates that EUV-driven photoevaporation occurs even if self-gravity were incorporated in our simulations. Several previous studies conclude, by performing three-dimensional simulations with gravity, that the gas self-gravity does not change the overall evolution (Kessel-Deynet & Burkert, 2003; Esquivel & Raga, 2007).
Nevertheless, since the surface area is determined by the internal structure of a clump, incorporating gravity can affect the photoevaporation rate and the clump lifetime. The typical ratio of the gravitational energy to the thermal energy for the clump gas is
| (16) | |||||
| (17) |
The ratio is of the order of for low-metallicity clumps with whose typical size and temperature are and , respectively. Therefore, the lifetimes of the low-metallicity clumps would not be significantly affected even if we take account of gravity (Figure 8). On the other hand, is of the order of unity for the clumps with ; self-gravity may reduce the clump radius. Although the density of the clump center can increase, the base density is physically set by the EUV flux and the recombination reaction coefficient, and thus independent of whether or not the clump contracts gravitationally. Hence, the smaller surface area of the higher metallicity clumps reduced by the effects of gravity allows them to survive even longer.
Regarding FUV photoevaporation, the crossing time for FUV-driven flows are sufficiently shorter than the free fall time for the clumps with ; FUV photoevaporation can be excited even if the gravity is incorporated. The ratio is small for the higher metallicity clumps, and thus the lifetimes of the higher metallicity clumps would not be significantly changed owing to the effects of gravity. In contrast, the crossing time is comparable to the free fall time for the lower-metallicity clumps with . Incorporating gravity would suppress the dispersal of the clumps. Especially for , the clump is likely to lose its mass owing to the neglect of gravity in our model.
In addition to the suppression of photoevaporation, self-gravity is essential for collapse of clumps to form stars inside (radiation-driven collapse; Esquivel & Raga, 2007). The free fall time of the highest density regions in the cometary clumps is of the order of , which is shorter than the lifetimes of clumps with . Star formation may occur in such clumps while the parental clumps evaporate. This directly sets the star formation efficiency around massive stars; it is worth investigating collapse of clumps illuminated by external massive stars in future hydrodynamics simulations.
5. Summary & Conclusion
We have performed a suite of 3D radiation hydrodynamics simulations with nonequilibrium chemistry to study photoevaporation of clumps exposed to UV radiation from massive stars. We have derived the lifetimes of the clumps with a wide variety of metallicities .
In our fiducial model, the clumps exposed to the EUV radiation are shock-compressed for the first . About a half of the initial mass is lost by photoevaporation in this early phase. After the shock-compression and implosion phase ends, the mass loss rate is determined essentially by the surface area of the clump. Since lower-metallicity clumps have higher internal temperatures, their volume remain large and lose mass faster. Consequently, the lifetime is shorter for lower-metallicity clumps in the range of , and scales approximately as . The clumps with keep nearly the same volume after the compression phase, and thus the lifetime is almost independent of metallicity with .
In order to study clump photoevaporation in the photodissociation regions, we have also performed a set of simulations where the EUV radiation is disabled. The simulations (dubbed F runs) show that the clumps with are marginally optically thick to FUV photons, which heat only the hemisphere facing the external radiation source. The clumps with are optically thin to FUV photons because of the reduced amount of dust. Since the FUV heating rate increases with metallicity, clumps with higher metallicity evaporate faster. However, when the metallicity is close to , the photoevaporation rate is actually smaller than the sub-solar clumps because photoevaporative winds are launched only in the hemisphere. The clump lifetimes in the F runs are generally longer () than those in the FE runs.
Clumps are accelerated to move away from the radiation source by the rocket effect. For a clump with , the typical velocity is when EUV field is present, while the velocity is much smaller to be without EUV radiation. For low-metallicity () clumps exposed to EUV, the receding velocity is . The larger launch area of the lower metallicity clump yields a more efficient acceleration.
In the local, present-day star-forming regions with , star formation can be promoted in the H II region around massive stars because of the density enhancement due to the radiation-driven implosion. On the other hand, in the PDRs, FUV-heated clumps expand and thus star formation can be likely delayed or suppressed. In low-metallicity environments with , the clumps are not compressed in the H II region, and have short lifetimes. Hence star formation can be significantly suppressed. In the PDRs, inefficient FUV heating allows clumps to survive for a longer time than the free fall time.
Acknowledgement
We thank Takashi Hosokawa, Kazumi Kashiyama, Anastasia Fialkov, and Tilman Hartwig for fruitful discussions and insightful comments on the paper. RN has been supported by the Grant-in-aid for the Japan Society for the Promotion of Science (16J03534) and by Advanced Leading Graduate Course for Photon Science (ALPS) of the University of Tokyo. All the numerical computations were carried out on Cray XC50 at Center for Computational Astrophysics, National Astronomical Observatory of Japan.
References
- Bakes & Tielens (1994) Bakes, E. L. O., & Tielens, A. G. G. M. 1994, ApJ, 427, 822
- Bally et al. (1987) Bally, J., Langer, W. D., Stark, A. A., & Wilson, R. W. 1987, ApJ, 312, L45
- Barbá et al. (2003) Barbá, R. H., Rubio, M., Roth, M. R., & García, J. 2003, AJ, 125, 1940
- Bertoldi (1989) Bertoldi, F. 1989, ApJ, 346, 735
- Bertoldi & McKee (1990) Bertoldi, F., & McKee, C. F. 1990, ApJ, 354, 529
- Bertoldi & McKee (1992) —. 1992, ApJ, 395, 140
- Blitz (1993) Blitz, L. 1993, in Protostars and Planets III, ed. E. H. Levy & J. I. Lunine, 125–161
- Blitz & Shu (1980) Blitz, L., & Shu, F. H. 1980, ApJ, 238, 148
- Bok & Reilly (1947) Bok, B. J., & Reilly, E. F. 1947, ApJ, 105, 255
- Bonnor (1956) Bonnor, W. B. 1956, MNRAS, 116, 351
- Cantó et al. (1998) Cantó, J., Raga, A., Steffen, W., & Shapiro, P. R. 1998, ApJ, 502, 695
- Contursi et al. (2000) Contursi, A., et al. 2000, A&A, 362, 310
- Decataldo et al. (2017) Decataldo, D., Ferrara, A., Pallottini, A., Gallerani, S., & Vallini, L. 2017, MNRAS, 471, 4476
- Deharveng et al. (2008) Deharveng, L., Lefloch, B., Kurtz, S., Nadeau, D., Pomarès, M., Caplan, J., & Zavagno, A. 2008, A&A, 482, 585
- Deharveng et al. (2005) Deharveng, L., Zavagno, A., & Caplan, J. 2005, A&A, 433, 565
- Draine (2011) Draine, B. T. 2011, Physics of the Interstellar and Intergalactic Medium
- Duvert et al. (1990) Duvert, G., Cernicharo, J., Bachiller, R., & Gomez-Gonzalez, J. 1990, A&A, 233, 190
- Ebert (1955) Ebert, R. 1955, ZAp, 37, 217
- Elmegreen & Lada (1977) Elmegreen, B. G., & Lada, C. J. 1977, ApJ, 214, 725
- Esquivel & Raga (2007) Esquivel, A., & Raga, A. C. 2007, MNRAS, 377, 383
- Evans (1999) Evans, II, N. J. 1999, ARA&A, 37, 311
- González et al. (2005) González, R. F., Raga, A. C., & Steffen, W. 2005, Rev. Mexicana Astron. Astrofis., 41, 443
- Gorti & Hollenbach (2002) Gorti, U., & Hollenbach, D. 2002, ApJ, 573, 215
- Johnstone et al. (1998) Johnstone, D., Hollenbach, D., & Bally, J. 1998, ApJ, 499, 758
- Kessel-Deynet & Burkert (2003) Kessel-Deynet, O., & Burkert, A. 2003, MNRAS, 338, 545
- Klein et al. (1980) Klein, R. I., Sandford, II, M. T., & Whitaker, R. W. 1980, Space Sci. Rev., 27, 275
- Lefloch & Lazareff (1994) Lefloch, B., & Lazareff, B. 1994, A&A, 289, 559
- López-Martín et al. (2001) López-Martín, L., Raga, A. C., Mellema, G., Henney, W. J., & Cantó, J. 2001, ApJ, 548, 288
- Megeath et al. (1996) Megeath, S. T., Cox, P., Bronfman, L., & Roelfsema, P. R. 1996, A&A, 305, 296
- Mellema et al. (1998) Mellema, G., Raga, A. C., Canto, J., Lundqvist, P., Balick, B., Steffen, W., & Noriega-Crespo, A. 1998, A&A, 331, 335
- Mignone et al. (2007) Mignone, A., Bodo, G., Massaglia, S., Matsakos, T., Tesileanu, O., Zanni, C., & Ferrari, A. 2007, ApJS, 170, 228
- Minamidani et al. (2011) Minamidani, T., et al. 2011, AJ, 141, 73
- Miura et al. (2010) Miura, R., et al. 2010, ApJ, 724, 1120
- Muñoz et al. (2007) Muñoz, D. J., Mardones, D., Garay, G., Rebolledo, D., Brooks, K., & Bontemps, S. 2007, ApJ, 668, 906
- Nakatani et al. (2018a) Nakatani, R., Hosokawa, T., Yoshida, N., Nomura, H., & Kuiper, R. 2018a, ApJ, 857, 57
- Nakatani et al. (2018b) —. 2018b, ApJ, 865, 75
- O’Dell et al. (2002) O’Dell, C. R., Balick, B., Hajian, A. R., Henney, W. J., & Burkert, A. 2002, AJ, 123, 3329
- O’dell & Handron (1996) O’dell, C. R., & Handron, K. D. 1996, AJ, 111, 1630
- O’Dell et al. (2007) O’Dell, C. R., Henney, W. J., & Ferland, G. J. 2007, AJ, 133, 2343
- Oort & Spitzer (1955) Oort, J. H., & Spitzer, Jr., L. 1955, ApJ, 121, 6
- Pavlakis et al. (2001) Pavlakis, K. G., Williams, R. J. R., Dyson, J. E., Falle, S. A. E. G., & Hartquist, T. W. 2001, A&A, 369, 263
- Raga et al. (2009) Raga, A. C., Henney, W., Vasconcelos, J., Cerqueira, A., Esquivel, A., & Rodríguez-González, A. 2009, MNRAS, 392, 964
- Raga et al. (2005) Raga, A. C., Steffen, W., & González, R. F. 2005, Rev. Mexicana Astron. Astrofis., 41, 45
- Reipurth (1983) Reipurth, B. 1983, A&A, 117, 183
- Rubio et al. (2000) Rubio, M., Contursi, A., Lequeux, J., Probst, R., Barbá, R., Boulanger, F., Cesarsky, D., & Maoli, R. 2000, A&A, 359, 1139
- Sandford et al. (1982) Sandford, II, M. T., Whitaker, R. W., & Klein, R. I. 1982, ApJ, 260, 183
- Sandford et al. (1984) —. 1984, ApJ, 282, 178
- Shapiro et al. (2004) Shapiro, P. R., Iliev, I. T., & Raga, A. C. 2004, MNRAS, 348, 753
- Spitzer (1978) Spitzer, L. 1978, Physical processes in the interstellar medium
- Stahler & Palla (2005) Stahler, S. W., & Palla, F. 2005, The Formation of Stars, 865
- Störzer & Hollenbach (1999) Störzer, H., & Hollenbach, D. 1999, ApJ, 515, 669
- Sugitani et al. (1991) Sugitani, K., Fukui, Y., & Ogura, K. 1991, ApJS, 77, 59
- Sugitani & Ogura (1994) Sugitani, K., & Ogura, K. 1994, ApJS, 92, 163
- Sugitani et al. (1995) Sugitani, K., Tamura, M., & Ogura, K. 1995, ApJ, 455, L39
- Tenorio-Tagle (1977) Tenorio-Tagle, G. 1977, A&A, 54, 517
- Williams et al. (2000) Williams, J. P., Blitz, L., & McKee, C. F. 2000, Protostars and Planets IV, 97
- Williams et al. (2001) Williams, R. J. R., Ward-Thompson, D., & Whitworth, A. P. 2001, MNRAS, 327, 788